1. Introduction
Airport operation rules are restricted by the requirements of aviation agencies such as the European Aviation Safety Agency (EASA) or the Polish Air Navigation Services Agency (PANSA). They are standardised, for example, in the document “Easy Access Rules for Aerodromes” with regard to good practices that increase aviation safety [
1,
2]. The fulfilment of these requirements determines the construction of devices to the fast and reliable control of each of the essential devices in an airport. One of the important aspects in this field is the correct navigation lighting of airports, especially on runways, where the most critical flight operations take place.
In-pavement lamps for navigation lighting are part of the visual aid system for flight operations. Lamps assist the pilot in setting the course and distance to the runway, determining the approach path in the last phase of landing before touchdown, and supporting the taxiing process. The in-pavement lamps are the lights recessed in the airport areas, designed so as not to hinder the movement of the aircraft on them. When fixed in the workplace, they protrude from 6.3 to 10 mm above the ground. Their reflectors are elements that direct the light beam directly from the bulb vertically upward with the angle of incidence of the light outside caused by a prism made of a high-quality borosilicate glass resistant to high temperature [
3,
4].
The in-pavement navigation lamps are equipped with light sources that have a limited lifetime [
5,
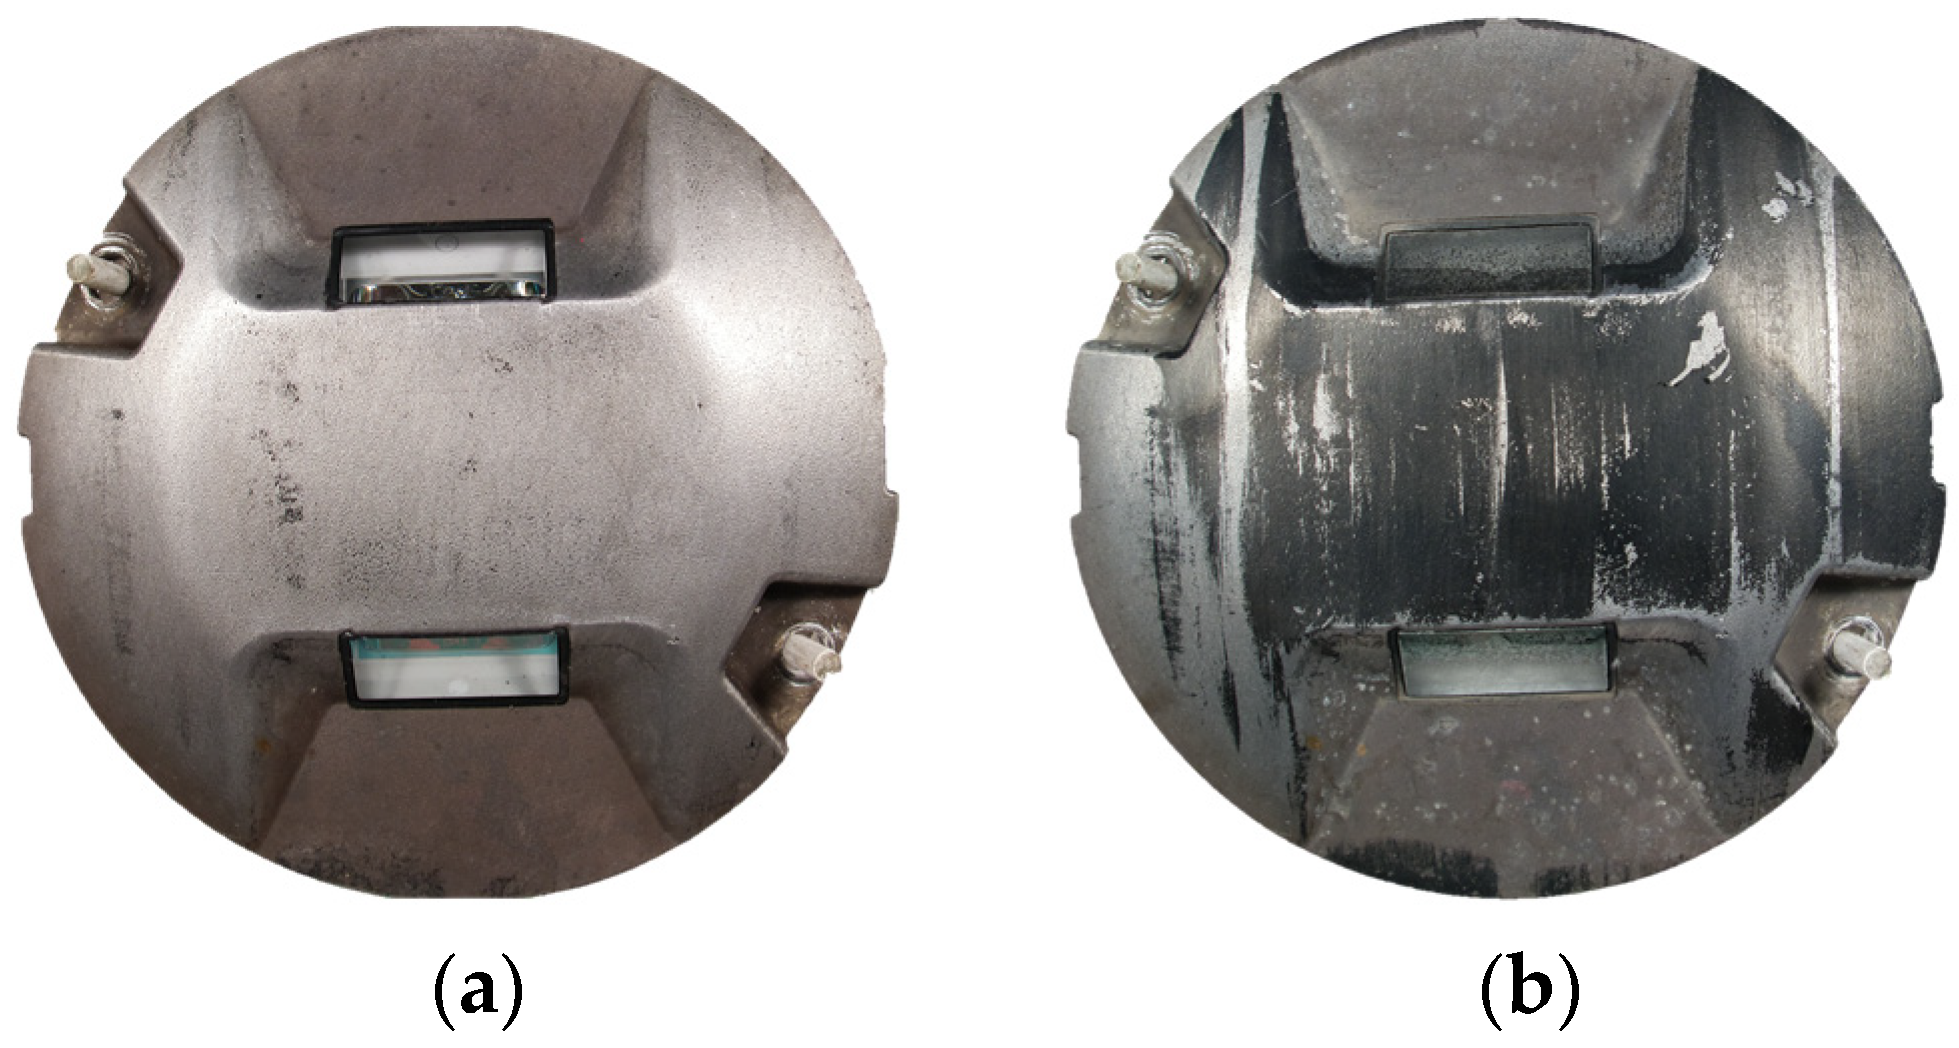
6]. The decrease in the luminous efficiency of lamps is also caused by contamination of the prisms (e.g., by sticking rubber from aircraft tires). It is also influenced by weather conditions because heavy snowfall requires the usage of snowplows, which, with their metal brushes, damage lamp housings and chips and scratch their prisms (
Figure 1).
The visually good-looking quality prism can, in some cases, significantly reduce the intensity of illumination. Testing the correct angular distribution of lighting is, therefore, an important issue in increasing the safety of air operations. In consequence, accurate measurements allow for the reduction of unnecessary replacements of costly lamp parts.
Airport lamp parameters are specified in the EASA standard in the chapter “Colours for aeronautical ground lights, markings, signs, and panels” [
1]. This document defines the luminous intensity of individual light points, taking into account angular relationships.
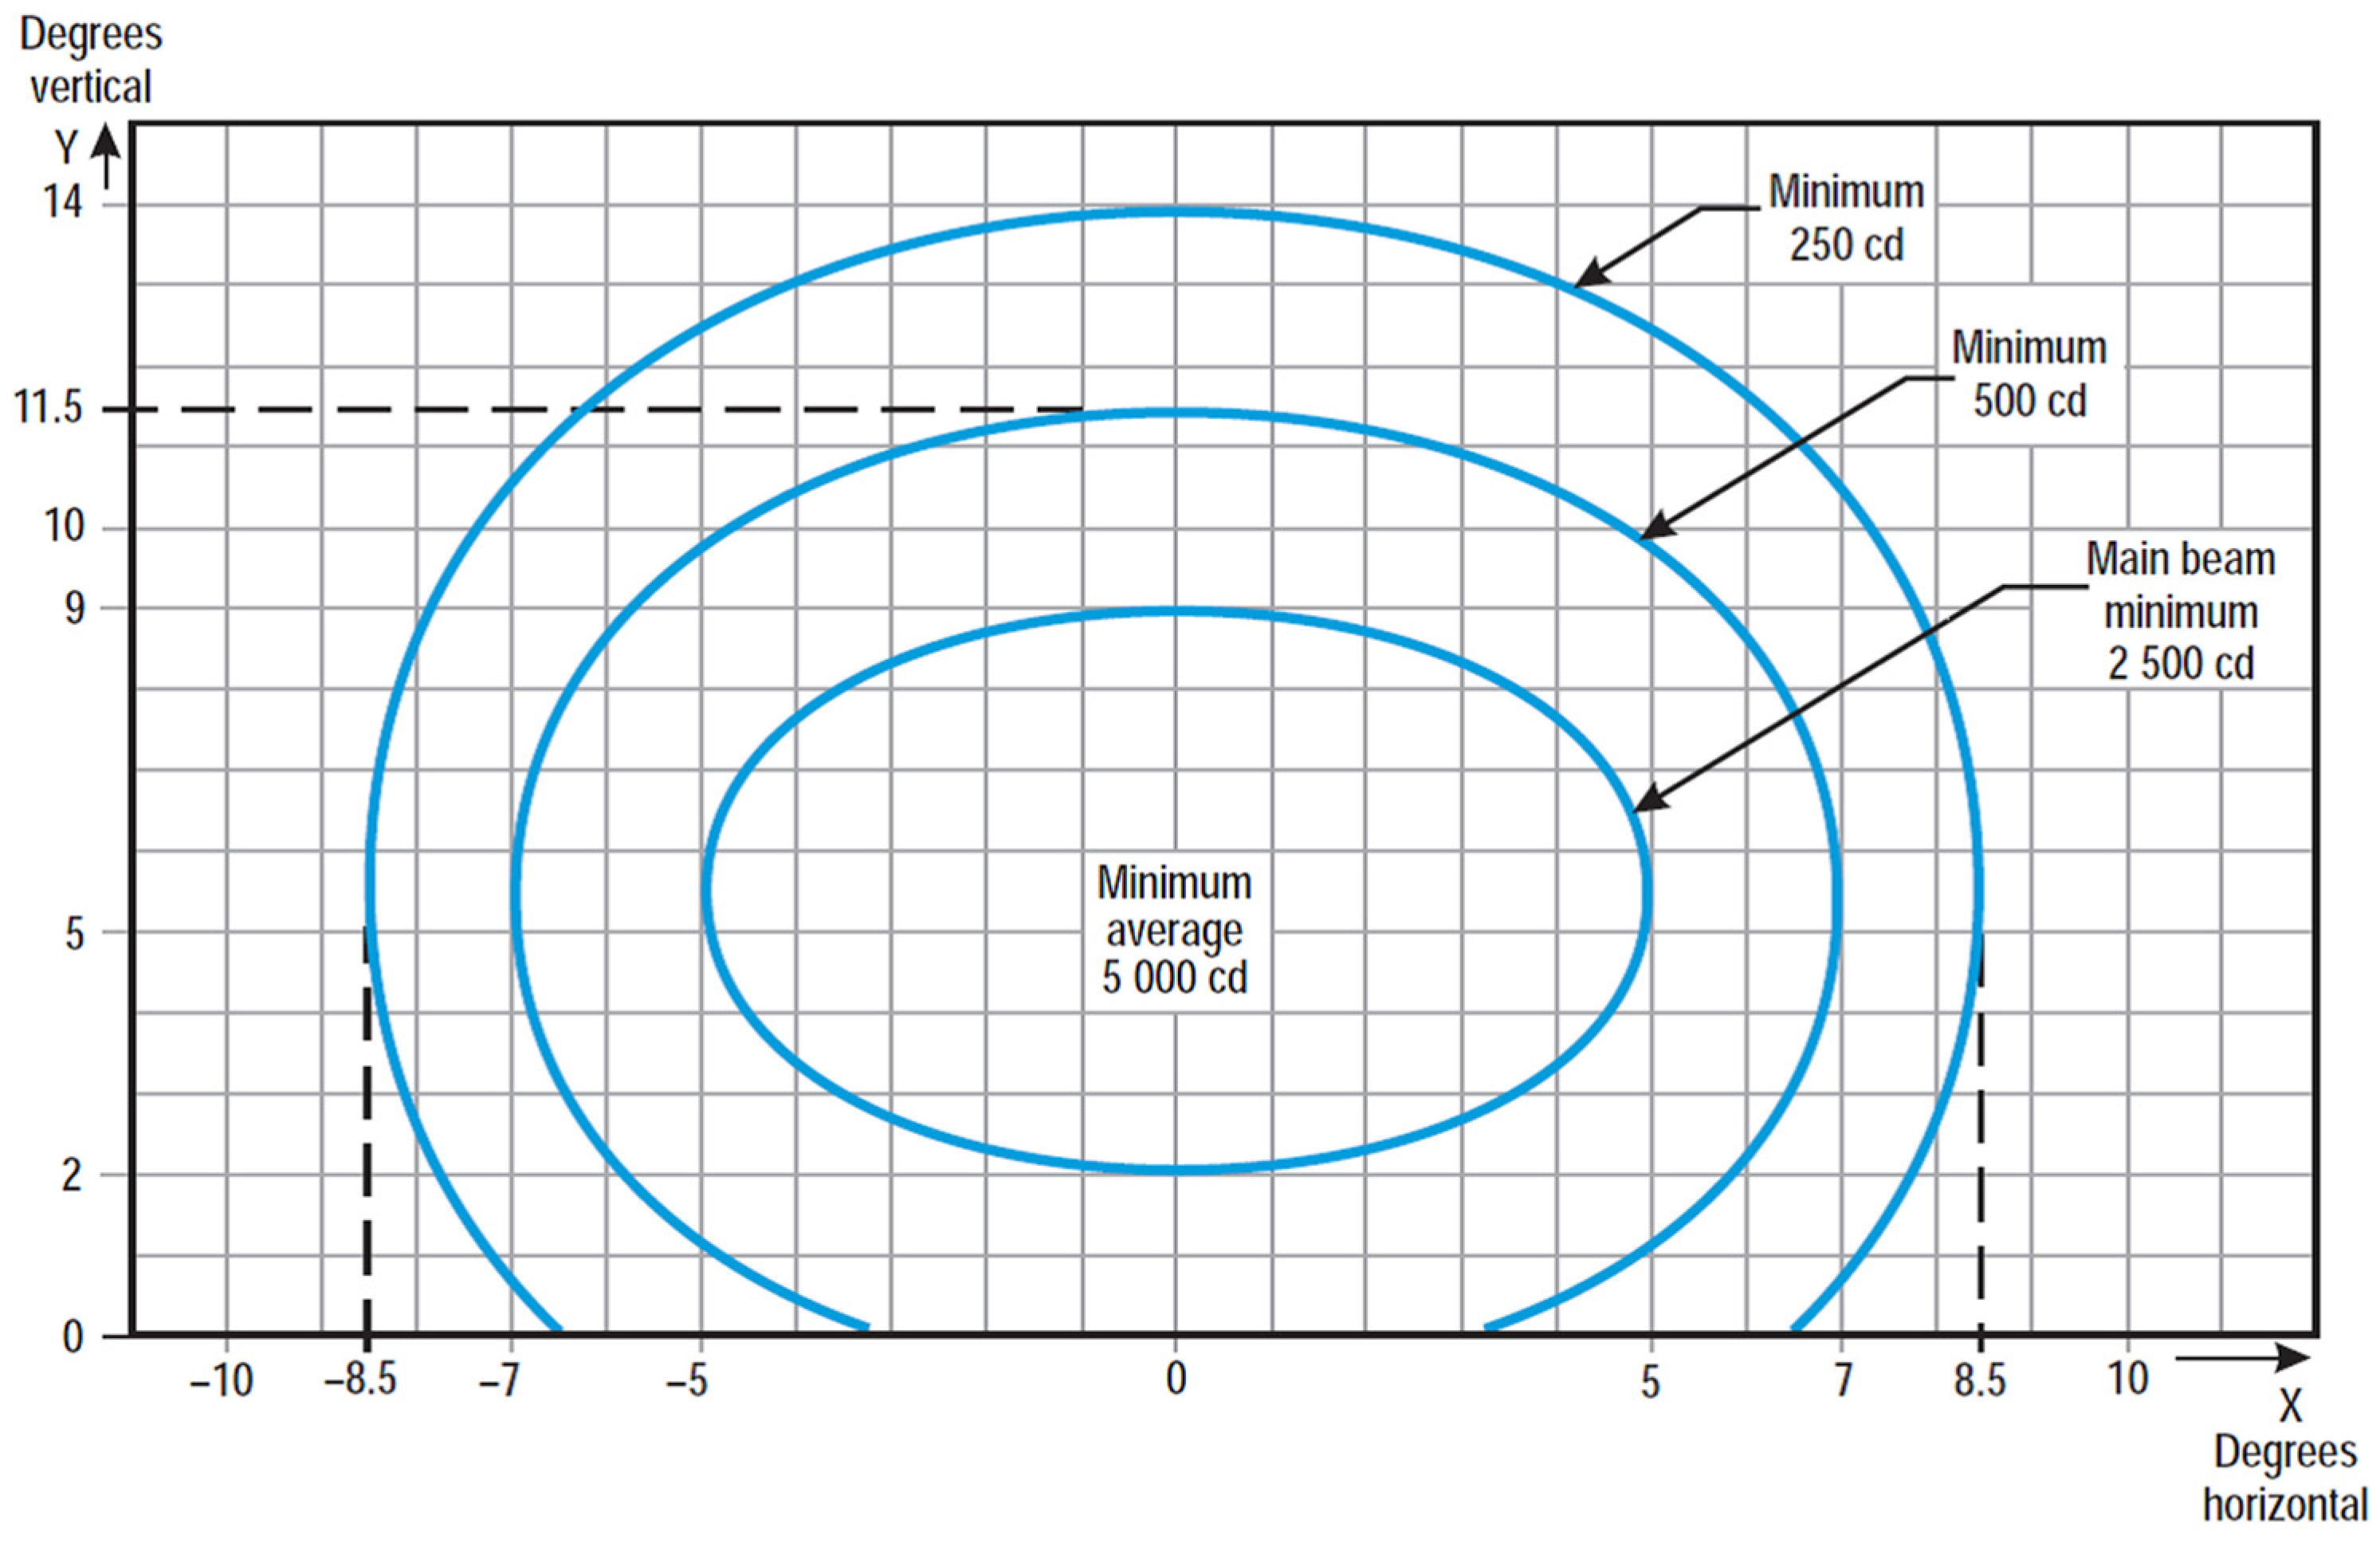
Figure 2 shows an exemplary distribution for a touchdown zone lamp.
The isocandela diagrams vary depending on the type of lamp and the colour of the light. Standards also define the requirements for the airport category. One of the most important parameters is the minimum luminous intensity for the main beam, which, depending on the type of lamp, is within different angular ranges. It should be noted that stricter guidelines are provided for the runway than for the rest of the airport, which is justified by the safety requirements of air operations.
The daily inspection of the correct operation of the navigation lighting is carried out by a visual check by the airport maintenance team. If a specific lamp malfunctions, it is disassembled and replaced by another one or is turned off according to the applicable standards [
1]. Periodic assessments of the correct operation of airport lamps are carried out using special commercially available devices designed for specific airports. For this purpose, various types of measurement devices [
7,
8] are built and designed, which are capable of measuring the luminous efficiency of each lamp, evaluating its wear, and then classifying it as suitable for further use or replacement.
The main contributions of this paper are as follows. The authors proposed a concept of automatic photometric control of in-pavement navigation lighting lamps with the use of a device that allows quick laboratory verification and evaluation of the angular distribution and luminous intensity of the light beam. The quality of the measurement light sensor was investigated by comparison with a certified luxmeter. On the basis of collected measurement data, it was possible to propose polynomial correction equations to eliminate the influence of spectral characteristics of the sensor and obtain proper results. The authors conducted a comprehensive study of the in-pavement touchdown zone and the runway centerline white and red lamps as part of scientific research carried out in cooperation with the Poznań-Ławica Airport.
2. Existing Methods and Devices for Airport Lamps Photometric Assessment
The quality of airport lamps can be assessed stationary (using a light goniophotometer) [
9,
10,
11], mobile (using illuminance measurement platform vehicles [
7,
12,
13,
14,
15]), or with drones [
16]. Mobile measurements allow us to obtain global information about lamps that may have limited efficiency. Such systems allow for the examination of both in-pavement and elevated lamps in the airport areas.
The operating conditions of the device for assessing the quality of operation of in-pavement airport lamps are strictly dependent on the operation of the airport. The priority, apart from the obvious safety assurance, is the efficient conduct of air operations. Therefore, a device enabling the testing of in-pavement airport lamps on runways and taxiways must first and foremost quickly measure several hundred lamps. At a medium size airport, breaks allowing for measurements range from 5 to 15 min, depending on the time of day. Therefore, in order to carry out an accurate measurement of luminous intensity distribution, it would be necessary to close the airport for several days to carry out the measurements for every lamp. Therefore, for ongoing on-field control, devices are used to roughly assess the quality of in-pavement airport lamps. A thorough examination of luminous intensity is, therefore, possible in laboratory dark room conditions, where after unmounting the lamp, its angular characteristics can be checked.
One of the well-known mobile systems is the patented DALMAS device (DeWiTec Airfield Light Mobile Analyzing System) manufactured by DeWiTec GmbH [
13]. It is a single-axle trailer dedicated to measuring the intensity of lighting in in-pavement and edge airport lamps [
12].
Another mobile system is PAC
2 V5, developed by FB Technology [
14]. Like its predecessor, it is designed to test both in-pavement and elevated navigation lights. However, an important difference is that this device requires a special rack to be mounted in the front or back of the measuring car.
The second device proposed conceptually by FB Technology is MARC ONE [
15]. Its main assumption is an autonomous mobile robot that will independently perform a photometric inspection of navigation lighting and additionally will have the ability to check the correctness of screws that secure the in-pavement lamps. The device will be able to measure in night conditions only because the measuring matrix does not have its own darkroom.
A similar device is proposed in [
7], which is a mobile measurement platform to test the quality of operation in airport lamps. The device has been designed as a trailer that can be towed by an airport service car. Measurement fast speed illuminance sensors like those presented in [
17] can be built as matrices placed on the bottom of the platform under a rubber cover.
There are also known drone-based systems to test airport lamps [
16]. The authors of this paper proposed a photometric method that uses a measurement matrix suspended from a drone, reducing dependence on airport infrastructure conditions. The instrument consists of two subsystems: the data acquisition unit and the master station, which communicate wirelessly. However, this system has many other limitations, such as inspecting at large intervals from flight operations and being dependent on weather conditions.
There are also three solutions that allow stationary testing of navigation lighting lamps and for making measurements related to angular relationships with high accuracy. One of them can be used stationary under real-life conditions without disassembly of the lamp from its housing—PAC MATRIX [
9] and the next two are intended for use in laboratories—PAC LAB II [
10] and PTS-200 [
11].
The first is the PAC MATRIX system, manufactured by FB Technology. It is a stationary matrix (array) intended for photometric measurements of airport lamps of various types [
9]. The board is equipped with 17 measuring sensors and requires manual setting in airport areas before each measurement process, which is an advantage because the lamp does not have to be taken out of the housing, but it is also a disadvantage because the measurement time is quite long. The rules for the placement of sensors on the measuring board comply with the applicable standards of angular dependencies presented by EASA [
1]. The measurements obtained are values taken in lux and need to be processed by software to obtain the final result of the average luminous intensity in candelas, as in the regulations [
1].
PAC LAB II is a stationary system offered by FB Technology [
10] as a complement to the previously mentioned PAC
2 V5 mobile system [
14]. The laboratory measurement of airport lamps allows for obtaining an average illuminance value converted to candela. In addition, the maximum and minimum of the main beam are calculated and presented to the user. During measurement, the lamp rotates on the special housing, and the sensors remain in the same position. The final report consists of an isocandela diagram of the light beam providing International Civil Aviation Organization (ICAO) grid points and compliance with the ICAO maintenance level.
Another commercial system used to measure the luminous intensity of airport lamps is the PTS-200 device from Airsafe Airport Equipment Co. [
11]. The lamp is placed in a special housing so that it can rotate both vertically and horizontally, and the light sensor should be manually mounted on a tripod. During a luminous intensity test, it is also possible to conduct chromaticity measurements. Similarly to the previously described systems, it is designed for most types of in-pavement and elevated lighting and automatically generates test reports with comparison to ICAO standards [
11].
3. Proposed Concept of a Measurement System for Airport Lamps Evaluation
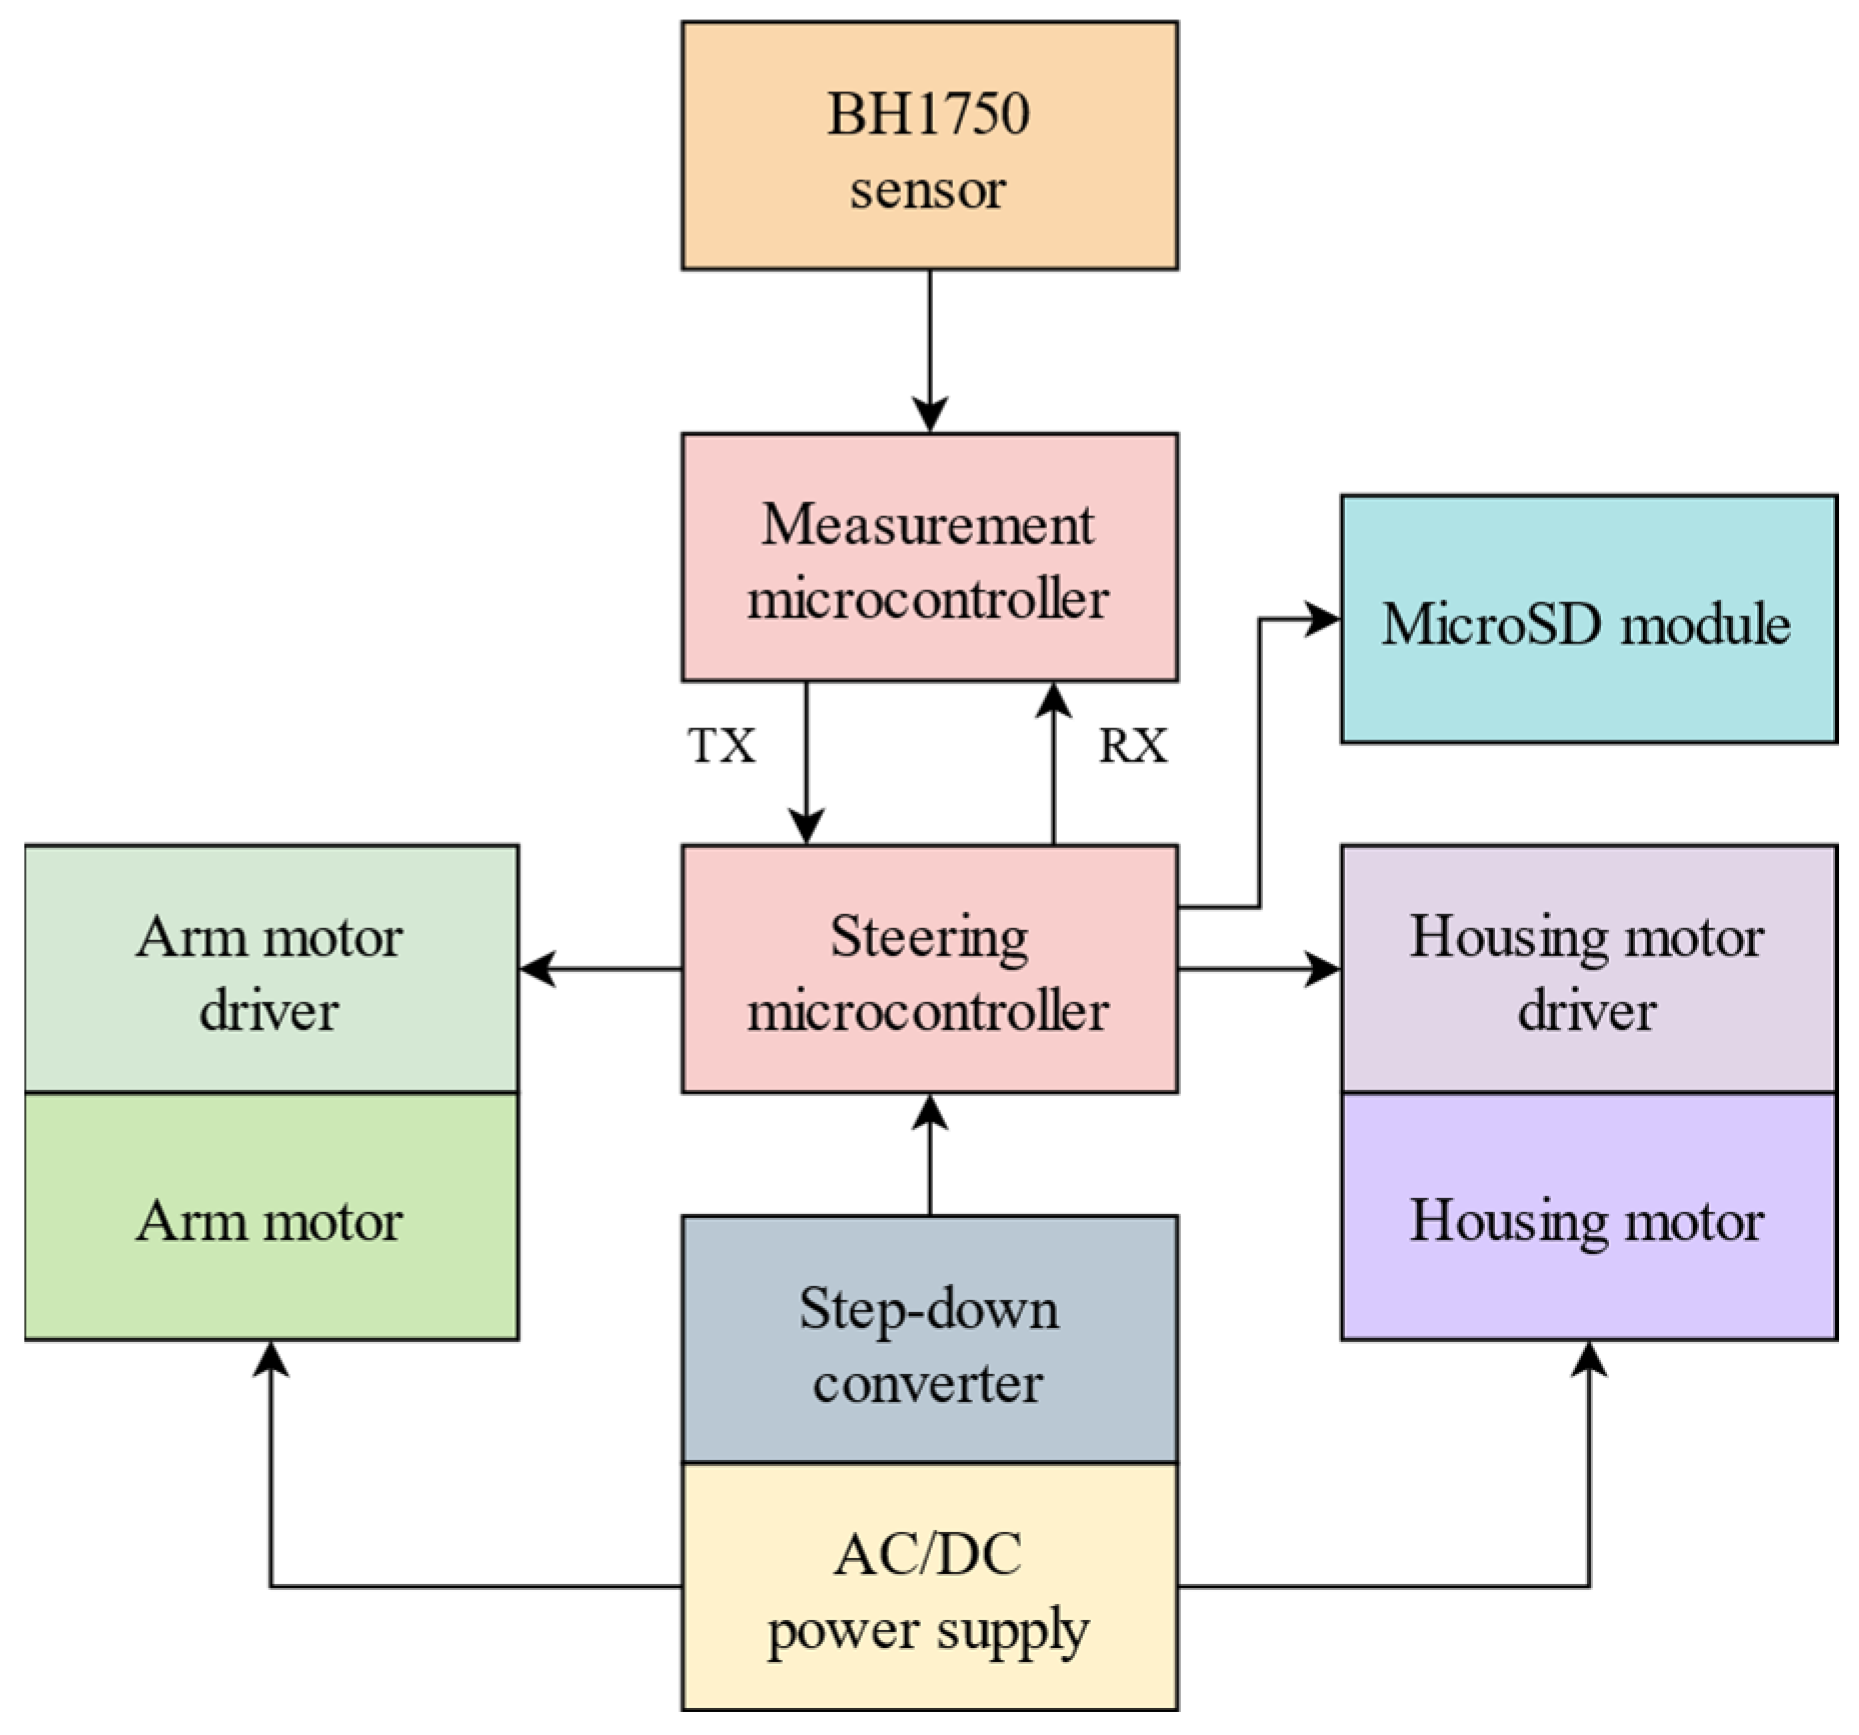
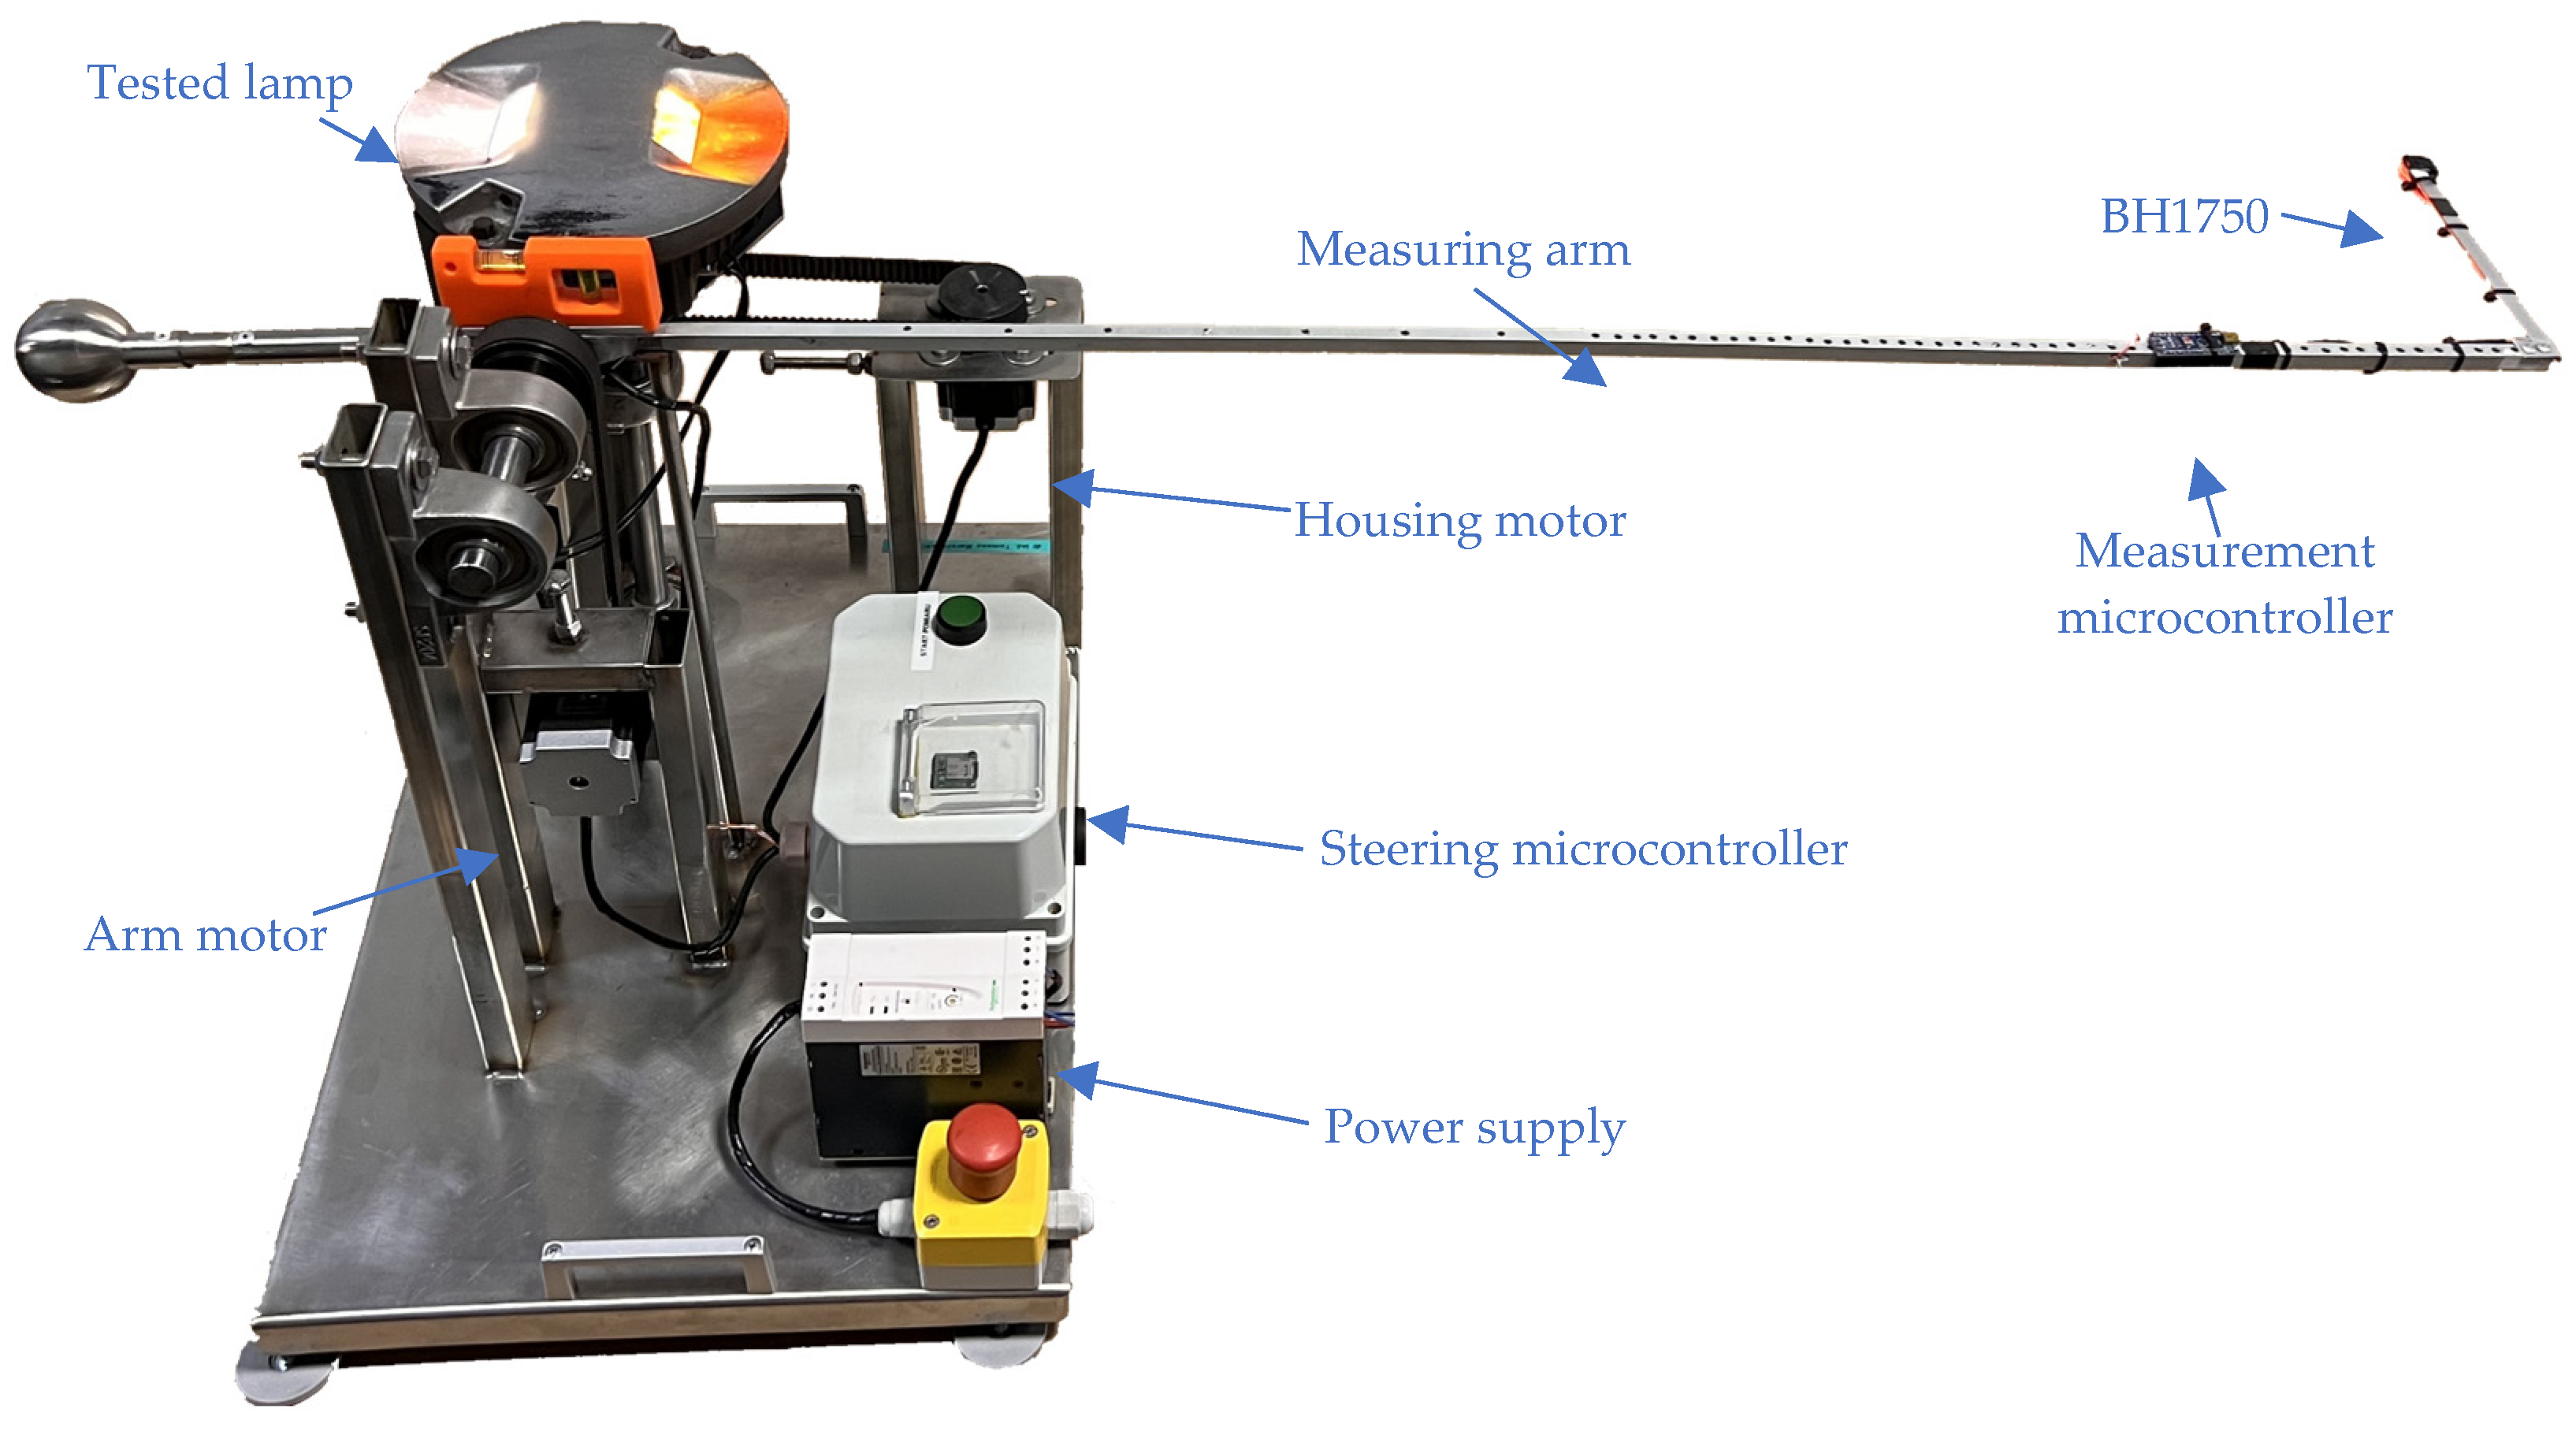
The distribution of luminous intensity was measured using a specially prepared device. The device consists of a turntable to which the tested lamp is attached and a rotating arm with a light sensor attached at the end. It works by taking a series of measurements for different angular positions of the table and the arm, which result in the values of luminous intensity at points forming a grid on the spherical surface around the light source. The block scheme of the proposed device for automatic measurements of the airport lamps is presented in
Figure 3.
The measuring element of the system is the BH1750 illuminance sensor. Its spectral characteristic requires additional correction to the measurement range of the tested lamps. Such an analysis is presented in
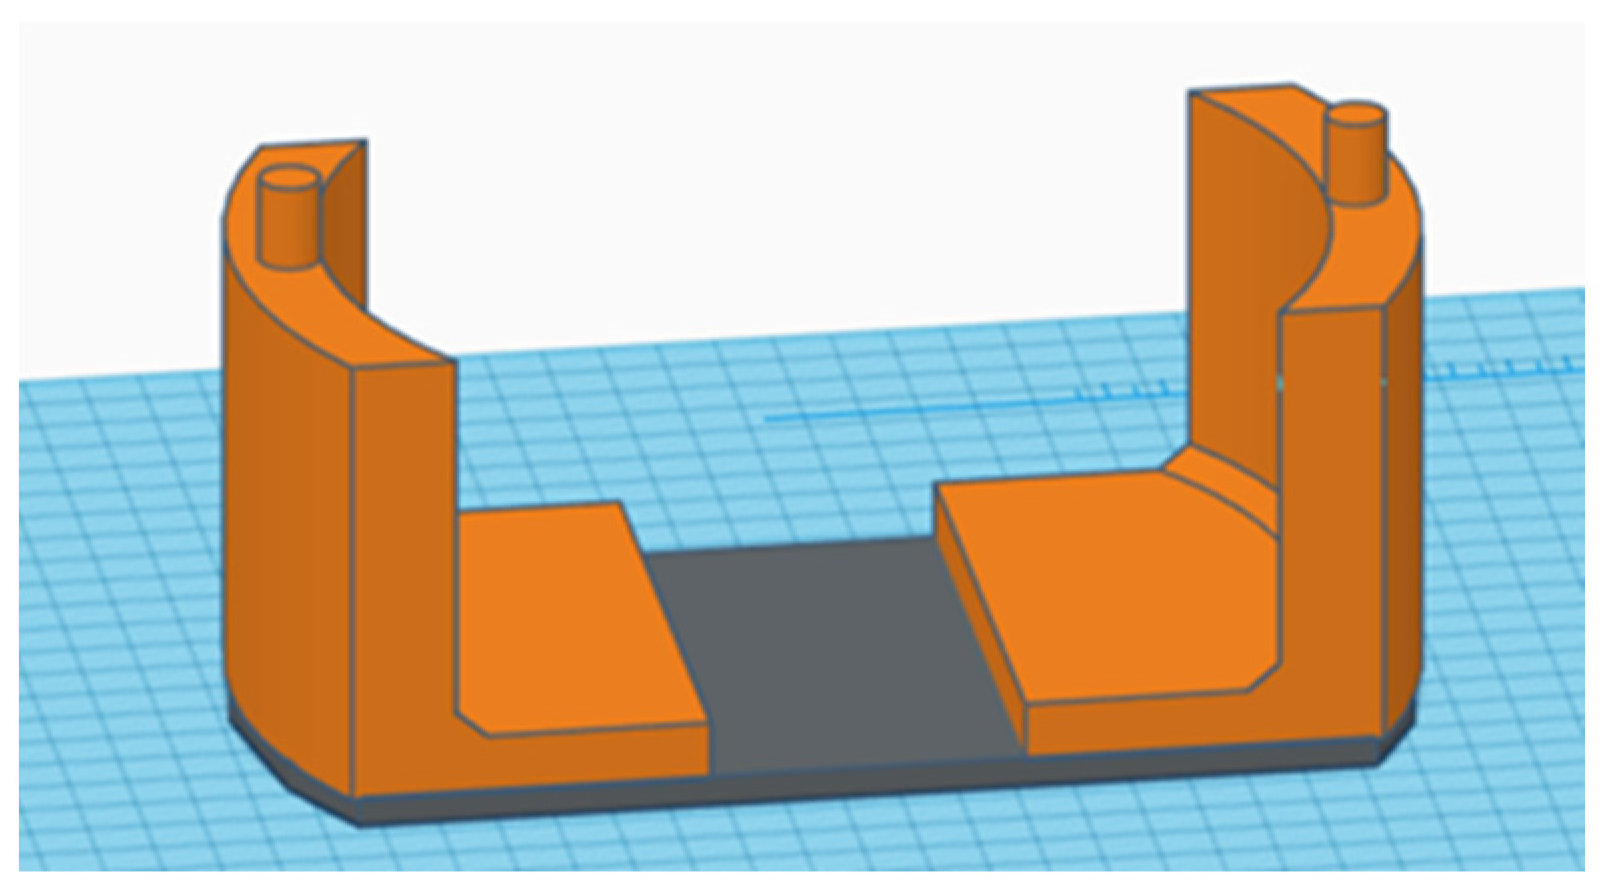
Section 5. The sensor is placed on the arm, and its position is changed in the vertical plane by a stepper motor. The second stepper motor provides the automatic rotation of the lamp on the horizontal axis. The 3D-printed mounting socket (
Figure 4) holds the lamp steady in one position using two pins placed in original screw holes. The JK57HS56-2504 stepper motors [
18] used in the measuring device use belt transmissions and a dedicated TB6600 controller.
The TB6600 controller is a driver for two- and four-phase stepper motors. This controller works with a wide range of engines [
19]. It supports step and direction control (step/dir), and to ensure noise immunity, all control inputs are optoisolated [
20].
The BH1750 illuminance sensor, stepper motor control, and data archiving measurement processes are supervised by the use of two ATmega328P microcontrollers. Measurement results are saved to the MicroSD card. Based on the set of measurements in the range of angles −16 to +16 degrees horizontally and 0 to 14 degrees vertically, the so-called heatmaps are obtained, as presented in
Section 6. The device view with the key elements is shown in
Figure 5.
4. Photometric Quality Investigation of a Light Sensor
During the measurement of the photometric characteristics of an airport lamp, according to the recommendations, the luminous intensity of the main light beam should be checked. For this task, sensor modules based on a photodiode can be used [
17], from which the results obtained, after appropriate conversion, can indicate the value of the luminous intensity. Sensors of this type are resistant to the influence of the angle of incidence of light on the obtained intensity values [
21], and they show very good dynamic properties during measurements [
22].
The GY-302 module that uses the BH1750 sensor for measurement has a range from 1 to 65,535 lx, and the shape of its spectral response corresponds to the shape of the spectral response of the human eye. It is a digital module with a resolution of 16 bits and communicates via the I
2C interface. It can operate in three different modes, which differ from each other in measurement time and resolution (
Table 1).
It should be noted that the measurement times in individual modes may differ from those listed in
Table 1 because, with the increase in the size of the transmitted measurement value, the time is proportionally extended. In the case of measurements in H-Resolution modes, according to the documentation, the measurement time (integration time) is long enough to eliminate the influence of 50/60 Hz noise [
23].
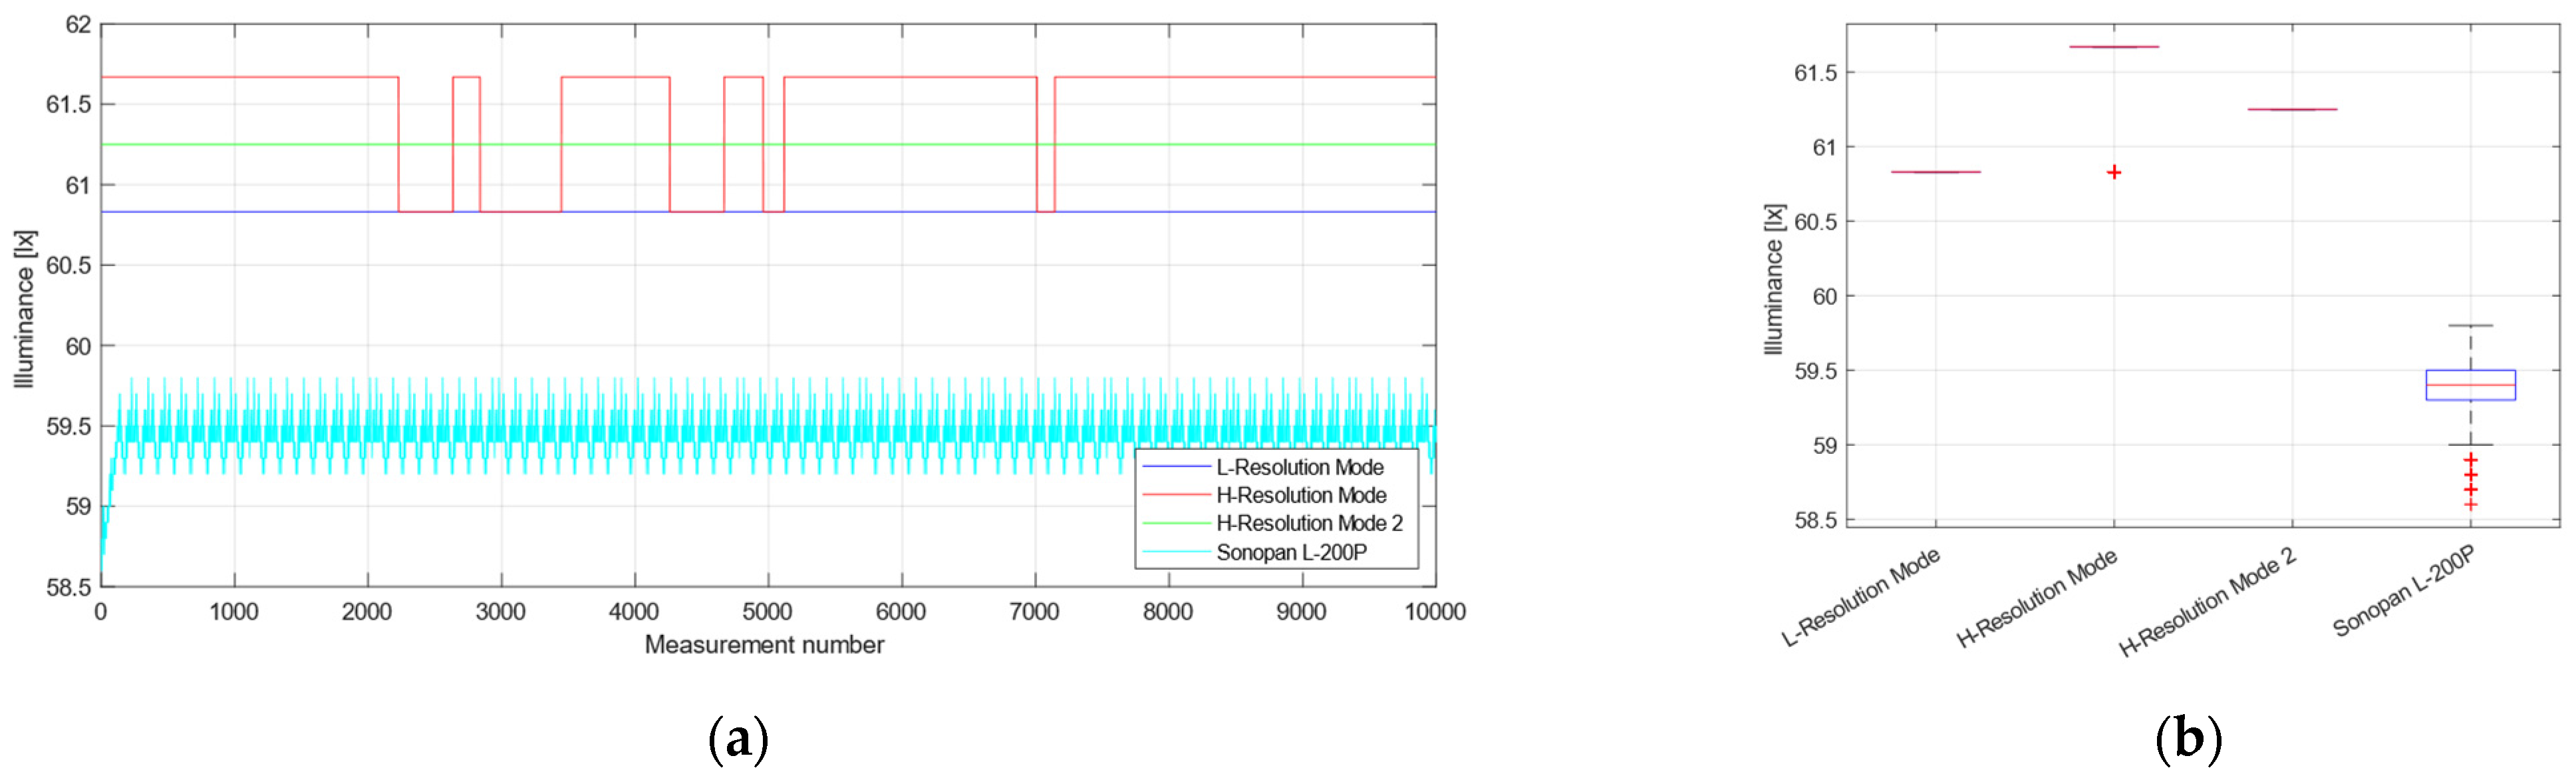
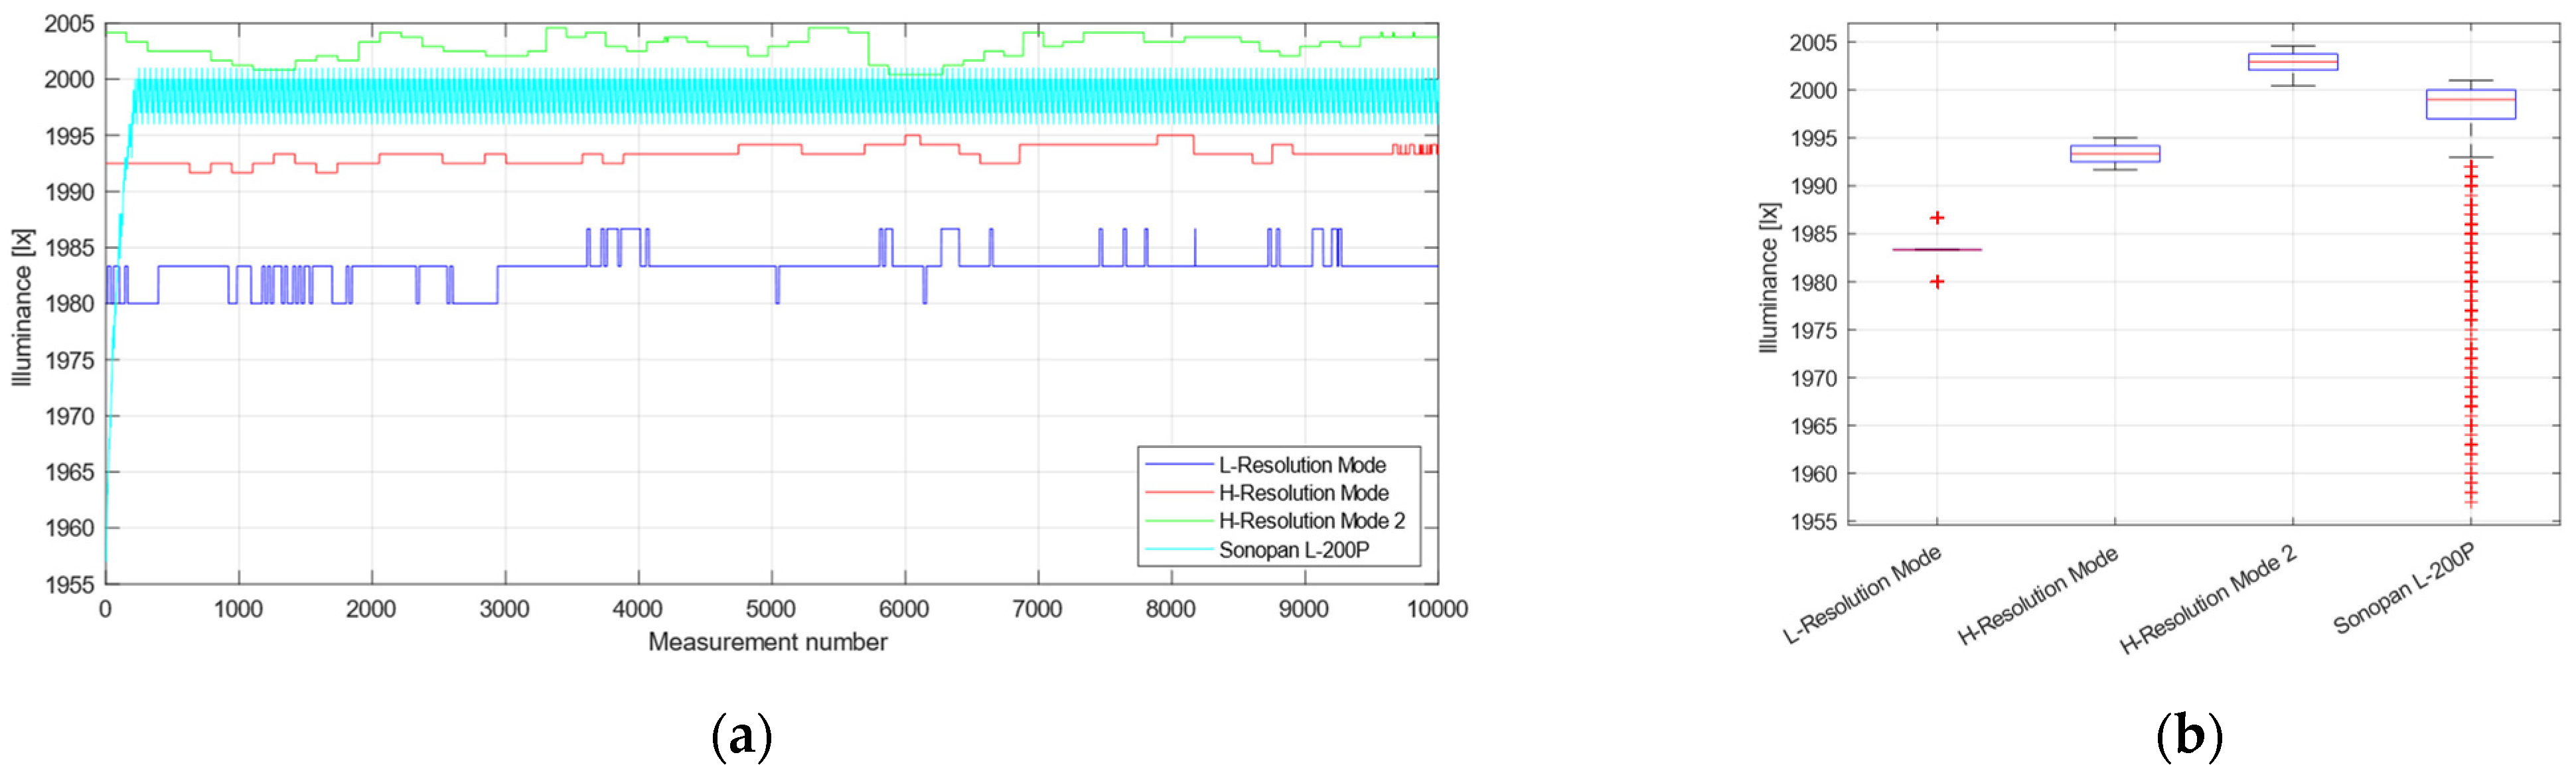
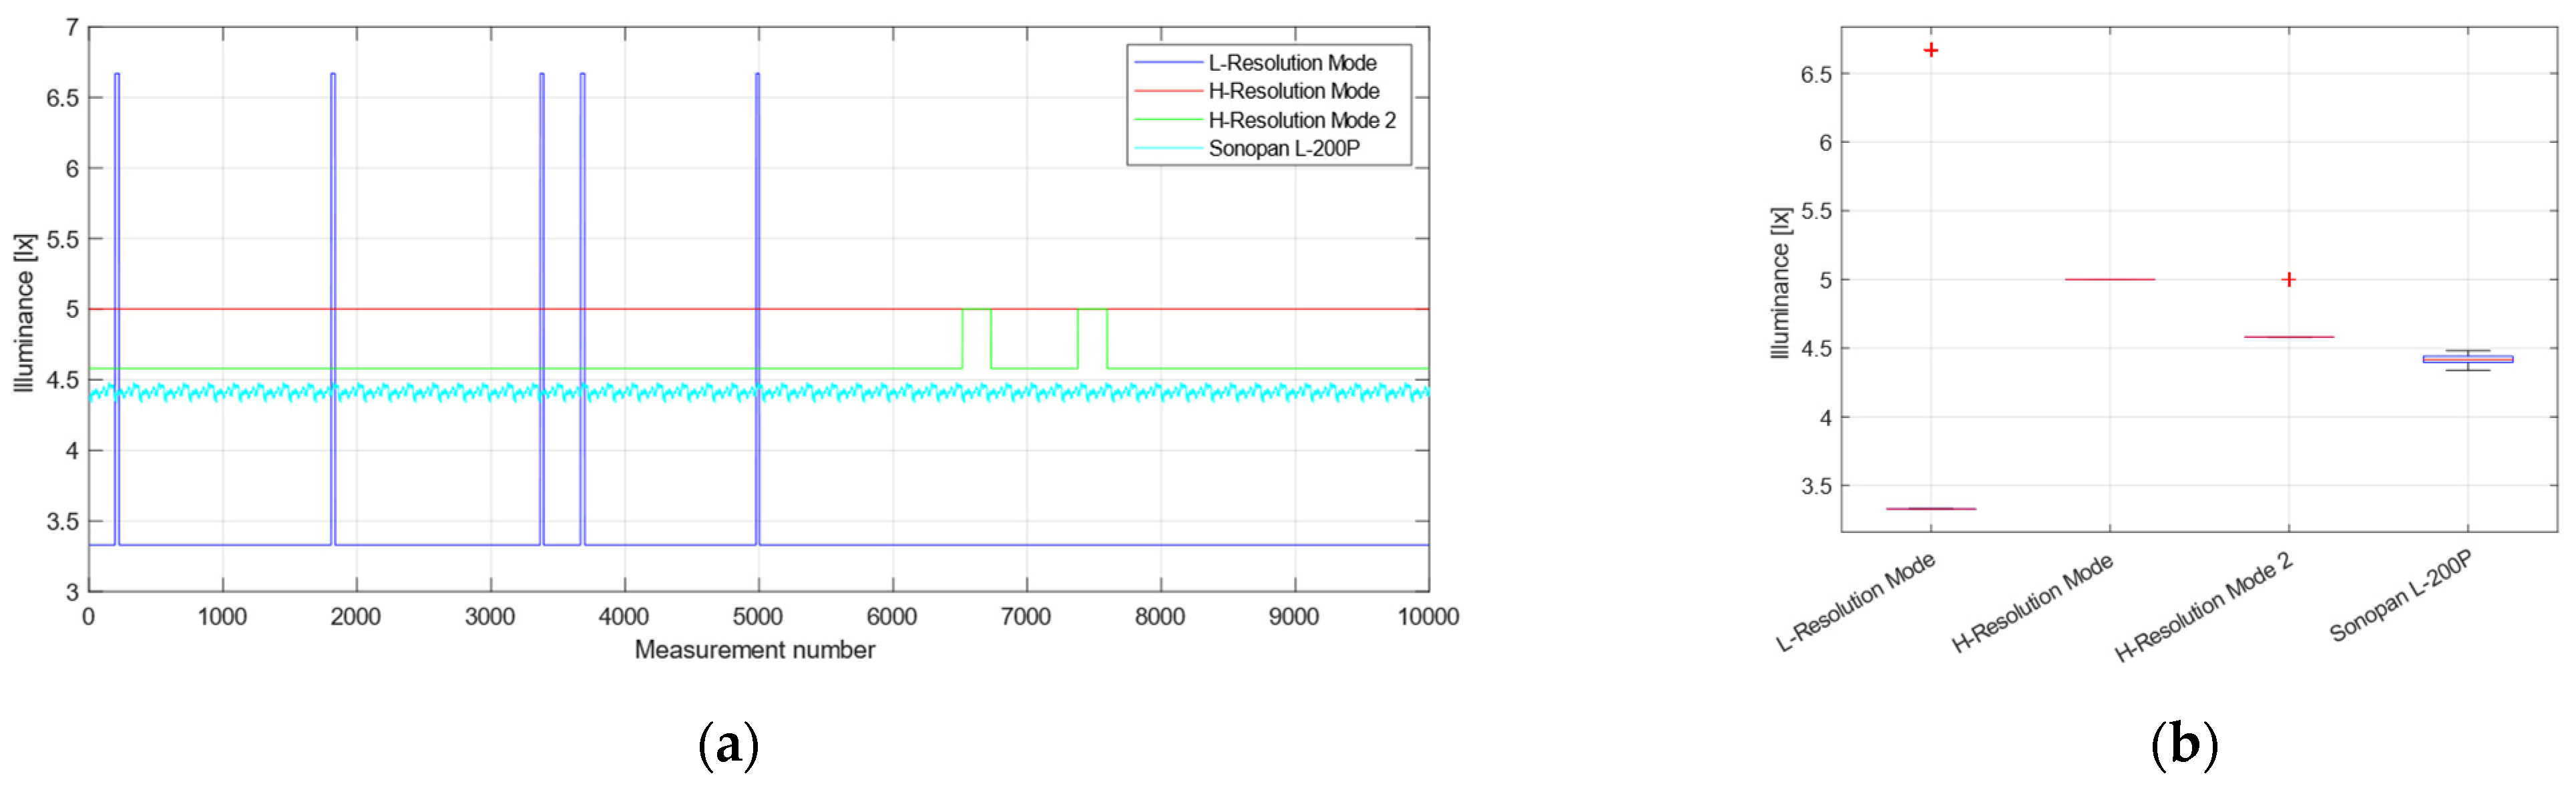
An important aspect in the context of measuring the photometric characteristics of airport lamps is the repeatability of the obtained measurement results. The navigation lighting lamps operate in five different modes, differing from each other in the illuminance level, which is regulated by changes in the current intensity of the power supply system; the exact values are presented in
Section 5. Taking these conditions into account, an experiment was carried out consisting of making a series of 10,000 measurements using the GY-302 module with a BH1750 sensor for the brand new touchdown zone lamp IDM 4671, changing its power modes and changing the illuminance sensor operating modes. To ensure that the obtained values of illuminance are correct, a Sonopan L-200P certified luxmeter measurement was also taken [
24]. The photometric distance was assumed to be consistent with the length of the goniometer arm, which is 1 m.
Figure 6a,
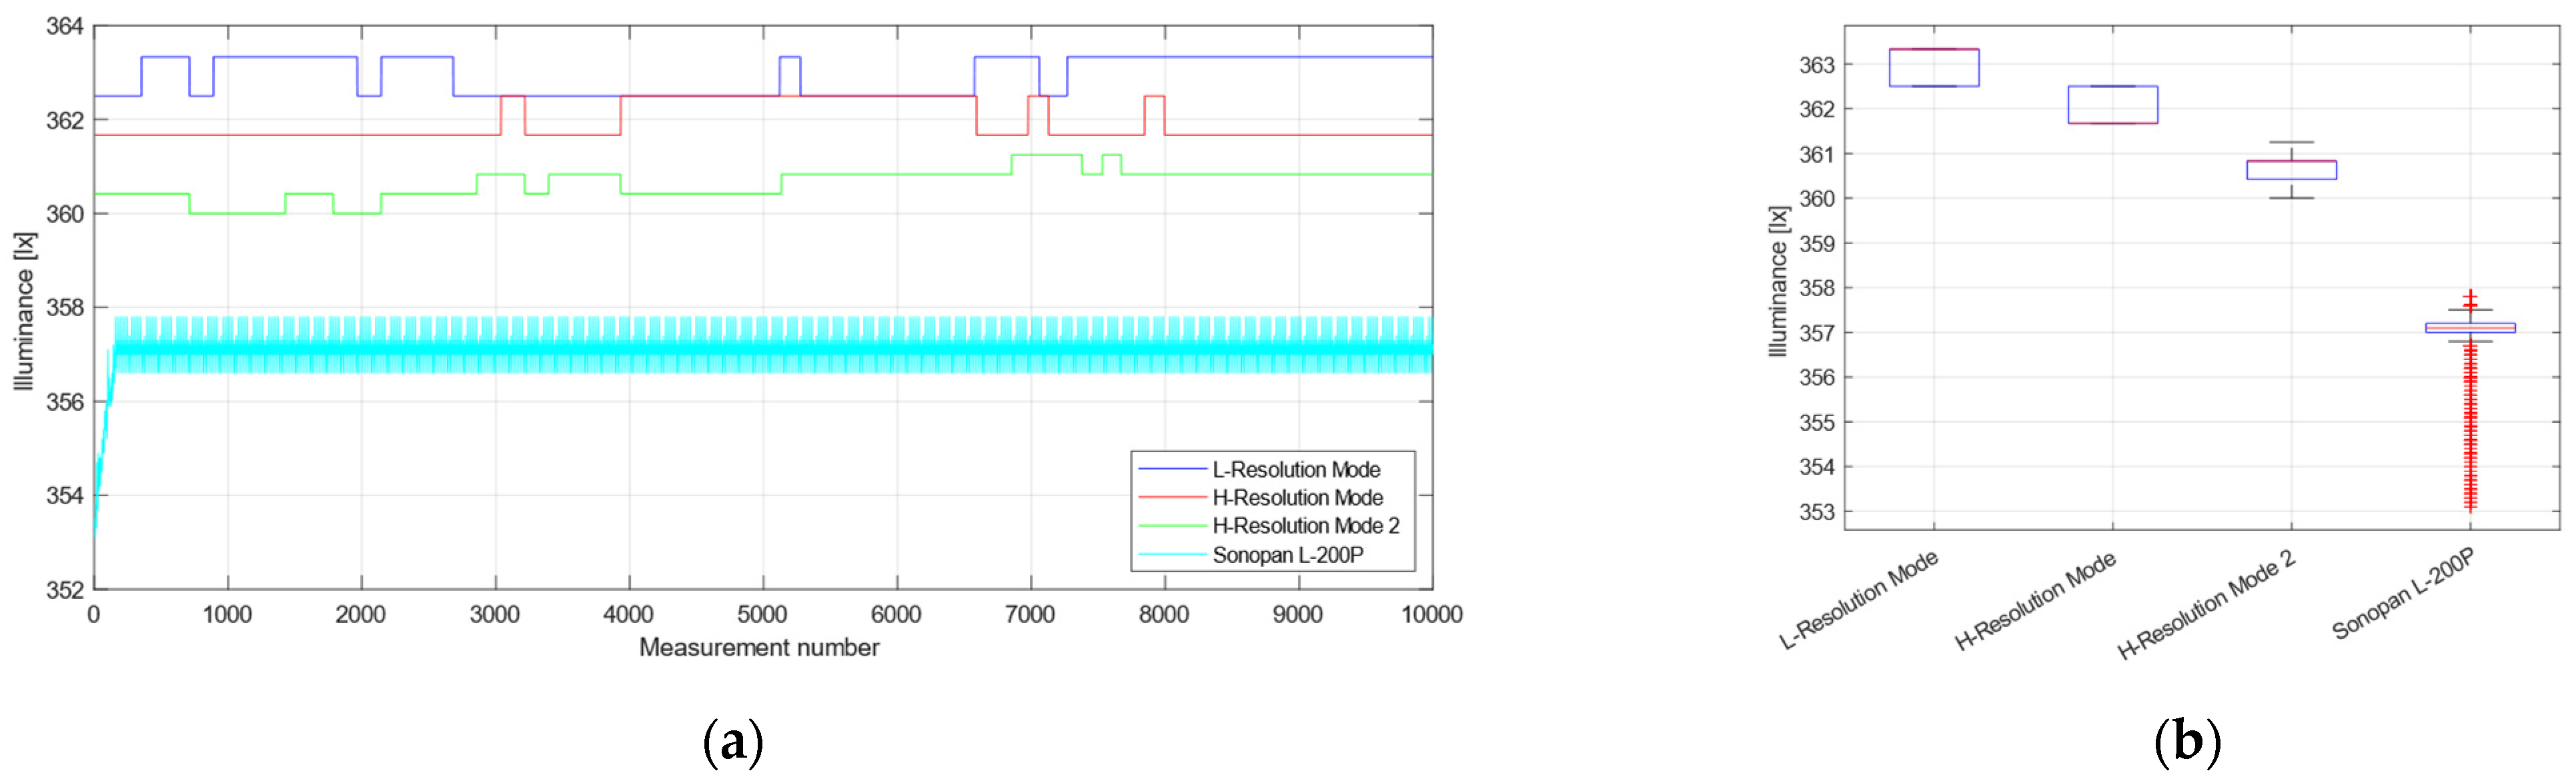
Figure 7a,
Figure 8a,
Figure 9a and
Figure 10a show the measured illuminance values and statistical box plots in
Figure 6b,
Figure 7b,
Figure 8b,
Figure 9b and
Figure 10b.
For the measurements taken, the mean value, median, and standard deviation were determined, as shown in
Table 2.
The analysis of the data in
Table 2 shows that with the increase in the value of the lamp supply current, and thus the measured value of the illuminance, the differences in the mean value of the measurement between the various operating modes of the sensor also increase. The median values also have a similar tendency; however, the values of the standard deviation remain at a level which, in relation to the measured illuminance, constitutes its small percentage in the case of high current intensities. It should be noted that the test of airport lamps, in accordance with the recommendations, is carried out only at the highest illuminance level and then after it has been warmed up for 15 min. This is caused by the imperfections of the halogen bulbs used here. The use of such a light source may also have influenced the fluctuations of the obtained values under the conditions of the conducted experiment. Taking into account the standards that must be met by the lamps of the in-pavement navigation lighting, the error values of several lux may be neglected, and in order to obtain a more accurate final measurement, the proposed solution is to perform several measurements and calculate their mean value.
For airport lamp evaluation, where the required threshold in the case of TDZ lamps is 1250 cd [
1], high measurement precision is not required; thus, the measurement process can be significantly accelerated approximately 7.5 times by using L-Resolution mode (cf.
Table 1).
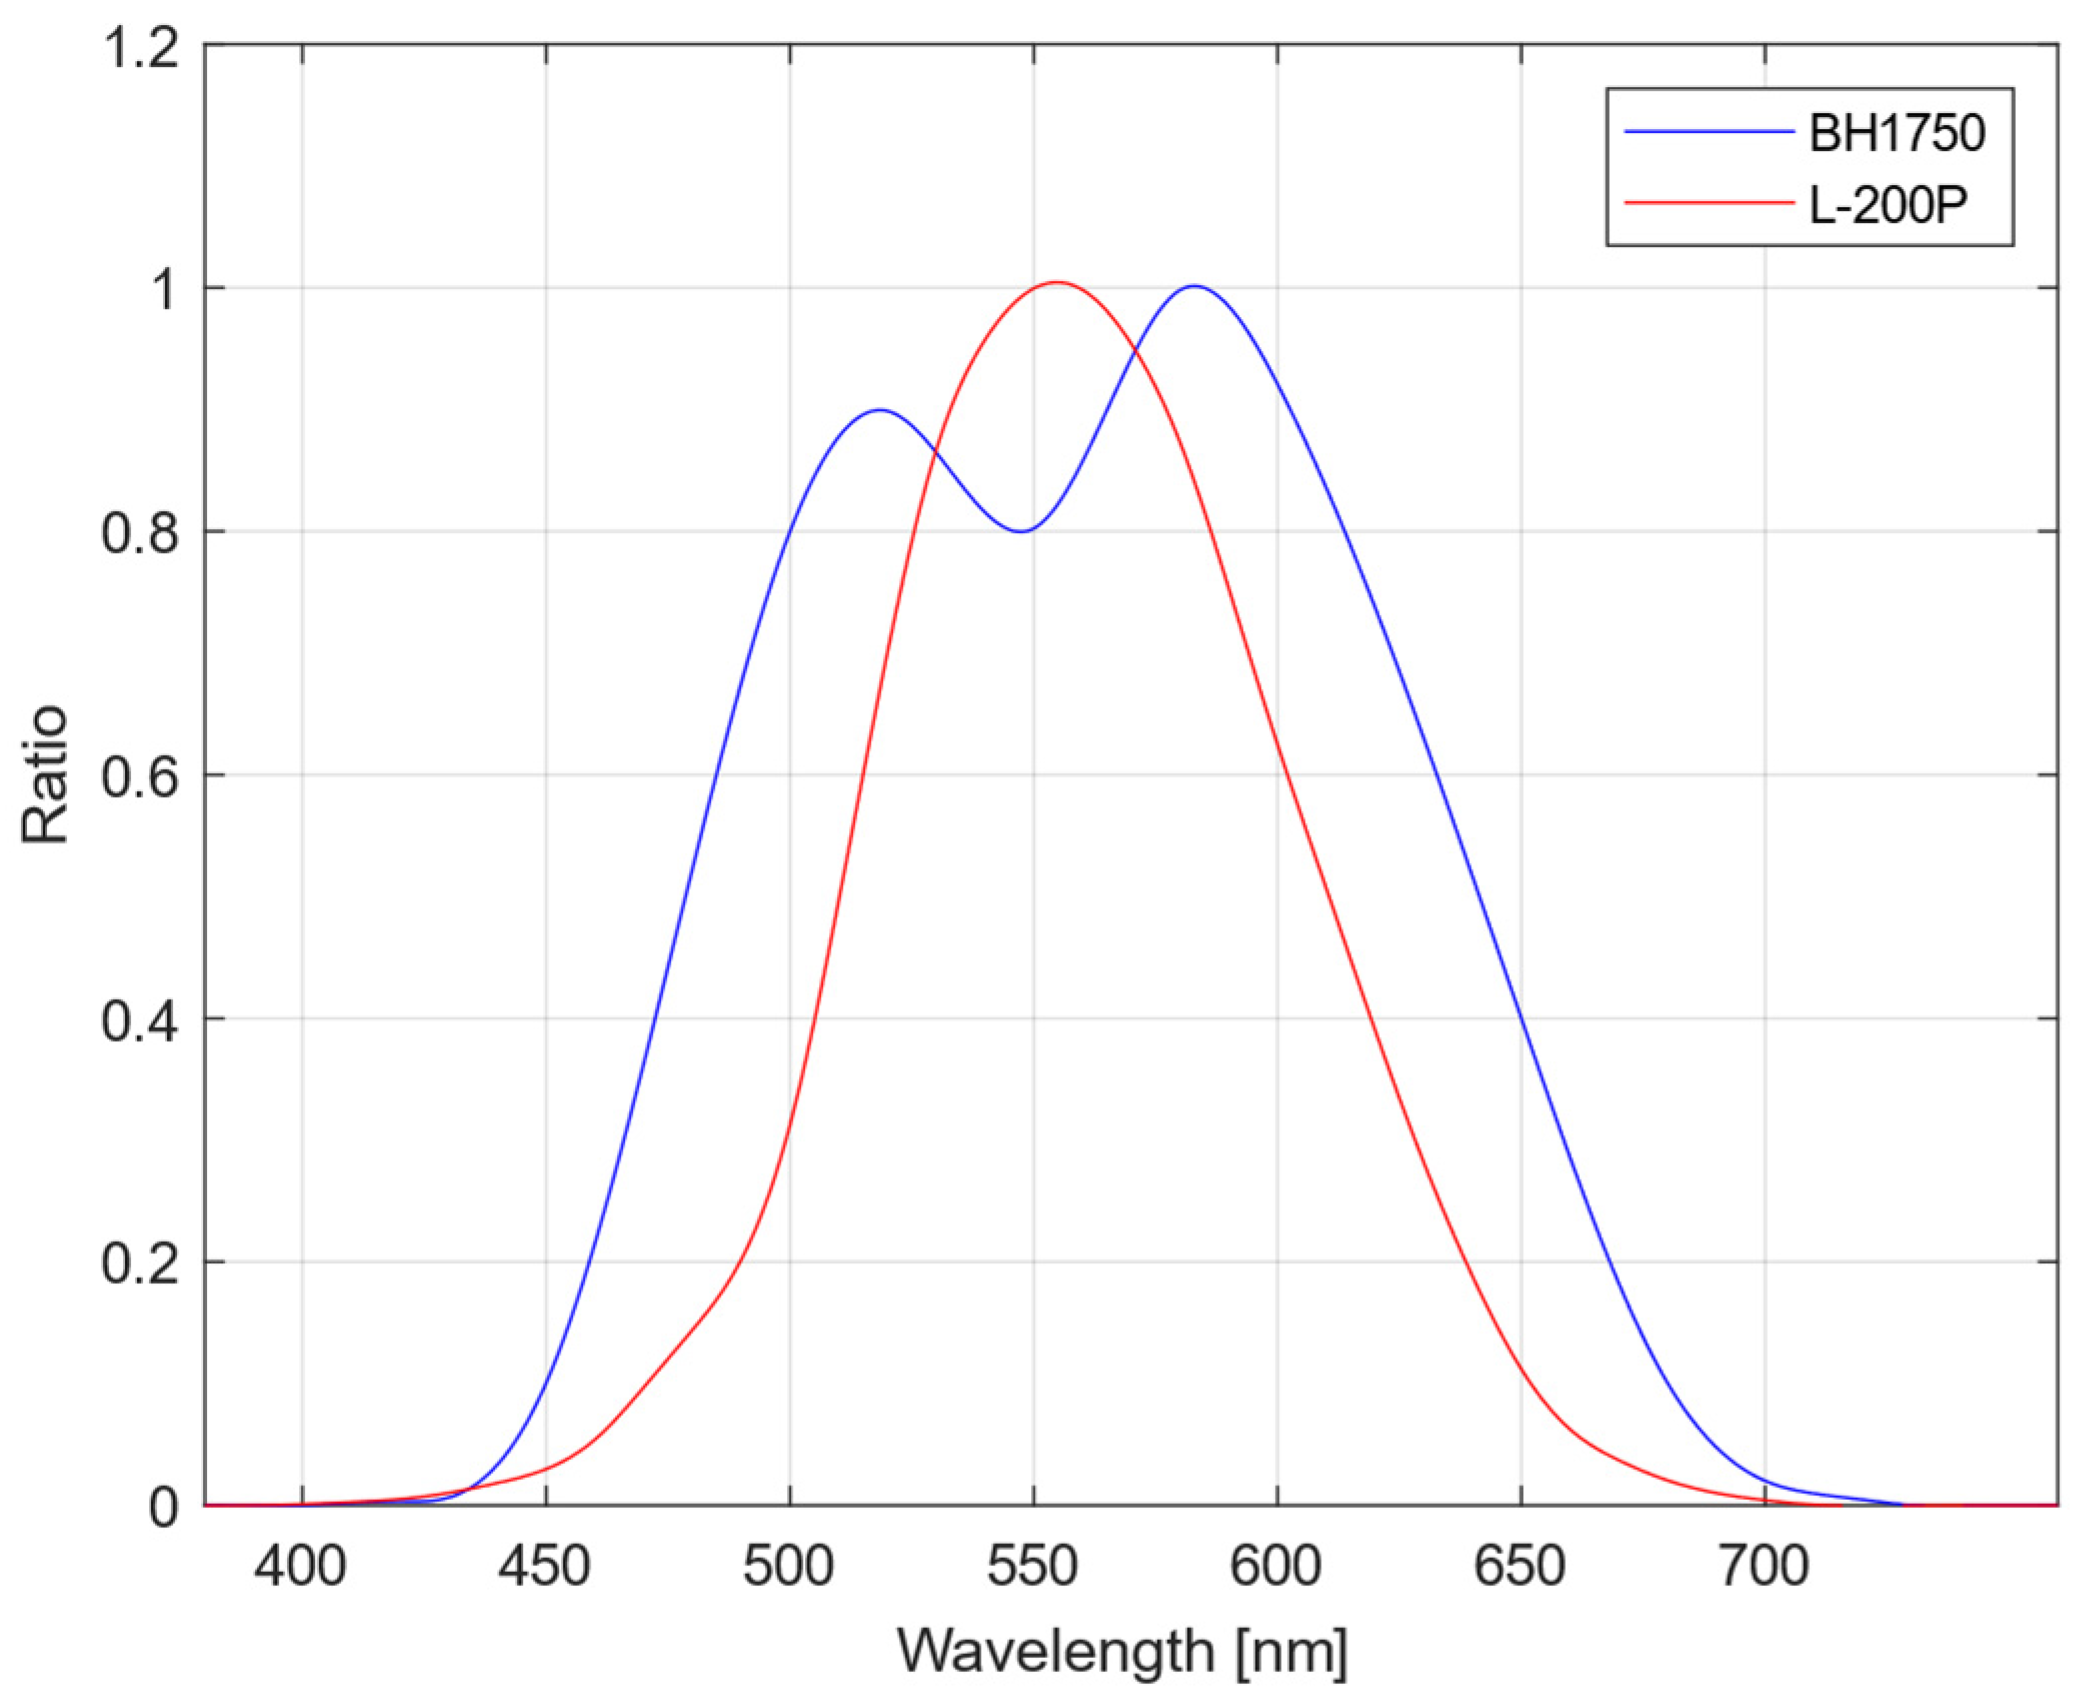
5. Measurement Sensor Calibration
The analysis of results presented in
Table 2 shows that the spectral characteristic [
23] of the BH1750 sensor (ROHM Co., Ltd.: Kyoto, Japan) has an influence on the measurement value, and after introducing mathematical correction, it can be similar to the measurement obtained from the professionally certified Sonopan L-200P luxmeter (Sonopan, Louiseville, QC, Canada) [
24] (
Figure 11).
Depending on their function and location, airport lamps differ in their photometric parameters. The use of different colours of emitted light allows the pilot to quickly distinguish them, thus clearly determining the position of the aircraft in airport areas. The most common lamp colours that have been tested in laboratory tests are white, red, green, and yellow. White lamps, depending on the type of lamp and its location, differ in the dimensions of the prisms, so their characteristics are also different. In-pavement airport lamps can also be divided according to the number of light sources, i.e., single- and double-sided lamps, which may have the same or different colours, but this does not affect their photometric characteristics. The tested airport in-pavement lamps are single-sided touchdown zone, clear (TDZ), double-sided runway centerline lamps that are clear on both sides (RCL C/C Clear I, RCL C/C Clear II) and clear and red (RCL C/R Clear, RCL C/R Red), double-sided green-yellow taxiway centerline lamp (TAXI G/Y Green, TAXI G/Y Yellow).
Measurements were made from 1 m distance at varying levels of airport lamps specified by EASA [
1]. In the case of Poznań-Ławica Airport, the threshold values are defined as follows:
1% for power supply current 2.8 A;
3% for power supply current 3.3 A;
10% for power supply current 4.1 A;
30% for power supply current 5.2 A;
100% for power supply current 6.6 A.
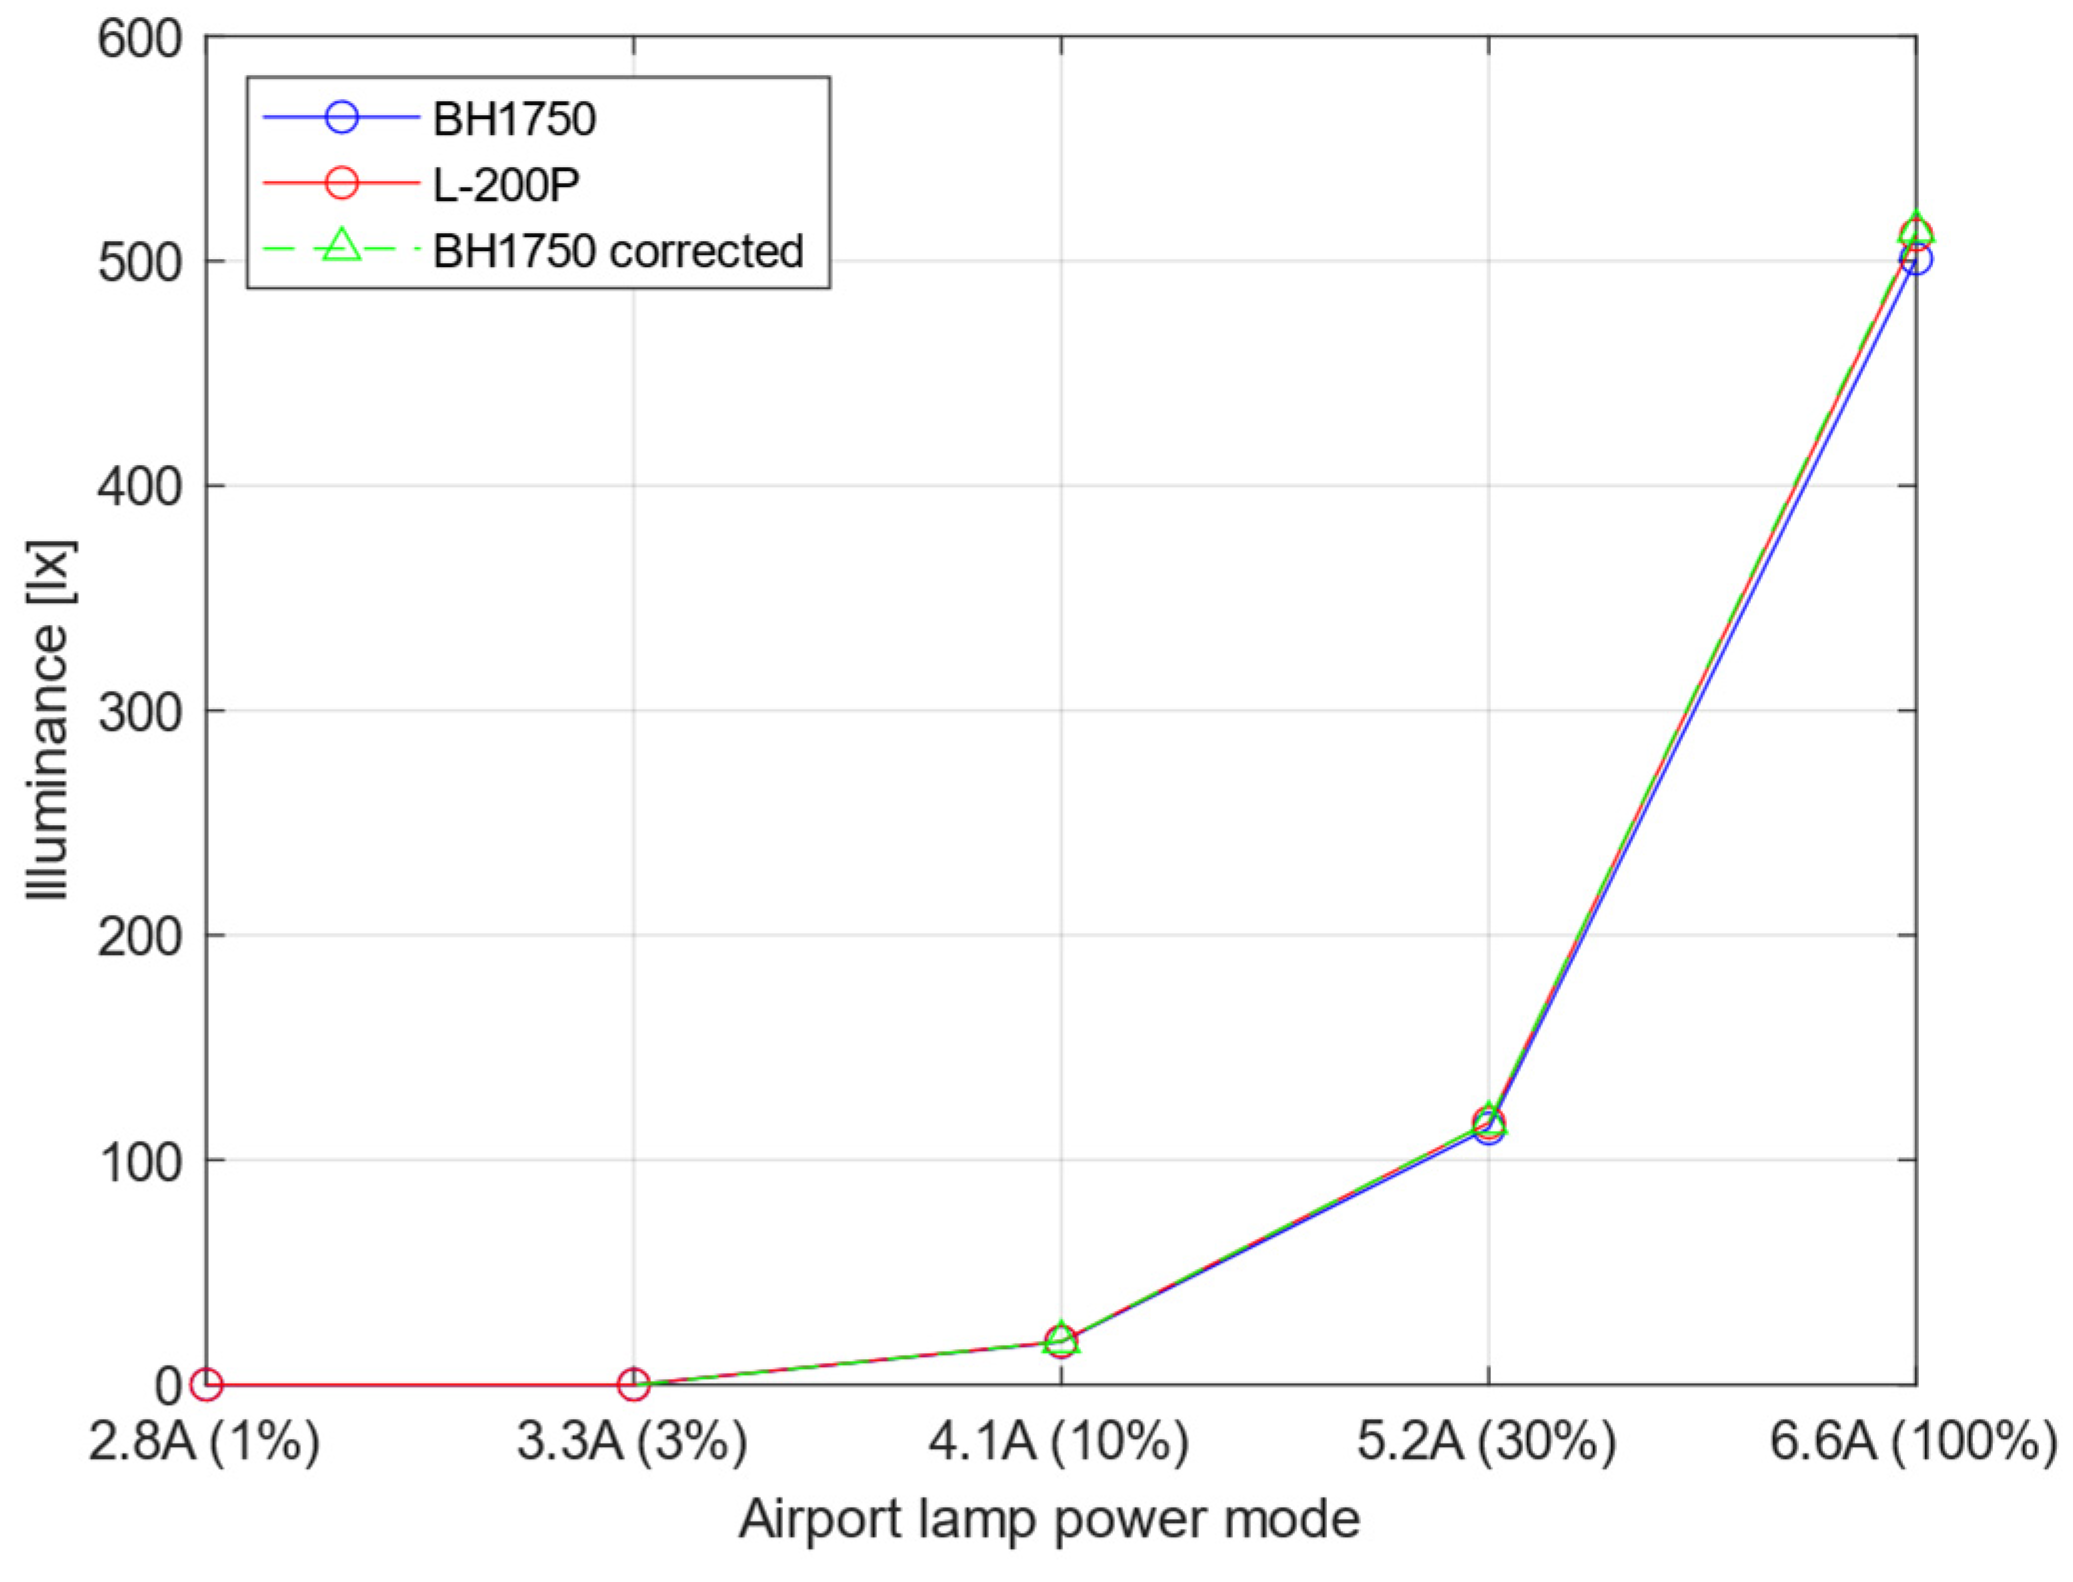
After conducting 50 measurement series, the results obtained for the BH1750 sensor and the certified Sonopan L-200P luxmeter were averaged for all of them. Data are summarised in
Table 3.
Based on the results obtained, functions were determined to approximate the values obtained by the BH1750 sensor in relation to the reference values of the certified Sonopan L-200P luxmeter. Using the Curve Fitter App in Matlab [
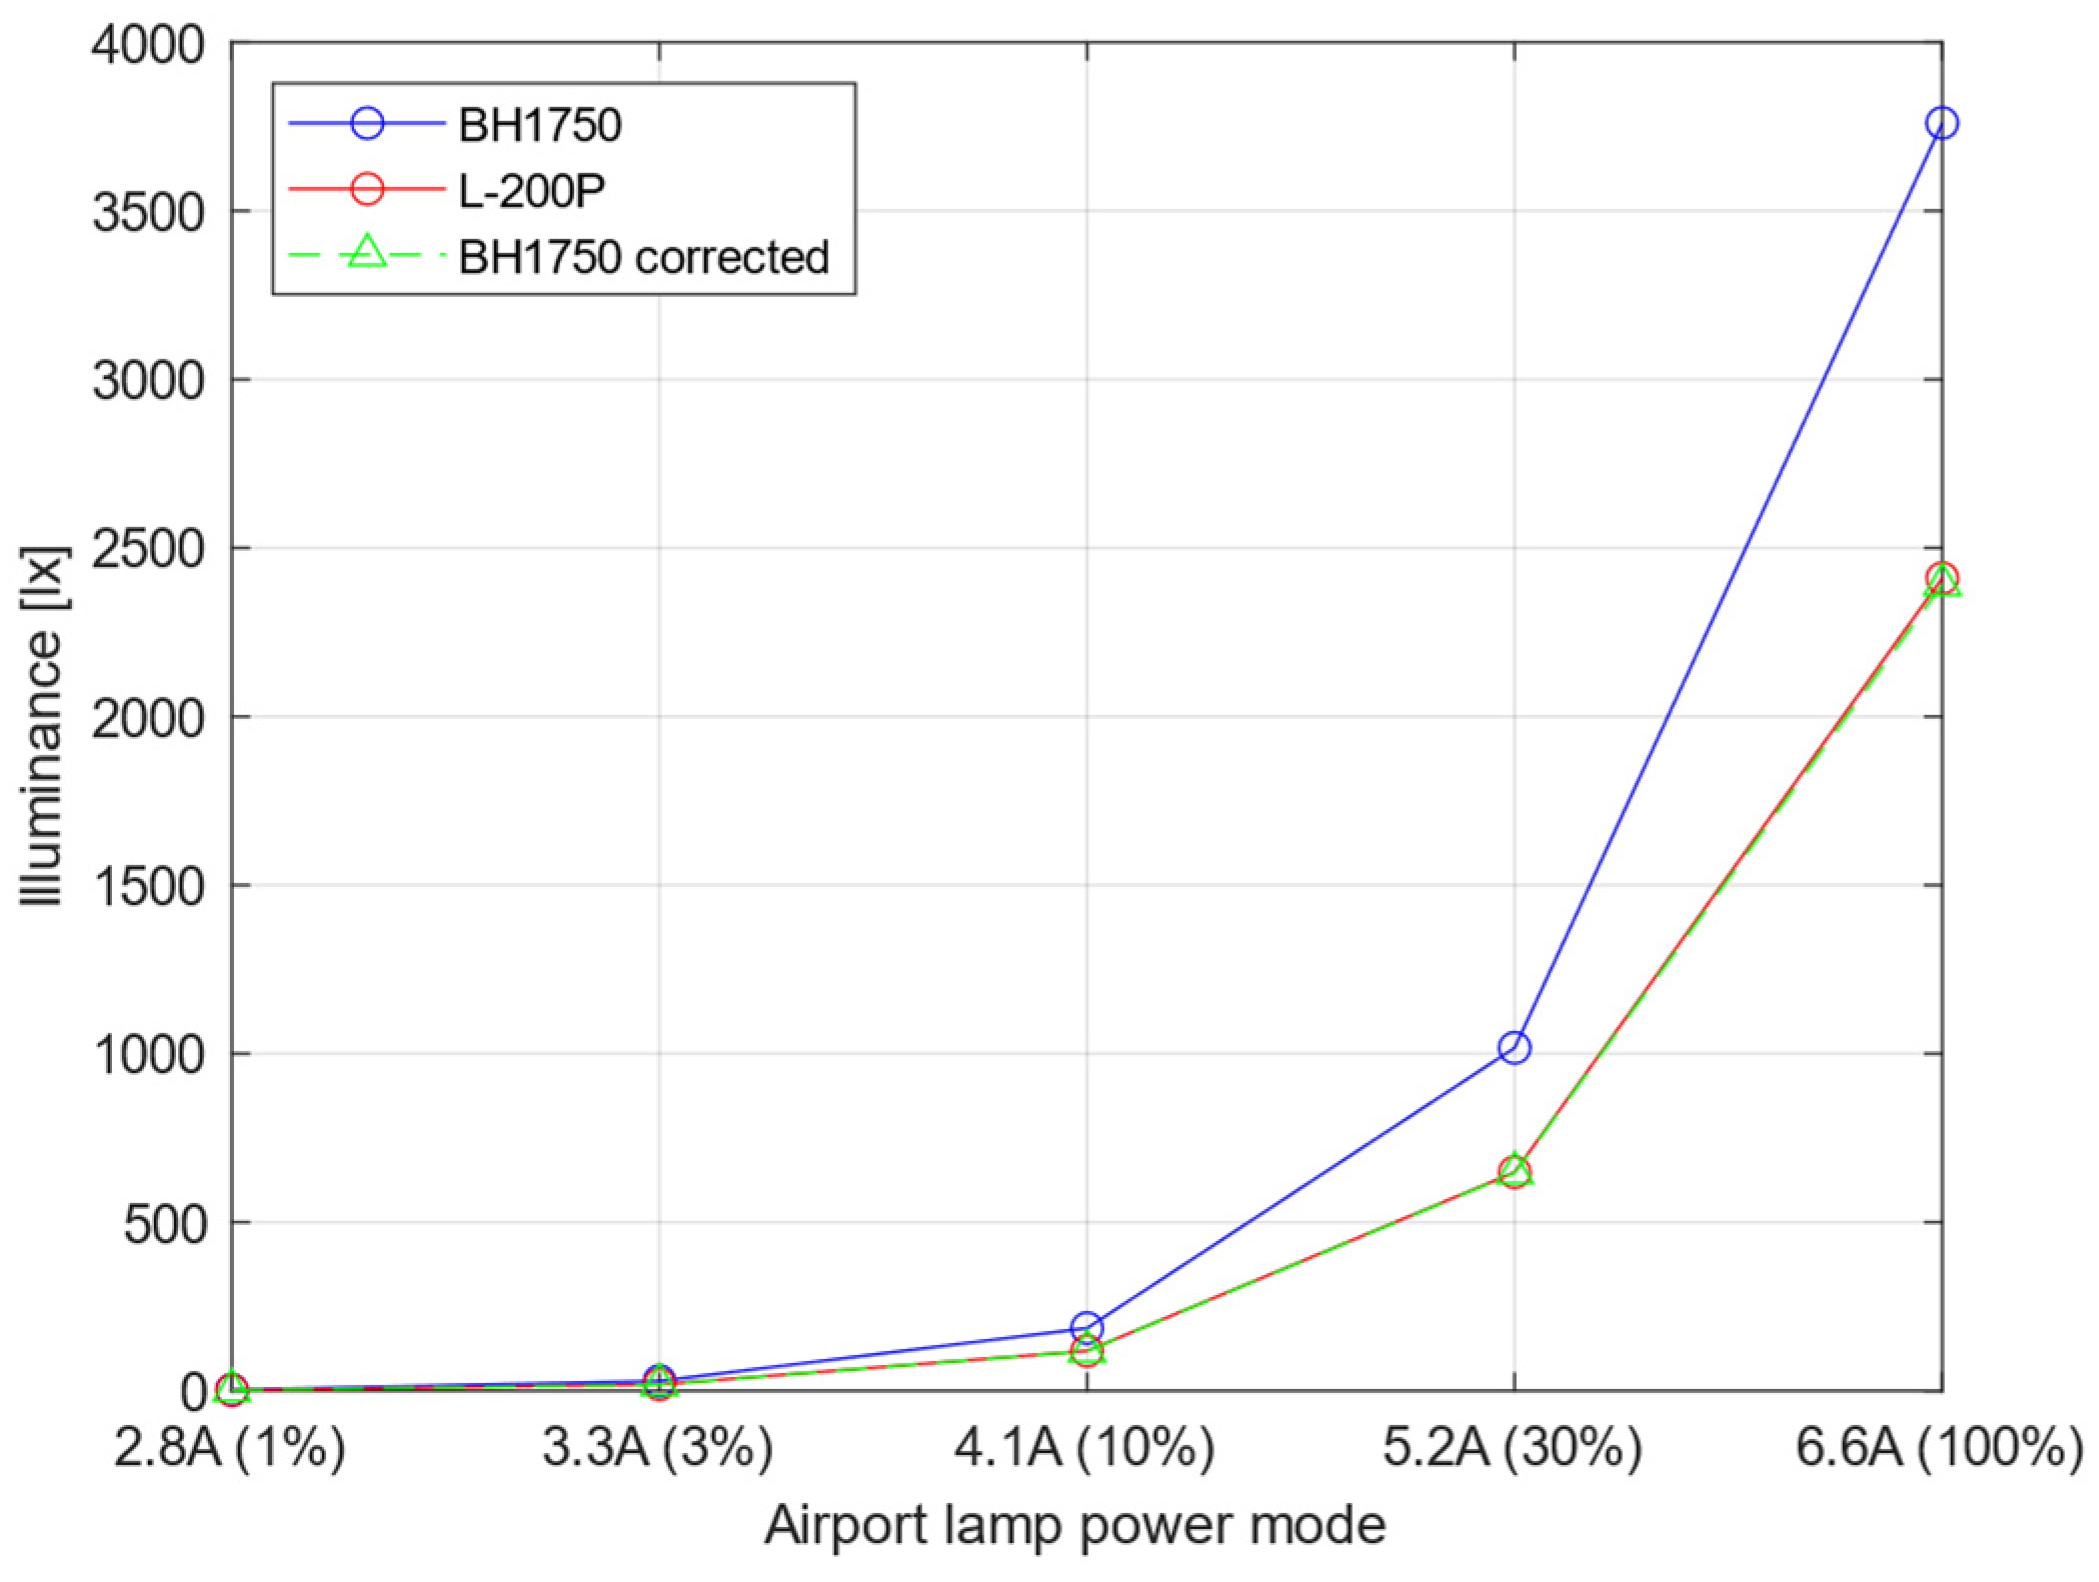
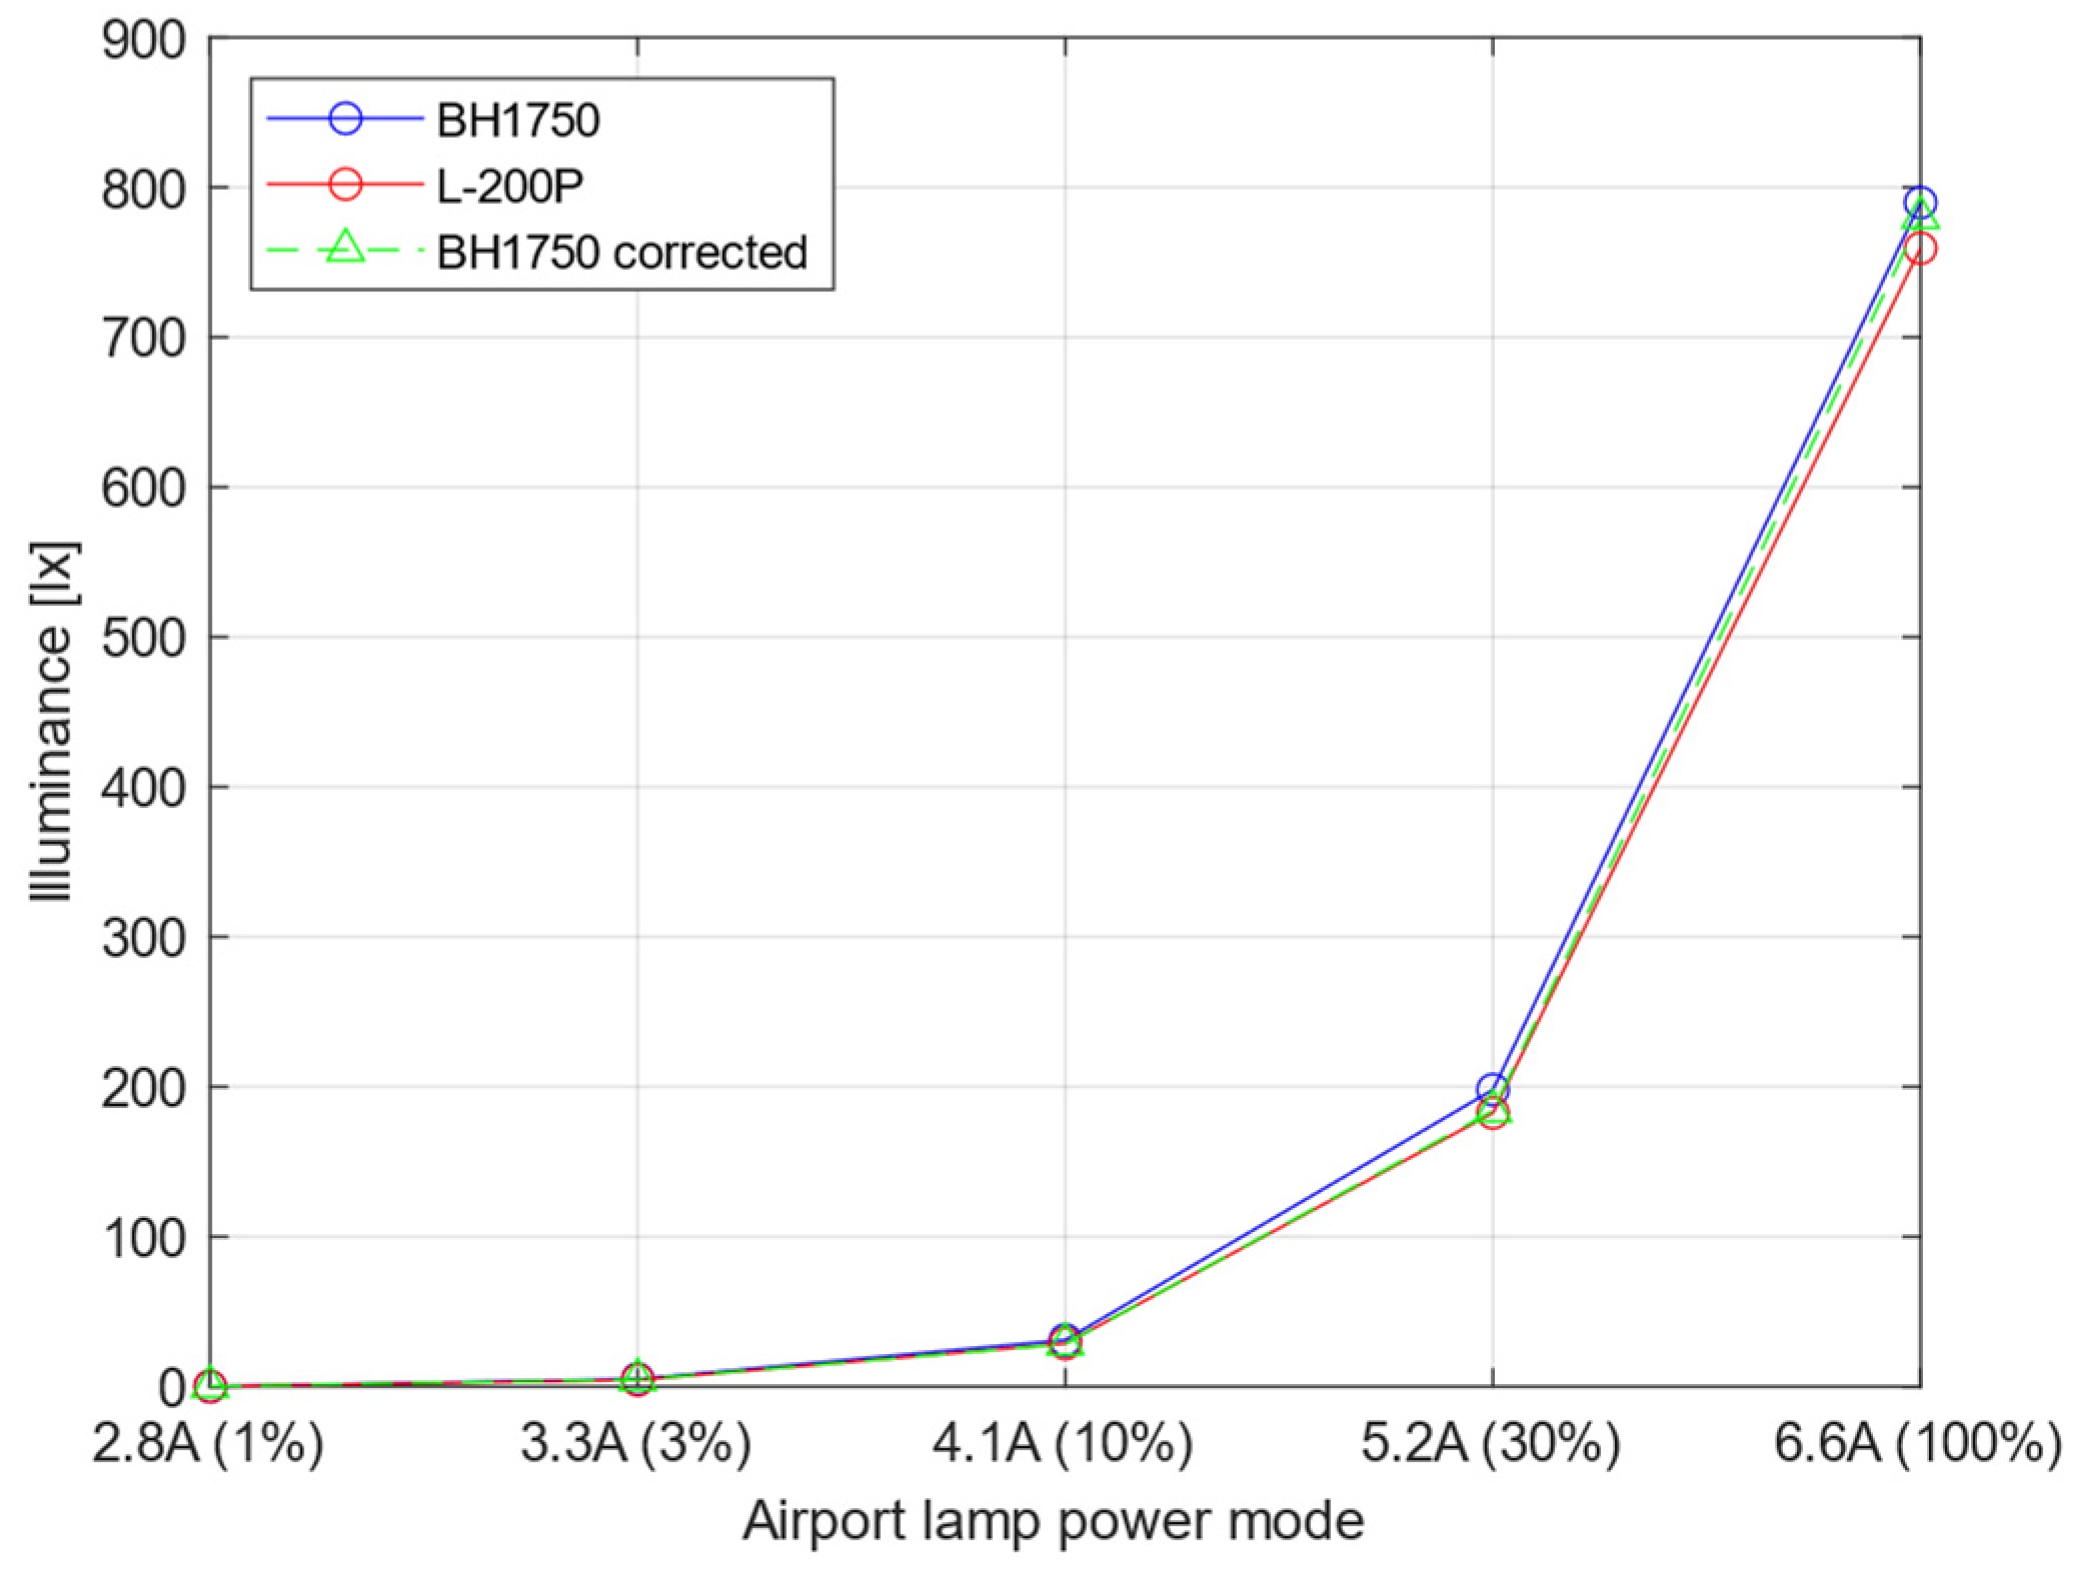
25], correction polynomials were determined for each type of the tested airport lamp: TDZ (Equation (1)), RCL Clear (Equation (2)), RCL Red (Equation (3)), TAXI Green (Equation (4)), TAXI Yellow (Equation (5)). The variable x represents the measurement value taken by the BH1750 sensor that has to be calculated to its corrected form to correspond to the actual characteristics of the light source.
Equations (1)–(3) and (5) can be represented in a simpler but similarly precise form of a polynomial of first degree with better goodness of fit because of better matching and balancing of input data to the Matlab Curve Fitter App. The final equations are as follows.
The analysis of the equations and the corresponding coefficients shows their significant differences depending on the type of lamp as well as its colour. They result from many factors, starting from the spectral characteristics of the light sources, i.e., the colour of the emitted beam. Depending on the adjustment of the spectral curve of a given sensor, an error in the measurement of illuminance by the BH1750 sensor may occur, e.g., when the colour components coincide with the “saddle” area, not observable in the case of the Sonopan L-200P luxmeter. Differences in the coefficient values, whose task is to correct the measurements from the BH1750 sensor to values close to the certified measuring device, also result from the lamp prism, i.e., TDZ and RCL lamps require different equations.
For each equation, the following were calculated: sum squared error (SSE), coefficient of determination (R-square), decision feedback equalizer (DFE), adjusted R-squared (Adj R-sq), and root mean square error (RMSE) [
25].
Table 4 presents goodness of fit parameters for simple polynomial equations and their more complex form. The advantage of simplified conversion factors is that the computer performs calculations faster while maintaining similar and relatively small measurement errors.
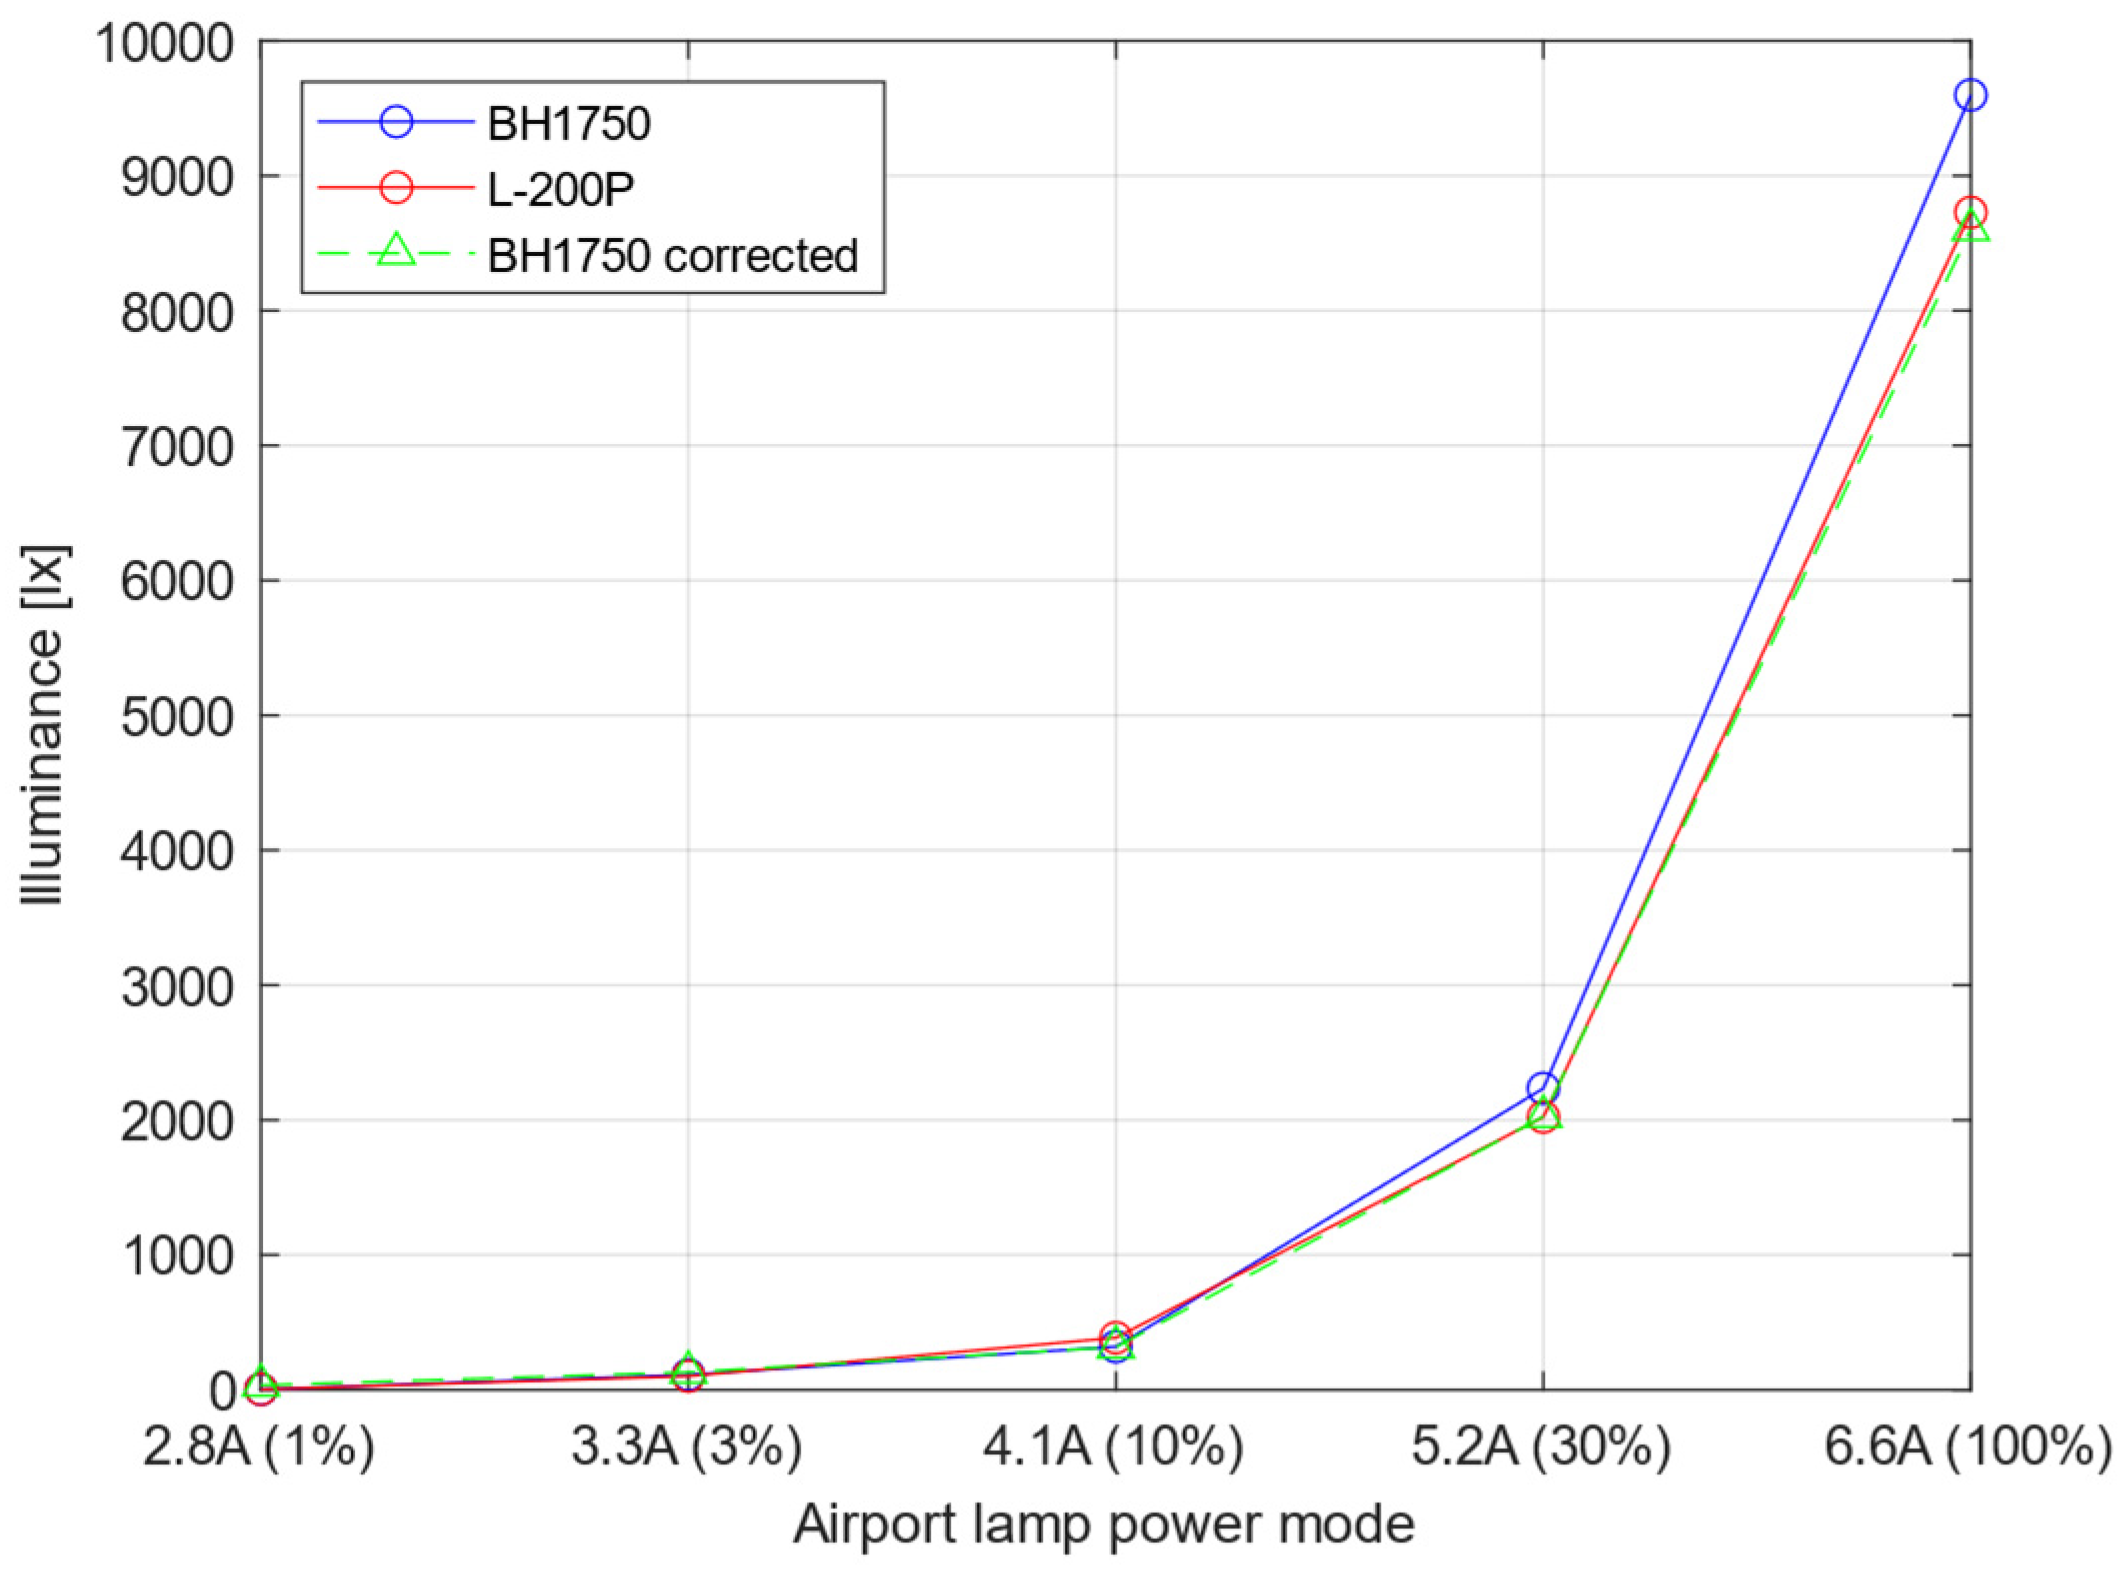
Using Equations (4) and (6)–(9) obtained measurements, data were visualised in
Figure 12,
Figure 13,
Figure 14,
Figure 15 and
Figure 16 to compare raw values from BH1750 sensor, certified luxmeter Sonopan L-200P, and BH1750 with mathematical correction.
From the analysis of the graphs presented in
Figure 12,
Figure 13,
Figure 14,
Figure 15 and
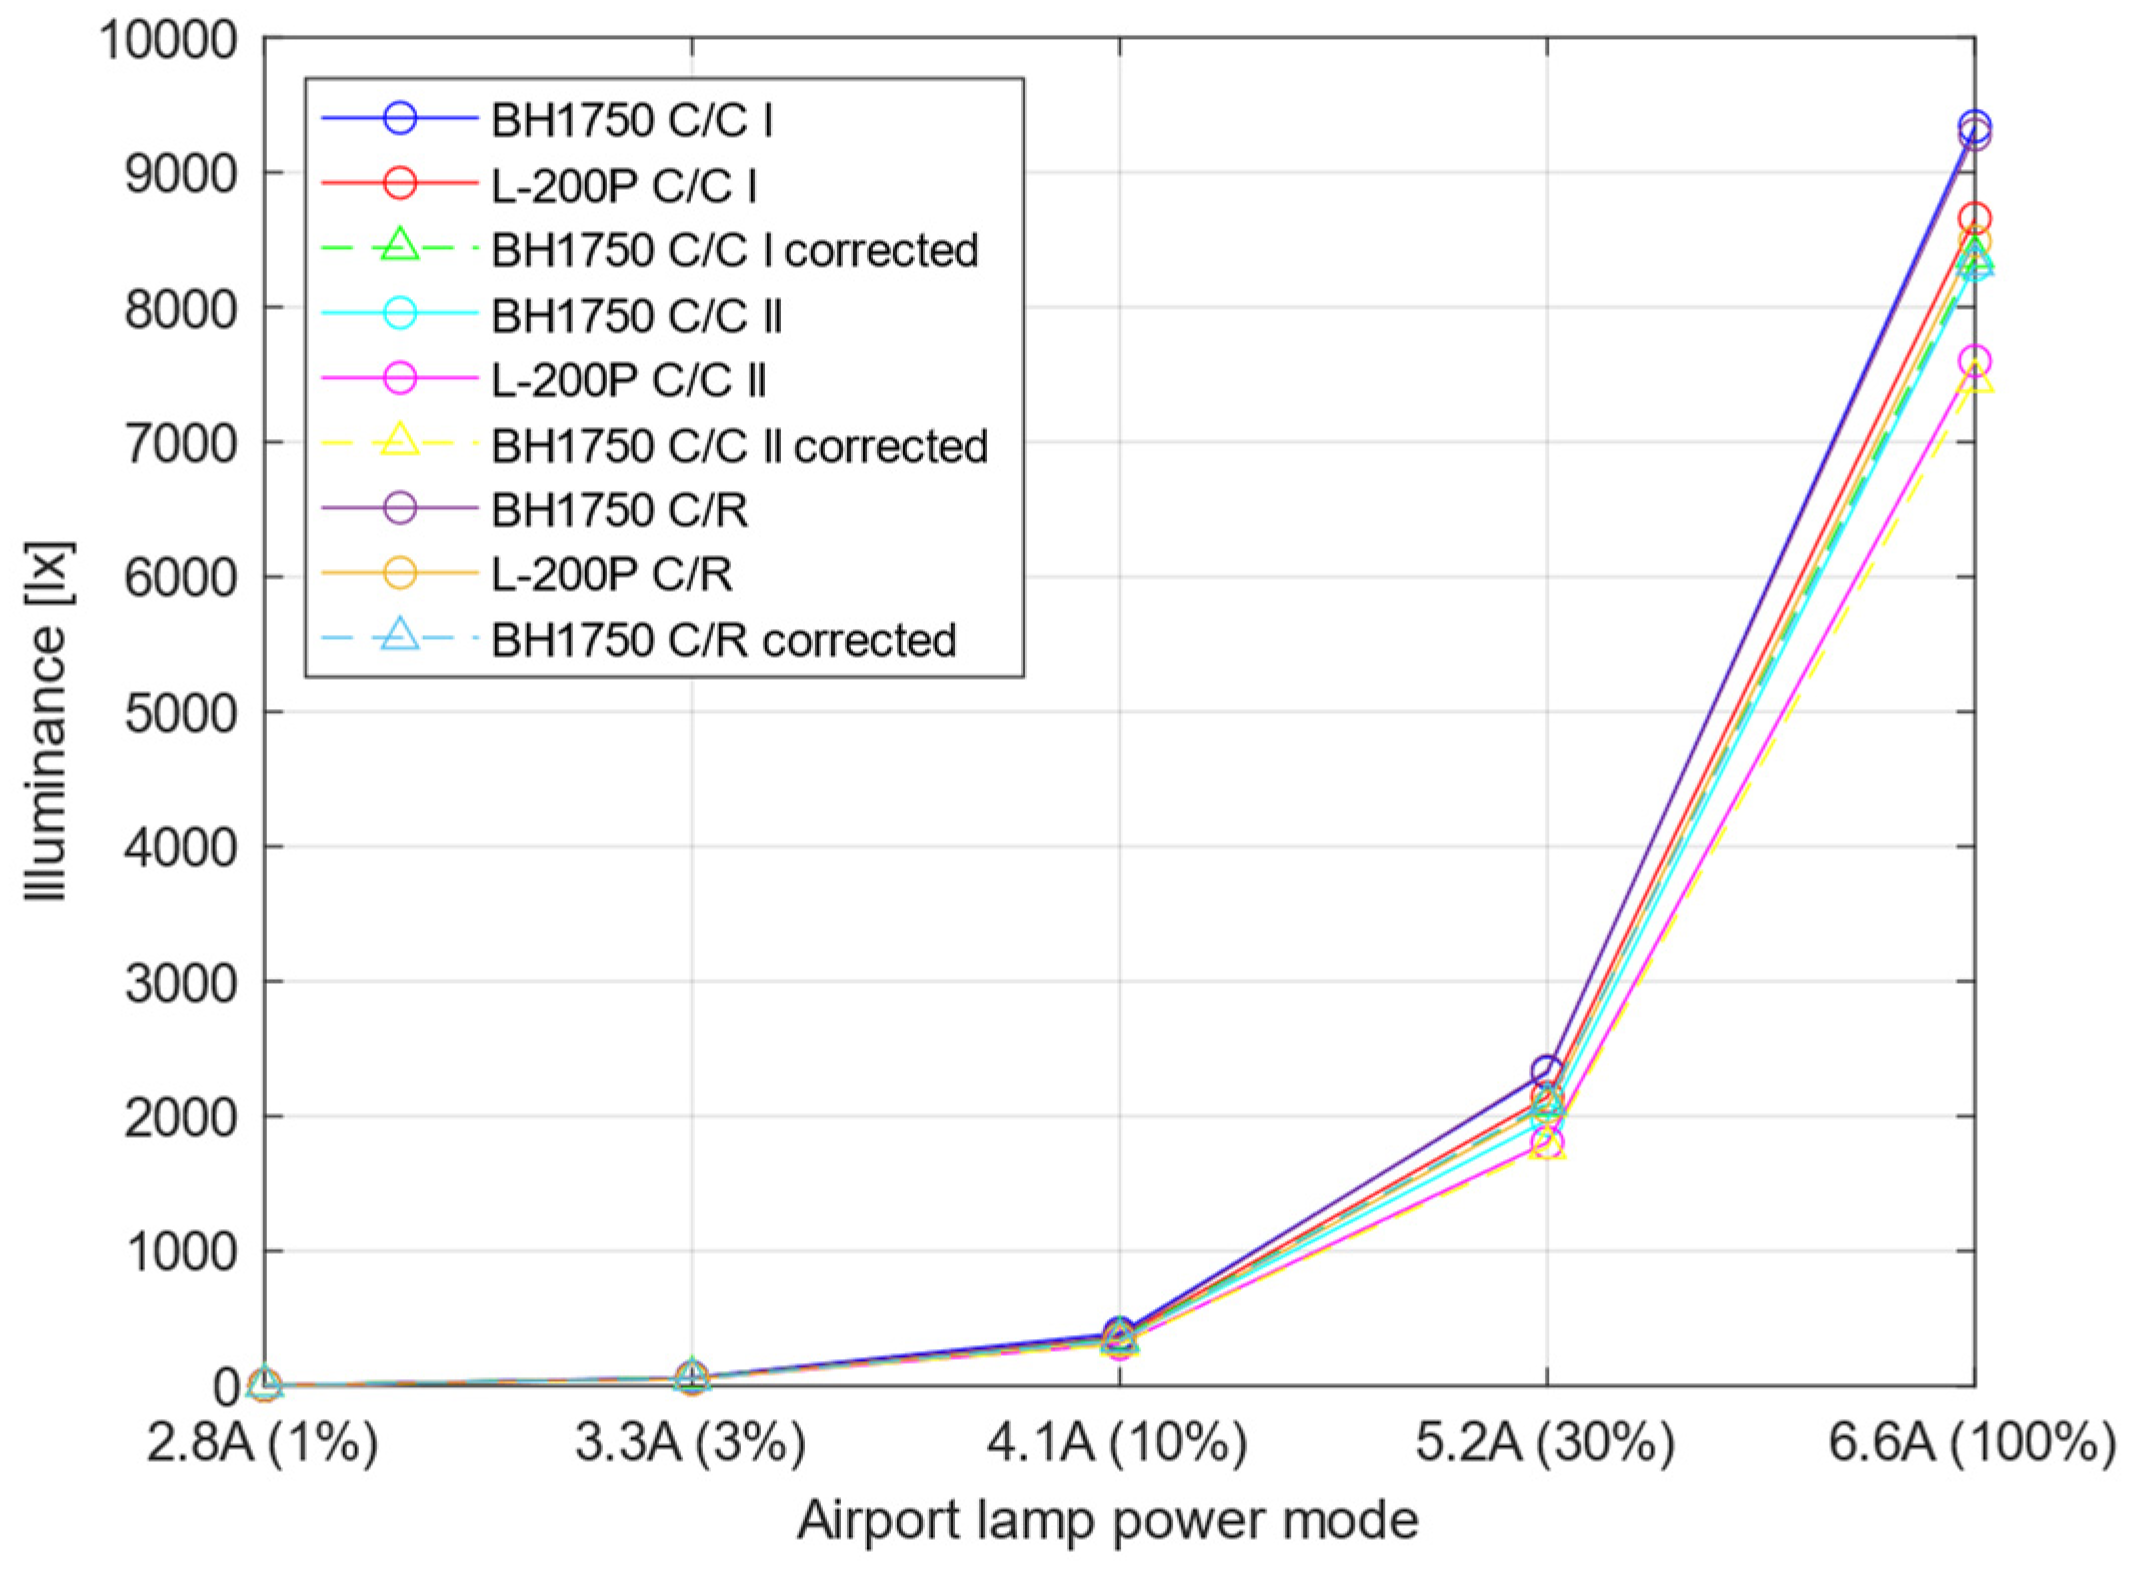
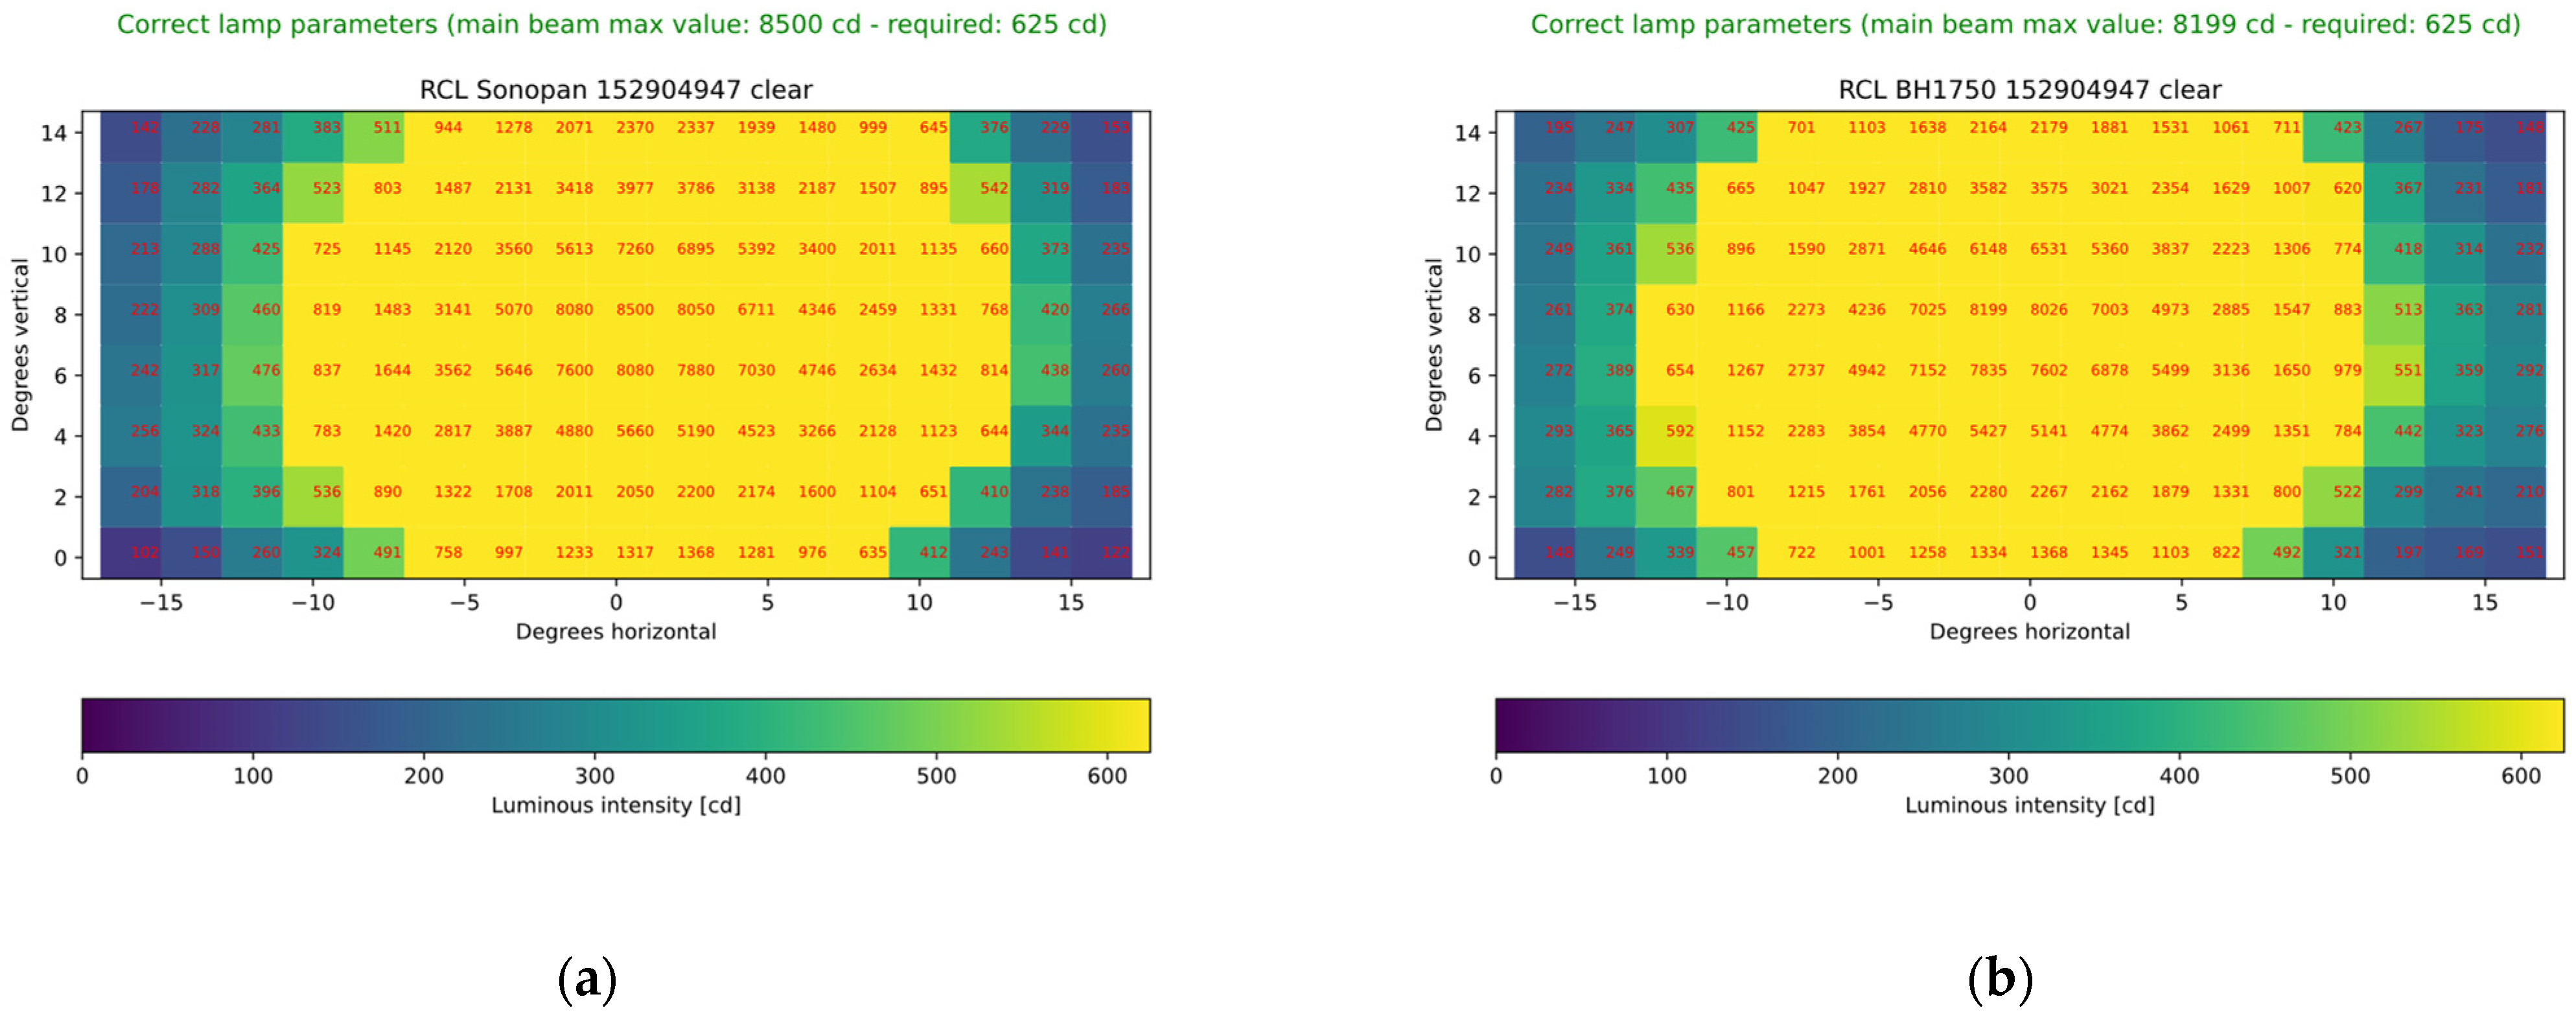
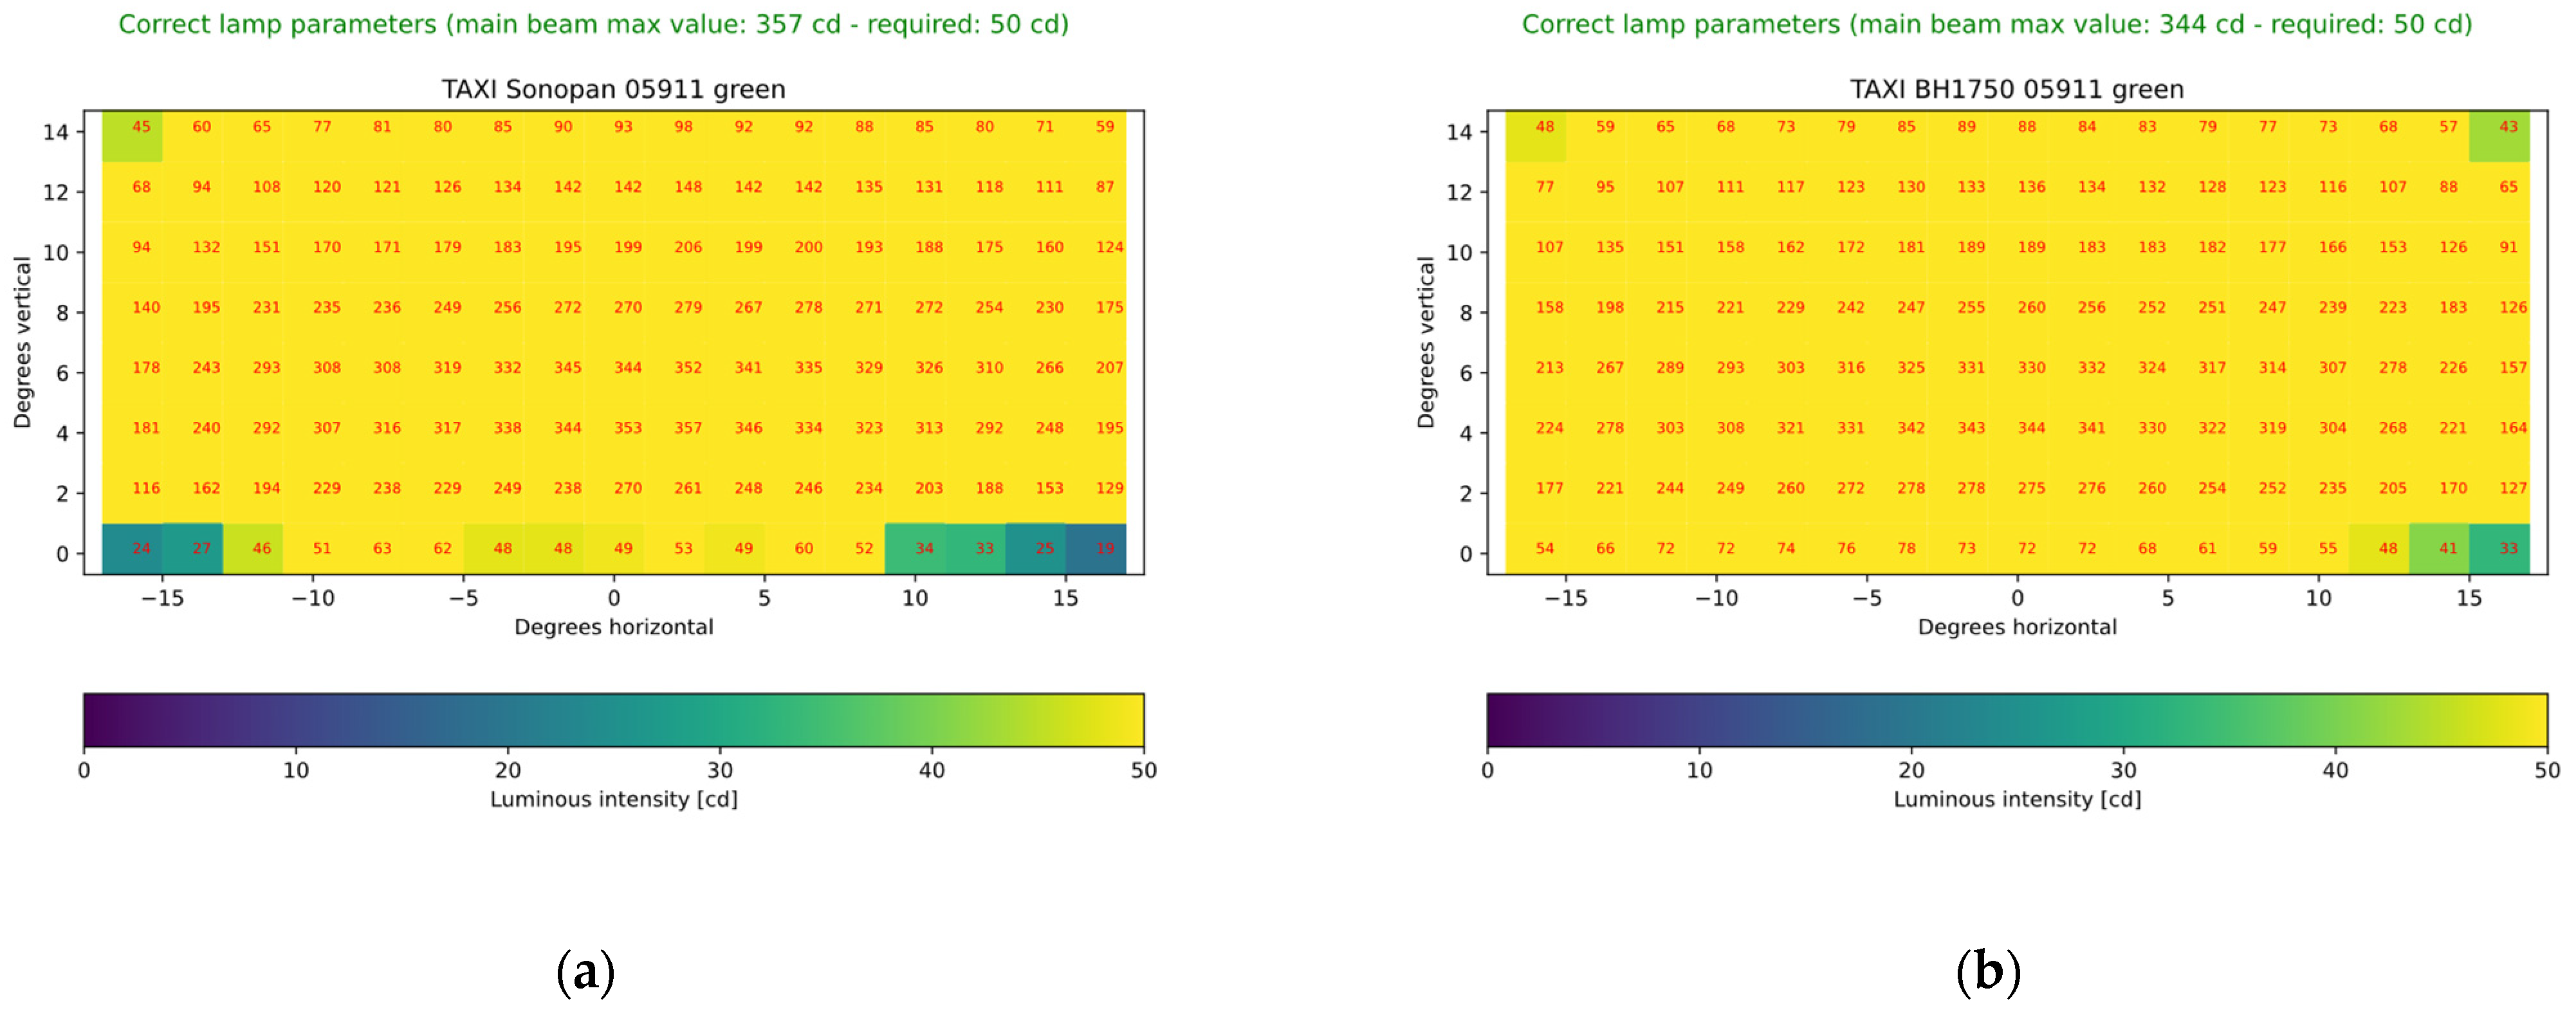
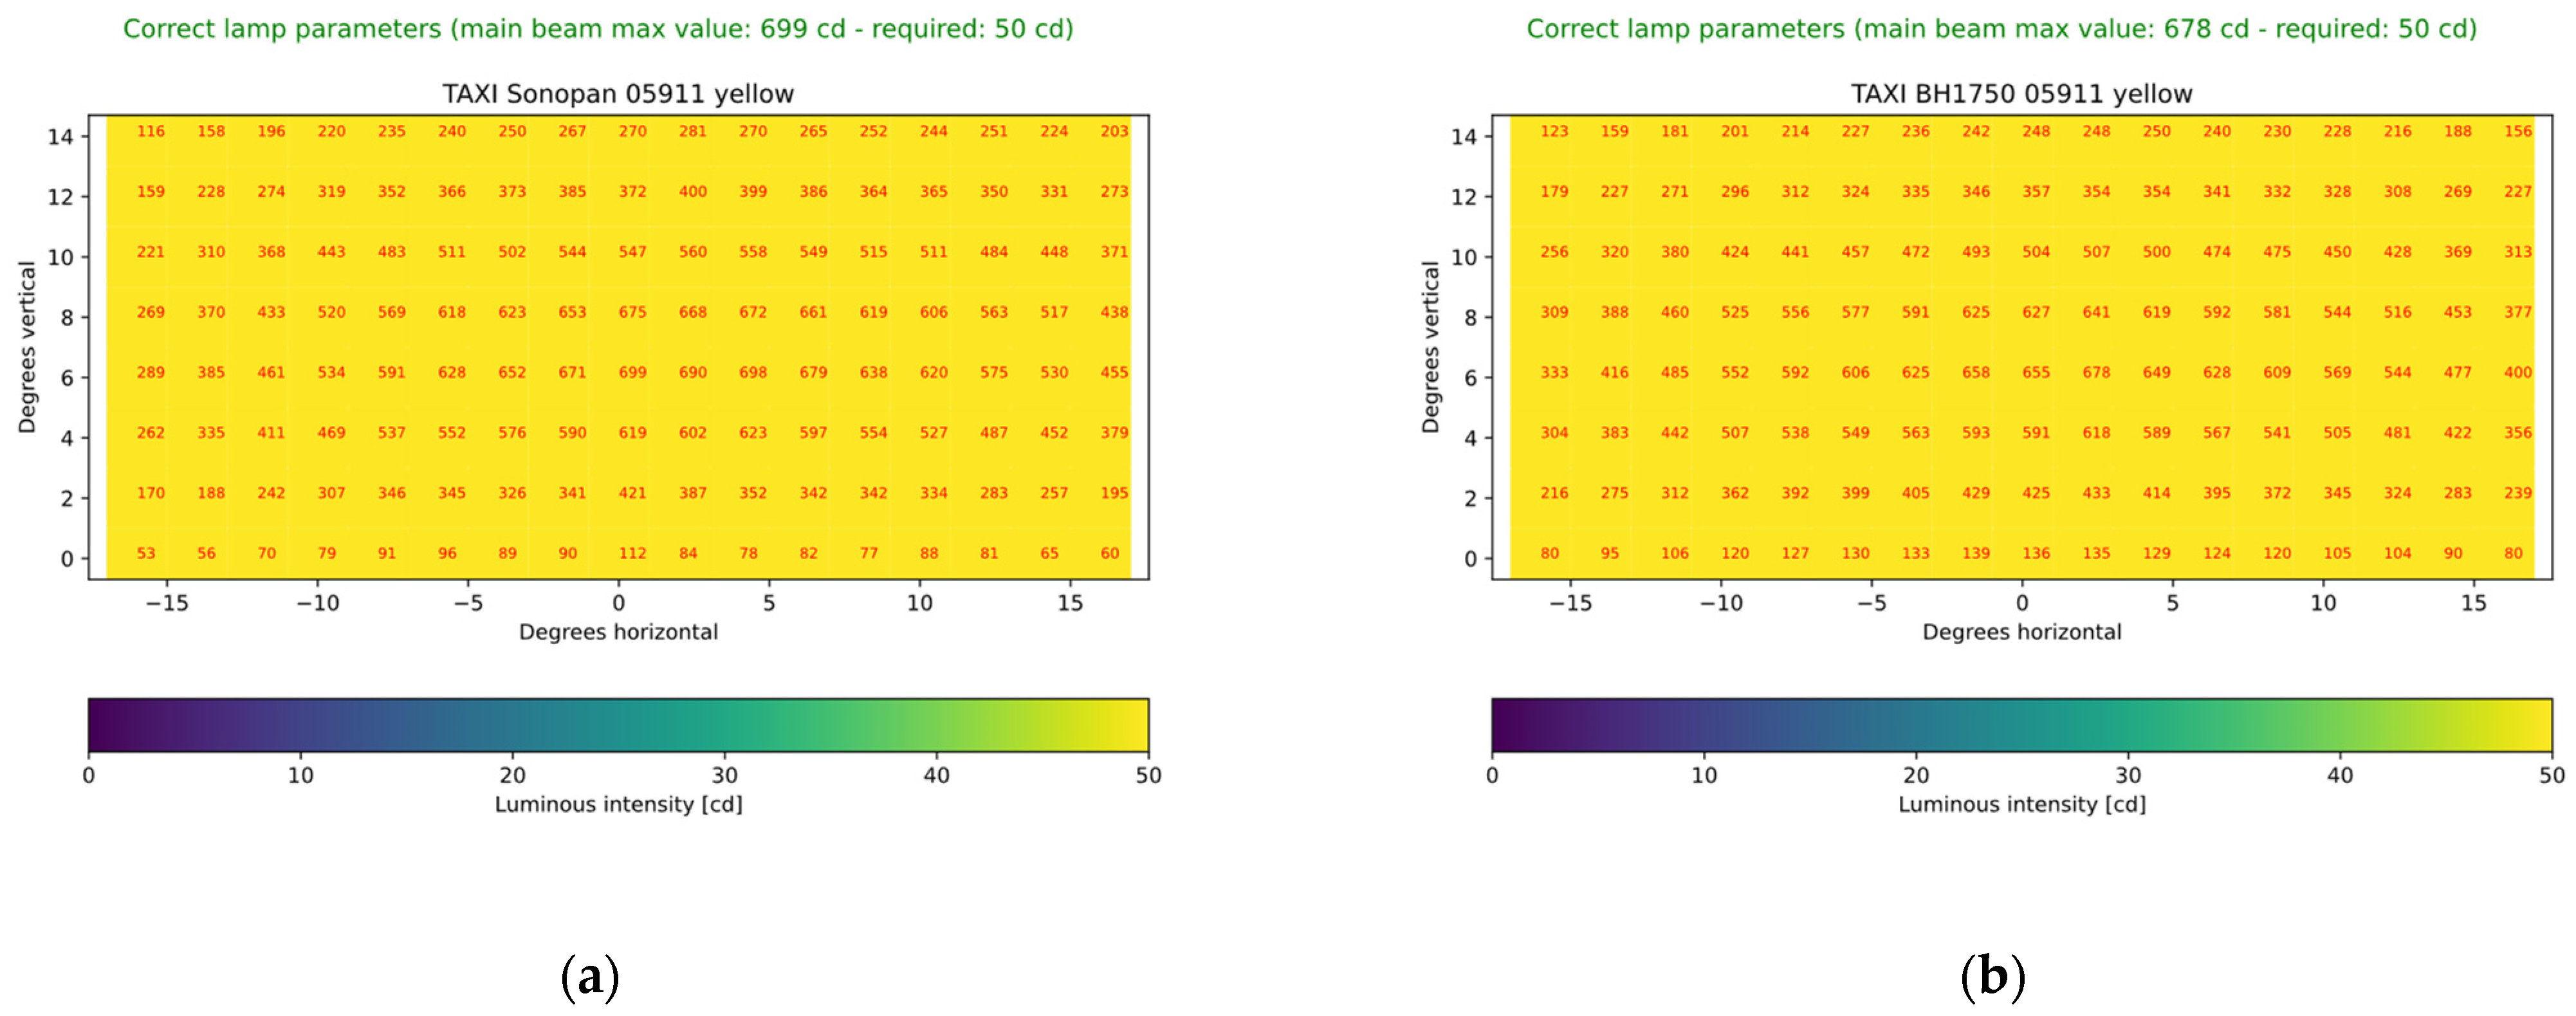
Figure 16, it can be concluded that the conversion values by the equations match the raw values of the BH1750 sensor to the standard for each individual lamp. However, these data were calibration data, so to check the correctness of the results, measurements were made using a goniphotometer with a Sonopan L-200P luxmeter and a BH1750 sensor. Measurement data are shown in
Figure 17,
Figure 18,
Figure 19,
Figure 20 and
Figure 21.
Analysis of
Figure 17,
Figure 18,
Figure 19,
Figure 20 and
Figure 21 shows that the conversion factor used for the BH1750 sensor introduces some measurement inaccuracies. They may result from imperfect modelling of the conversion function for each type of lamp with a polynomial. This does not change the fact that the values located in the centre of the lamps’ angular characteristics coincide with each other. This area is crucial in assessing the performance quality of airport lamps. Therefore, it can be concluded that, in its current state, the proposed device is capable of testing airport lamps under laboratory conditions with high efficiency and accuracy.
6. Quality Assessment of Used and Refurbished In-Pavement Airport Lamps
Comprehensive research related to the assessment of the quality of in-pavement airport navigation lamps was carried out in cooperation with Poznań-Ławica Airport. During tests to verify the operation of the automatic navigation lighting control device, several measurements of the lamps that operated in airport areas and required maintenance during a routine inspection of the system were made.
On the basis of statistics, it can be concluded that the touchdown zone lamps were the most degraded, as they are exposed to the greatest damage from planes passing over them. The red centerline lamps were in the best condition, which may be due to the fact that they mark the end of the runway and, therefore, planes do not move on them as often as on other luminaires. The white centerline lamps located on most of the runway have also deteriorated, but not as much as the touchdown zone lamps. These observations prove how necessary it is to control the photometric characteristics of airport lamps to ensure their proper functioning and to select lamps that require replacement.
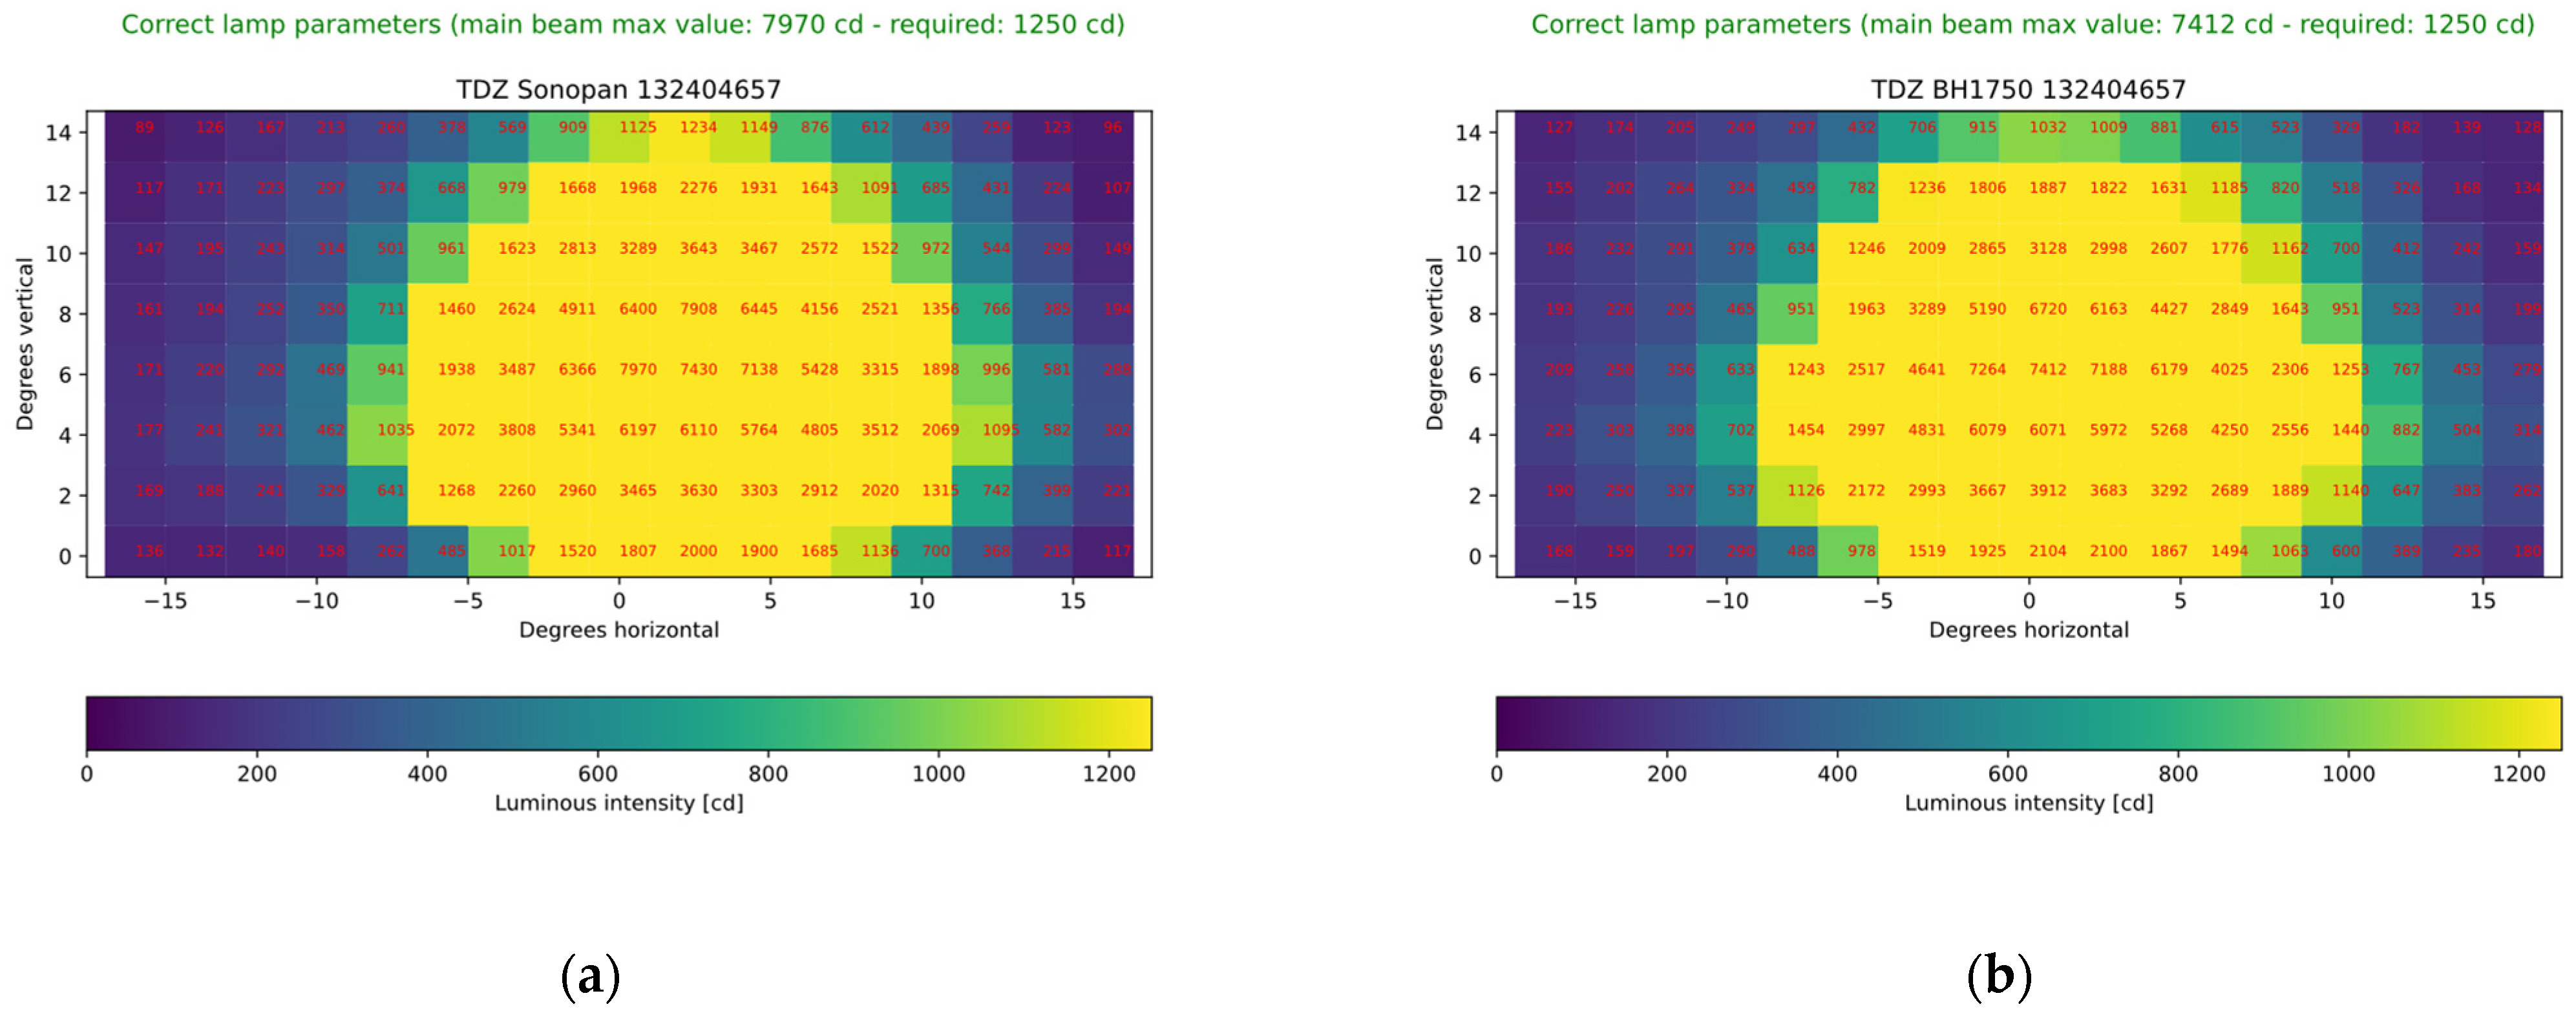
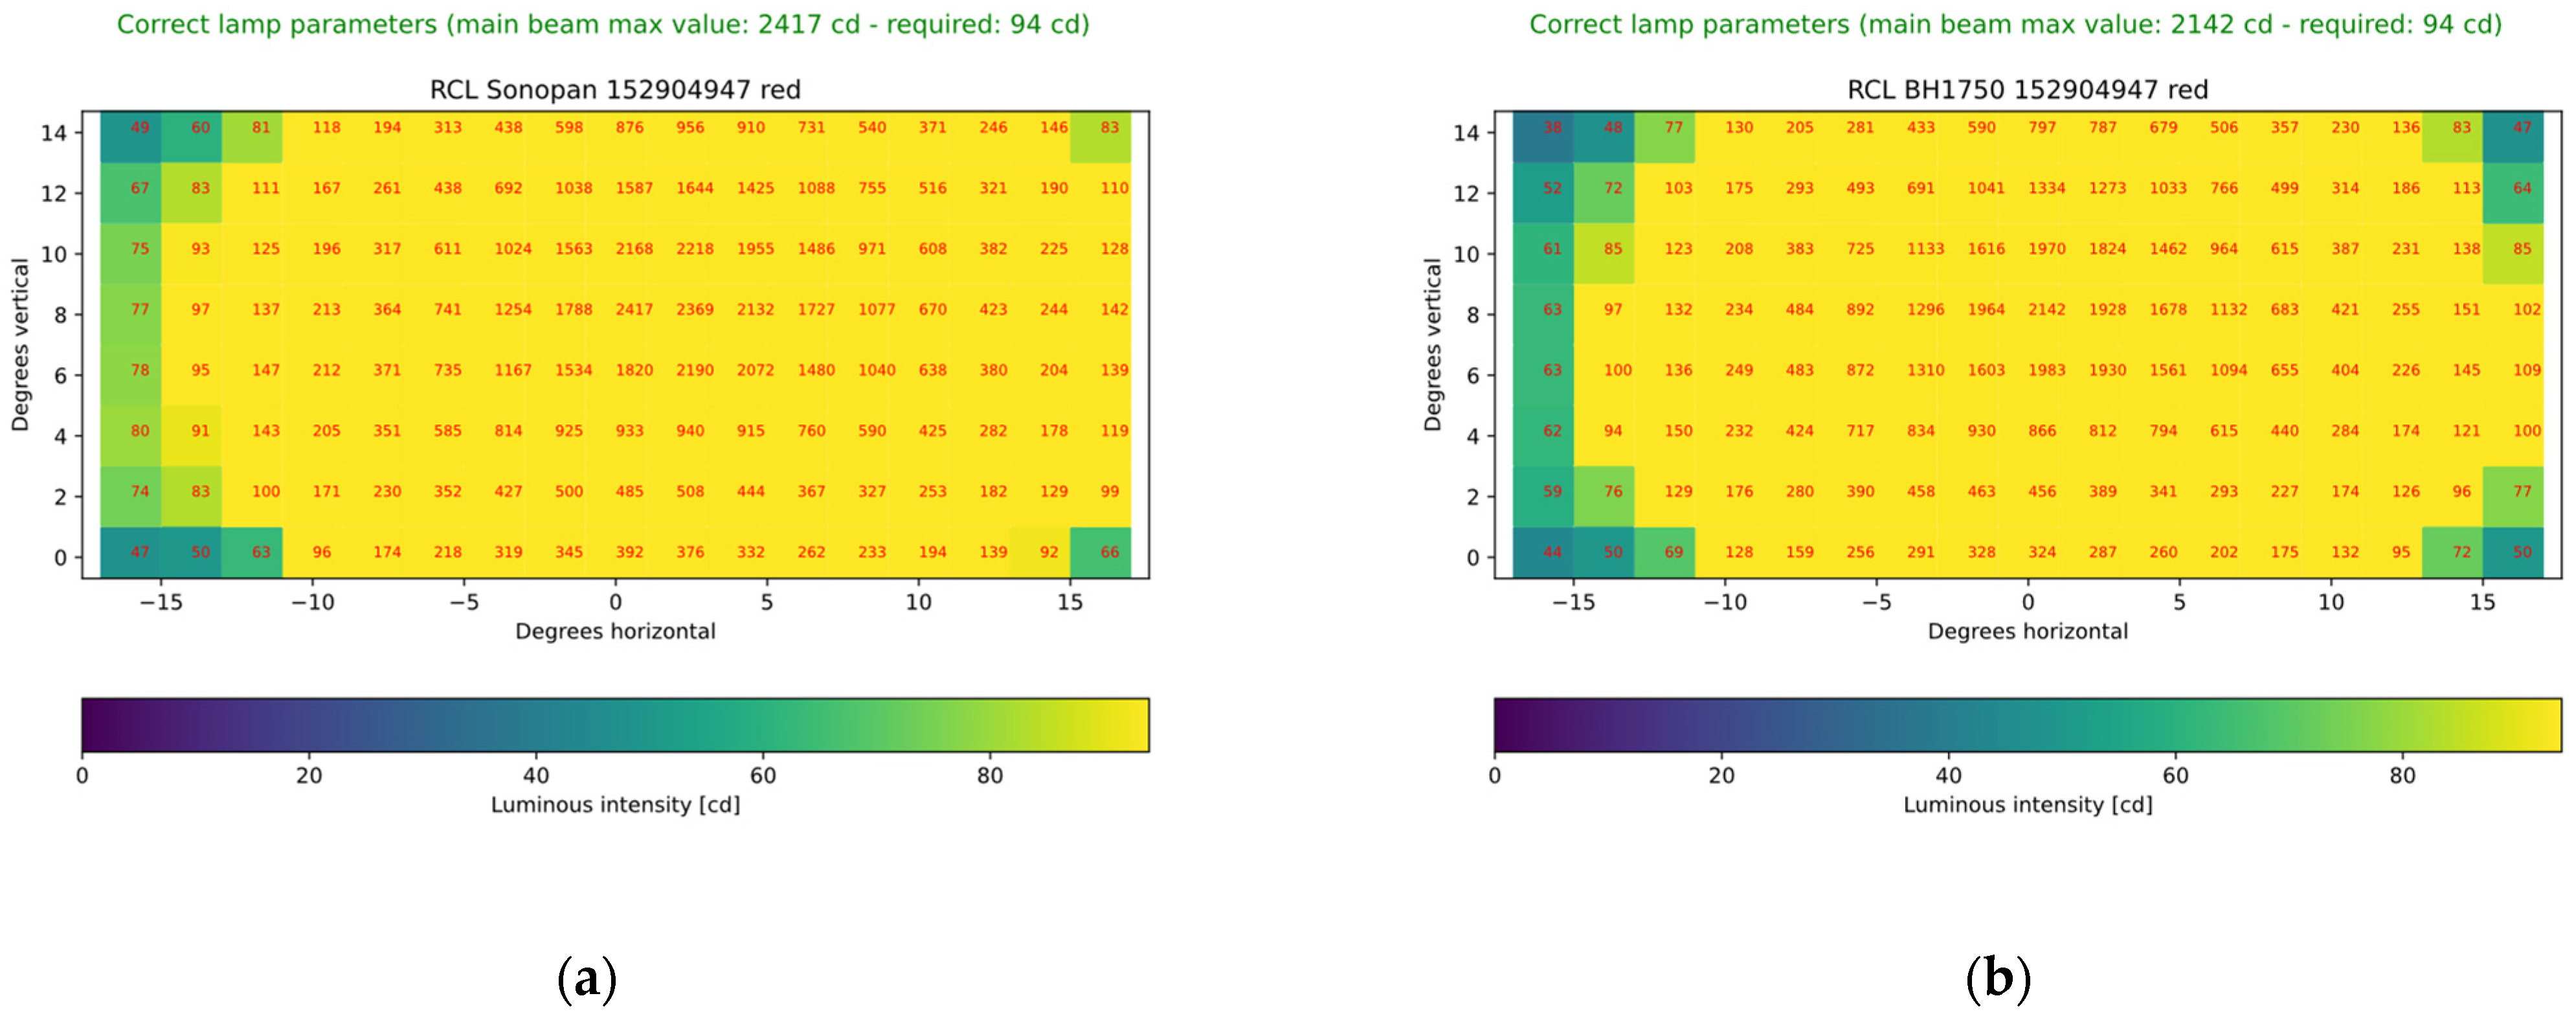
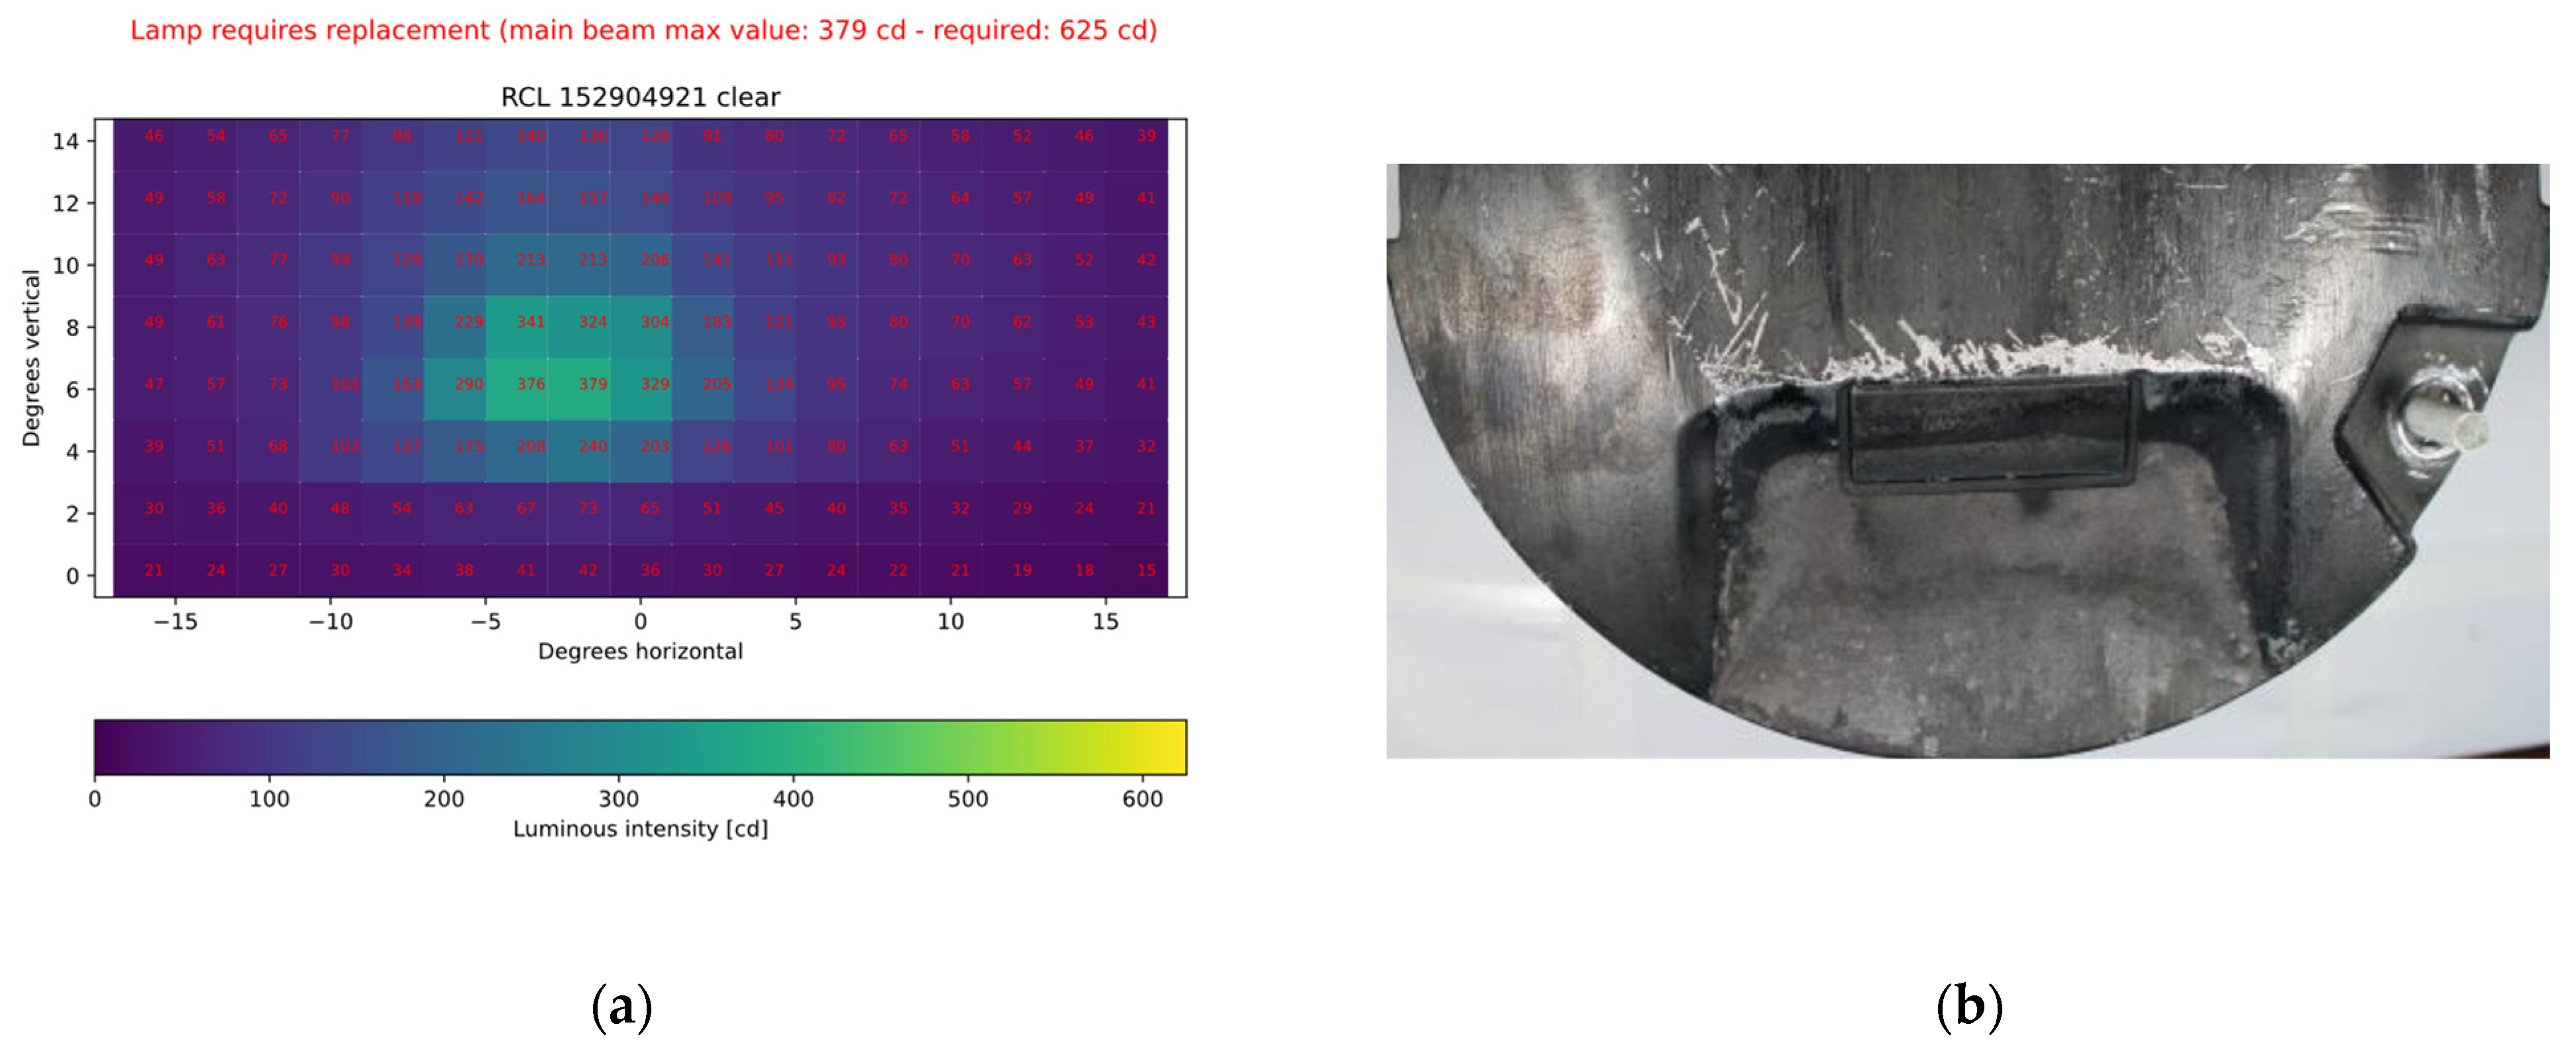
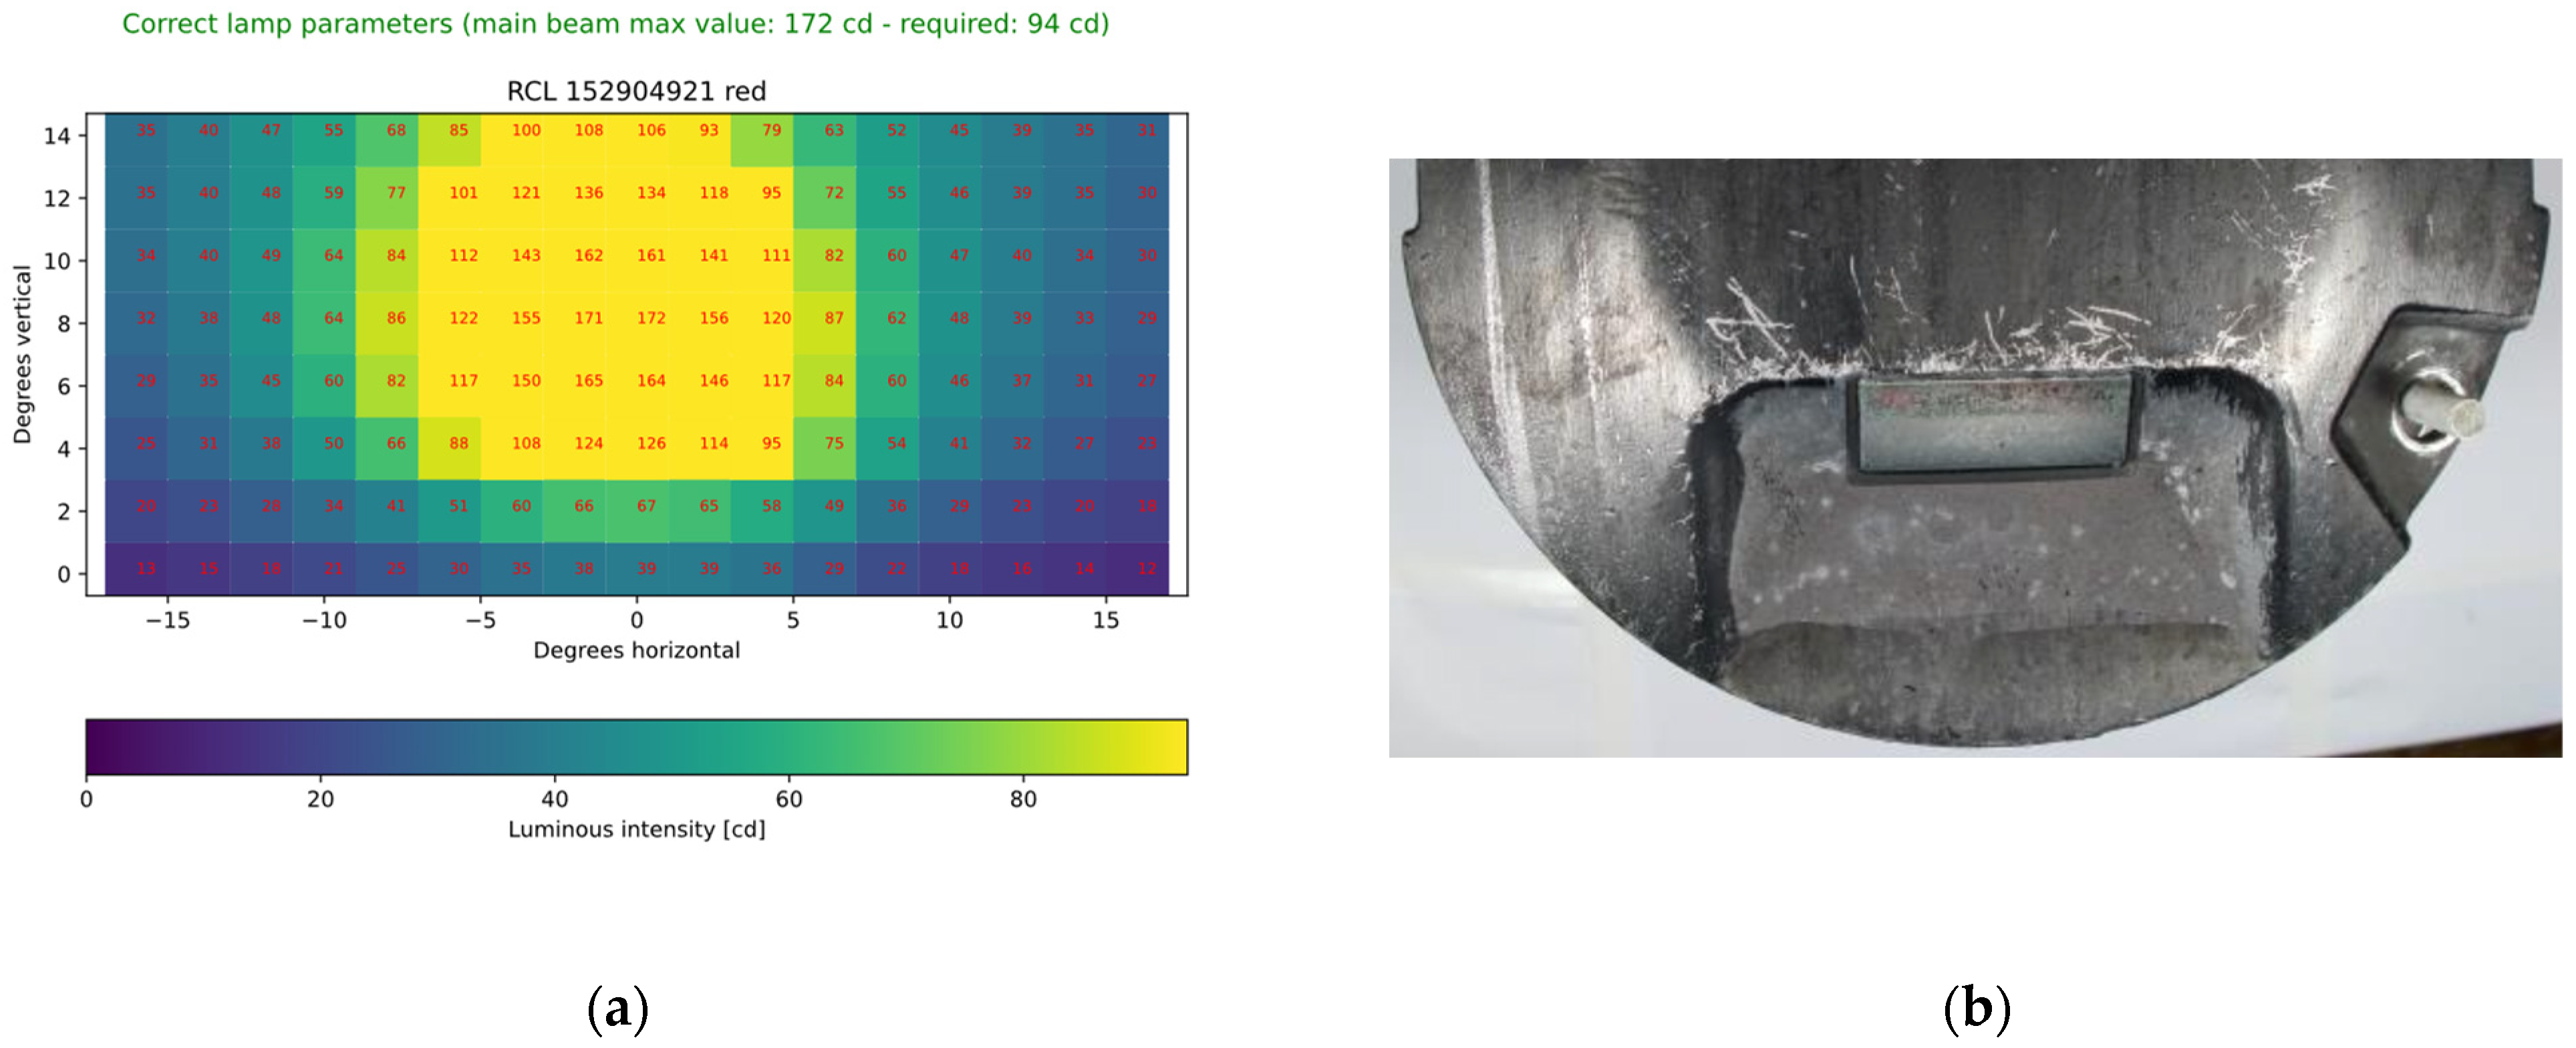
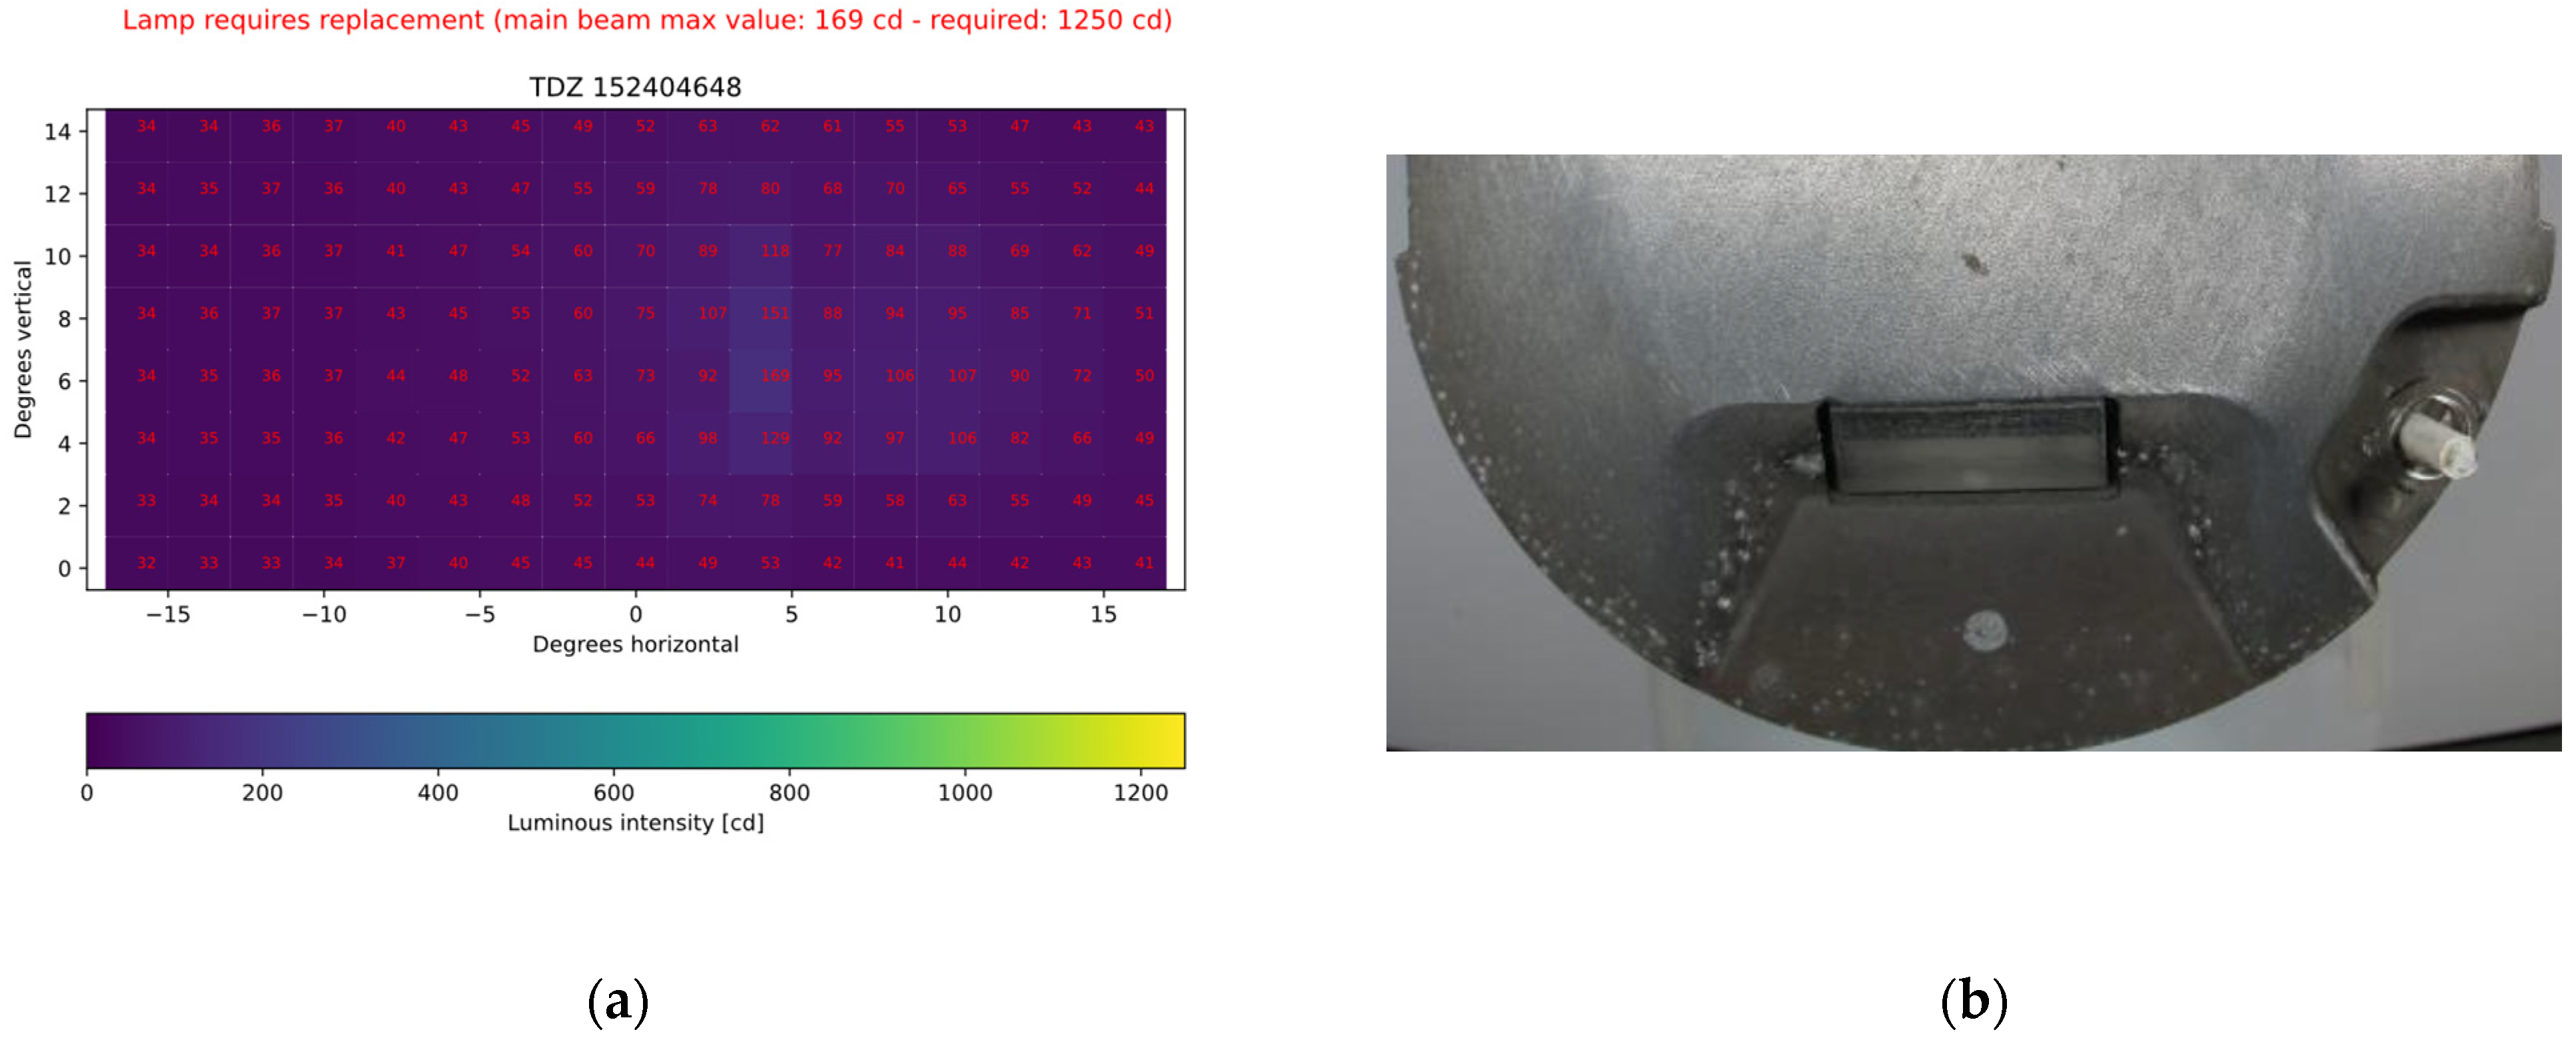
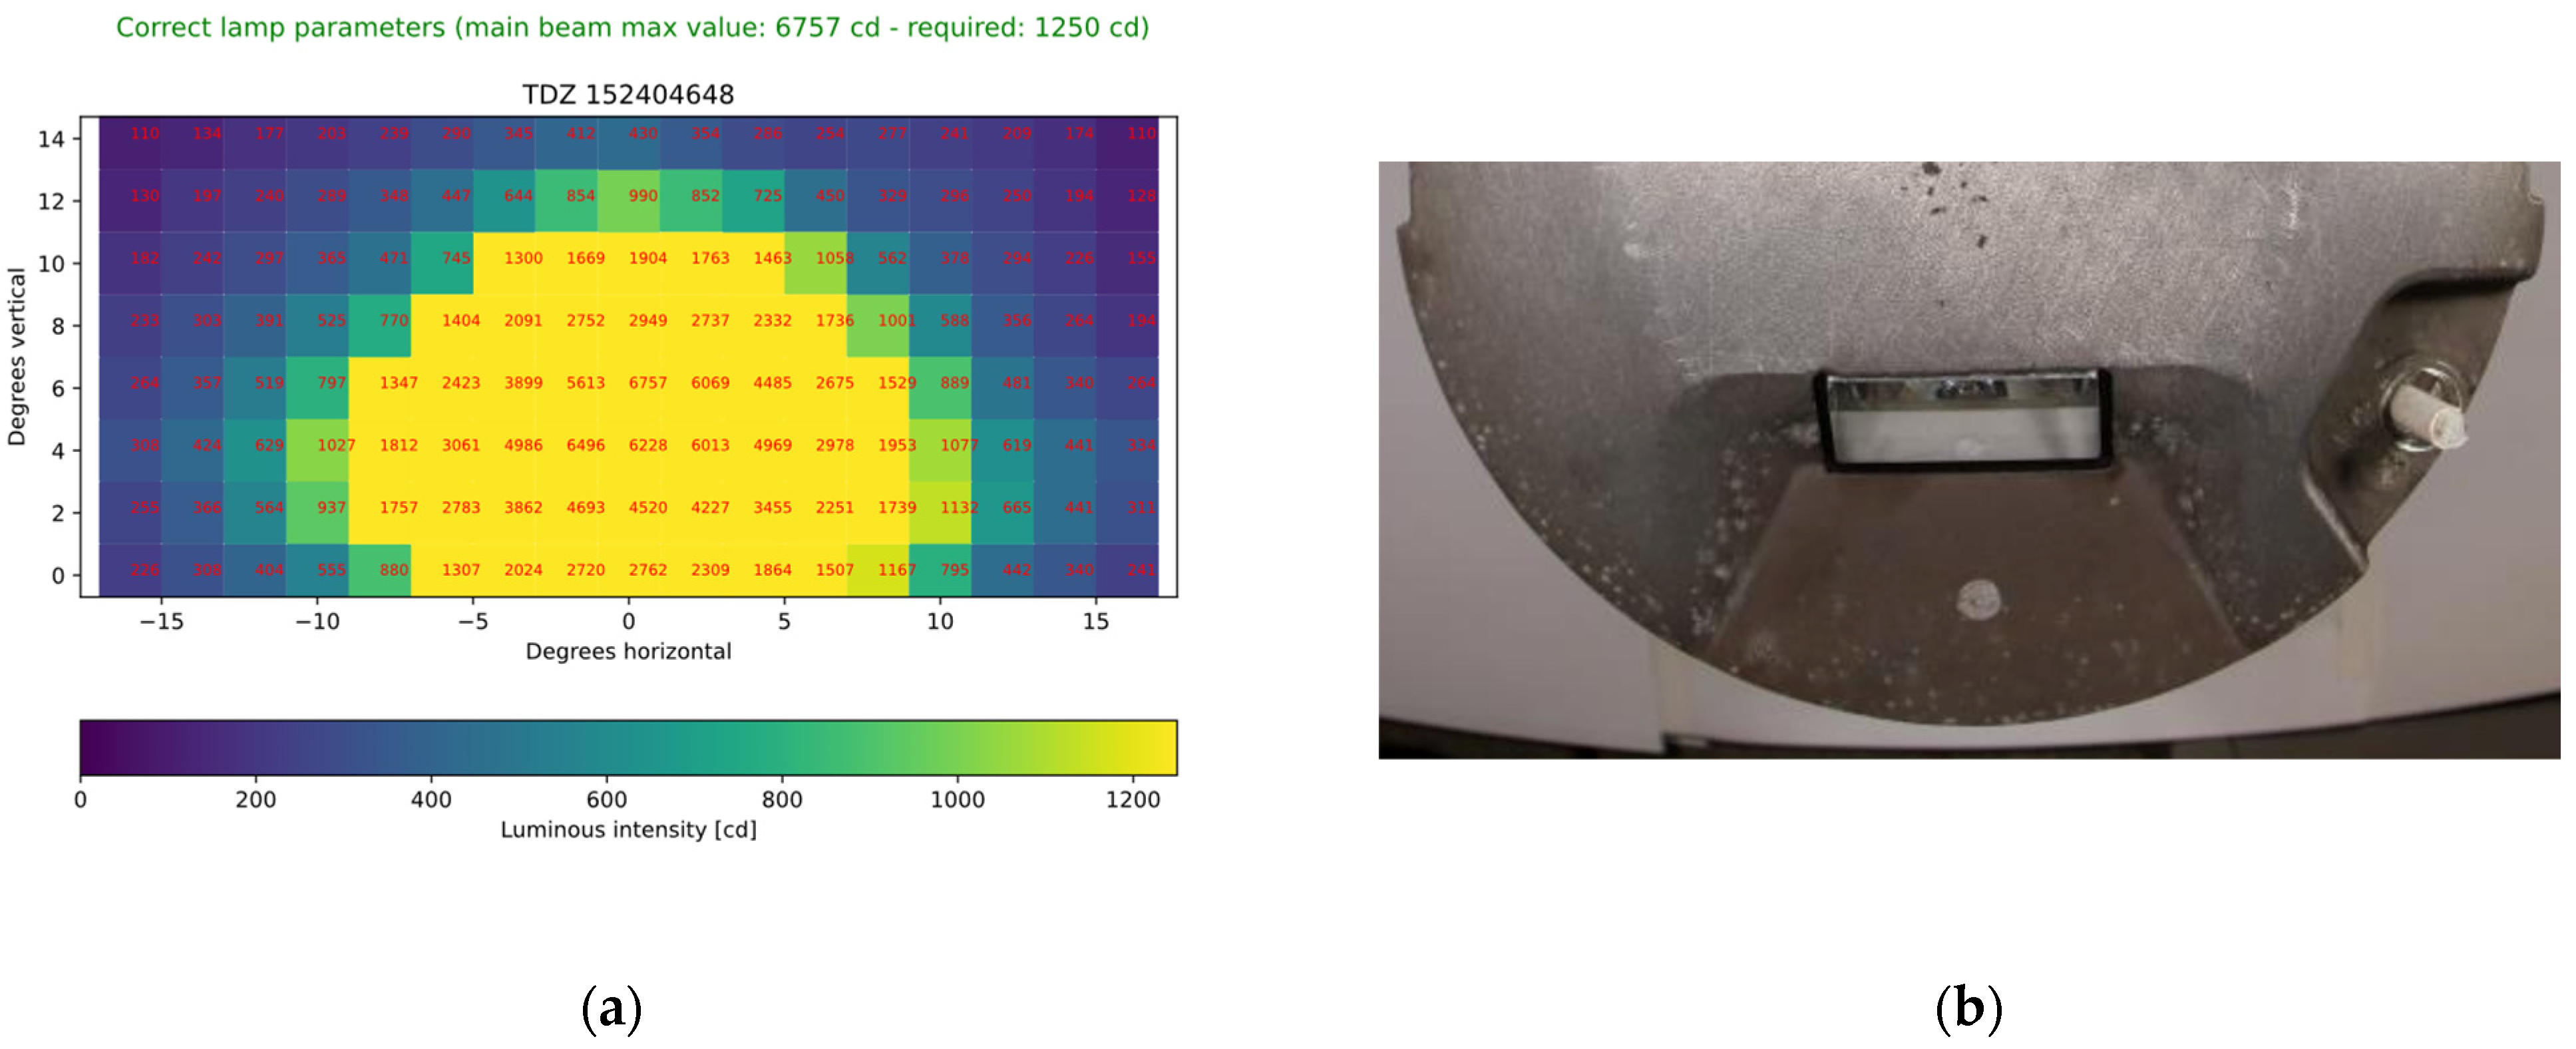
The results of measurements carried out with the use of a device for automatic control of in-pavement navigation lamps are heatmap graphs showing the distribution of luminous intensity at measurement points depending on the position of the sensor moving horizontally and vertically in relation to the light source. They illustrate, similarly to the graphs presented in the standards, the location of the main light beam, which is a key element when assessing the efficiency of airport lamps. The scale of the graph is selected depending on the type of lamp and the colour of the light emitted by it. Values close to and exceeding the minimum indicated by the standard are yellow, while with a decrease in the value, they turn to a blue shade.
Figure 22,
Figure 23 and
Figure 24 show exemplary graphs of the luminous intensity characteristics as a function of horizontal and vertical angles for the selected lamps that require repair.
The heatmaps presented of the photometric characteristics of the lamps show a significant deterioration in the values of the intensity of the light beam. In the case of the RCL clear lamp (
Figure 22), the main light beam is well below normal values, as shown by the dark colour on the scale. In the case of a lamp of the same type but emitting red light (
Figure 23), it still meets the EASA requirements, but a significant decrease in the luminous intensity value can be observed. For the touchdown zone lamp (
Figure 24), it is impossible to clearly distinguish the area in which the main beam is located on the graph due to the strong degradation of the prism.
After the lamps were refurbished, consisting of the replacement of prisms, cleaning or replacement of the housing, replacement of halogen light sources, and sealing, the photometric characteristics were re-examined. The test results showed that all the in-pavement navigation lighting lamps met the required standards, significantly exceeding the prescribed minima.
Figure 25,
Figure 26 and
Figure 27 are heat maps of photometric characteristics for luminaires with the same serial numbers as those shown in
Figure 22,
Figure 23 and
Figure 24.
The heatmaps presented with photometric characteristics confirm the efficiency of the luminaires. In any case, the clearly marked main beam of light significantly exceeds the minimum values prescribed by the standards. These lamps can be reused on airport surfaces. The angular pattern shows the exact location of the main beam that runs in an area that corresponds to brand-new lamps.
Experiments carried out with a device for automatic control of in-pavement lamps for navigation lighting showed the importance of using such a system to test photometric parameters under laboratory conditions. Thanks to this system, it is possible to select lamps that, despite their operation, allow for further use and indicate those that require maintenance. After such a process is performed, further operation is possible, which is equivalent to meeting the required standards.
7. Conclusions
The aim of the paper was to present the aspects related to the measurement of the luminous intensity distribution of airport lamps. The proposed solution allows automatic assessment of angular relationships of light distribution reported in the form of user-friendly heatmaps.
Digital illuminance sensors that enable a relatively simple construction of devices have sufficient measuring range and accuracy. Experiments conducted for standardised airport lamps’ power supply thresholds allowed us to compare the BH1750 sensor with the reference Sonopan L-200P luxmeter. The aspect of measurement stability depending on the BH1750 work mode was investigated. Due to the fact that airport lamps operate in high ranges of illuminance it was possible to choose L-Resolution Mode that brings the advantage of faster data acquisition time.
Analysis of the BH1750 sensor spectral response showed the need to apply a mathematical correction to the obtained measurements for different light colours. The use of the Curve Fitter App in the Matlab environment allowed for the determination of approximate polynomial equations, the implementation of which let the spectral characteristics of the sensor used be corrected to the reference value of certified luxmeter.
As part of scientific and research cooperation with the Poznań-Ławica Airport, 498 lamps that came from operation on the runway were tested. The inspection (internal airport report) showed that 7% of the lamps had a degree of wear close to the limit value. These lamps still met the standards; however, the detection of a reduction in photometric parameters contributed to the more frequent inspections and maintenance of a fully functioning navigation lighting system. Such preventive inspections enable the airport to precisely assess the 2D spatial distribution of luminous intensity and compare them in relation to EASA standards.
Author Contributions
Conceptualization, K.P., T.M. and J.S.; methodology, K.P., T.M. and J.S.; software, K.P.; validation, K.P., T.M. and J.S.; formal analysis, K.P., T.M. and J.S.; investigation, K.P., T.M. and J.S.; resources, K.P and T.M.; writing—original draft preparation, K.P., T.M. and J.S.; writing—review and editing, K.P., T.M. and J.S.; visualization, K.P.; supervision K.P., T.M. and J.S.; project administration, K.P., T.M. and J.S.; funding acquisition, K.P., T.M. and J.S. All authors have read and agreed to the published version of the manuscript.
Funding
This research was funded partly by the 2022 subvention and partly by the SMART4ALL EU Horizon 2020 project, Grant Agreement No. 872614.
Data Availability Statement
The data presented in this study are available on request from the corresponding author. The data are not publicly available due to privacy.
Conflicts of Interest
The authors declare no conflict of interest.
References
- European Union Aviation Safety Agency Easy Access Rules for Aerodromes (Regulation (EU) No 139/2014). Available online: https://www.easa.europa.eu/en/downloads/98016/en (accessed on 11 January 2023).
- Polish Air Navigation Services Agency. Polityka Bezpieczeństwa. Available online: https://www.pansa.pl/wp-content/uploads/2022/02/Polityka-bezpieczenstwa-PAZP.pdf (accessed on 28 September 2023).
- Safegate Group. Airfield Lighting Manual IDM 5581 Bidirectional Runway Centerline with Two Lamps-48W; Safegate Group: Zaventem, Belgium, 2012. [Google Scholar]
- Safegate Group. Airfield Lighting Manual 8” Inset Lights–IDM 4671, IDM 4581, IDM 4582–Touchdown Zone; Safegate Group: Zaventem, Belgium, 2010. [Google Scholar]
- OSRAM GmbH, ‘64319 Z/C 45-15’. Available online: https://www.osram.com/ecat/Halogen%20lamps,%20current-controlled%20with%20PK30d%20base-Halogen%20lamps,%20current-controlled%20(Airfield)-Halogen%20lamps-Industry-Specialty%20Lighting/com/en/GPS01_1028540/ZMP_56198/ (accessed on 25 September 2022).
- Tomas, N.; Jan, D.; Vaclav, K.; Karel, S.; Richard, B. Solution of problems with short lifetime of airfield halogen lamps. In Proceedings of the 2017 18th International Scientific Conference on Electric Power Engineering (EPE), Kouty nad Desnou, Czech Republic, 17–19 May 2017; pp. 1–5. [Google Scholar] [CrossRef]
- Suder, J.; Maciejewski, P.; Podbucki, K.; Marciniak, T.; Dąbrowski, A. Platforma pomiarowa do badania jakości działania lamp lotniskowych. Pomiary Autom. Robot. 2019, 23, 5–13. [Google Scholar] [CrossRef]
- Suder, J.; Podbucki, K.; Marciniak, T.; Dąbrowski, A. Spectrum sensors for detecting type of airport lamps in a light photometry system. Opto-Electronics Review. Opto-Electron. Rev. 2021, 29, 133–140. [Google Scholar] [CrossRef]
- FB Technology. PAC MATRIX AGL Photometric Tester (Airfield Ground Lighting). Available online: https://www.fbtechnology.com/our-products-agl-photometric-maintenance/agl-photometric-tester/ (accessed on 29 September 2022).
- FB Technology. PAC LAB II Workshop Photometry Controller. Available online: https://www.fbtechnology.com/our-products-agl-photometric-maintenance/worskshop-photometry-controller/ (accessed on 29 September 2022).
- Airsafe Airport Equipment Co., Ltd. Elevated Lamp Digital Calibrator (Unidirectional). Available online: http://www.airsafe.com.cn/index.php?m=content&c=index&a=show&catid=155&id=52 (accessed on 29 September 2022).
- DeWiTec GmbH. DALMAS AFL Analysis. Available online: https://www.dewitec.de/en/airport-technology/dalmas-afl-analysis (accessed on 29 September 2022).
- Wichmann, S. Verfahren und Vorrichtung zur Überprüfung von Leuchtmitteln und Lichtsignalen. EP1366989B1, 27 May 2002. [Google Scholar]
- FB Technology. PAC2 V5 Photometric Airfield Calibration. Available online: https://www.fbtechnology.com/our-products-agl-photometric-maintenance/airfield-lighting-photometric-measurement/ (accessed on 29 September 2022).
- FB Technology. MARC ONE Smart Robot for Airfield Maintenance. Available online: https://www.fbtechnology.com/our-products-agl-photometric-maintenance/marc-one-agl-maintenance-robot/ (accessed on 29 September 2022).
- Sitompul, D.S.D.; Surya, F.E.; Suhandi, F.P.; Zakaria, H. Horizontal Scanning Method by Drone Mounted Photodiode Array for Runway Edge Light Photometry. In Proceedings of the 2019 International Seminar on Intelligent Technology and Its Applications (ISITIA), Surabaya, Indonesia, 28–29 August 2019; pp. 41–45. [Google Scholar] [CrossRef]
- Podbucki, K.; Suder, J.; Marciniak, T.; Mańczak, W.; Dąbrowski, A. Microprocessor-based photometric light intensity sensor for airport lamps quality testing. Opto-Electron. Rev. 2022, 30, e143396-1–e143396-7. [Google Scholar] [CrossRef]
- 8° 57mm Hybrid Stepper Motor-NEMA23. Available online: https://botland.com.pl/index.php?controller=attachment&id_attachment=1087 (accessed on 23 November 2023).
- Śliwicki, M.; Wawrzyniak, D. System for Testing the Lighting Intensity of Airport Lamps. Bachelor’s Thesis, Poznan University of Technology, Poznań, Poland, 2019. [Google Scholar]
- DFROBOT. TB6600 Stepper Motor Driver User Guide Version: V1.2; DFROBOT: Shanghai, China, 2022. [Google Scholar]
- Krac, E.; Górecki, K. Wpływ kąta padania światła na wartości natężenia oświetlenia zmierzone za pomocą czujników fotometrycznych. Przegląd Elektrotechniczny 2021, 97, 214–217. [Google Scholar] [CrossRef]
- Ptak, P.; Górecki, K.; Gensikowski, M. Porównanie właściwości dynamicznych wybranych czujników fotometrycznych. Przegląd Elektrotechniczny 2020, 96, 112–116. [Google Scholar] [CrossRef]
- ROHM Co., Ltd. Ambient 16bit Serial Output Type Ambient Light Sensor IC BH1750FVI Rev.B.; ROHM Co., Ltd.: Kyoto, Japan, 2009. [Google Scholar]
- Sonopan. Precision Luxmeter L-200 with P-200 L-200P. Available online: https://www.sonopan.com.pl/en/products/light/precision-illuminance-meter-l-200-with-p-200/ (accessed on 19 October 2023).
- MathWorks. Matlab Curve Fitter App. Available online: https://uk.mathworks.com/help/curvefit/curvefitter-app.html (accessed on 19 October 2023).
Figure 1.
Runway centerline lamps—new (a) and damaged (b).
Figure 1.
Runway centerline lamps—new (a) and damaged (b).
Figure 2.
Isocandela diagram for touchdown zone lamp (white light) [
1].
Figure 2.
Isocandela diagram for touchdown zone lamp (white light) [
1].
Figure 3.
General concept of measuring device.
Figure 3.
General concept of measuring device.
Figure 4.
Mounting socket for the tested lamp [
19].
Figure 4.
Mounting socket for the tested lamp [
19].
Figure 5.
View of the device with marked key elements.
Figure 5.
View of the device with marked key elements.
Figure 6.
Measurements of illuminance in the 2.8A power mode: (a) linear chart; (b) statistical chart.
Figure 6.
Measurements of illuminance in the 2.8A power mode: (a) linear chart; (b) statistical chart.
Figure 7.
Measurements of illuminance in the 3.4A power mode: (a) linear chart; (b) statistical chart.
Figure 7.
Measurements of illuminance in the 3.4A power mode: (a) linear chart; (b) statistical chart.
Figure 8.
Measurements of illuminance in the 4.1A power mode: (a) linear chart; (b) statistical chart.
Figure 8.
Measurements of illuminance in the 4.1A power mode: (a) linear chart; (b) statistical chart.
Figure 9.
Measurements of illuminance in the 5.2A power mode: (a) linear chart; (b) statistical chart.
Figure 9.
Measurements of illuminance in the 5.2A power mode: (a) linear chart; (b) statistical chart.
Figure 10.
Measurements of illuminance in the 6.6A power mode: (a) linear chart; (b) statistical chart.
Figure 10.
Measurements of illuminance in the 6.6A power mode: (a) linear chart; (b) statistical chart.
Figure 11.
Spectral characteristic of BH1750 sensor and Sonopan L-200P luxmeter.
Figure 11.
Spectral characteristic of BH1750 sensor and Sonopan L-200P luxmeter.
Figure 12.
BH1750 correction for touchdown zone lamp (TDZ).
Figure 12.
BH1750 correction for touchdown zone lamp (TDZ).
Figure 13.
BH1750 correction for runway centerline clear lamp (RCL Clear).
Figure 13.
BH1750 correction for runway centerline clear lamp (RCL Clear).
Figure 14.
BH1750 correction for runway centerline red lamp (RCL Red).
Figure 14.
BH1750 correction for runway centerline red lamp (RCL Red).
Figure 15.
BH1750 correction for taxiway green lamp (TAXI Green).
Figure 15.
BH1750 correction for taxiway green lamp (TAXI Green).
Figure 16.
BH1750 correction for taxiway yellow lamp (TAXI Yellow).
Figure 16.
BH1750 correction for taxiway yellow lamp (TAXI Yellow).
Figure 17.
Luminous intensity measurements of TDZ lamp: (a) Sonopan L-200P, (b) BH1750.
Figure 17.
Luminous intensity measurements of TDZ lamp: (a) Sonopan L-200P, (b) BH1750.
Figure 18.
Luminous intensity measurements of RCL clear lamp: (a) Sonopan L-200P, (b) BH1750.
Figure 18.
Luminous intensity measurements of RCL clear lamp: (a) Sonopan L-200P, (b) BH1750.
Figure 19.
Luminous intensity measurements of RCL red lamp: (a) Sonopan L-200P, (b) BH1750.
Figure 19.
Luminous intensity measurements of RCL red lamp: (a) Sonopan L-200P, (b) BH1750.
Figure 20.
Luminous intensity measurements of TAXI green lamp: (a) Sonopan L-200P, (b) BH1750.
Figure 20.
Luminous intensity measurements of TAXI green lamp: (a) Sonopan L-200P, (b) BH1750.
Figure 21.
Luminous intensity measurements of TAXI yellow lamp: (a) Sonopan L-200P, (b) BH1750.
Figure 21.
Luminous intensity measurements of TAXI yellow lamp: (a) Sonopan L-200P, (b) BH1750.
Figure 22.
Luminous intensity measurements of used RCL clear lamp: (a) heatmap chart; (b) lamp view.
Figure 22.
Luminous intensity measurements of used RCL clear lamp: (a) heatmap chart; (b) lamp view.
Figure 23.
Luminous intensity measurements of used RCL red lamp: (a) heatmap chart; (b) lamp view.
Figure 23.
Luminous intensity measurements of used RCL red lamp: (a) heatmap chart; (b) lamp view.
Figure 24.
Luminous intensity measurements of used TDZ: (a) heatmap chart; (b) lamp view.
Figure 24.
Luminous intensity measurements of used TDZ: (a) heatmap chart; (b) lamp view.
Figure 25.
Luminous intensity measurements of refurbished RCL clear lamp: (a) heatmap chart; (b) lamp view.
Figure 25.
Luminous intensity measurements of refurbished RCL clear lamp: (a) heatmap chart; (b) lamp view.
Figure 26.
Luminous intensity measurements of refurbished RCL red lamp: (a) heatmap chart; (b) lamp view.
Figure 26.
Luminous intensity measurements of refurbished RCL red lamp: (a) heatmap chart; (b) lamp view.
Figure 27.
Luminous intensity measurements of refurbished TDZ: (a) heatmap chart; (b) lamp view.
Figure 27.
Luminous intensity measurements of refurbished TDZ: (a) heatmap chart; (b) lamp view.
Table 1.
BH1750 measurement modes [
23].
Table 1.
BH1750 measurement modes [
23].
| Measurement Mode | Measurement Time (ms) | Resolution (lx) |
|---|
| L-Resolution Mode | Typ. 16 | 4 |
| H-Resolution Mode | Typ. 120 | 1 |
| H-Resolution Mode2 | Typ. 120 | 0.5 |
Table 2.
Results of the BH1750 experiment.
Table 2.
Results of the BH1750 experiment.
| Airport Lamp Mode | Type of Data | L-Resolution Mode (lx) | H-Resolution Mode (lx) | H-Resolution Mode 2 (lx) | Sonopan (lx) |
|---|
| 2.8A (1%) | Mean | 3.38 | 5.00 | 4.60 | 4.42 |
| Median | 3.33 | 5.00 | 4.58 | 4.42 |
| Standard deviation | 0.39 | 0.00 | 0.09 | 0.03 |
| 3.4A (3%) | Mean | 60.83 | 61.53 | 61.25 | 59.24 |
| Median | 60.83 | 61.67 | 61.25 | 59.30 |
| Standard deviation | 0.00 | 0.32 | 0.00 | 0.26 |
| 4.1A (10%) | Mean | 362.94 | 361.93 | 360.64 | 355.49 |
| Median | 363.33 | 361.67 | 360.83 | 355.60 |
| Standard deviation | 0.41 | 0.39 | 0.32 | 1.18 |
| 5.2A (30%) | Mean | 1983.20 | 1993.27 | 2002.87 | 1985.91 |
| Median | 1983.33 | 1993.33 | 2002.92 | 1988.00 |
| Standard deviation | 1.46 | 0.78 | 1.07 | 11.54 |
| 6.6A (100%) | Mean | 7948.31 | 7937.18 | 7938.47 | 7946.43 |
| Median | 7950.00 | 7937.50 | 7938.33 | 7947.00 |
| Standard deviation | 2.67 | 3.65 | 2.68 | 2.91 |
Table 3.
Results of the BH1750 and Sonopan L-200P measurement.
Table 3.
Results of the BH1750 and Sonopan L-200P measurement.
| Airport Lamp Mode | TDZ | RCL C/C Clear I | RCL C/C Clear II | RCL C/R Clear | RCL C/R Red | TAXI G/Y Green | TAXI G/Y
Yellow |
|---|
| BH1750 (lx] | L-200P (lx) | BH1750 (lx) | L-200P (lx) | BH1750 (lx) | L-200P (lx) | BH1750 (lx) | L-200P (lx) | BH1750 (lx) | L-200P (lx) | BH1750 (lx) | L-200P (lx) | BH1750 (lx) | L-200P (lx) |
|---|
| 2.8A (1%) | 4.00 | 4.05 | 4.00 | 3.97 | 4.00 | 3.74 | 3.00 | 2.65 | 3.00 | 1.74 | - | - | - | - |
| 3.4A (3%) | 112.00 | 101.26 | 63.00 | 57.88 | 56.00 | 51.03 | 52.00 | 48.28 | 29.00 | 18.70 | - | - | 5.00 | 4.35 |
| 4.1A (10%) | 320.00 | 386.50 | 392.00 | 361.20 | 341.00 | 311.74 | 370.00 | 337.02 | 185.80 | 118.48 | 19.00 | 19.29 | 31.00 | 28.64 |
| 5.2A (30%) | 2234.60 | 2022.40 | 2321.60 | 2141.40 | 1969.20 | 1804.80 | 2336.80 | 2069.20 | 1017.40 | 648.44 | 114.00 | 116.58 | 198.00 | 182.52 |
| 6.6A (100%) | 9598.60 | 8728.00 | 9341.40 | 8658.00 | 8312.40 | 7600.00 | 9278.00 | 8488.00 | 3760.80 | 2410.60 | 501.00 | 511.54 | 789.80 | 759.42 |
Table 4.
Goodness of fit parameters for the calculated polynomial conversion equations.
Table 4.
Goodness of fit parameters for the calculated polynomial conversion equations.
| Lamp Type | TDZ | RCL Clear | RCL Red | TAXI Green | TAXI Yellow |
|---|
| Equation Number | 1 | 6 | 2 | 7 | 3 | 8 | 4 | 5 | 9 |
|---|
| SSE | 936.9456 | 6780.5 | 8500.9 | 9828.9 | 0 | 0.1289 | 0 | 0 | 0.1881 |
| R-square | 1 | 0.9999 | 0.9999 | 0.9999 | 1 | 1 | 1 | 1 | 1 |
| DFE | 1 | 2 | 6 | 7 | 0 | 2 | 0 | 0 | 1 |
| Adj R-sq | 0.9999 | 0.9998 | 0.9999 | 0.9999 | NaN | 1 | NaN | NaN | 1 |
| RMSE | 30.6096 | 58.2258 | 37.6406 | 37.4716 | NaN | 0.2539 | NaN | NaN | 0.4338 |
| Disclaimer/Publisher’s Note: The statements, opinions and data contained in all publications are solely those of the individual author(s) and contributor(s) and not of MDPI and/or the editor(s). MDPI and/or the editor(s) disclaim responsibility for any injury to people or property resulting from any ideas, methods, instructions or products referred to in the content. |
© 2023 by the authors. Licensee MDPI, Basel, Switzerland. This article is an open access article distributed under the terms and conditions of the Creative Commons Attribution (CC BY) license (https://creativecommons.org/licenses/by/4.0/).


