1. Introduction
The addition of clay to the sand material used in the top layers of green parks is usually needed to improve the subsurface material with regard to strength, hydraulic conductivity, chemistry, and nutrients. The elements of thermal conductivity and temperature are rarely investigated. The degree of temperature makes a difference when park visitors use the facility. When little or more clay content is used, different temperature profiles and changes are expected. It is known that subsurface soils gain heat slowly and lose it slowly. Green areas used as parks can be conditioned to create more comfortable weather, if the design is optimized.
The thermal properties of clay–sand mixtures used in green park post-applications have received little attention. However, in order to maximize the effectiveness and convenience of green park infrastructures, it is essential to understand the thermal behavior of these combinations. The characterization of the thermal conductivity and thermal diffusivity of clay–sand mixtures is one research gap in this field. These characteristics affect the materials’ capacity for thermal storage and thermal insulation, as well as the pace at which heat is transferred inside them. Investigating the differences in these characteristics with varying moisture levels and clay-to-sand ratios would yield insightful information for improving the thermal performance of green park subsoils.
Further research is needed to determine the thermal stability of clay–sand mixtures under cyclic heating and cooling circumstances, which are other significant factors. Analyzing the effects of numerous temperature cycles on the mixes’ mechanical qualities and structural soundness is part of this process. The results of this study can be used to highlight probable heat-related changes that need to be taken into account to develop effective mitigation plans.
Overall, the thermal properties of clay–sand mixtures used in green park post-applications constitute a developing field of study that still includes a number of knowledge gaps. Researchers can aid in the creation of more dependable and effective green park infrastructure through examining these gaps.
Solid particles determine how heat moves and other thermal characteristics. Both air and water can be found inside these pores, and both have an impact on heat storage and transfer. The temperature profile of the soil below grade level is generally influenced by the type of material, moisture content, and degree of compaction of the soil, as stated by Dafalla [
1]. Temperature variations and the conditions of the strata’s moisture content are closely related. The moisture content of clayey soil is significantly impacted by temperature variations. Considerable fluctuations in soil moisture levels can arise from temperature shifts between day and night, according to a study by Johnson et al. [
2]. While colder nighttime temperatures encourage water intake, high daytime temperatures can enhance evaporation, leading to soil desiccation. These cycles of moisture fluctuation can have an impact on soil permeability and soil structure in general.
Côté and Konrad [
3] investigated how various characteristics affect thermal conductivity. These included mineral composition, grain size distribution, particle shape, and porosity. Based on the aforementioned parameters, a model was created to forecast thermal conductivity. Nidal and Reederb [
4] pointed out that thermal conductivity can increase with an increase in soil density and water content. Thermal conductivity decreases with the addition of salts. When the same salt type and same concentrations are considered, sand’s thermal conductivity is higher than that of clay.
Heat capacity is generally defined as the ability of a material to store heat energy. This is similar to specific heat. The higher the specific heat, the more heat a material gains or loses. Air and water phases show different thermal conductivities and can affect the overall flow of heat. Heat conduction is influenced by soil composition, structure, and density, and by the geometry of pores. Farouki [
5] and Tien et al. [
6] considered three major parameters contributing to changes in the thermal conductivity of bentonite–sand mixtures. These are the proportion of bentonite/sand, the dry density (which can be a function of the void ratio), and the water content. Prediction models for subsoil temperature suggested in the literature require many parameters to be employed in order to establish a range of expected temperatures. Models based on computational approaches depend on energy balance calculation and heat transport in the soil to solve the heat equation. Other empirical models involve numerous parameters and measurements, which may not be readily available.
Boukella et al. [
7] stated that the thermal conductivity and thermal diffusivity increased significantly for clays compacted on the dry side of the compaction curve at high temperatures. Prediction models can be formulated based on the thermal characteristics of soils and ambient temperature [
8]. More advanced, thermo-enhanced viscoplastic models can also be utilized [
9,
10].
The thermal characteristics of soil materials, including thermal conductivity, thermal diffusivity, and specific heat capacity, have a significant impact on how much heat is gained and lost from them. Through laboratory trials, Xie et al.’s [
11] research looked into the thermal characteristics of clay and sand mixtures. They discovered that when the clay concentration rose, so did the combination of clay and sand’s heat conductivity. With more clay present, the specific heat capacity likewise rose, albeit more slowly. These results contribute to our understanding of clay–sand combination heat transfer behavior.
In order to examine the heat gain properties of compacted clay–sand mixes at various temperatures, Kim and Cho [
12] conducted laboratory studies. Due to clay’s higher thermal conductivity and lesser porosity, they discovered that as the clay content increases, the heat gain in the soil mixture increases. Sand particles changed the heat transmission channels, which also changed how much heat was gained. When studying the heat loss characteristics of compacted clay–sand mixtures, it is expected that as the clay content increases, the heat loss rate will decrease due to the reduction in pore size and the increased moisture content within the mixture.
When conducting laboratory experiments on compacted clay–sand mixtures subjected to different temperature conditions, the heat gain can increase significantly as the temperature increases from 30 °C to 50 °C. Similarly, the clay–sand mixtures at different temperatures will show a decrease in heat loss as the temperature drops from 50 to 30 degrees Celsius.
Knowledge of temporal fluctuations in soil temperature is also necessary for vegetation cover or plants. Many plant processes rely on the ambient and surrounding environment [
13]. Bergman et al. [
14] utilized Newton’s law of cooling, which relates the heat transfer coefficient λ to soil temperature Tsoil,t as follows:
Based on the fundamental rules of thermodynamics, several empirical models were developed to forecast soil thermal conductivity measurements [
6,
15,
16]. Due to the complexity of the fabric and the nonhomogeneous character of soils, such models need to use a lot of parameters in order to make accurate predictions. In order to arrive at a reliable estimation, predictions were primarily made based on summing up the proportions of composite materials.
Moreover, the use of clay-based liners may be complicated by desiccation fissures, which lower thermal conductivity and hydraulic efficiency. Under such circumstances, geosynthetics may be employed to improve mechanical crack resistance [
17,
18]. Aldaeef and Rayhani [
19] reported that there were noticeable improvements in the hydraulic performance of liners during various thermal wet–dry cycles, particularly for low-plastic clays. Although high-plasticity clays have a high ability to resist the effects of heat change, the medium-plasticity clays may also provide a comparable benefit [
20].
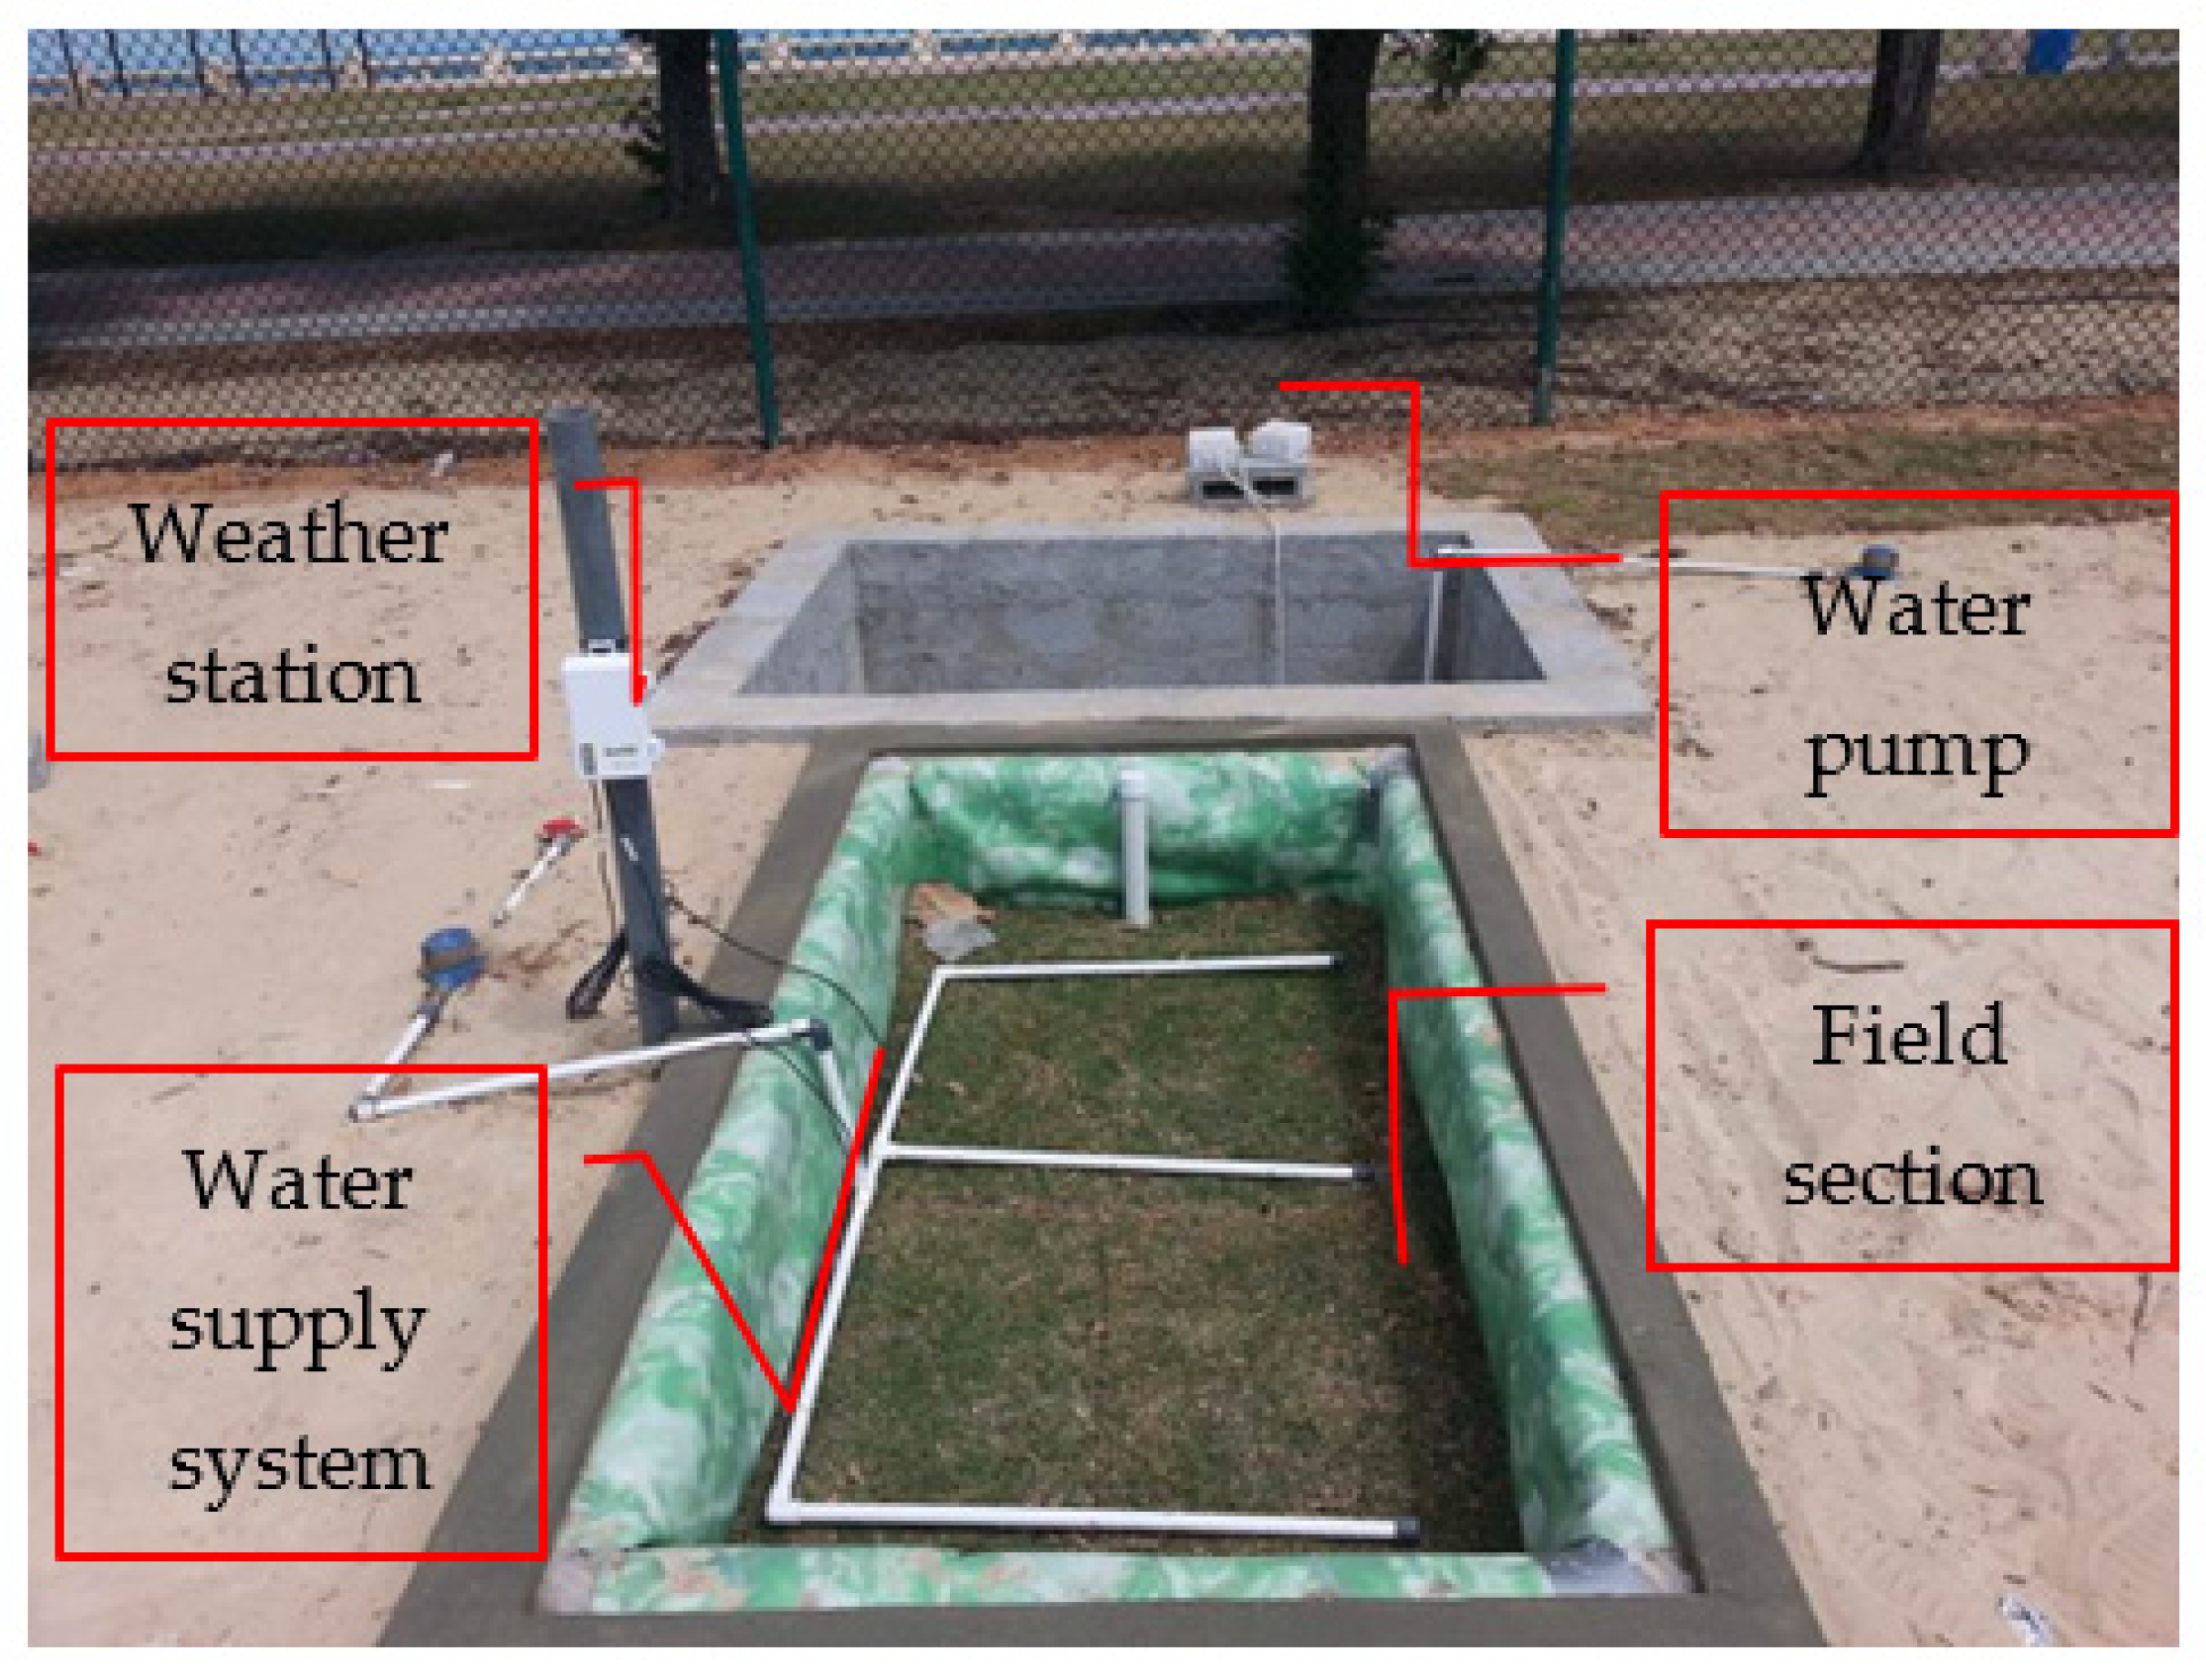
This work is composed of laboratory and field measurements for predicting soil temperature changes at different clay contents when subjected to variable-temperature environments. Three different liner mixtures of sand with 10%, 20%, and 30% clay were prepared, and the temperature gain/loss profiles were established at ambient temperatures of 30 °C, 40 °C, and 50 °C. In addition, the field profiles of liners with 15% and 30% of the same clay content were constructed, and the necessary instruments were provided to indicate the real gain/loss profile of the field temperature. The laboratory test results are compared to field measurements obtained for grass-vegetated layers.
3. Results
The main objective and scope of this study are to observe the rate at which heat buildup or gain is achieved in clay–sand layers exposed to a high temperature gradient. The temperature gradients created are as follows:
A 30 degree gradient (for material at a room temperature of 20 degrees, put into an oven at 50 degrees).
A 20 degree gradient (for material at a room temperature of 20 degrees, put into an oven at 40 degrees).
A 10 degree gradient (for material at a room temperature of 20 degrees, put into an oven at 30 degrees).
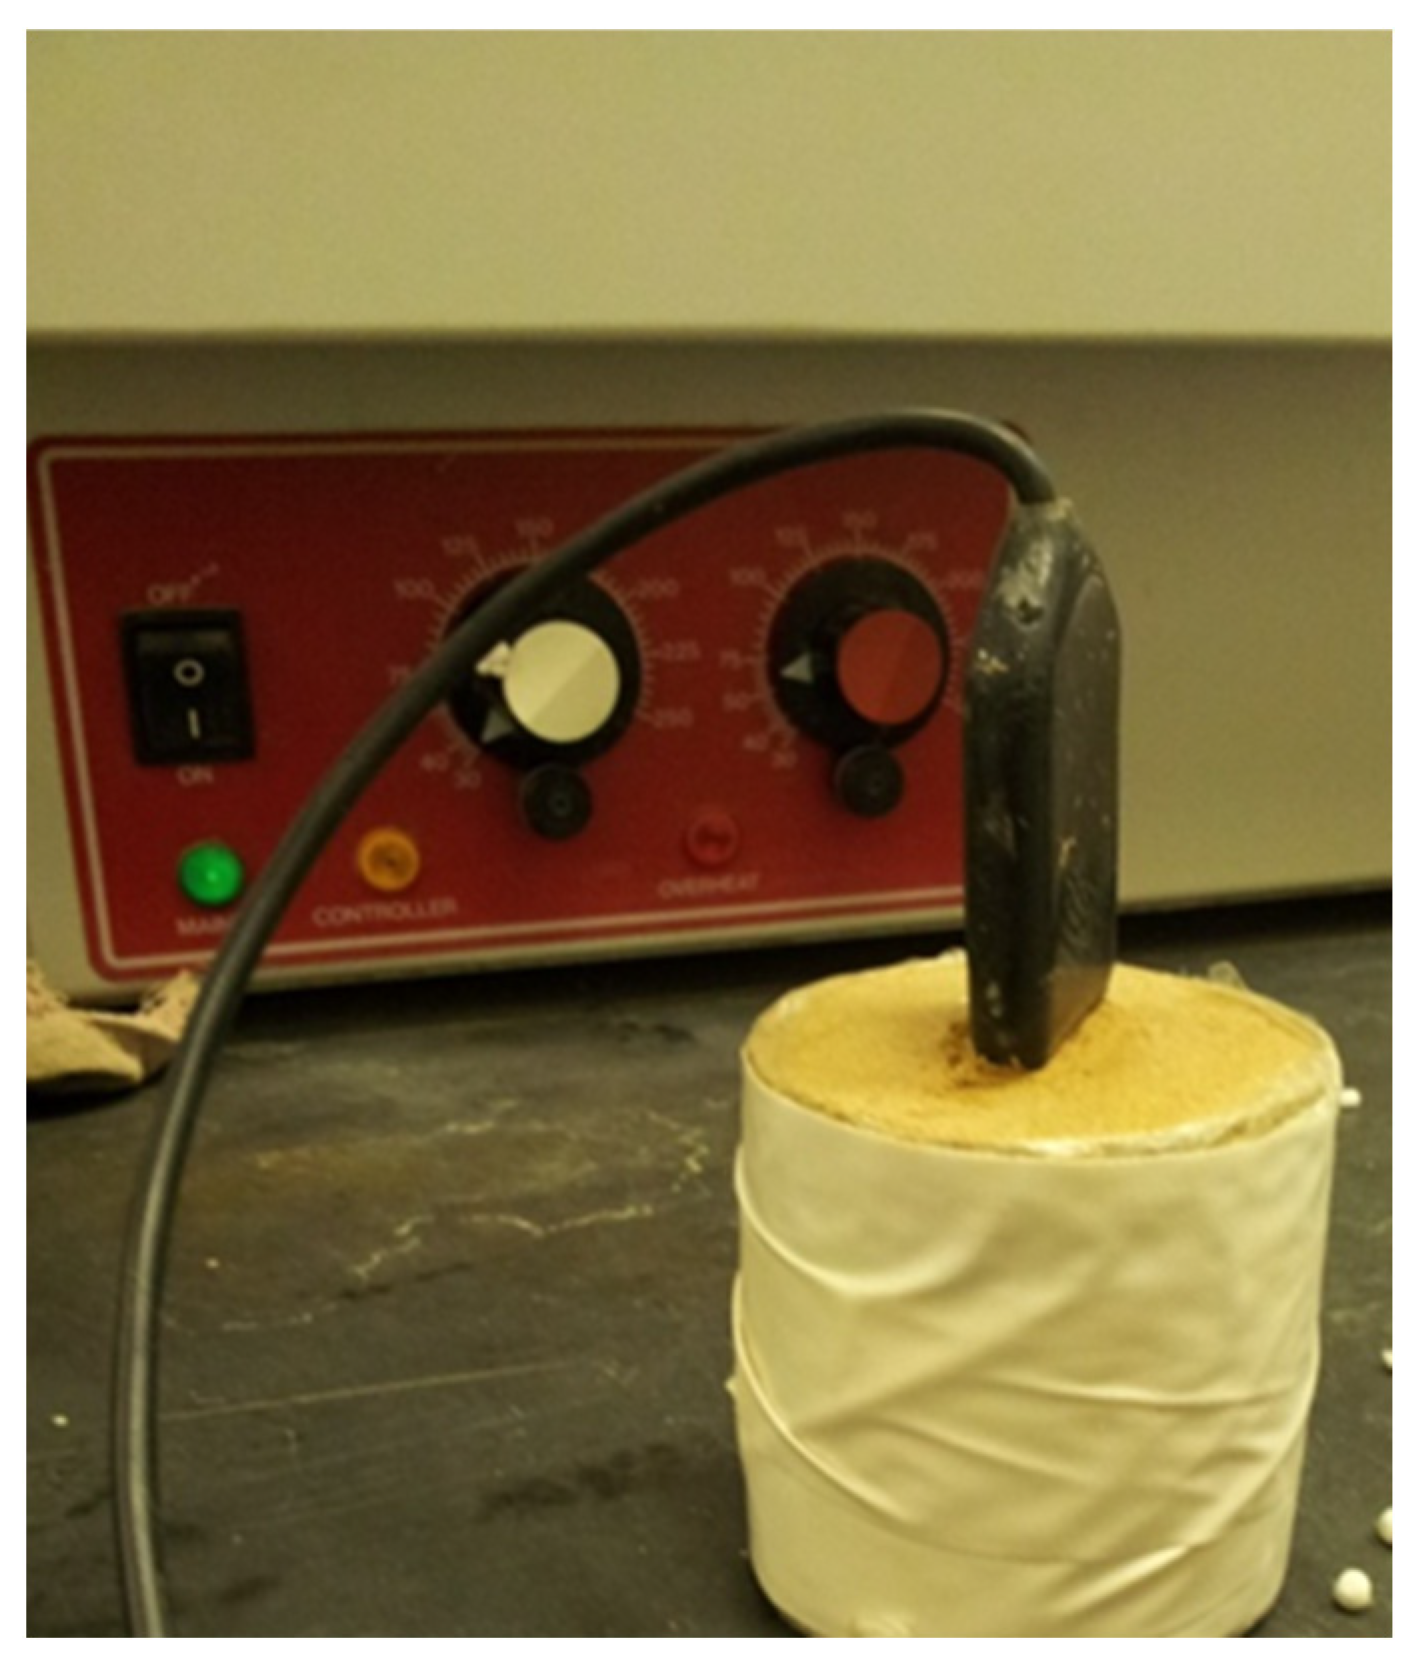
The temperature profiles of the compacted clay mixtures while in the oven for a period of 24 h are recorded by the 5TE sensors, just like temperatures when taken out of the oven and allowed to cool down to room temperature.
Figure 7,
Figure 8 and
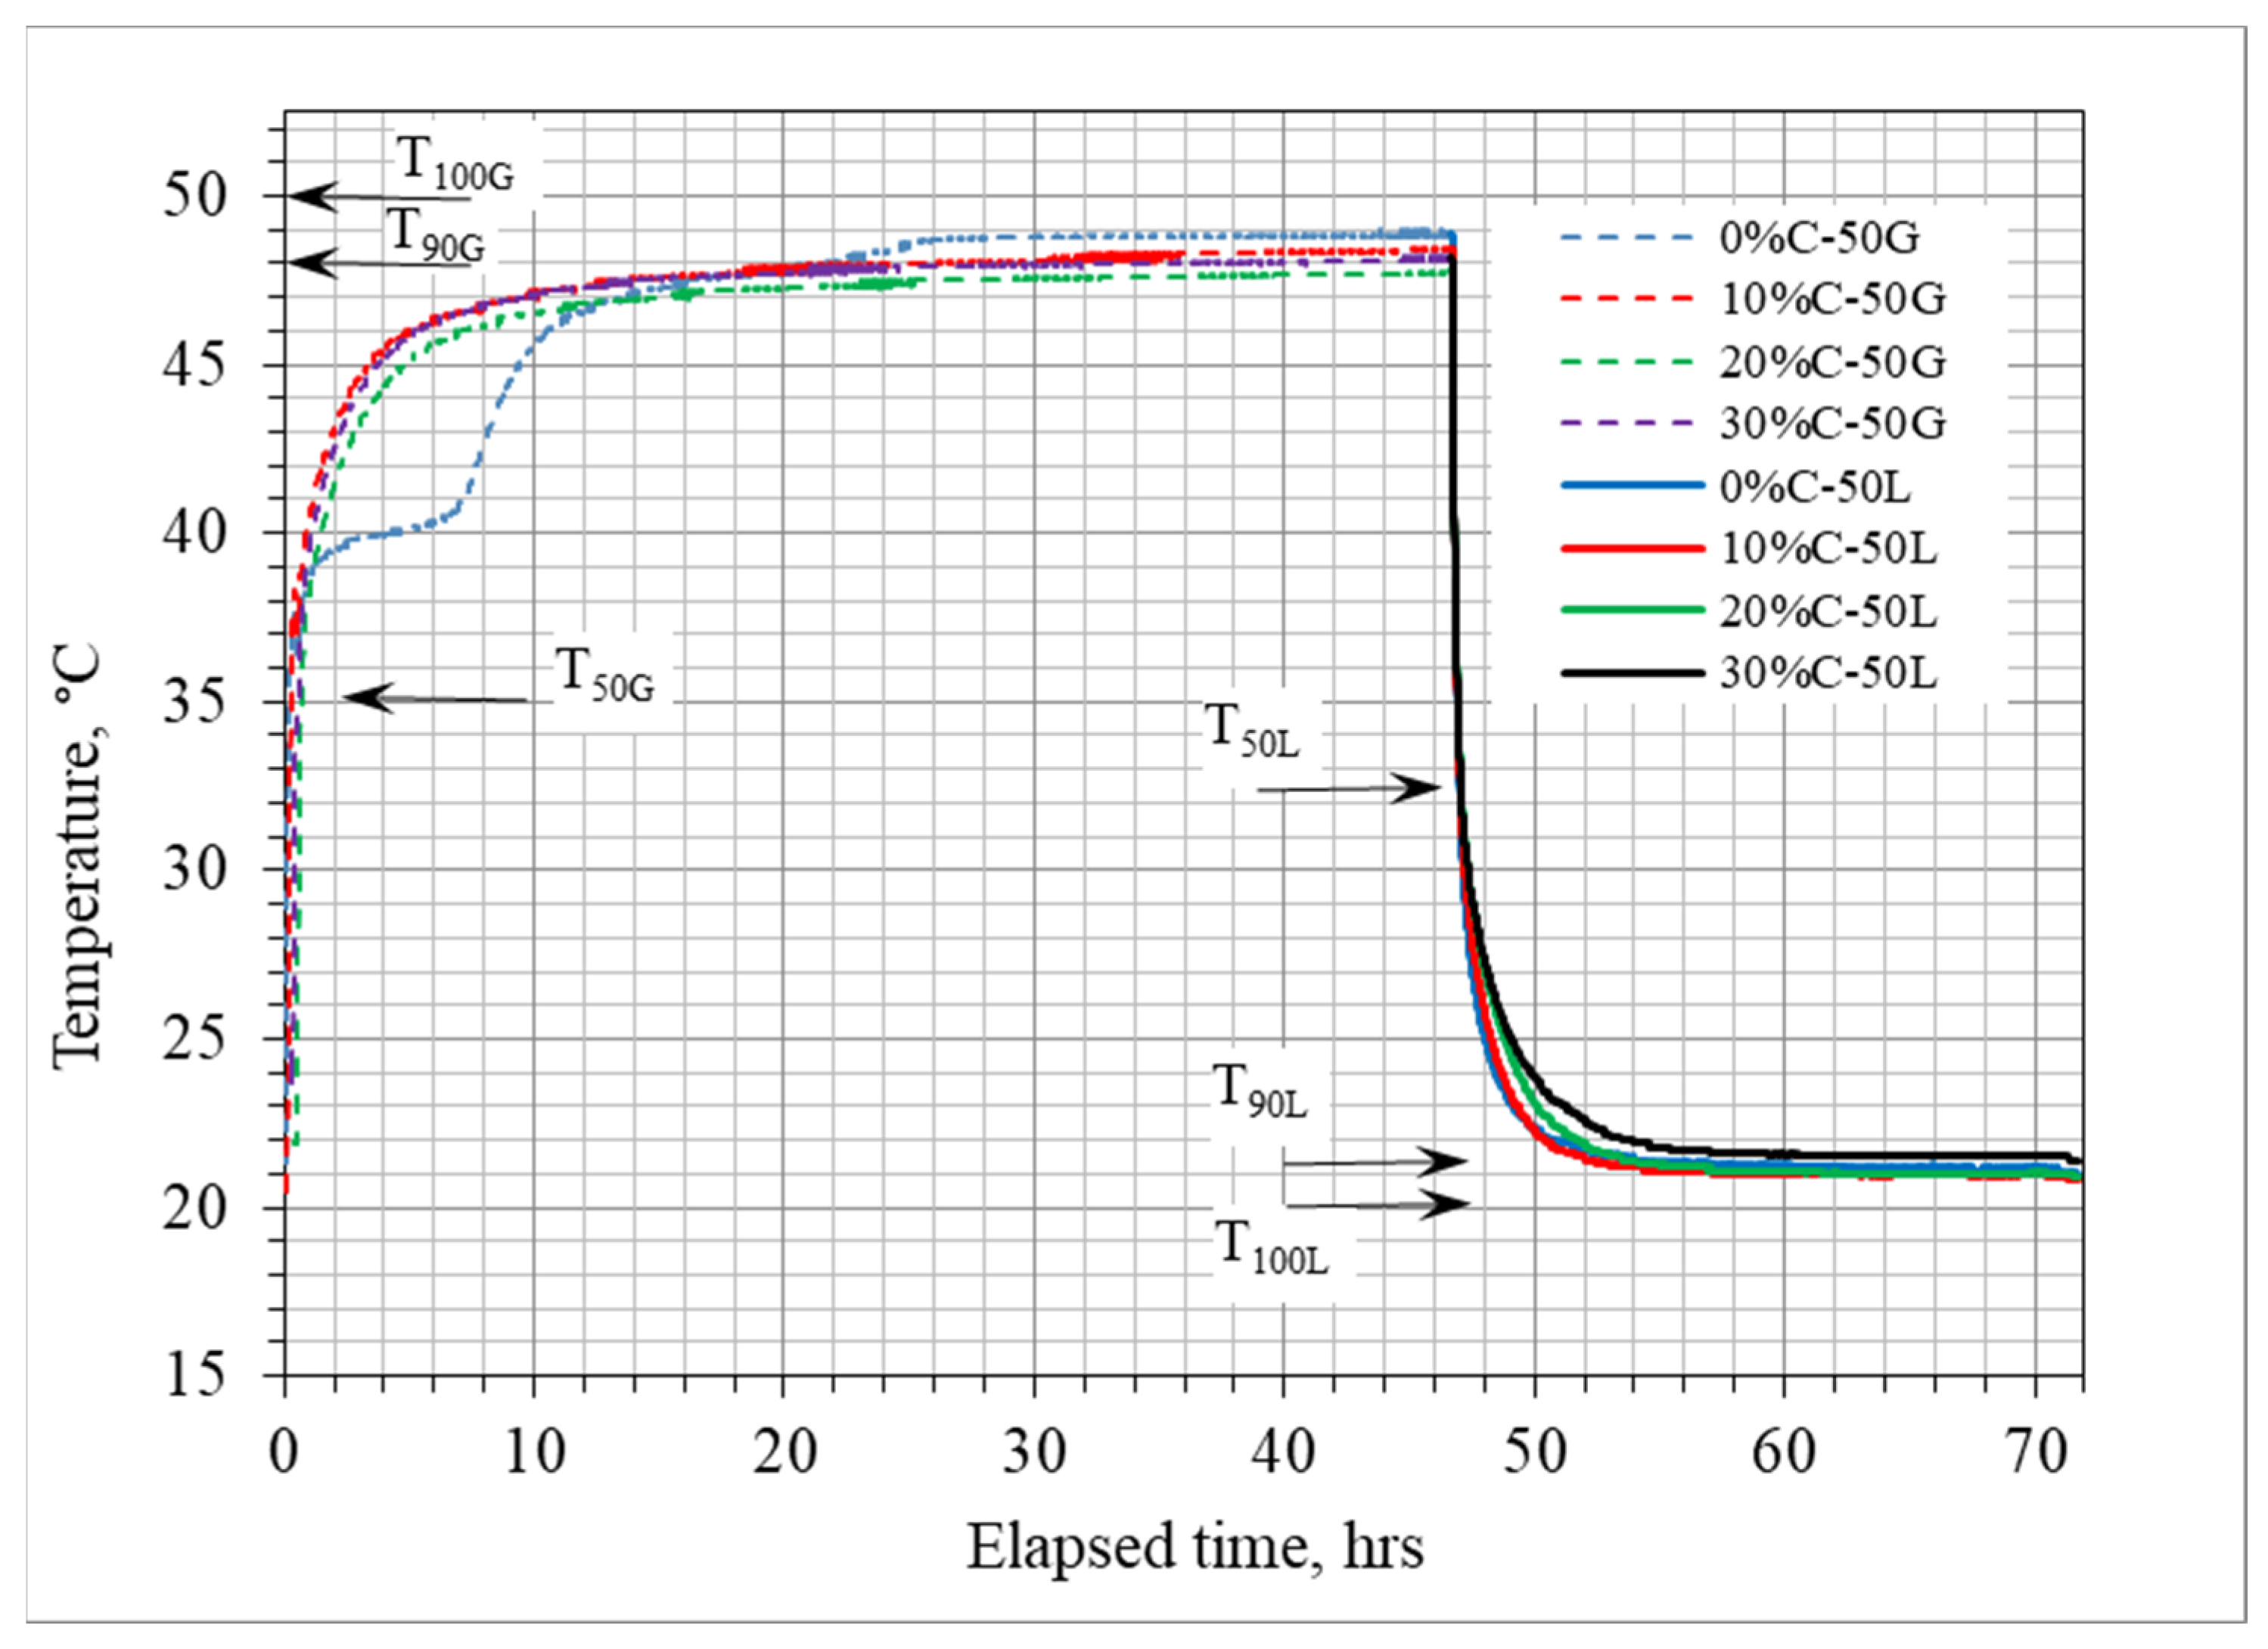
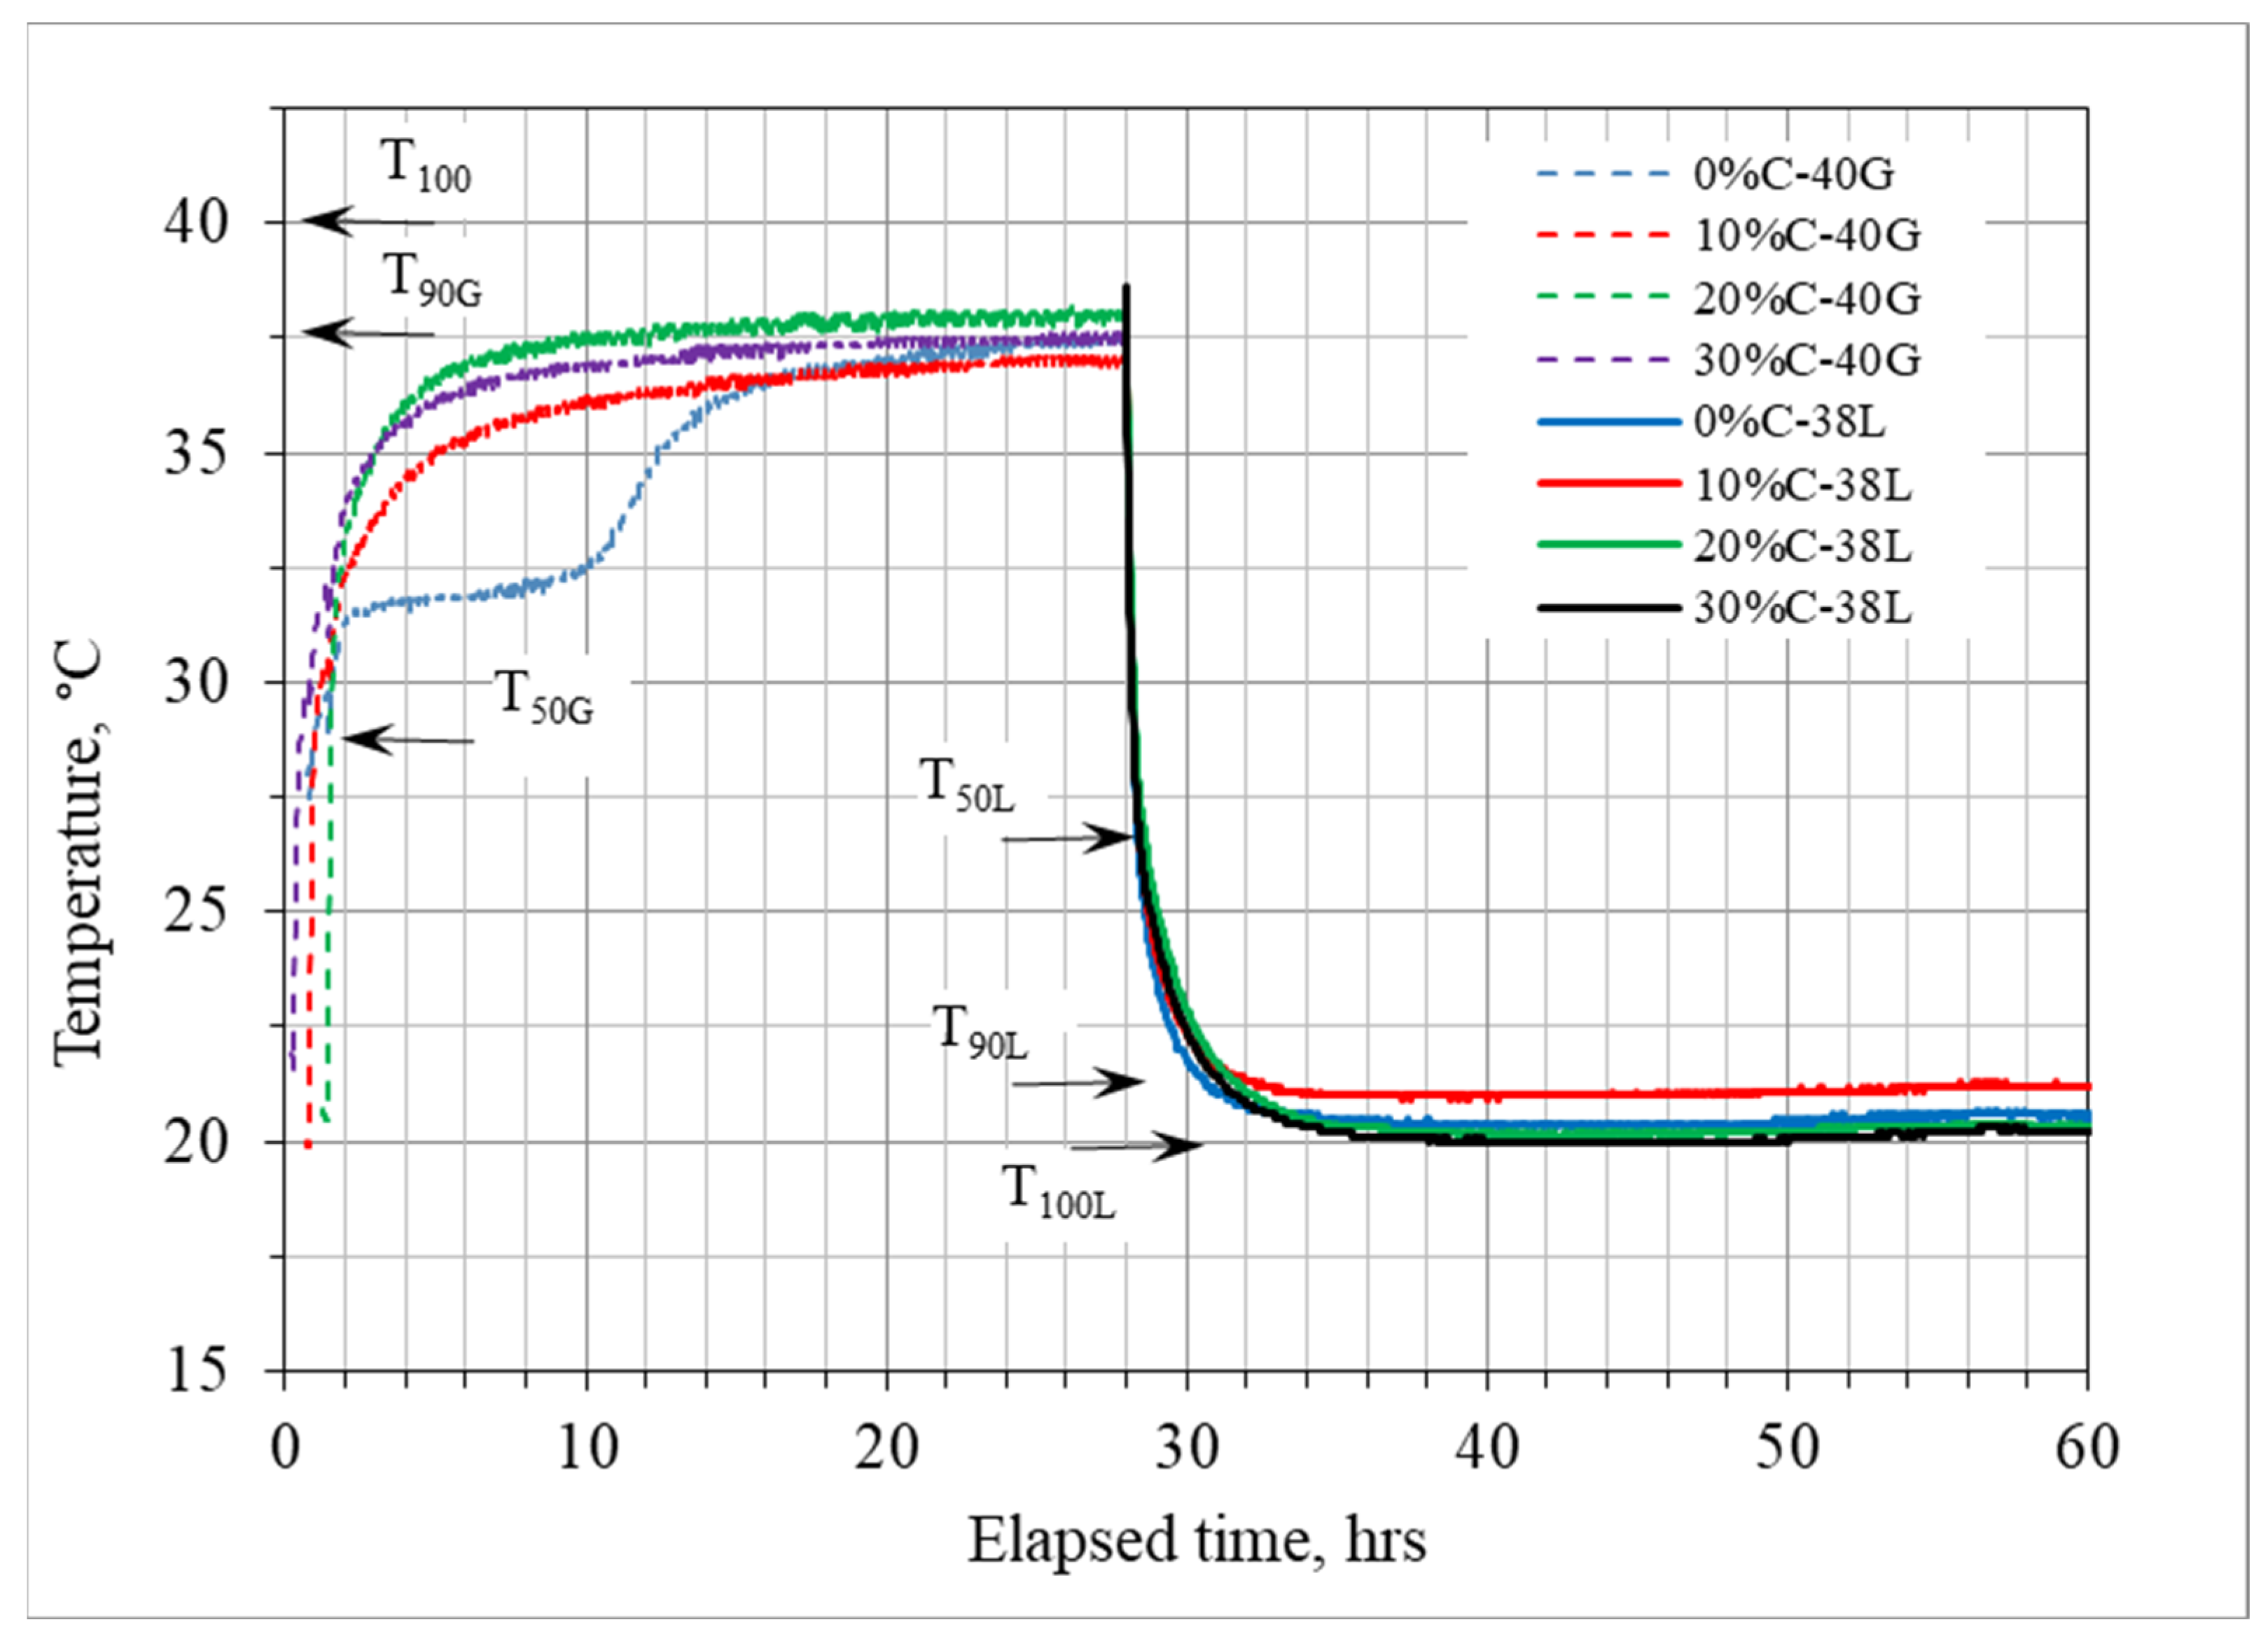
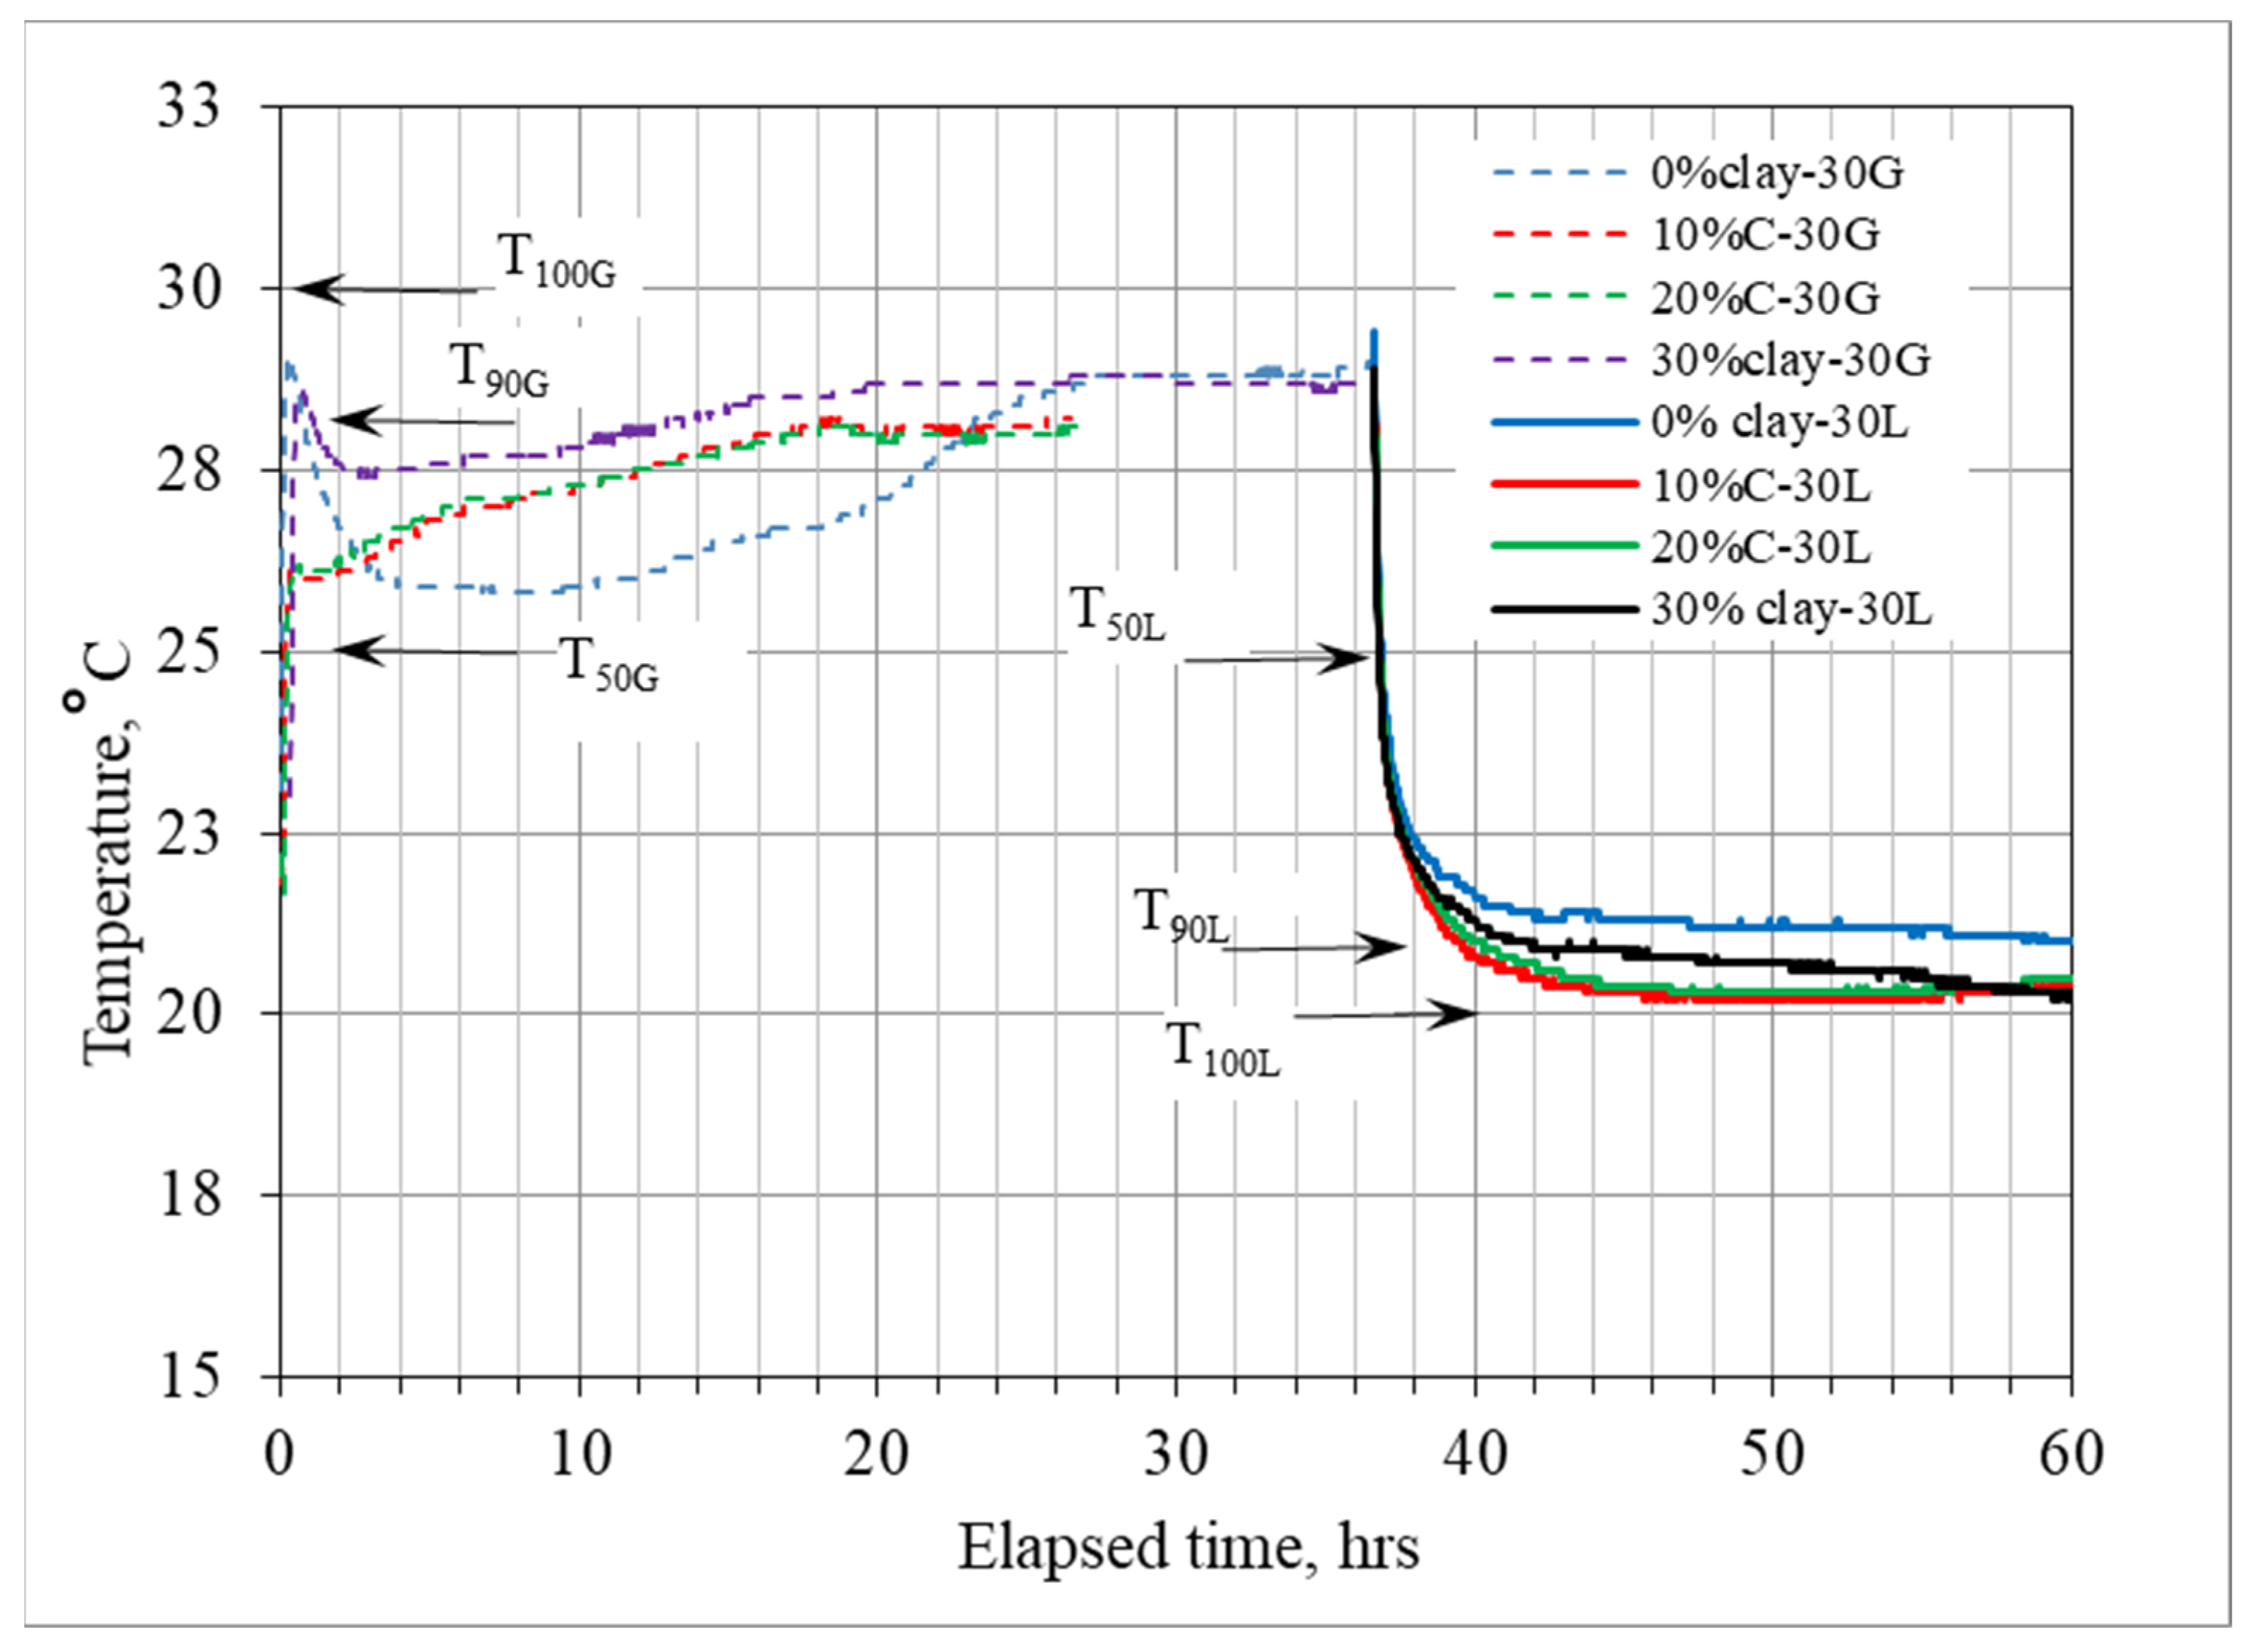
Figure 9 present the results for the three gradients of temperature, covering three different clay contents. The symbols are given in the form % clay content–temperature, followed by gain (G) or loss (L). For example, 10%C-50G stands for ten percent clay resulting in a gain of 50 °C in temperature.
This study suggests introducing new reference measurement levels. The first reference point is the T50 gain, defined as the time required to achieve 50% of the applied temperature gradient. This is normally referred to as a linear increase in temperature, occurring over an initial period of time.
T90 gain is defined as the time required to achieve 90% of the applied temperature gradient. This is normally referred to as a non-linear transition zone in temperature, occurring before a final steady rate of heat gain is reached. Beyond this level, the rate of gain is slow and it is expected to take a long time to reach the maximum temperature, T100 gain.
The temperature loss phase is treated similarly, and the terms T
50 loss, T
90 loss, and T
100 loss are introduced. The profile of the loss is also observed to start with a linear zone, a non-linear transitional zone, and finally a slow linear rate.
Table 2,
Table 3 and
Table 4 present the time required to reach the suggested levels.
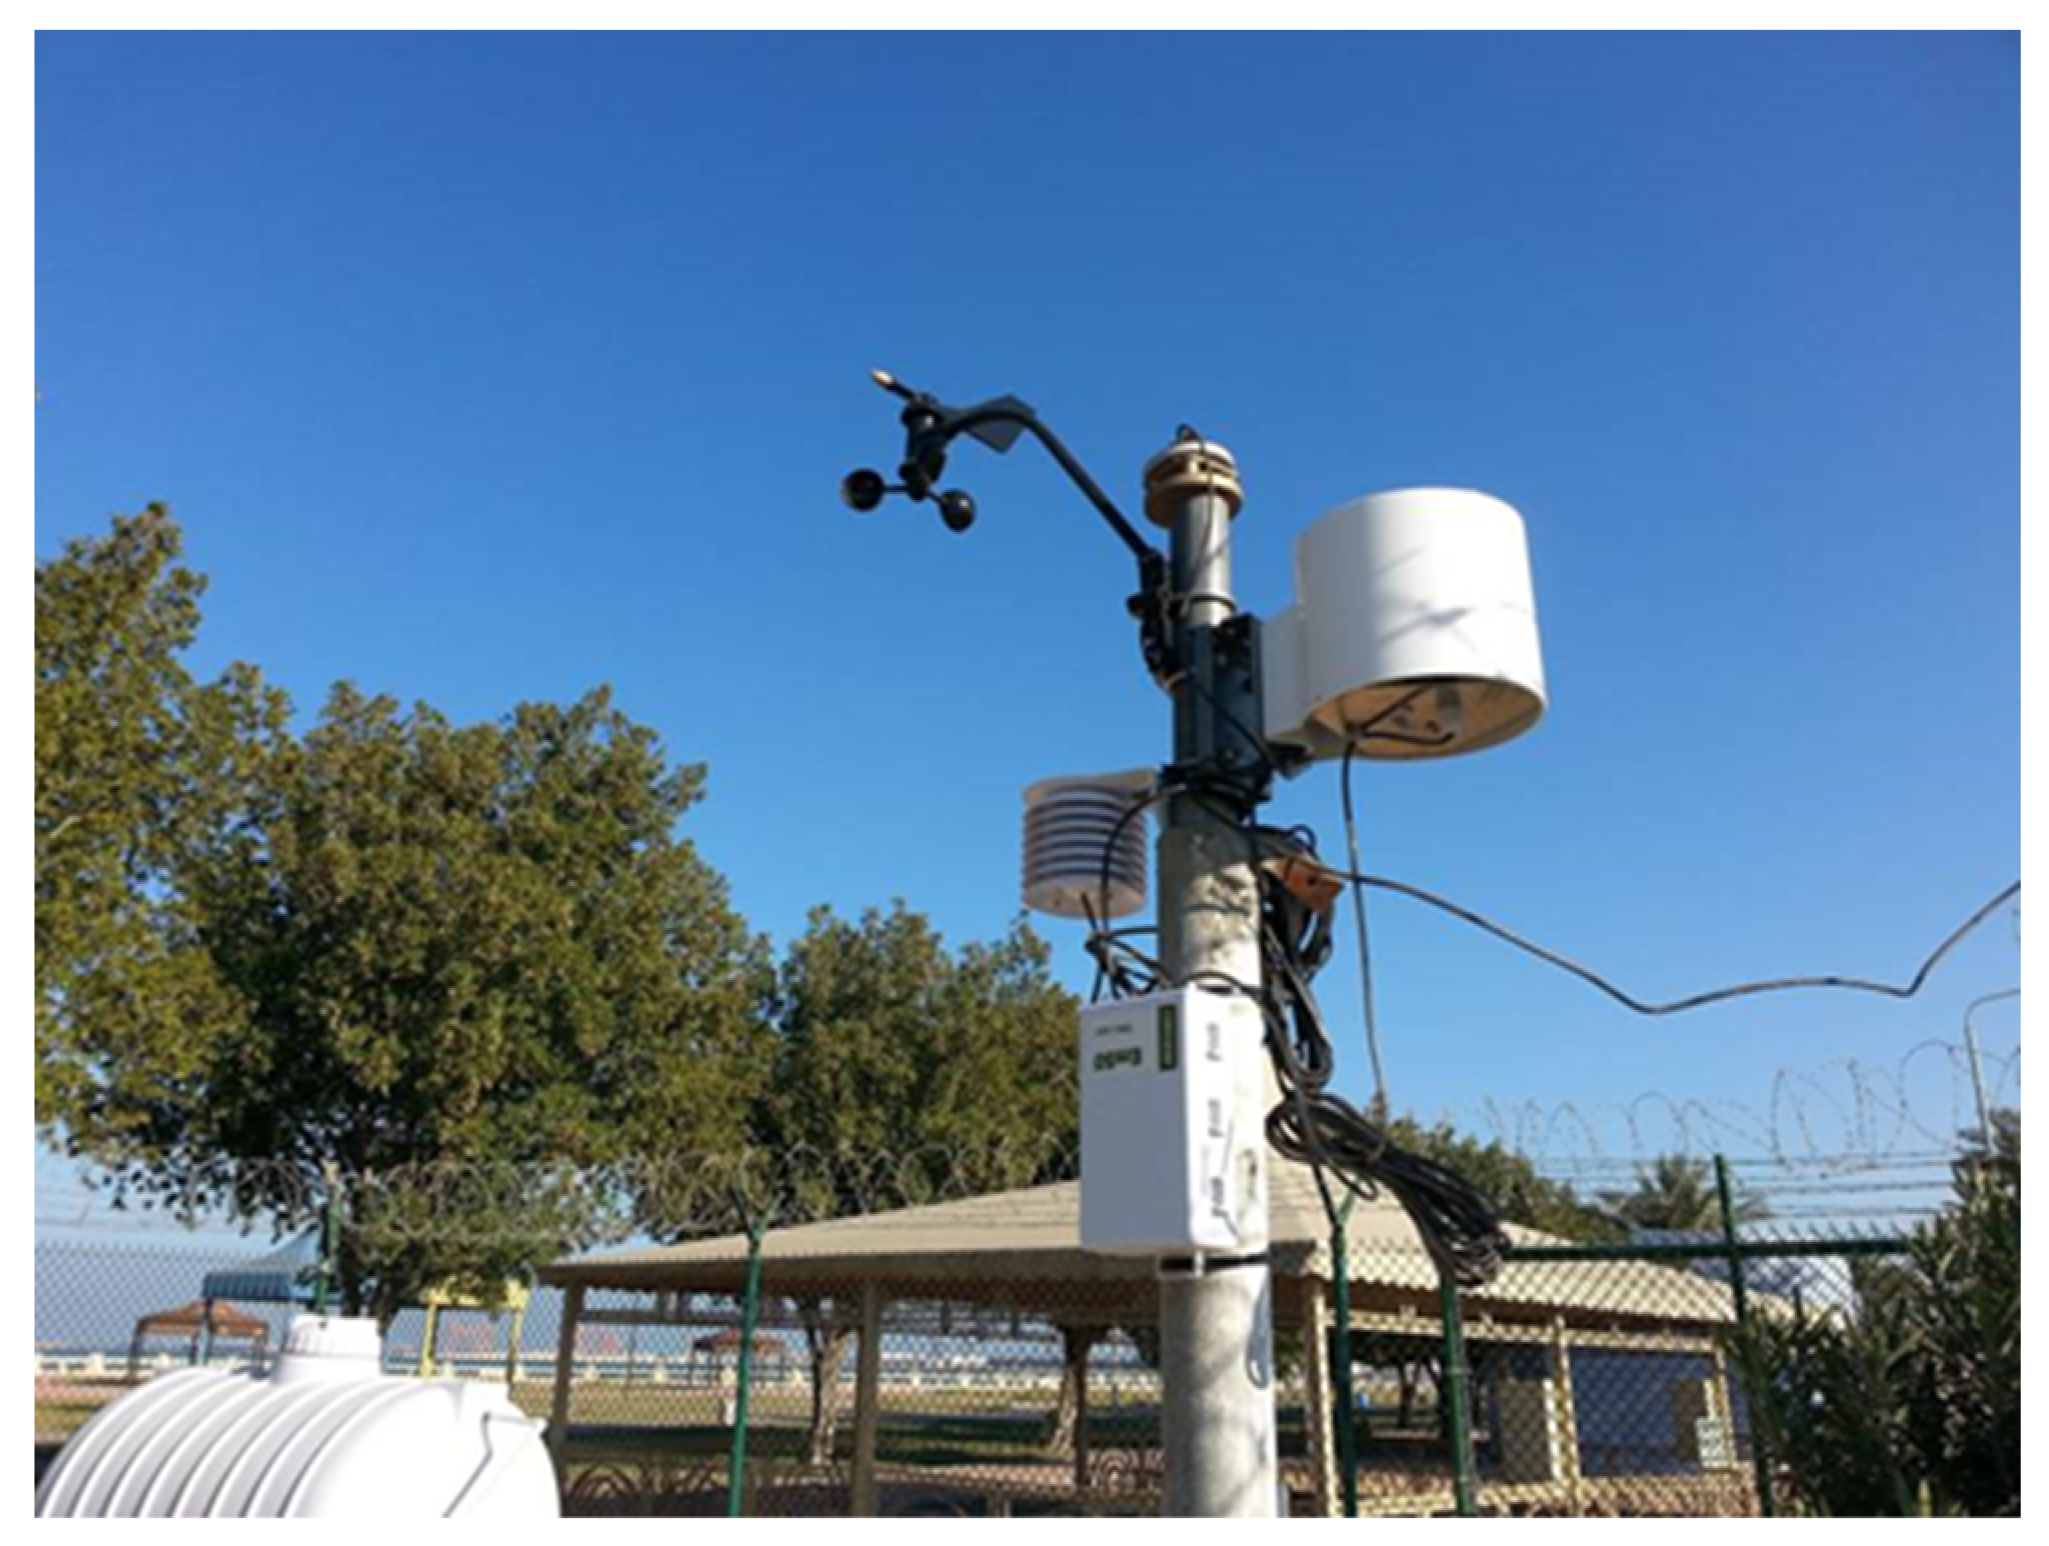
The field sections are monitored over a long period of time, and the temperatures measured within the mid-layers consisting of 15% clay content and 20% clay content are presented in graphical form.
Figure 7.
Heat gain and heat loss for laboratory, compacted clay–sand mixtures subjected to 50 °C.
Figure 7.
Heat gain and heat loss for laboratory, compacted clay–sand mixtures subjected to 50 °C.
Figure 8.
Heat gain and heat loss for laboratory, compacted clay–sand mixtures subjected to 40 °C.
Figure 8.
Heat gain and heat loss for laboratory, compacted clay–sand mixtures subjected to 40 °C.
Figure 9.
Heat gain and heat loss for laboratory, compacted clay–sand mixtures subjected to 30 °C.
Figure 9.
Heat gain and heat loss for laboratory, compacted clay–sand mixtures subjected to 30 °C.
Table 2.
Exposure to 50 °C temperature and time in hours to reach 50% and 90% levels.
Table 2.
Exposure to 50 °C temperature and time in hours to reach 50% and 90% levels.
| Clay Percent | 0% | 10% | 20% | 30% |
|---|
| T50G | 0.2 | 0.3 | 0.6 | 0.7 |
| T90G | >45 | 9.5 | 24.0 | 10.0 |
| T50L | 0.3 | 0.3 | 0.4 | 0.4 |
| T90L | 6.0 | 7.2 | 7.3 | 13.3 |
Table 3.
Exposure to 40 °C temperature and time in hours to reach 50% and 90% levels.
Table 3.
Exposure to 40 °C temperature and time in hours to reach 50% and 90% levels.
| Clay Percent | 0% | 10% | 20% | 30% |
|---|
| T50G | 1.4 | 1.2 | 1.6 | 0.9 |
| T90G | 28.0 | 28.1 | 20.3 | 28.0 |
| T50L | 0.2 | 0.2 | 0.3 | 0.2 |
| T90L | 1.8 | 2.4 | 2.7 | 2.4 |
Table 4.
Exposure to 30 °C temperature and time in hours to reach 50% and 90% levels.
Table 4.
Exposure to 30 °C temperature and time in hours to reach 50% and 90% levels.
| Clay Percent | 0% | 10% | 20% | 30% |
|---|
| T50G | 0.03 | 0.13 | 0.20 | 0.37 |
| T90G | 0.2 | >24 | >24 | 0.5 |
| T50L | 0.2 | 0.3 | 0.3 | 0.1 |
| T90L | 22.5 | 2.8 | 3.3 | 4.5 |
4. Discussion
Heat waves produced by the sun and daily temperature changes dissipate rapidly and generally influence the upper 1.5 to 2 m levels below ground. Temperature variation at deep levels or, for example, below the vadose level, is negligible. This is mainly attributed to the type, moisture, voids, and porous nature of the soil [
25].
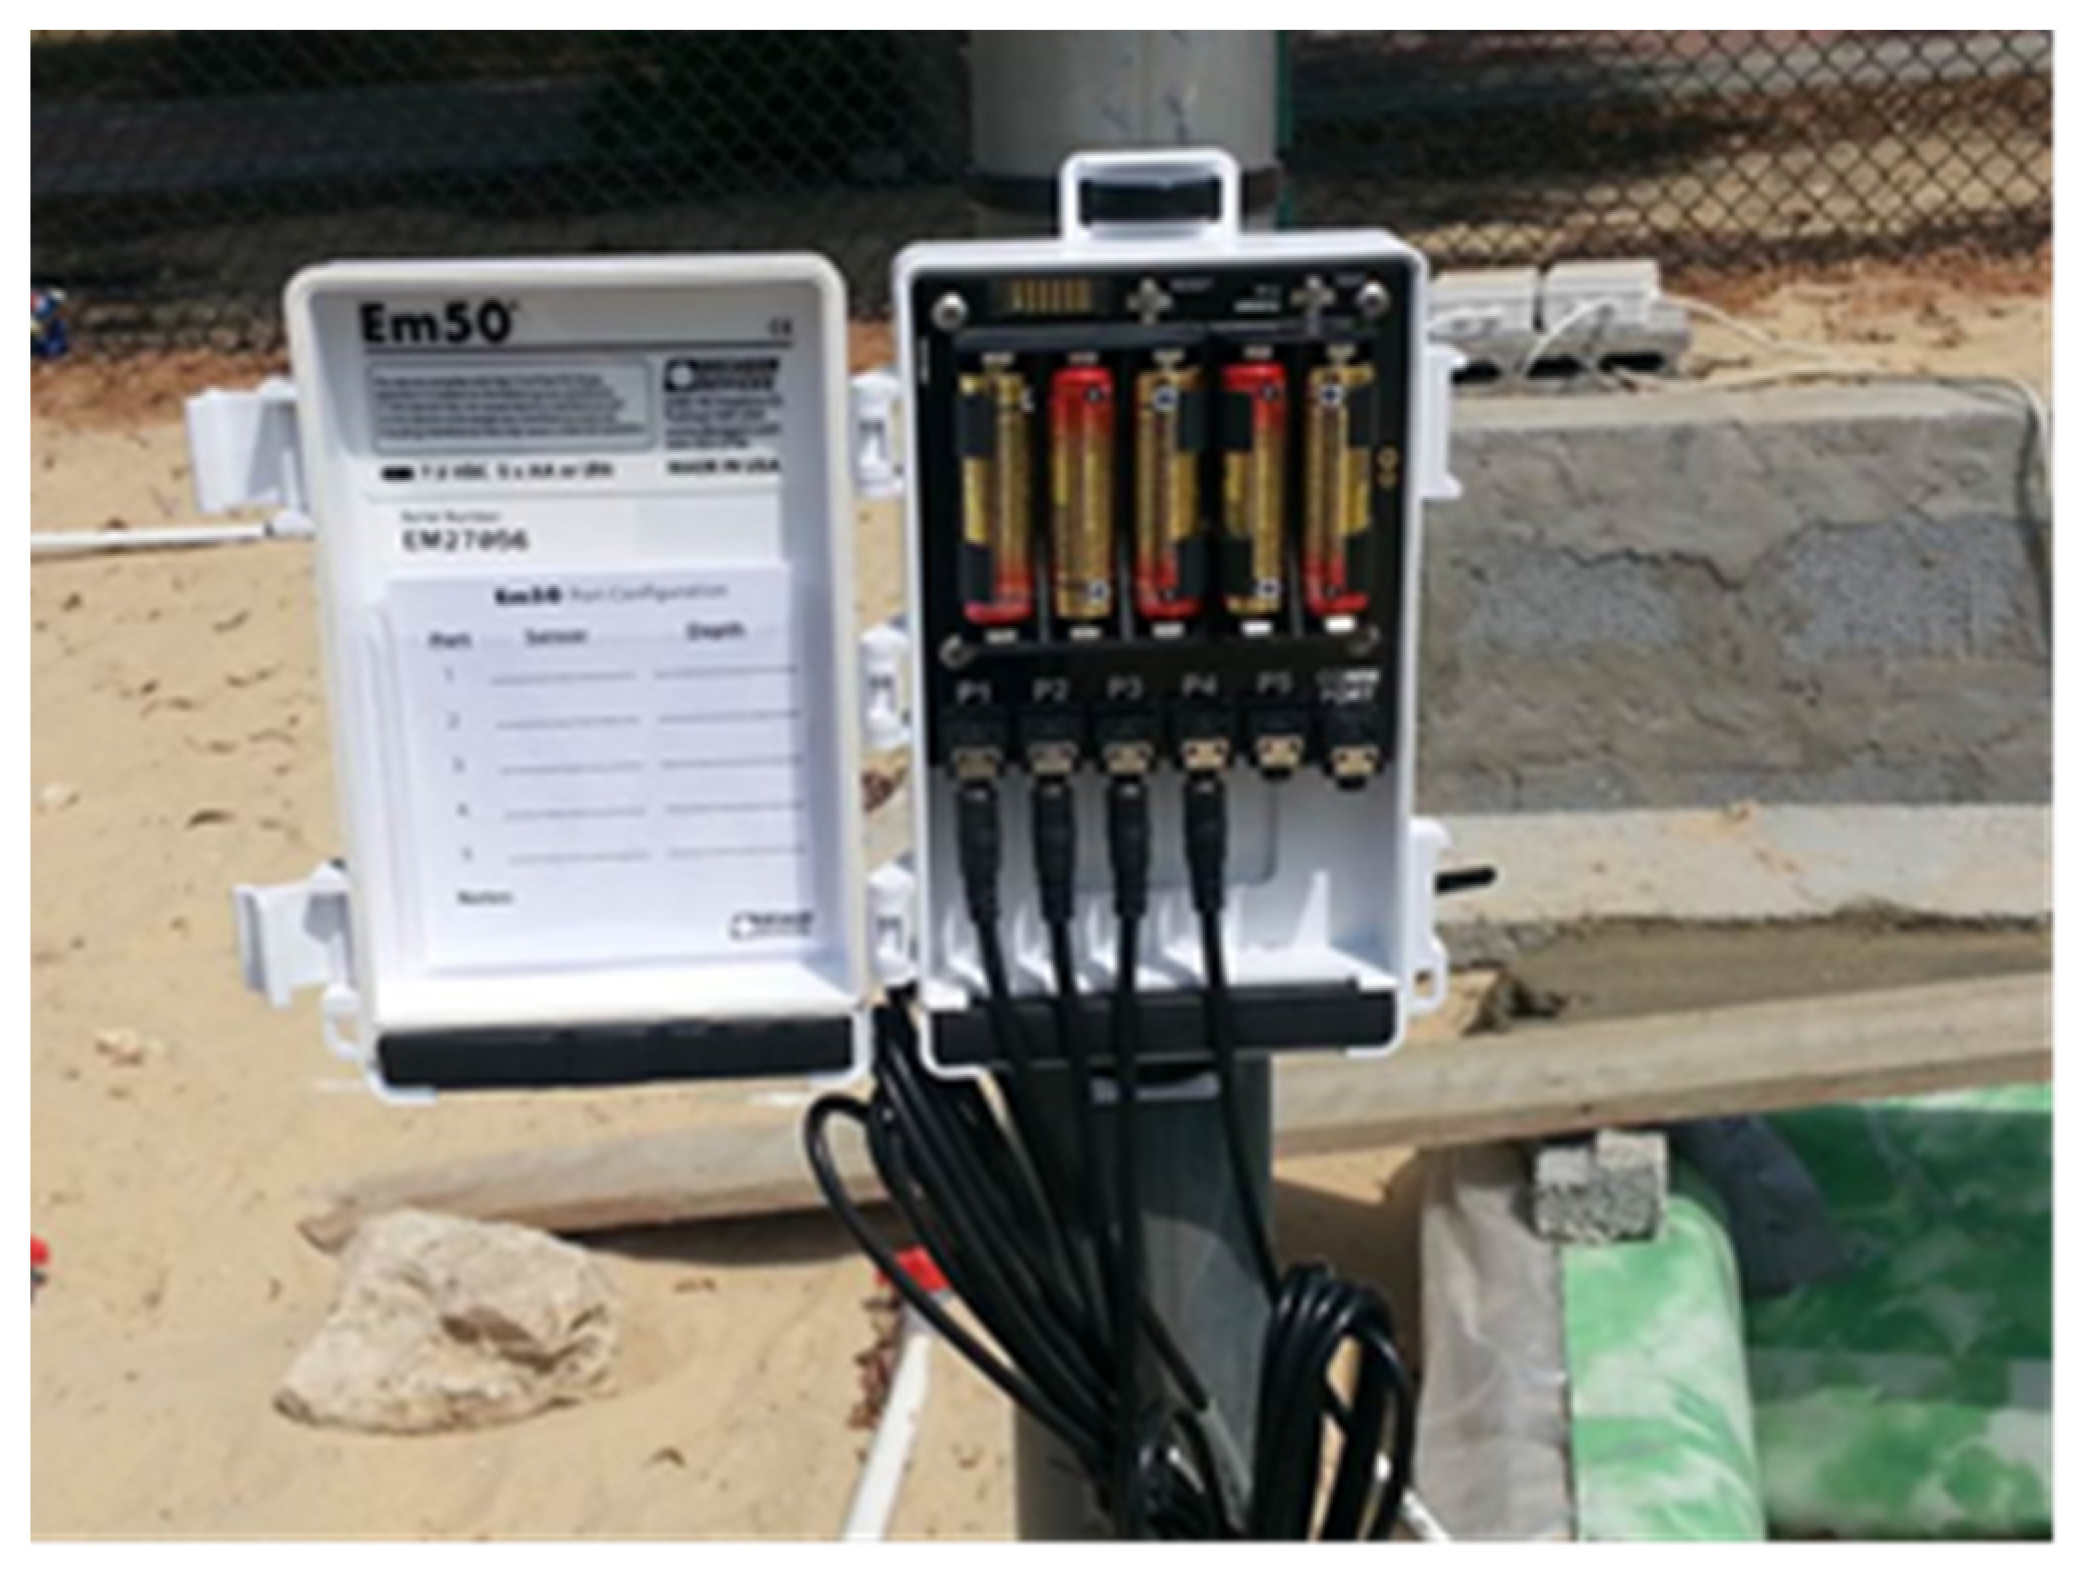
Soil–moisture interaction is a very complex phenomenon, but with the recent introduction of digital sensors capable of recording moisture and electrical conductivity, it has become more convenient and has helped researchers, geotechnical engineers, and landscape industries to conduct more useful studies. It has also been useful in predicting soil behavior and monitoring temperature and moisture at any time under different weather conditions. When soil becomes dry, or when there is not enough water for plants, automatic irrigation pumps can be started. When included in clay–sand liners, these sensors can provide information that is useful to environmental engineers. The trends and temperature profile variations in clay–sand mixtures used as cover liners for landscaping or landfills are the main subjects of this study.
Three components make up unsaturated soils: solids, air, and water. According to Shmulik [
26], an aqueous solution is the only conducting phase for apparent electrical conductivity. This made it possible to employ this to assess volumetric water contents (θ). The soil density, porosity, particle shape and orientation, cation content, and temperature are just a few of the variables that might affect how the electrical conductivity is determined. The electrical resistance of the soil can also decrease as the temperature rises.
The profiles presented in
Figure 7,
Figure 8 and
Figure 9 indicate three levels of heat gain and heat loss. The time required to reach 50% of the exposure temperature (T
50 gain) is estimated as half an hour to one hour for all exposures, and this seems to be independent of the soil composition and clay content; however, the time to reach 90% exposure temperature (T
90 gain) is variable. The rate of heat gain is low in pure sand compared to sand enhanced with clay additives. The variation in the time necessary to achieve a 90% level gain for a high temperature gradient (50 °C) is small when comparing the 10%, 20%, and 30% clay admixtures. The results of elevating the temperatures to low and medium gradients (40 °C and 30 °C) are not consistent. This can be attributed to other factors influencing the gain of heat, namely, air and fluid within the system. It is important to note that these results cannot be compared because the field and lab settings have different clay contents. Therefore, if a comparison is to be made, these variations must be taken into account.
Lower clay content gains heat faster than the than higher clay content. Therefore, it can be useful to adopt a higher clay content in order to make the morning cool last longer before the hot weather of midday in summer prevails.
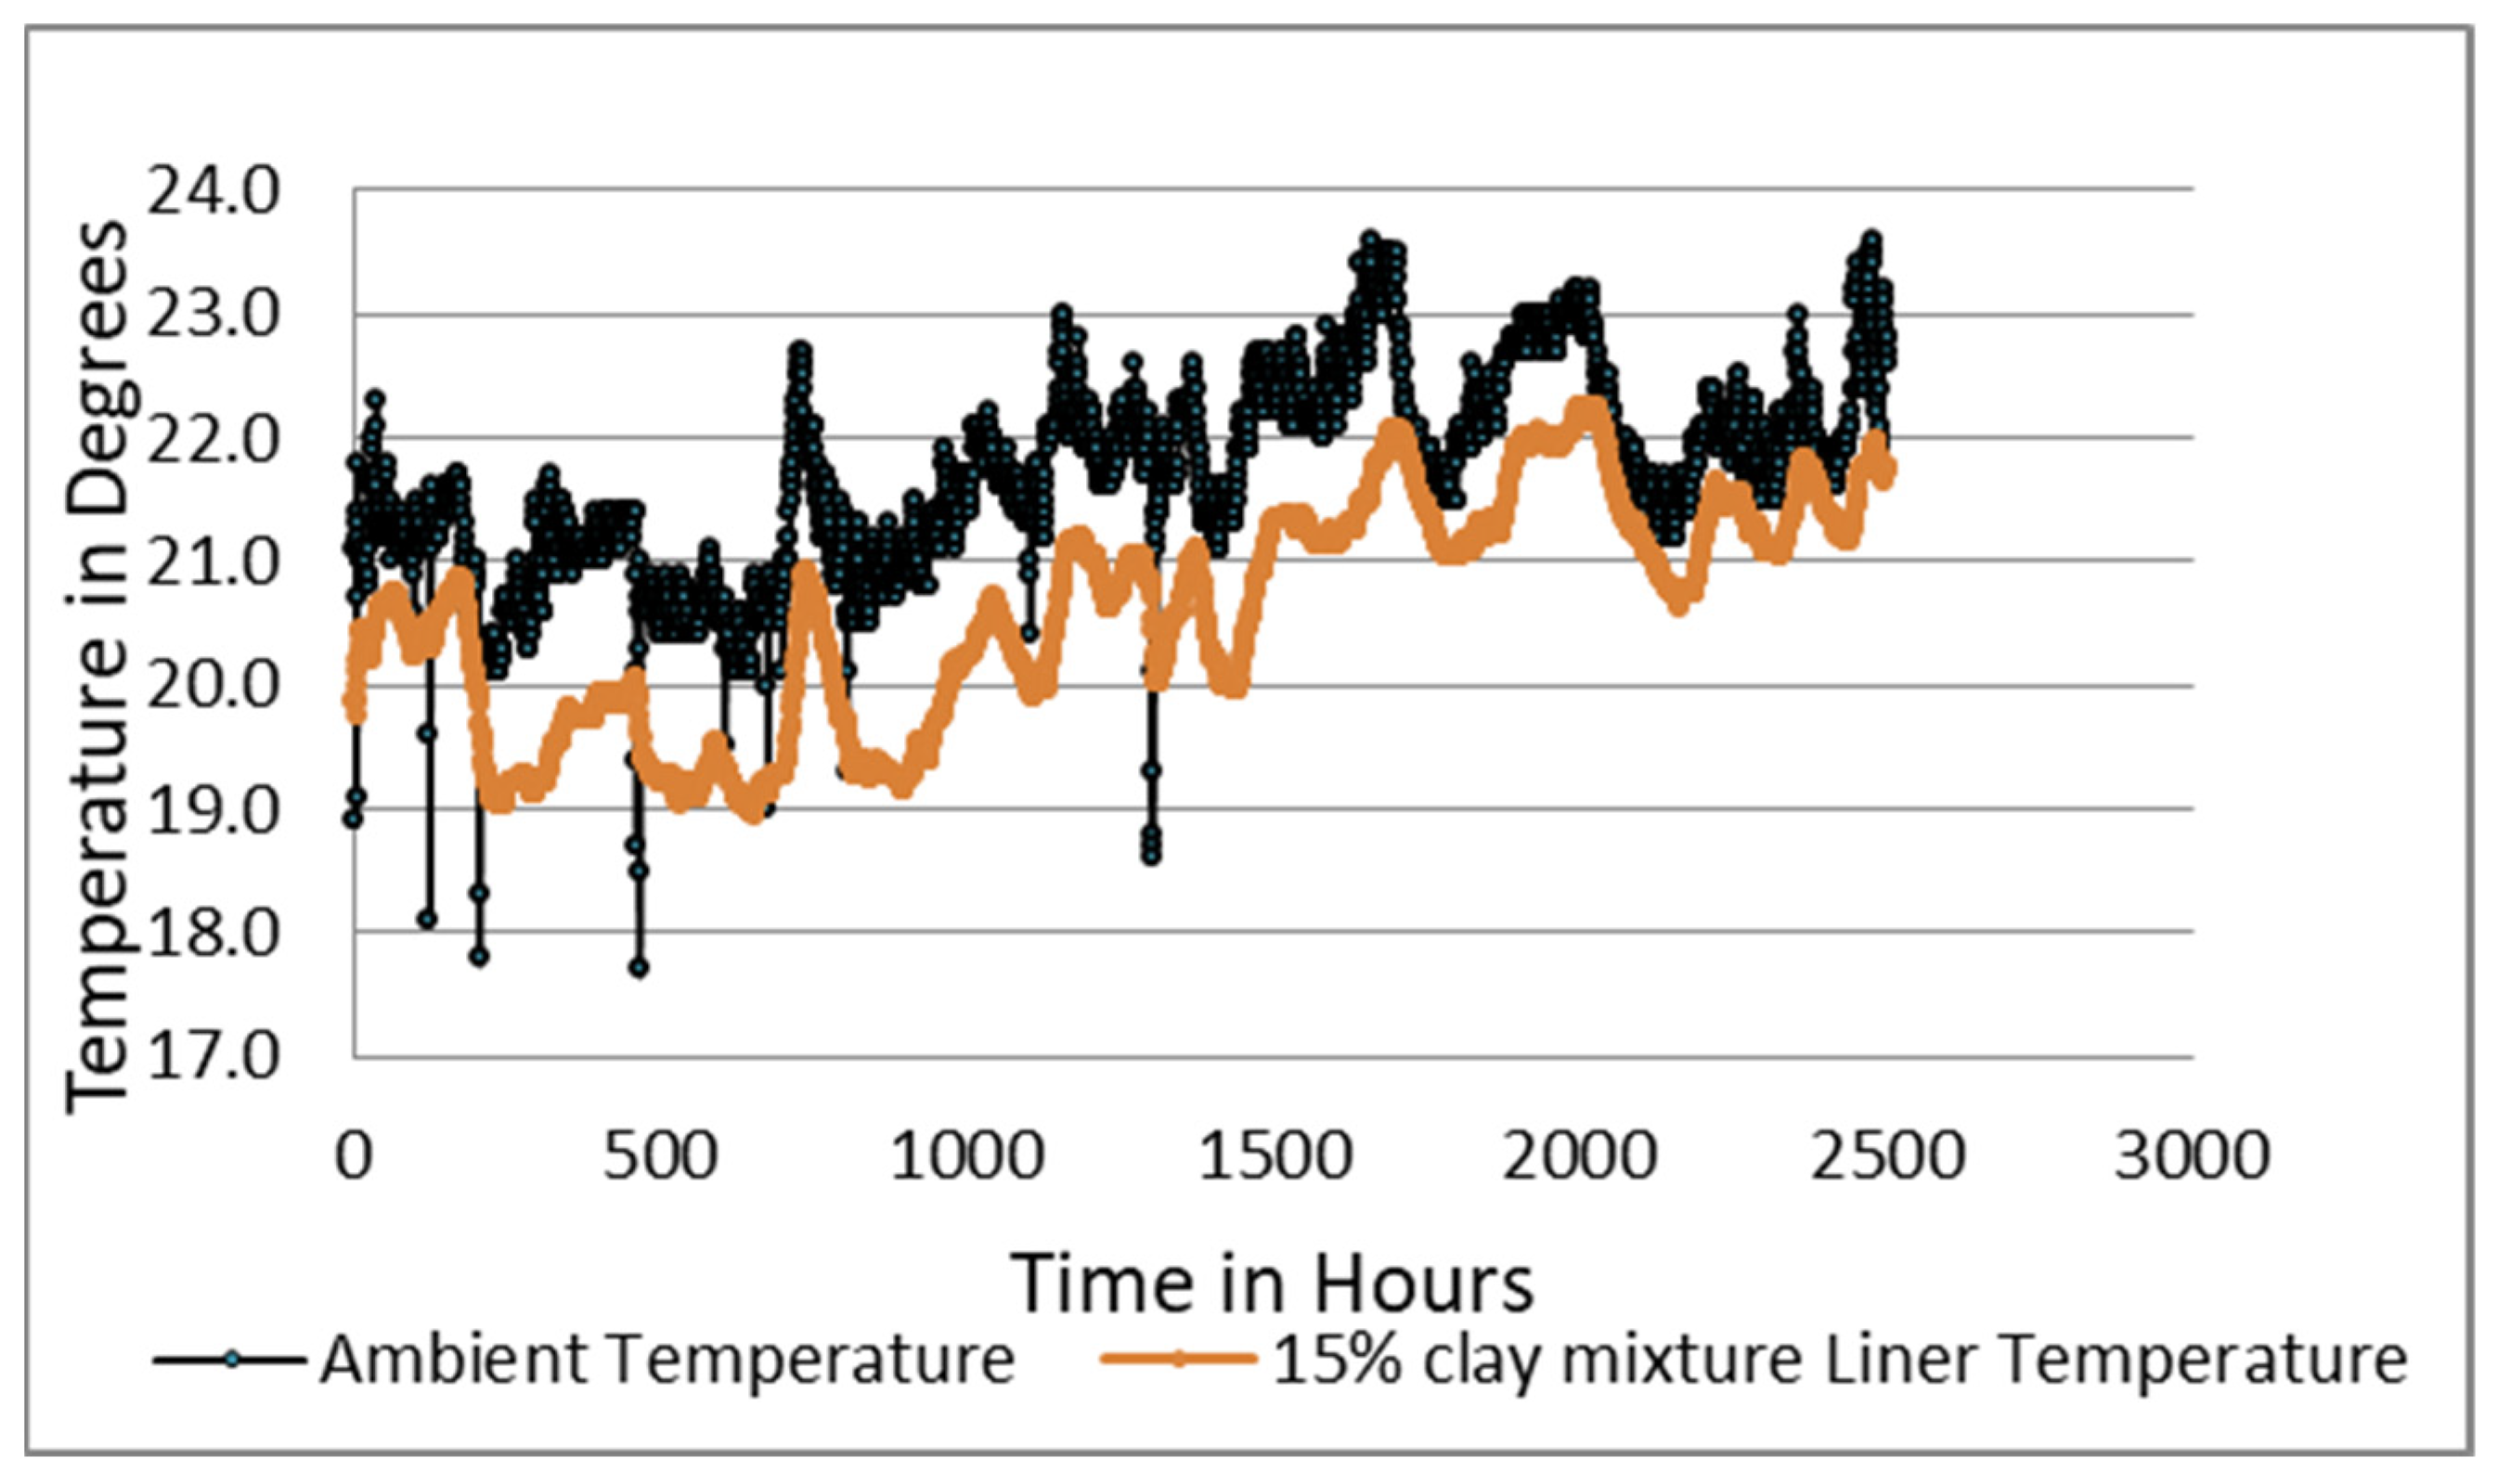
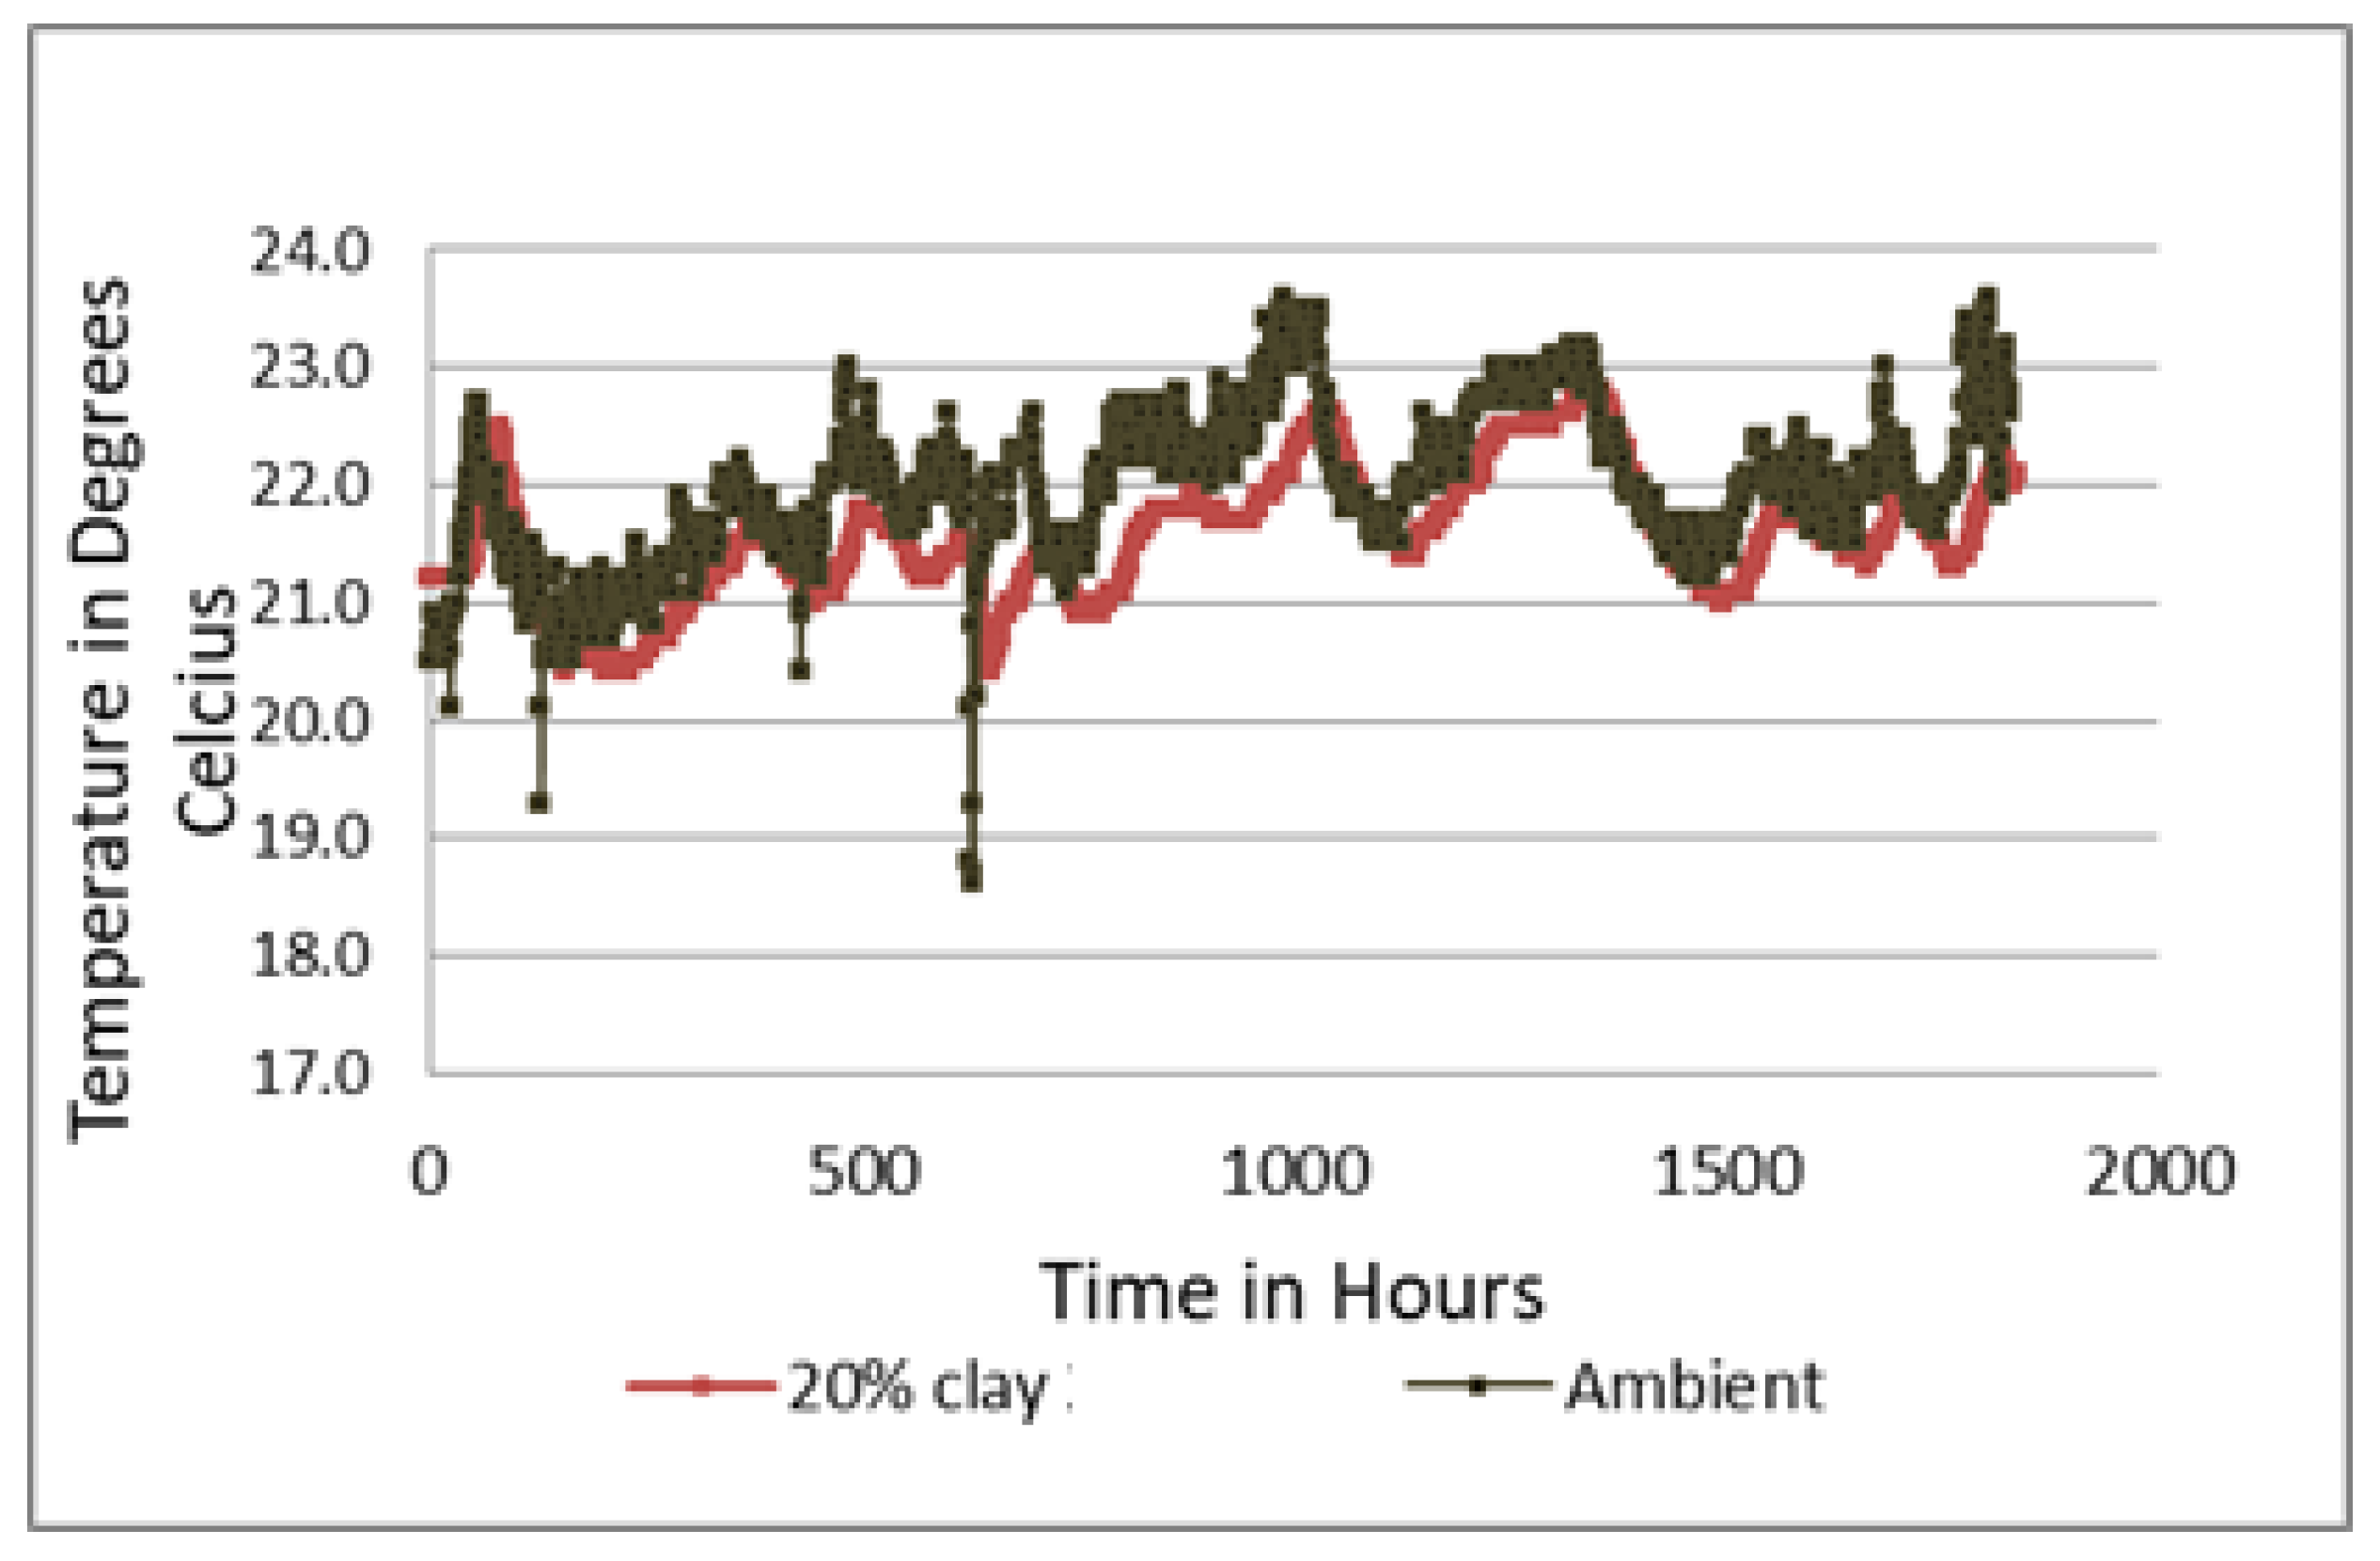
As the temperature gradient in nature is not applied abruptly, as in the laboratory experiments, the difference between the ambient and gained temperatures is small. Examining the field section data over extended periods, the temperature difference is in the order of 1 degree for the 20% clay content and 1.5 to 2 degrees for the 15% clay content, as indicated in
Figure 10 and
Figure 11.
The loss of heat is also found to have three typical zones of temperature changes, in which a fast change occurs after exposure to cooling at first, a transition zone is observed, and finally a slow rate of cooling is reached, where approximately 90% of the ambient or surrounding temperature is achieved.
Knowledge of these thermal characteristics will help designers select the appropriate fill required for designing green areas in parks and landscape zones. However, these characteristics need to be weighed against the hydraulic conductivity and irrigation requirements of the project.
The development of numerical models and simulations to forecast the thermal behavior of clay–sand mixtures under various environmental circumstances should also be a primary goal of future research in this area. These models can offer a practical and affordable way to assess the thermal insulation, energy efficiency, and long-term sustainability of green parks.
The examination of the thermal expansion and contraction behavior of clay–sand mixtures during temperature fluctuations is another area of research that should be undertaken. This is crucial in places with extreme temperature swings, because differential thermal expansion can cause cracks and other types of damage to green parks. The design of more robust and resilient green park facilities will benefit from an understanding of the connection between the thermal characteristics of clay–sand mixtures and their susceptibility to heat-induced deformation. Pure clay has a thermal conductivity of up to 0.1 W/mK, while pure sand has a range of 0.25 to 0.35 W/mK. However, when clay and sand are combined, the mixture’s heat conductivity may be altered. Due to the clay’s lower thermal conductivity, combinations with a higher clay component typically have lower thermal conductivity. The clay–sand mixtures’ compaction and moisture content also play roles. Thermal conductivity is found to be higher in highly compacted and highly moist mixtures. The heat capacity of soils in general is in the order of 0.800 Joules/g·K.
Figure 10.
Ambient temperature versus 15% clay mixture liner temperature. (Reproduced with permission from Springer Nature, 2023).
Figure 10.
Ambient temperature versus 15% clay mixture liner temperature. (Reproduced with permission from Springer Nature, 2023).
Figure 11.
Ambient temperature versus 20% clay mixture liner temperature. (Reproduced with permission from Springer Nature, 2023).
Figure 11.
Ambient temperature versus 20% clay mixture liner temperature. (Reproduced with permission from Springer Nature, 2023).
5. Conclusions
The type of clay and the clay content affect how subsurface clay–sand liners react to temperature changes. A first linear segment, a transition zone, and a sluggish rate of change after 90% of the original temperature was gained or lost were discovered to be the three patterns that the changes in the temperature gain and loss profile follows. New parameters were defined to characterize the gains and losses in temperature. These are T50 gain/loss and T90 gain/loss. Factors that influence temperature variation include the type of clay, clay content, porosity, moisture content, and placement conditions. The field sections tested over an extended period indicated that clay-rich layers retain a narrow difference from the ambient temperature. A temperature difference in the order of 1 degree was observed for the 20% clay content layer, and 1.5 to 2 degrees for the 15% clay content layer.
Designers can use these attributes as required to provide extended hours of comfortable time. In winter, green areas rich in clay will keep heat for several hours and provide relatively warm evenings. In summer, the mixture will retain a cool temperature for some time during the day.
Clay–sand mixtures with a higher clay content exhibit higher heat-gain characteristics due to increased thermal conductivity, while their heat loss rate is relatively low. Understanding these thermal properties is vital for designing foundations, embankments, and other geotechnical applications where temperature differentials play roles.


