Article

The Inversion Method Applied to the Stress Field around a Deeply Buried Tunnel Based on Surface Strain

1
Hunan Lianshao Construction Engineering (Group) Co., Ltd., Changsha 410012, China
2
Key Laboratory of Ministry of Education on Safe Mining of Deep Metal Mines, Northeastern University, Shenyang 110819, China
*
Author to whom correspondence should be addressed.
Appl. Sci. 2023, 13(22), 12507; https://doi.org/10.3390/app132212507
Submission received: 19 October 2023 / Revised: 12 November 2023 / Accepted: 13 November 2023 / Published: 20 November 2023
(This article belongs to the Special Issue Recent Research on Tunneling and Underground Engineering)

Abstract

:
To identify the magnitude and direction of in situ stress in deeply buried tunnels, an inversion method for the stress field was proposed based on a finite number of measurement points of surface strain. Firstly, elastic strain data of finite points on the surface of tunnel surrounding rock were acquired using the borehole stress relief method at the engineering site. Secondly, a finite element model of the tunnel surrounding rock with plastic damage was established, and the parameters of the finite element model were substituted using the SIGINI subroutine. Then, an improved Surrogate Model Accelerated Random Search (SMARS) was developed using genetic algorithm programming on the MATLAB™ platform to invert and attain the globally optimal boundary conditions. Finally, the obtained optimal boundary conditions were applied to the numerical model to calculate the stress distribution in the engineering site. The reliability of this method was validated through a three-dimensional example. The method has been successfully applied to the stress-field analysis of deep tunnels in Macheng Iron Mine, Hebei Province, China. The research results show that this method is a low-cost, reliable approach for stress-field inversion in the rock around a tunnel.

1. Introduction

With the gradual depletion of shallow mineral resources, mining operations are increasingly extending towards deeper areas, resulting in an increase in the stresses on deep-level tunnels and excavations. The existing stress in the surrounding rock is the result of the superposition of spatio-temporal factors such as excavation unloading, excavation disturbance, and stress redistribution on the original rock stress [1]. Therefore, it is difficult to calculate the existing stress on the rock surrounding the tunnel based on the in situ stress. However, the existing stress in the tunnel surrounding rock is a critical parameter used when assessing tunnel stability and optimizing the design thereof.
The methods for obtaining the stress field in mines can be divided into direct measurement and indirect inference [2]. Currently, research into mine stress fields mainly focuses on indirect methods of obtaining stress through inversion techniques. Stress field inversion involves using mathematical and mechanical methods to infer and extrapolate the distribution of in situ stress in a target area based on stress measurements at individual discrete points on-site. Common methods for measuring discrete point stresses include the borehole stress relief method [3,4,5], hydraulic fracturing [6,7,8], and Kaiser effect [9,10]. However, due to cost constraints, underground space limitations, and repeated damage to tunnel surrounding rock, these methods are difficult to apply directly to measurement of the stress in tunnels or deep-level excavations.
In recent years, with the development of computer simulation technology, researchers have used finite measurement points and computer-based methods to invert the stress field, and various techniques have emerged [11]. Common methods include regression analysis [12], artificial neural networks [13], the Surrogate Model Accelerated Random Search [14], and partial least-squares regression [15]. Some researchers have also improved and optimized these methods for engineering applications. For example, Zhang et al. [16] proposed a two-stage optimization algorithm to assess the stress field in the underground chambers of the Huangdeng Hydropower Station, Yunnan Province, China. Li et al. [17] trained an evolutionary neural network using stress measurement data and simulated the three-dimensional stress distribution at a project site. Huang et al. [18] overcame the limitations of Linear Elastic Fracture Mechanics analysis using cohesive-zone elements within a finite element framework, providing a fast and reasonably accurate method to estimate the maximum and minimum horizontal stresses using casing fracturing data. Qian et al. [19] proposed a method of optimizing the lateral stress coefficient of the initial stress field using a Generative Adversarial Network in FLAC 3D. Jin et al. [20] utilized evolutionary neural networks to establish a nonlinear mapping relationship between boundary conditions and measured point stresses, inputting measured in situ stresses into the neural network to acquire the corresponding boundary conditions. However, the above inversion methods primarily focus on stress as the reference quantity and study the stress field in a specific geological body under certain conditions, neglecting the influence of excavation of the rock. Additionally, when the stress is high, the rock mass may be in a plastic or damaged state. Therefore, relying on elastic criteria for inversion in deep areas can lead to a lower accuracy.
To address the limitations of existing inversion methods, this study proposes a stress-field inversion method for deeply buried drifts based on a finite number of points at which the surface strain is measured. This method uses the elastic strains in the surrounding rock obtained through the borehole stress relief method as target values. A finite element model of the drift rock mass is built using ABAQUS 2020 software, with the initial stress field defined by the user subroutine SIGINI, and the post-excavation stress field obtained using the birth–death element technique. To enhance the inversion process, this study integrates the genetic algorithm, with the main program written in MATLAB, resulting in the improved SMARS algorithm. The reliability of the algorithm has been validated through a three-dimensional numerical example, and successfully applied to the stress field measurement of the −930 drift for Macheng Iron Mine, Hebei Province, China.

2. Stress Field Inversion Method and Verification of Its Accuracy

2.1. Measurement of Surface Strain on Drift Walls

Accurately measuring the strain in the rock is key to the stress inversion method proposed herein; therefore, the method used for measuring surrounding rock strain is of paramount importance. Traditional measurement methods such as stress relief by drilling or hydraulic fracturing have certain limitations when it comes to measuring surface strain in the surrounding rock. These methods can cause secondary damage to the rock surface, leading to lower measurement precision and success rates. To tackle these challenges, this study employs the borehole stress relief method for measuring the surface strain on surrounding rock. The borehole stress relief method involves drilling holes to partially (or completely) separate the measured object, while simultaneously measuring the strain or displacement near the relieved or adjacent area. The stress at the measured point is then determined based on the constitutive relationship governing the material. In this study, the borehole stress relief method is illustrated in Figure 1, where h represents the borehole depth (stress relief depth), and t denotes the thickness of the hollow borehole wall. In this method, strain gauges are placed on the rock surface along the direction of strain clusters. By gradually disconnecting the rock core from the original stress field, the stress is eventually relieved. Variations in strain gauges with drilling depth (h) were recorded during the stress relief process.
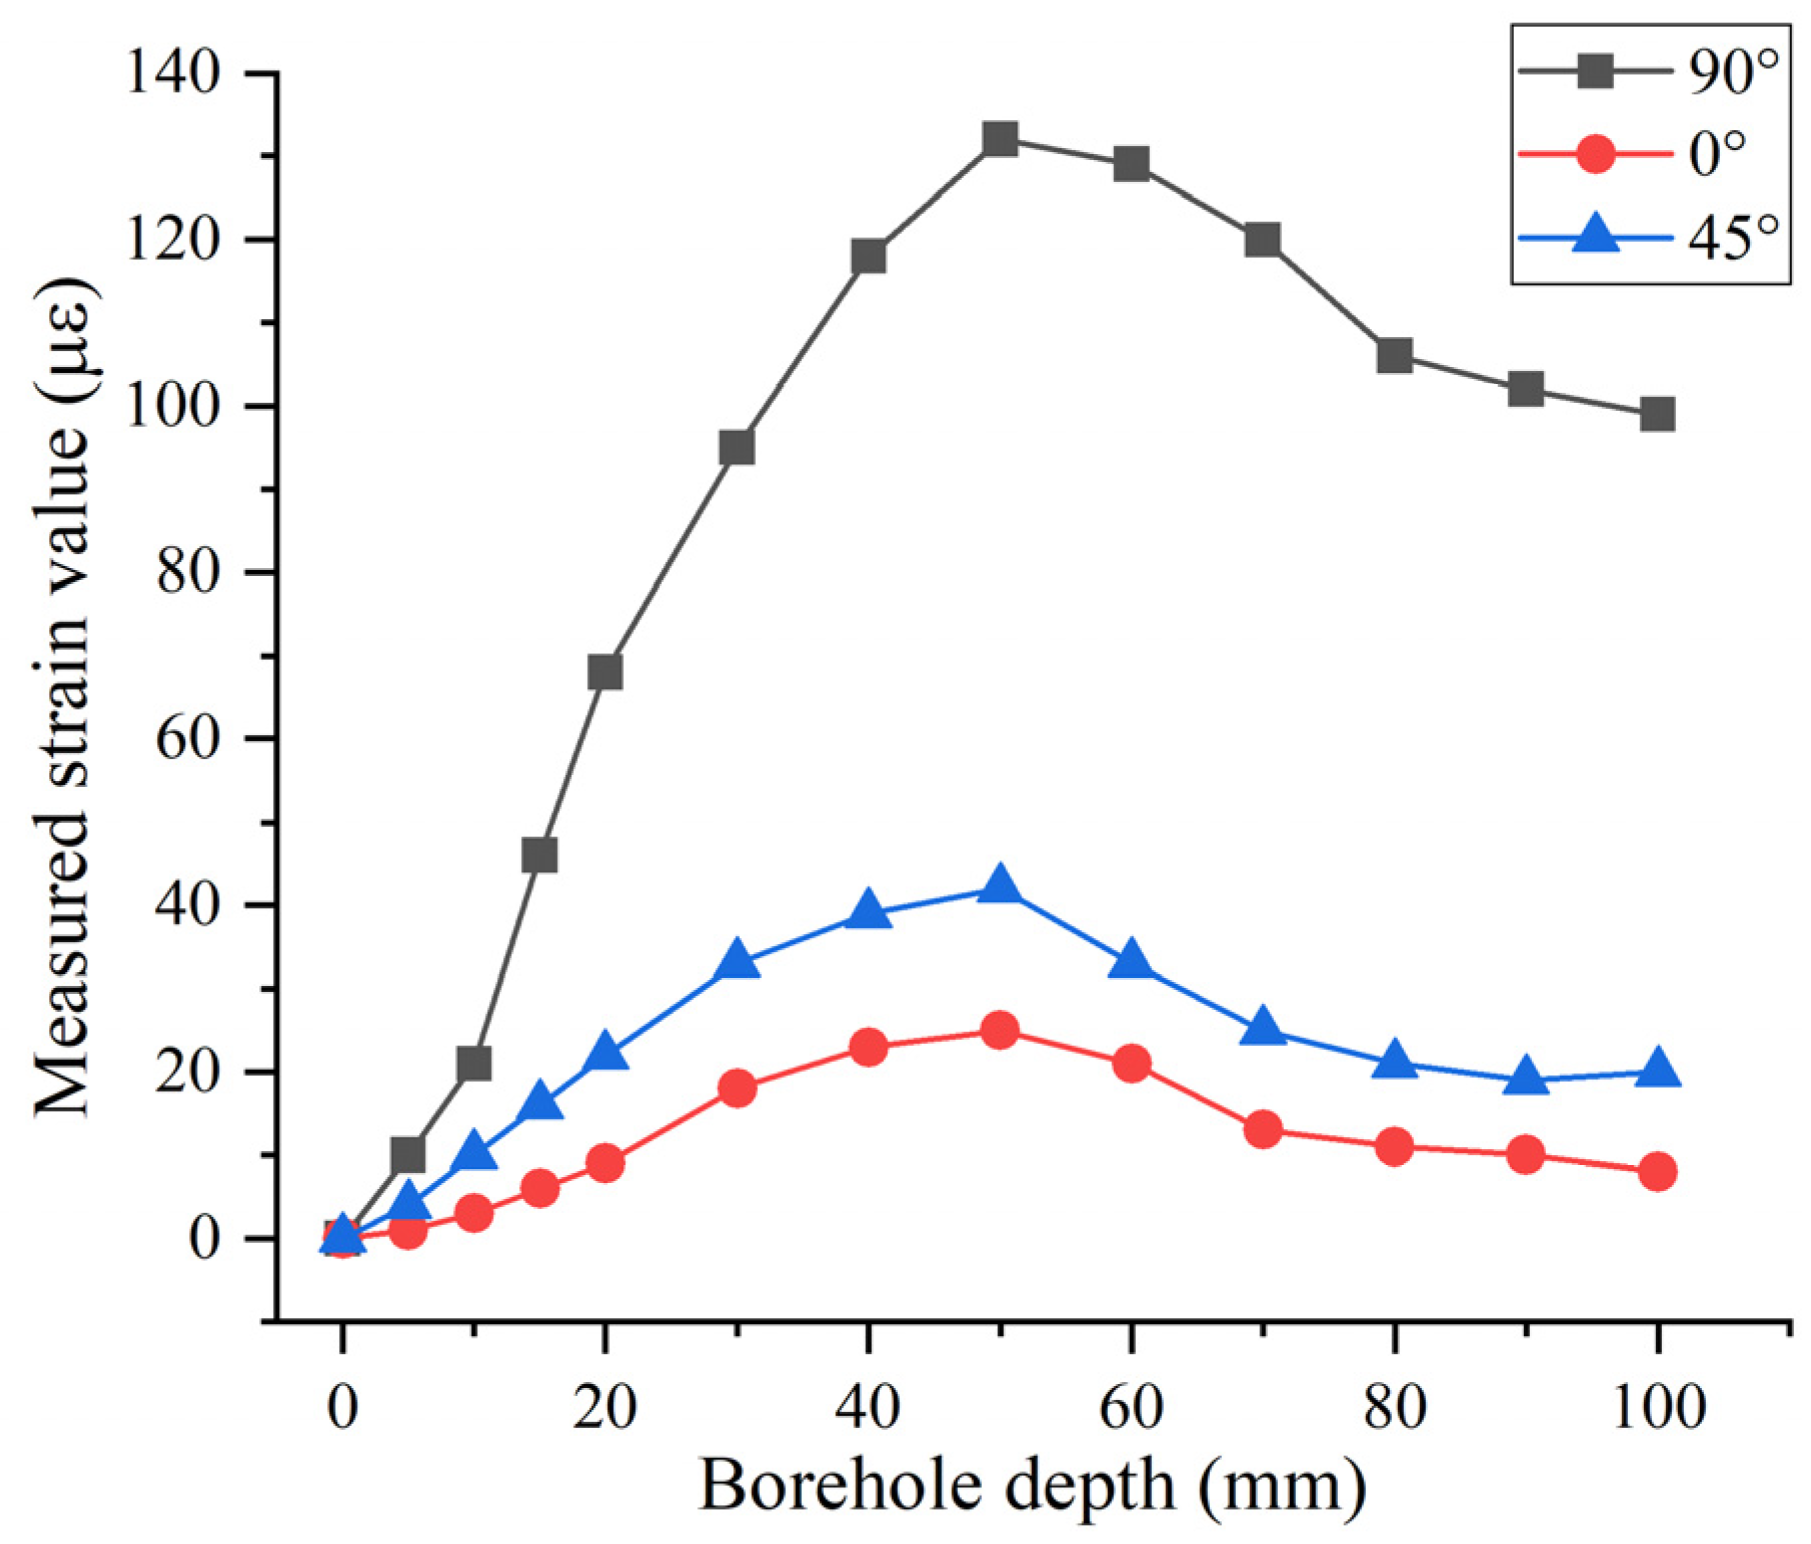
It is worth noting that the strain measured using the borehole stress relief method represents only elastic strain. If the surrounding rock in this study exhibits plasticity or damage, the plastic strain generated by plastic deformation or damage cannot be measured using this method. Figure 2 illustrates the typical strain release curve as a function of borehole depth; however, previous studies found that the maximum released strain value shown in the figure does not necessarily correspond to the existing elastic strain value of the measured object [21]. Therefore, during borehole strain release experiments, it is crucial to ensure that the borehole depth exceeds 1.33 times the borehole diameter to meet the accuracy requirements of the measurements.
Using strain as the inversion target value has certain advantages compared to stress. When the local stress is high, the rock at the measurement point may be in a plastic or damaged state, which can cause changes in the elastic modulus of rock. If the stress is ascertained using elastic criteria and then subject to inversion of the stress field, significant errors occur. On the other hand, strain directly measures the deformation of the rock and is unaffected by changes in the elastic modulus of the rock. Therefore, using the measured elastic strain as the inversion parameter, the errors caused by plastic deformation of the rock can be reduced, thereby improving the accuracy and reliability of the stress field inversion.

2.2. Inversion Process

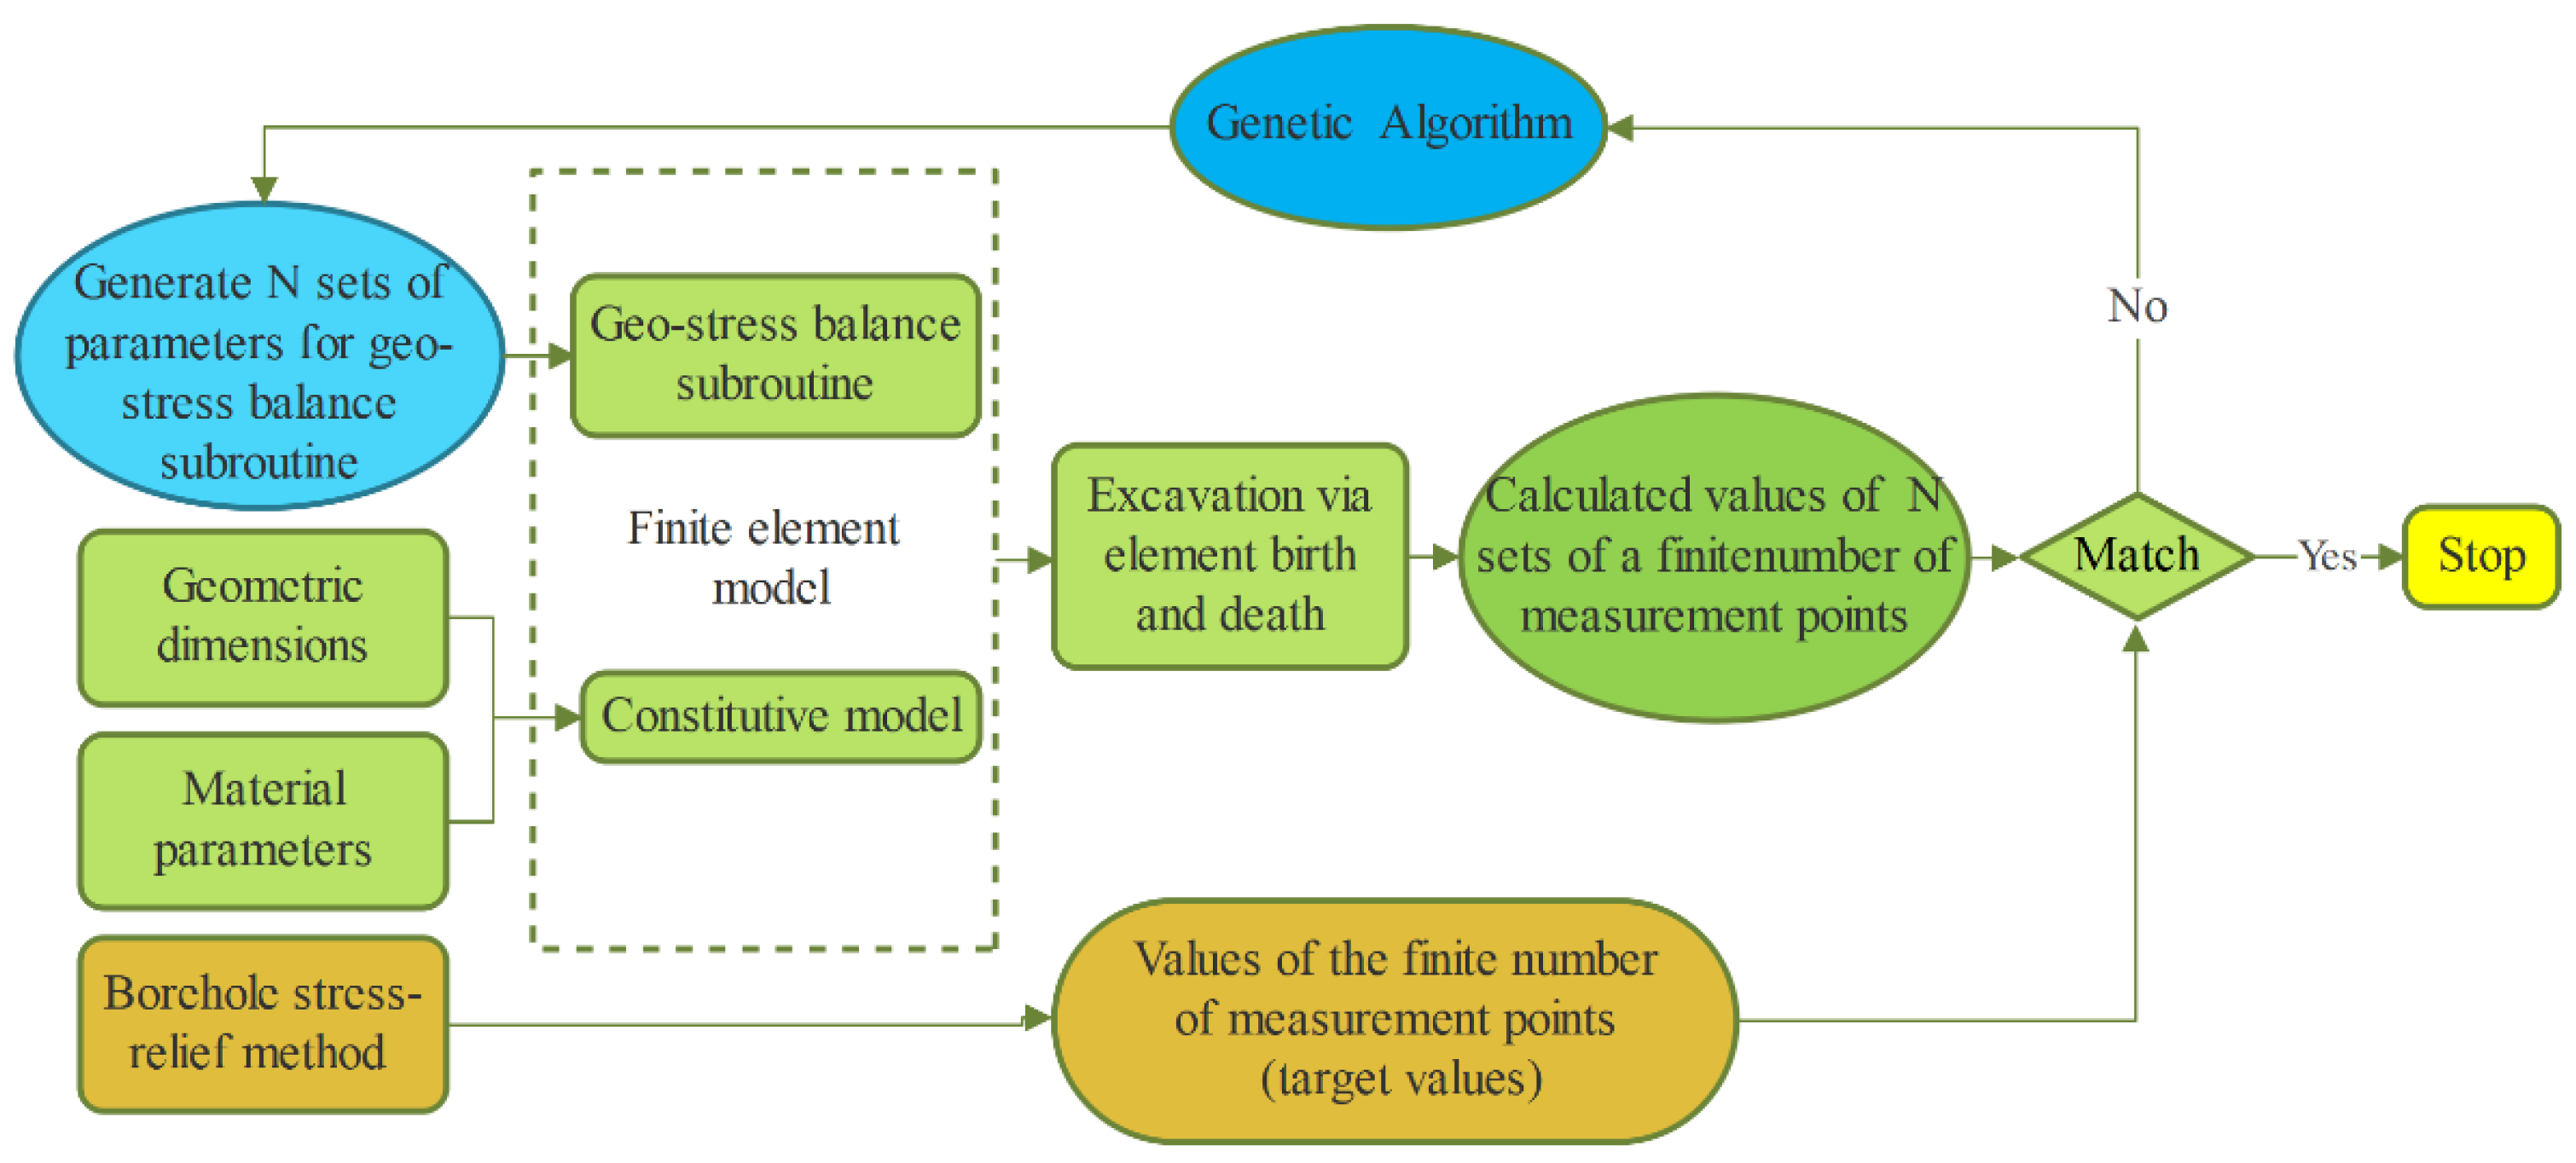
The inversion algorithm developed in this study combines the principles of boundary load method and SMARS algorithm. A finite element model of the tunnel surrounding rock is established using ABAQUS software, and the parameters in the substitute equilibrium stress subroutine are adjusted to represent boundary conditions of the model. The measured elastic strains obtained from the limited measurement points on the tunnel surface are used as target values. The genetic algorithm and improved SMARS algorithm are combined in the MATLAB™ platform, enabling a cost-effective inversion of the stress field. The specific steps (Figure 3) in the process are described thus:
  • The geometric dimensions of the tunnel and rock mechanical parameters can be determined through geological surveys and rock mechanics experiments. Based on this information, a finite element model containing the tunnel is established in ABAQUS. The user subroutine SIGINI is adopted to apply the initial stress field X;
    X = σ x , σ y , σ z , τ x y , τ y z , τ x z
  • Reasonable ranges S of parameter values for the substitute equilibrium stress subroutine in the algorithm’s main program, implemented in MATLAB™, can be defined. Within these ranges, multiple discrete arrays are generated. These arrays Xj can serve as random inputs for the parameters of the stress field subroutine;
    X j = σ j x , σ j y , σ j z , τ j x y , τ j y z , τ j x z   X j S ,   S x j min , x j max
  • The stress field is calculated for each array using ABAQUS. During the calculation process, the overall equilibrium of the stress field is first established, followed by the excavation of the tunnel. Finally, the calculated strains fcm(Xj) corresponding to each array at the measurement points are obtained;
  • The strains at the limited measurement points are extracted for each array, and error analysis is conducted using an error analysis subroutine and the on-site measured strain value fam(Xj). The objective function Ji for error analysis is as follows;
    J i = 1 n i = 1 n f i a m ( X j ) f i c m ( X j )
  • Based on the results of the error analysis, whether or not the minimum required engineering accuracy is met can be determined. If the error meets the requirements, the program terminates. Otherwise, the parameters are mutated, new random arrays Xj are generated, and Steps 3 and 4 are repeated until the minimum error tolerance is satisfied. Finally, the optimal solution Xopt is derived:
    X o p t = σ x o p t , σ y o p t , σ z o p t , τ x y o p t , τ y z o p t , τ x z o p t

2.3. Verification of the Accuracy of the Method

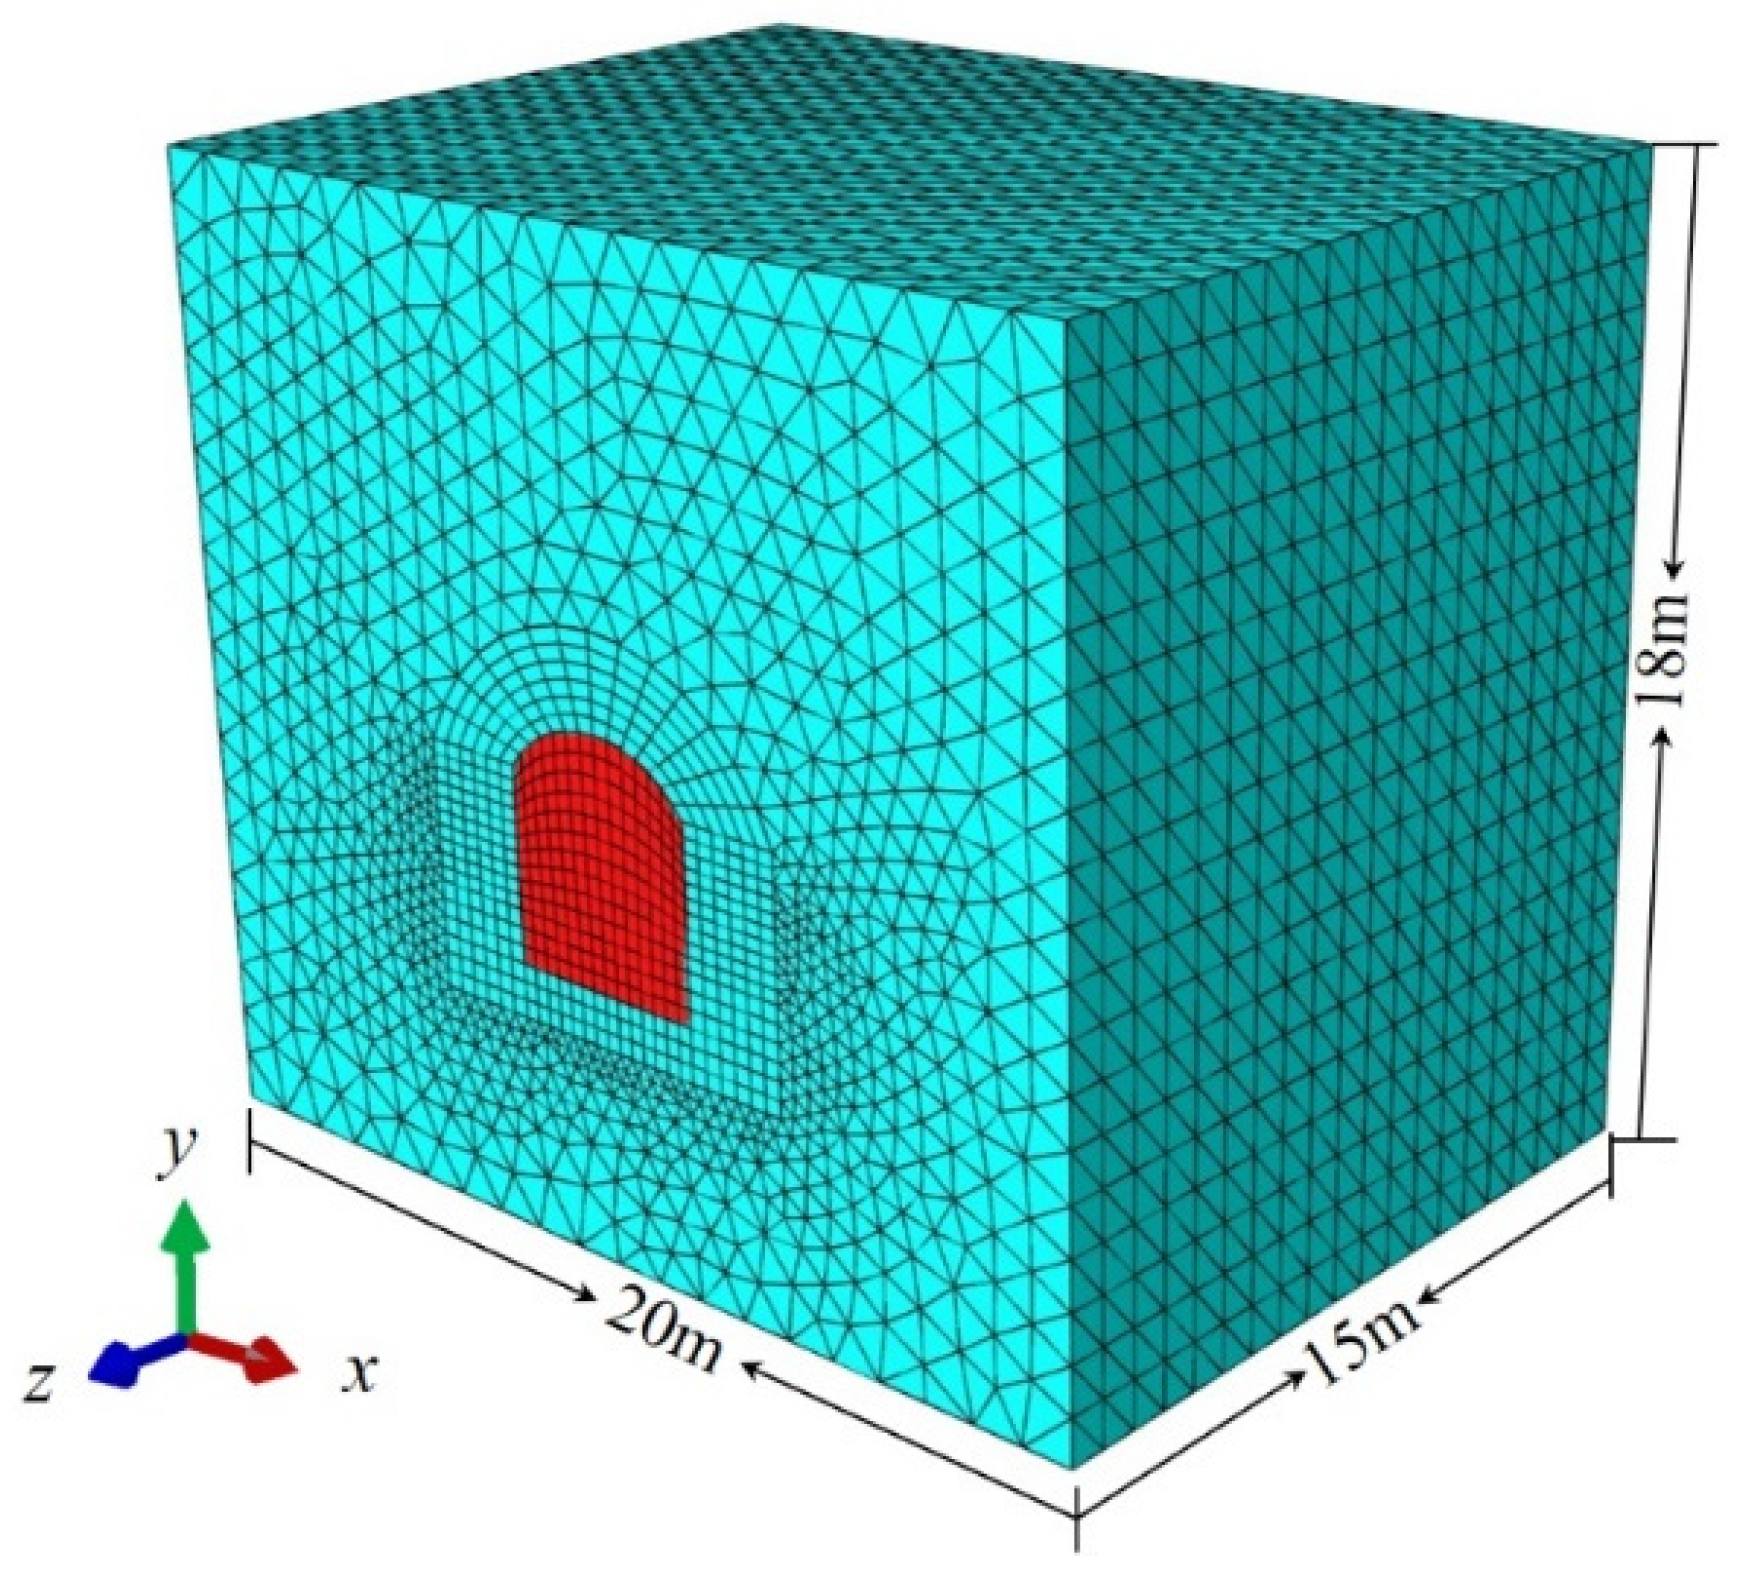
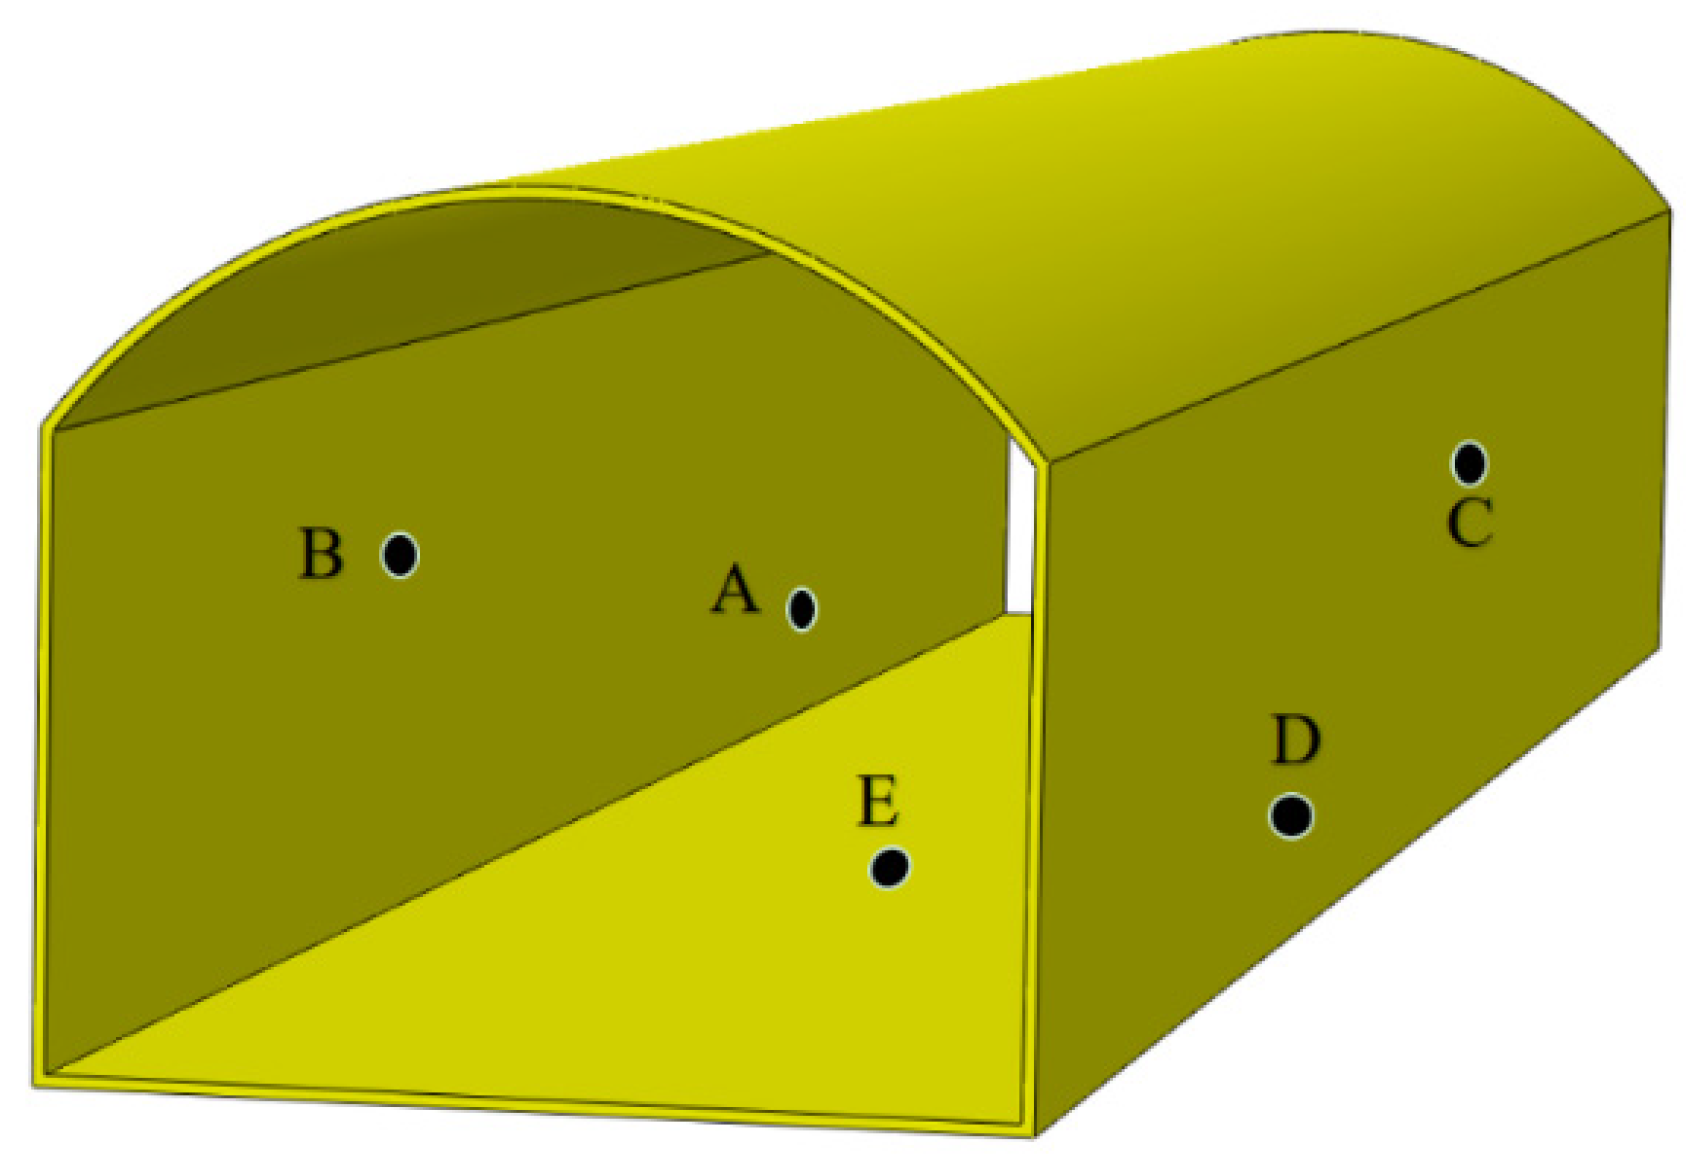
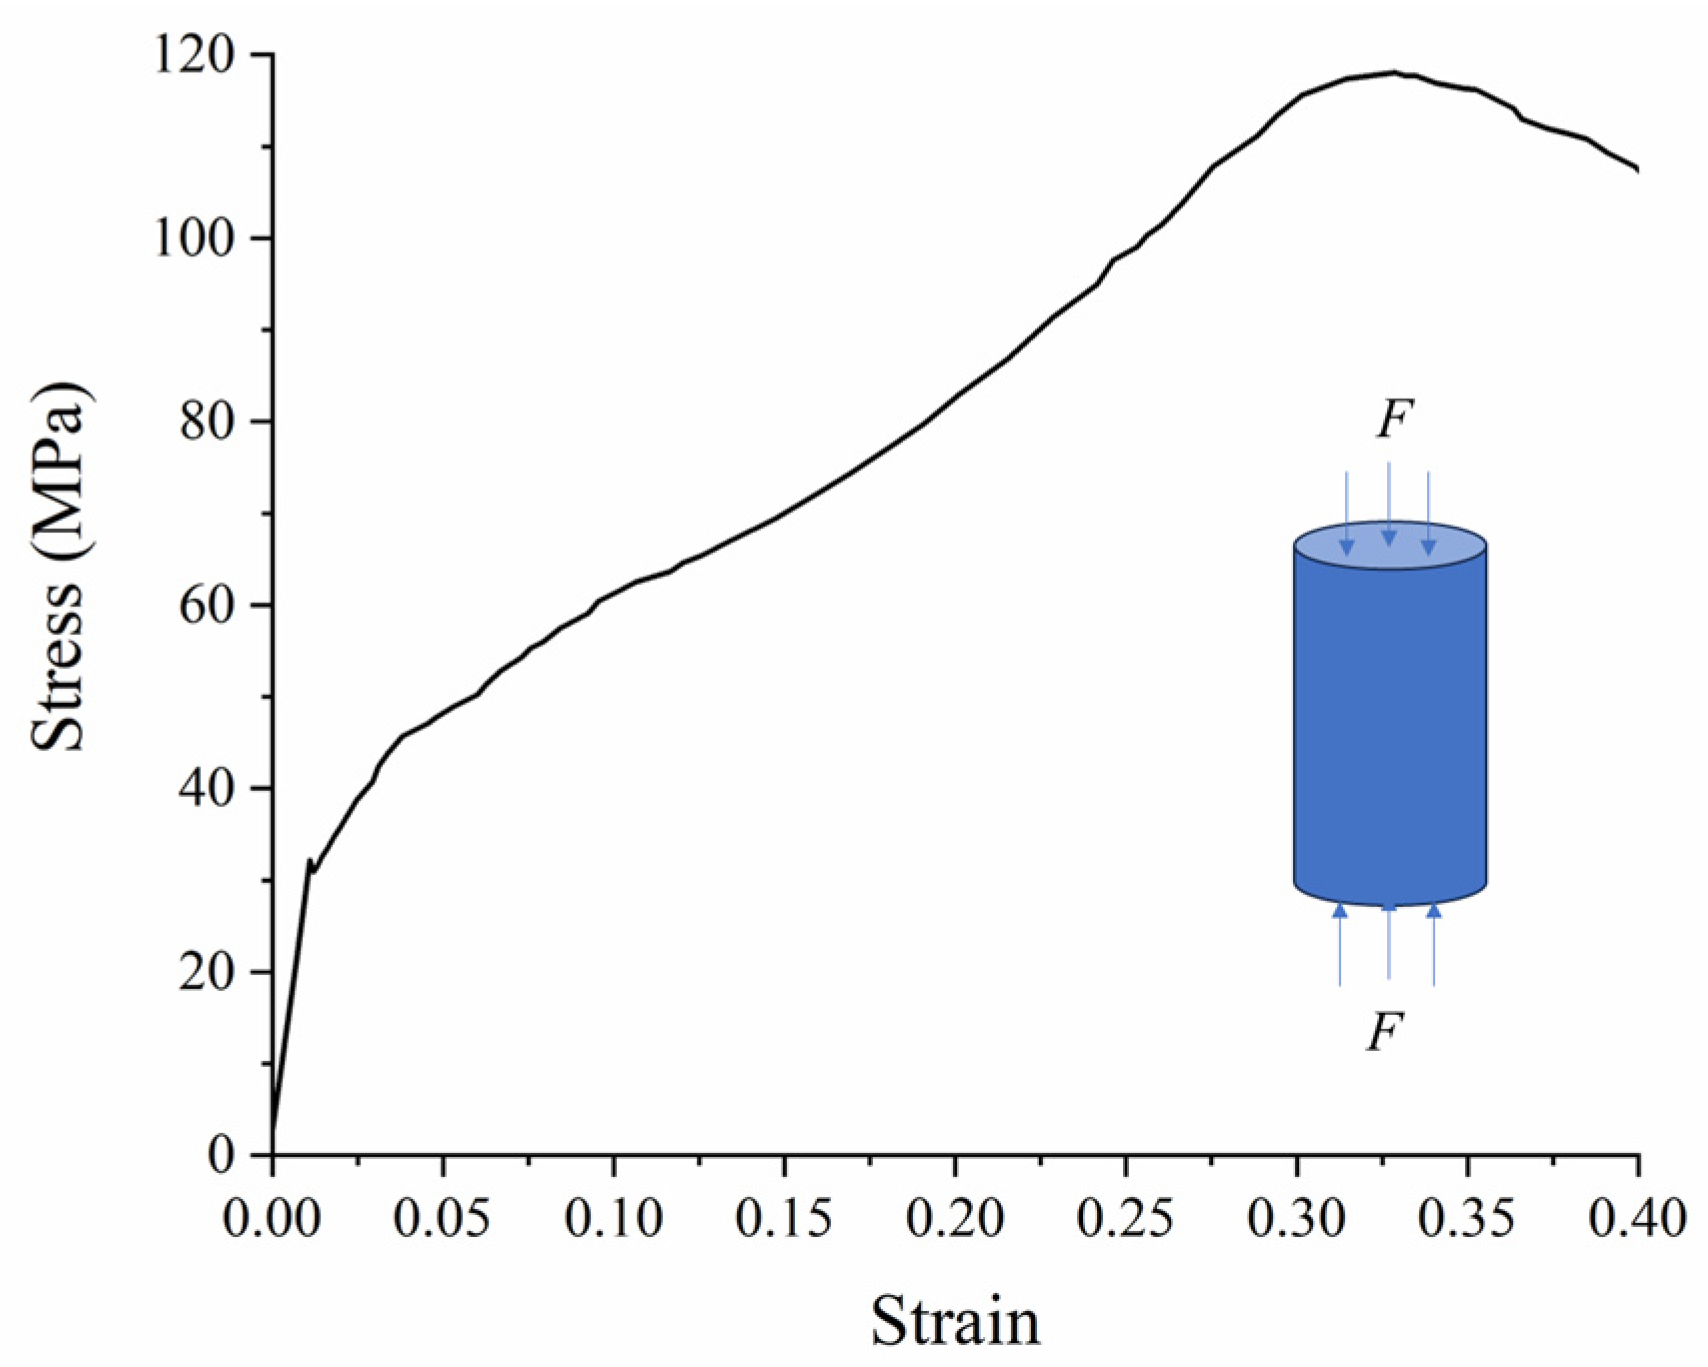
To validate the reliability of the proposed inversion method, a simple three-dimensional tunnel example was constructed for verification (Figure 4). A rock model with dimensions of 18 m × 18 m × 20 m was established, with a tunnel measuring 4 m × 5.6 m (highlighted in red) oriented perpendicular to the tunnel axis (z-direction). Known loads with specified directions and magnitudes were applied to the boundaries of the model. The strains at measurement points A to E (Figure 5) were extracted as the target values for actual measurements. In the example model, the rock had an elastic modulus of 80 GPa and a Poisson’s ratio of 0.25. The Mohr–Coulomb criterion was used to simulate rock plastic damage, with a friction angle of 40.5°, dilation angle of 20.25°, and cohesion of 6.5 MPa. To determine the rationality of rock mechanics parameters, this research uses ABAQUS software to establish a uniaxial cylindrical compression model using Mohr–Coulomb constitutive law. The stress–strain curve of the assumed model is obtained (as shown in Figure 6), demonstrating a typical stress–strain relationship (including plasticity and elasticity) of the rock, and the peak stress of the rock is 118 MPa. In the inversion model, the boundary conditions for the stress equilibrium were set using the geostatic stress subroutine, such that σx = 19.8 MPa, σy = 18.0 MPa, σz = 12.6 MPa, σxy = 5.4 MPa, σyz = 3.6 MPa, and σzx = 7.2 MPa. The target values of the measurement points for inversion were obtained through simple finite element calculations (Table 1); εx, εy, εz, γxy, γyz, and γxz represent the elastic normal strains and elastic shear strains at the measurement points.
However, in practice, we can only measure the vertical (y-direction) elastic strain εy, the along-tunnel (z-direction) elastic strain εz, and the surface shear strain γyz at Points A to D. Additionally, the horizontal (x-direction) elastic strain εx, the along-tunnel (z-direction) elastic strain εz, and the surface shear strain γxz at point E can be measured. Therefore, during the inversion process, this research only considers the elastic strains εy, εz, and γyz at Points A to D, as well as the elastic strains εx, εz, and γxz at Point E. The error is defined as follows:
δ = i = 1 n ε x i ε ˜ x i 2 + ε z i ε ˜ z i 2 + γ x z i γ ˜ x z i 2 + i = n m ε y i ε ˜ y i 2 + ε z i ε ˜ z i 2 + γ y z i γ ˜ y z i 2 / m
where ε x i , ε y i , ε z i , γ x z i and γ y z i are the inverted strain values at Point i, ε ˜ x i , ε ˜ y i , ε ˜ z i , γ ˜ x z i and γ ˜ y z i are the target strain values at Point i.
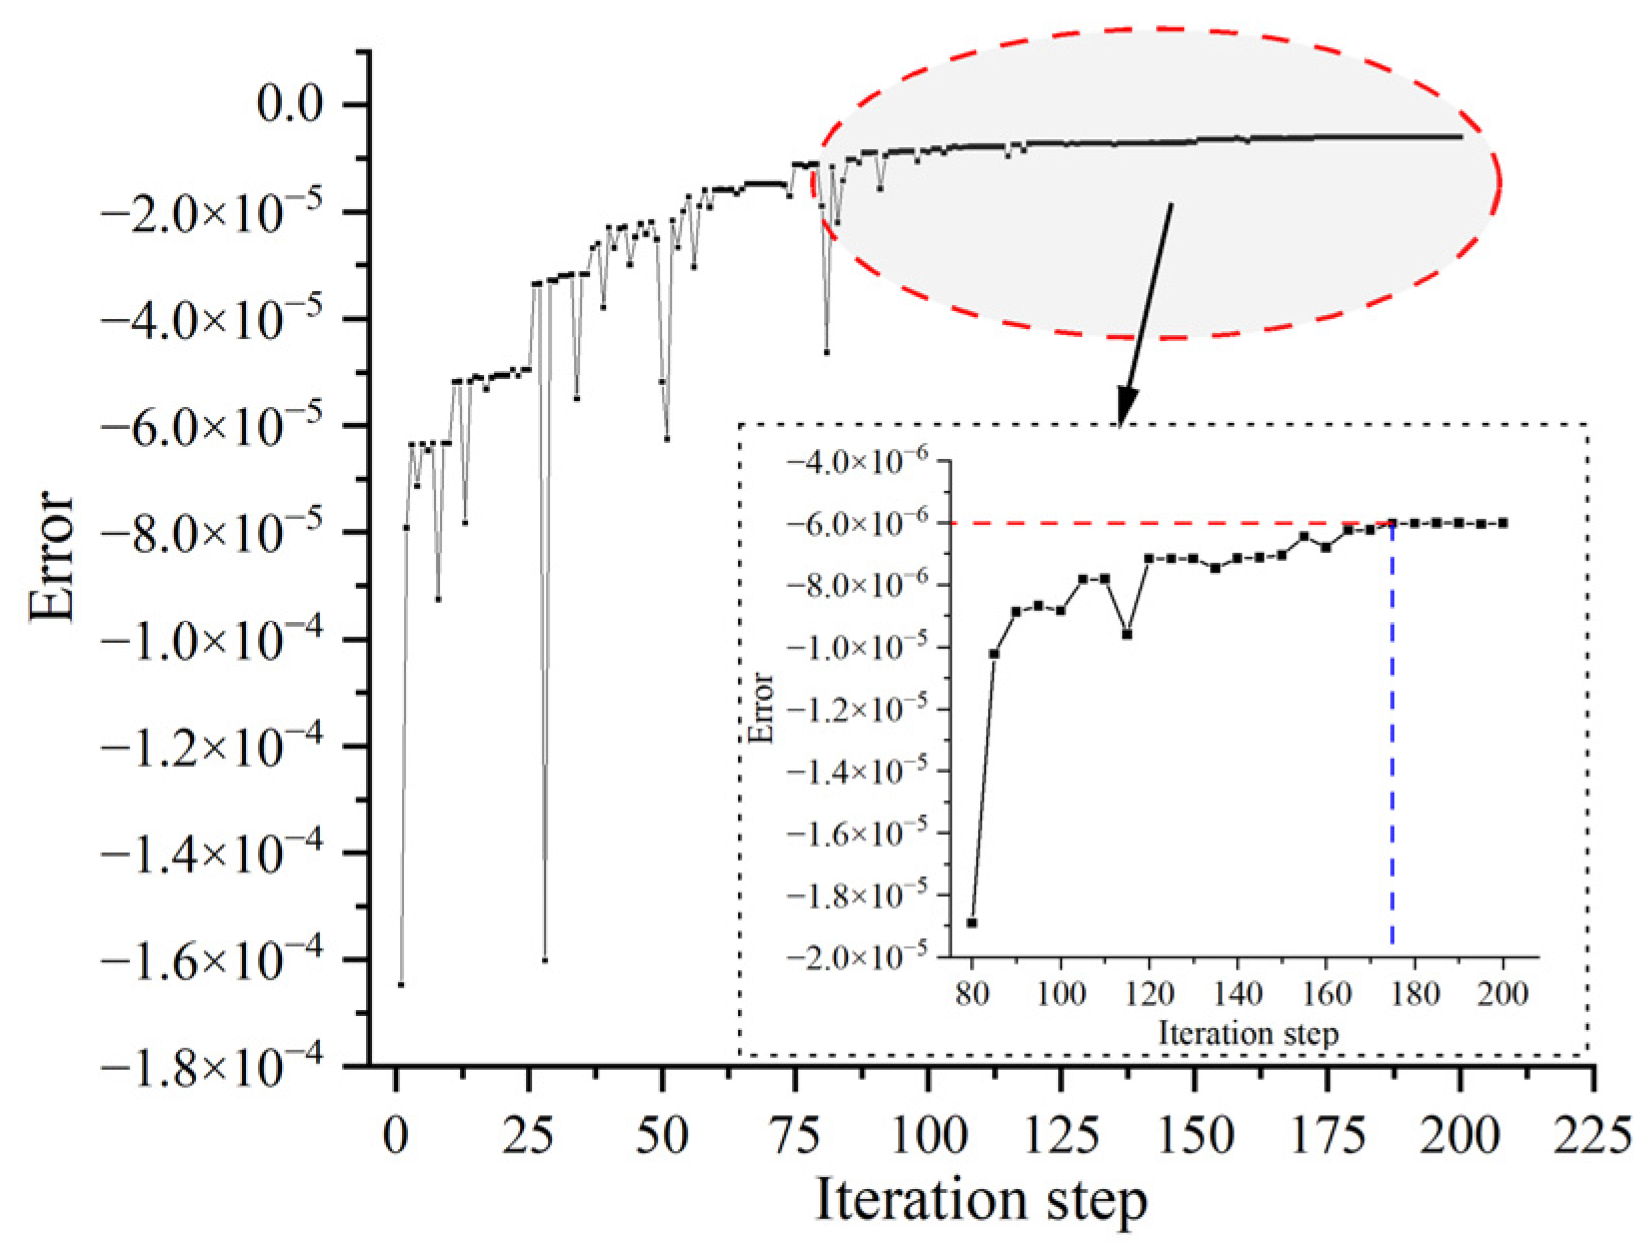
For the three-dimensional case, six parameters should be inverted. Before inversion, the range of each parameter is set, and they are discretized at random into 400 arrays. After 200 iterations, the error stabilizes, and the program is terminated. Figure 7 shows that the error stabilizes after 175 iterations, converging from 165.0 με to 6 με. Considering the error, the inversion accuracy is good; to further validate the accuracy of the inversion, the errors in boundary stresses and measured strain values at the measurement points were analyzed (Table 2 and Table 3). As shown in Table 2, the maximum error in the boundary stresses is 4.44%. In this case, the inverted stresses are as follows: σx = 19.30 MPa, σy = 17.69 MPa, σz = 12.28 MPa, σxy = 5.45 MPa, σyz = 3.76 MPa, and σzx = 7.34 MPa. From Table 3, the maximum error in the measured strains occurs at Point A. This can be attributed to the small reference strain at Point A (−20.31 με). The maximum error in the strains at the remaining points is 3.34%, which is observed at Point E. In summary, based on Figure 7 and Table 2 and Table 3, except for the strain in the z-direction at Point A, the inversion errors at the other points are less than 5%. This level of accuracy fully satisfies practical engineering requirements, indicating that the proposed method can be successfully applied in practice.
To assess the influence of plastic deformation on the inversion results, stress inversion was undertaken in a three-dimensional model using only the elastic constitutive model while keeping other parameters constant. The inverted stress field and the boundary stresses applied are shown in Table 4. By comparing and analyzing the results with those in Table 2, when plastic deformation is ignored in the inversion, the errors in boundary stresses increase, ranging from a minimum of 1.25% to a maximum of 14.44%, and the results deviate significantly from reality; therefore, in deep tunnels or mining areas where the stresses are high, plastic deformation or damage may occur, and it is necessary to consider plastic or damage constitutive models in the finite element model to acquire more accurate results.

3. Engineering Applications

The further to validate the rationality and accuracy of the in situ application of the stress field inversion method, in situ strain measurement tests and inversion analysis were conducted at Macheng Iron Mine. This mine is located in Macheng Town, Luannan County, Hebei Province, China. The mine has a construction scale of 25 million tons of iron ore per annum and was developed using a combination of vertical shafts and inclined ramps. The rock mass shows good stability, low fragmentation, and no significant large-scale joints. The mine is currently in the development stage of the −930 level tunnel, primarily using drilling and blasting methods for excavation. To optimize the blasting design and achieve controlled contouring of the underground tunnels while ensuring safe tunnel excavation, it is necessary to determine the distribution of the stress field in the surrounding rock mass of the Macheng Iron Mine tunnel. For this purpose, the surface stress relief method was employed in the −930 level tunnel of the mine to conduct in situ borehole tests to obtain the surface strains of the tunnel walls. Then, the proposed algorithm was used for stress inversion to identify the stress field distribution around the tunnel.

3.1. Rock Mechanics Parameters

Determining the macroscopic mechanical parameters of the rock mass is crucial before performing numerical simulations. Therefore, the collected rock samples were processed into standard specimens, and their quasi-static properties were measured using the ROCKMAN 207 Hard Rock Triaxial Testing Machine at the Deep Metal Mine Laboratory of Northeast University, China. The obtained parameters for the rock specimens include density, elastic modulus, Poisson’s ratio, internal friction angle, cohesion, and tensile strength (Table 5).

3.2. Measurement and Processing of Surface Strain

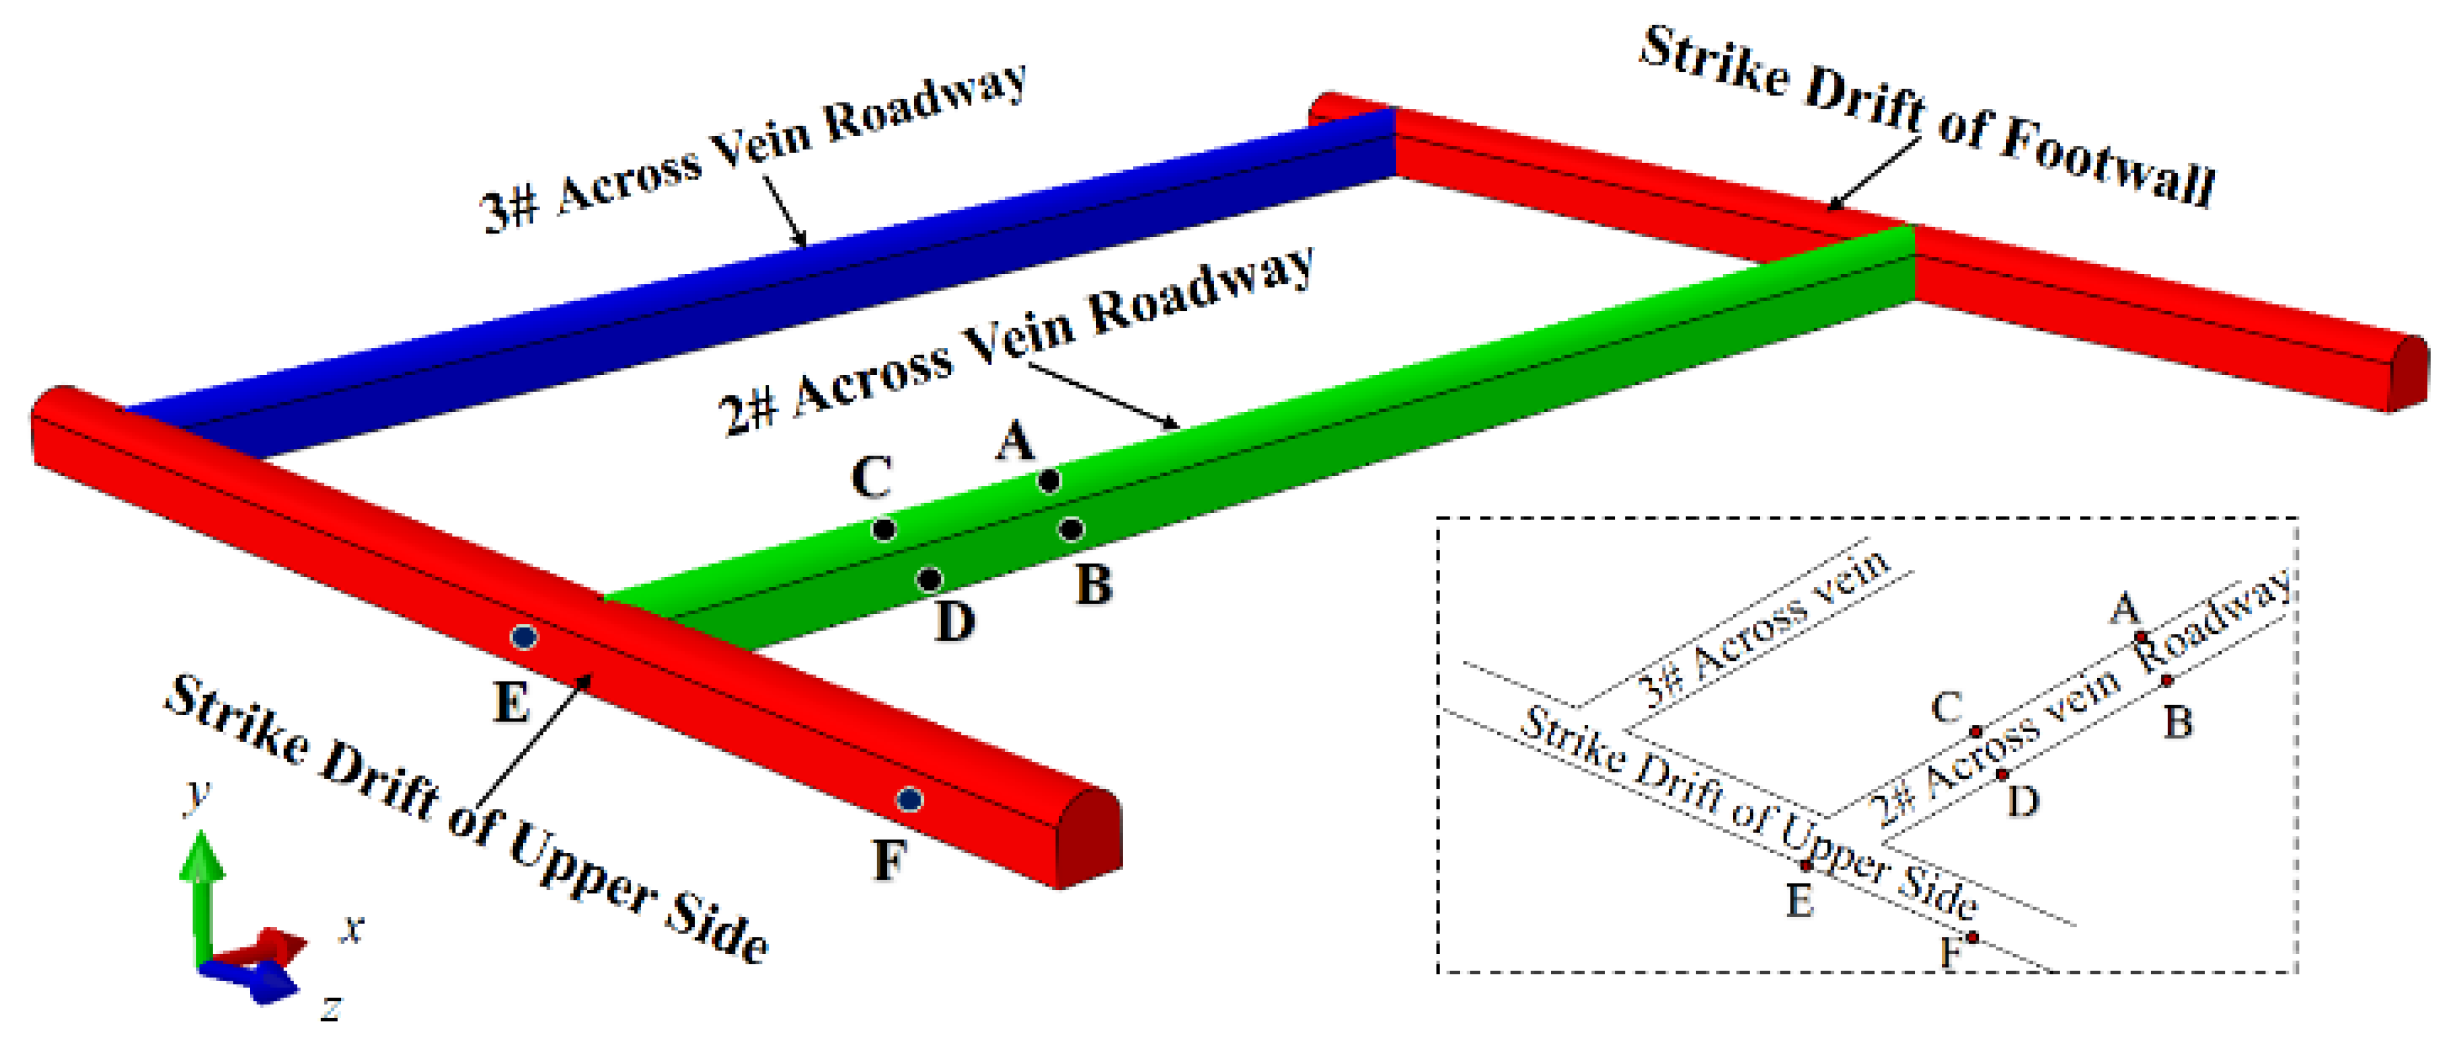
To obtain the variation in surface strain on the rock core, a real-time measurement system for the surface strain of surrounding rock was developed. This system includes a self-made drilling rig (Figure 8), a JM3840 multi-channel continuous strain acquisition instrument (from Yangzhou Jingming Technology Co., Ltd., Yangzhou, China) with corresponding software, a laptop, and other components. Compared to a regular water drilling rig, the self-made drilling rig allows the strain gauge line to pass through the middle of the drill bit, enabling real-time measurement of strain data during the drilling process. In the present study, the sidewalls of the −930 strike drift of the upper side and the 2# across vein roadway were chosen as measurement points to obtain strain data. Four measurement points were arranged in the strike drift of upper side, while five measurement points were arranged in the across vein roadway. The strain data of these measurement points were acquired using the surface stress relief method for subsequent analysis involving in situ stress field inversion. Due to the influences of the geological characteristics of the surrounding rock and the measurement process, surface strain at six measurement points was measured. The test results from these six measurement points provide sufficient and appropriate data for the inversion of the stress field magnitude. The arrangement of these measurement points is shown in Figure 9. To reduce the error in the results of individual boreholes, two of three boreholes were drilled near each measurement point to obtain an average strain. The spacing between multiple boreholes followed the Saint Venant principle to avoid interference. Before measurement, the rock surfaces needed to be prepared, which involved processes such as polish, attaching strain gauges, waterproofing and wiring, borehole data acquisition, post-drilling waterproofing inspection, and core extraction (Figure 10).
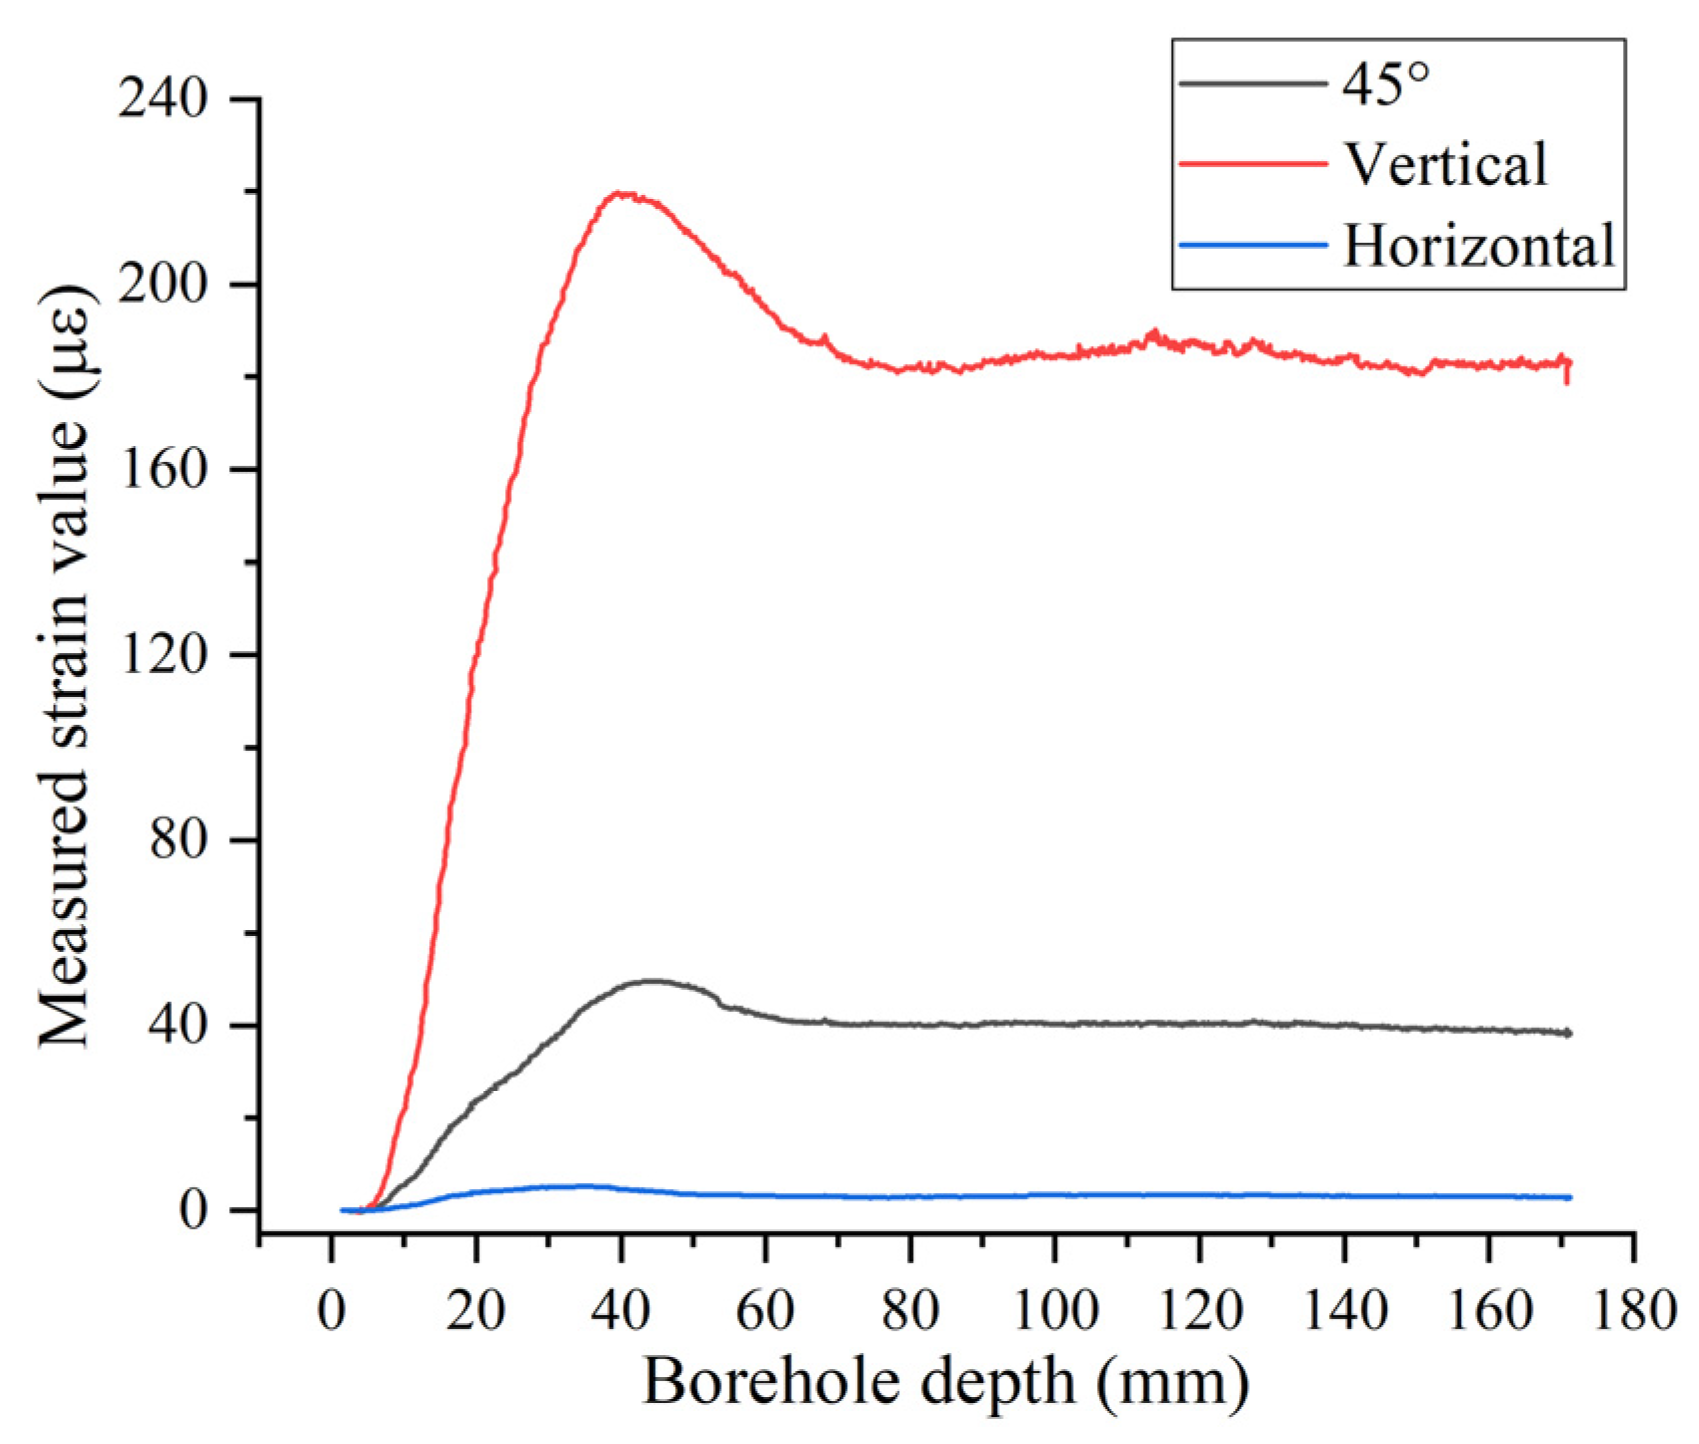
Surface strain measurements were used to quantify the in situ stress, and during the coring process, the surface strain gauges undergo corresponding changes due to the elastic recovery of the rock mass. In this process, the JM3840 multi-channel strain acquisition instrument records the data changes in the strain gauges in various directions. Typical strain variations are illustrated in Figure 11. After processing the measurement data using Equation (6), vertical normal strain, horizontal normal strain, and shear strain at the surface measurement points of the drift can be obtained. Considering the results of Zhang et al. [21], the results were further corrected using Equation (6). In the table, the x, y, and z-directions correspond to the established three-dimensional model xyz-directions, where the x-direction corresponds to the direction of the 2# seam across vein roadway, and the z-direction corresponds to the direction of the strike drift of upper side. During the in situ measurement, the x-direction of the strain gauges corresponds to the directions of the 2# across-vein roadway and the strike drift of upper side, while the y-direction of the strain gauges corresponds to the direction of action of gravity. Table 6 summarizes the corrected strain data for the six measurement points.
ε x = ε 0 ° ε y = ε 90 ° γ x y = ε 0 ° + ε 90 ° 2 ε 45 °
where ε 0 ° is the horizontal strain of the strain gauge, ε 90 ° denotes the vertical strain of the strain gauge, ε 45 ° is the strain in the 45° direction of the strain gauge, ε x is the horizontal strain at the measurement point, ε y represents the vertical strain at the measurement point, and γ x y is the shear strain at the measurement point.

3.3. Inversion Model

Based on the layout of the underground roadways in the field, a three-dimensional numerical simulation model with dimensions of 17.2 m × 90 m × 25 m was established (Figure 12). The rectangular numerical model consists of 86,750 elements, with element sizes ranging from 0.06 m to 0.096 m. The loading process of the numerical model involves three main aspects: balancing the initial stress, applying stress boundary conditions, and excavating the roadways. According to the mining process of the Macheng Iron Mine, drifts were designed with different dimensions. The strike drift has a span of 3.7 m, a vertical wall height of 2.9 m, an arch height of 1.27 m, and a length of 25 m. The across-vein roadway has the same dimensions, and a length of 80 m. To improve the accuracy of the inversion process, the surrounding rock masses of the roadways were finely divided into a mesh. The x-axis is parallel to the direction of the cross-vein roadways, the y-axis is the vertical axis, and the z-axis is parallel to the direction of the along-vein roadways.

3.4. Inversion of Stress Field

Based on the proposed method of stress inversion using surface strain, a three-dimensional numerical model of the underground excavation was established according to the layout of the tunnels. The material properties of the rock mass in the numerical model were assumed based on data in Table 5. With the established model, the six parameters of the stress boundary conditions should be inverted. To facilitate the inversion calculation of the stress field and based on the depth of the tunnels, the following inversion analysis parameters are set: σ y 0 , 30 , σ x 0 , 1.5 × σ y , σ z 0 , 1.5 × σ y , τ x y σ y , σ y , τ y z σ y , σ y , τ z x σ y , σ y , with a population size of 400, crossover probability of 0.8, mutation probability of 0.01, and 300 evolutionary generations. By introducing the mean variance (Equation (1)) for error comparison, the program is terminated by continuously mutating until the mean variance no longer changes. The measured surface strains obtained from measurement Points A to F in Table 6 are input as strain target values into the inversion system. The final inversion results and errors of the measurement points are summarized in Table 7.
As displayed in Table 7, the errors for points ε x , ε y , ε z , γ x y and γ y z , except for measurement point D, are 7.74%. The maximum error for the remaining points is 4.59%. Although the errors are relatively large, the absolute values are small and still satisfy engineering accuracy requirements. The corresponding inversion results for the six stress boundary conditions are shown in Table 8. The results indicate that the vertical stress field in the area is minimal, with the maximum stress along the direction of the crosscut tunnel being 34.72 MPa, and the shear stress ranging from 0.134 to 0.239 times the maximum principal stress.

4. Distribution of the Stresses around the Tunnel

In engineering studies, it is often necessary to determine the magnitude and orientation of the maximum, intermediate, and minimum stresses acting on the rock mass. Through the aforementioned inversion calculations, the normal and shear stresses in the rock mass were obtained. According to Zoback [22] and Amadei [23], if we can obtain the six stress components ( σ x , σ y , σ z , τ x y , τ y z , τ x z ) of the in situ stress field in the xyz coordinate system, the principal stresses (both magnitude and orientation) of the stress field could be indirectly calculated. In this study, based on the principles of elasticity and previous research [24,25], the formulae for calculating the principal stresses ( σ 1 , σ 2 , σ 3 ) and the direction cosines ( l x , m y , n z ) were derived as described below.
The formulae for calculating the principal stresses are as follows:
σ 1 = I 1 3 + R cos φ 3 σ 2 = I 1 3 + R cos φ + 2 π 3 σ 3 = I 1 3 + R cos φ + 4 π 3
where
I 1 = σ x + σ y + σ z I 2 = σ x σ y + σ y σ z + σ z σ x ( σ x y 2 + σ y z 2 + σ z x 2 ) I 3 = σ x σ y σ z + 2 τ x y τ y z τ x z ( σ x σ y z 2 + σ y σ z x 2 + σ z σ x y 2 ) R = 2 3 I 1 2 3 I 2 cos φ = 2 I 1 3 9 I 1 I 2 + 27 I 3 2 ( I 1 2 3 I 2 ) 3 2
The direction cosines of the principal stress vector relative to the x, y, and z-axes are as follows:
l x i = A i A i 2 + B i 2 + C i 2 m y i = B i A i 2 + B i 2 + C i 2 n z i = C i A i 2 + B i 2 + C i 2
where
A i = τ x y τ y z ( σ y σ i ) × τ z x B i = τ x y τ z x ( σ x σ i ) × τ x z i = 1 , 2 , 3 C i = ( σ x σ i ) ( σ y σ i ) τ x y 2
By substituting the six stress components ( σ x , σ y , σ z , τ x y , τ y z , τ x z ) obtained from the inversion into these equations, the principal stresses and their direction cosines with respect to the coordinate axes for the −930 level of Macheng Iron Mine were calculated using Equations (7)–(10). The principal stresses and their direction cosines are summarized in Table 9.
According to the data in Table 9, the maximum principal stress is 38.78 MPa with an angle of 23.31° to the horizontal plane. The minimum principal stress is 11.63 MPa with an angle of 24.15° to the horizontal plane. Both the maximum and minimum principal stresses have angles less than 30° to the horizontal plane. The ratio of maximum to minimum principal stress is 3.33, indicating that the stress field in this area is primarily affected by horizontal tectonic stresses. The intermediate principal stress is 25.68 MPa with an inclination angle of 56.78° and is oriented in the vertical direction. The maximum principal stress is 1.51 times the intermediate principal stress, indicating that the principal stresses in the horizontal plane of the −930 level of the Macheng iron mine are primarily horizontal stresses.
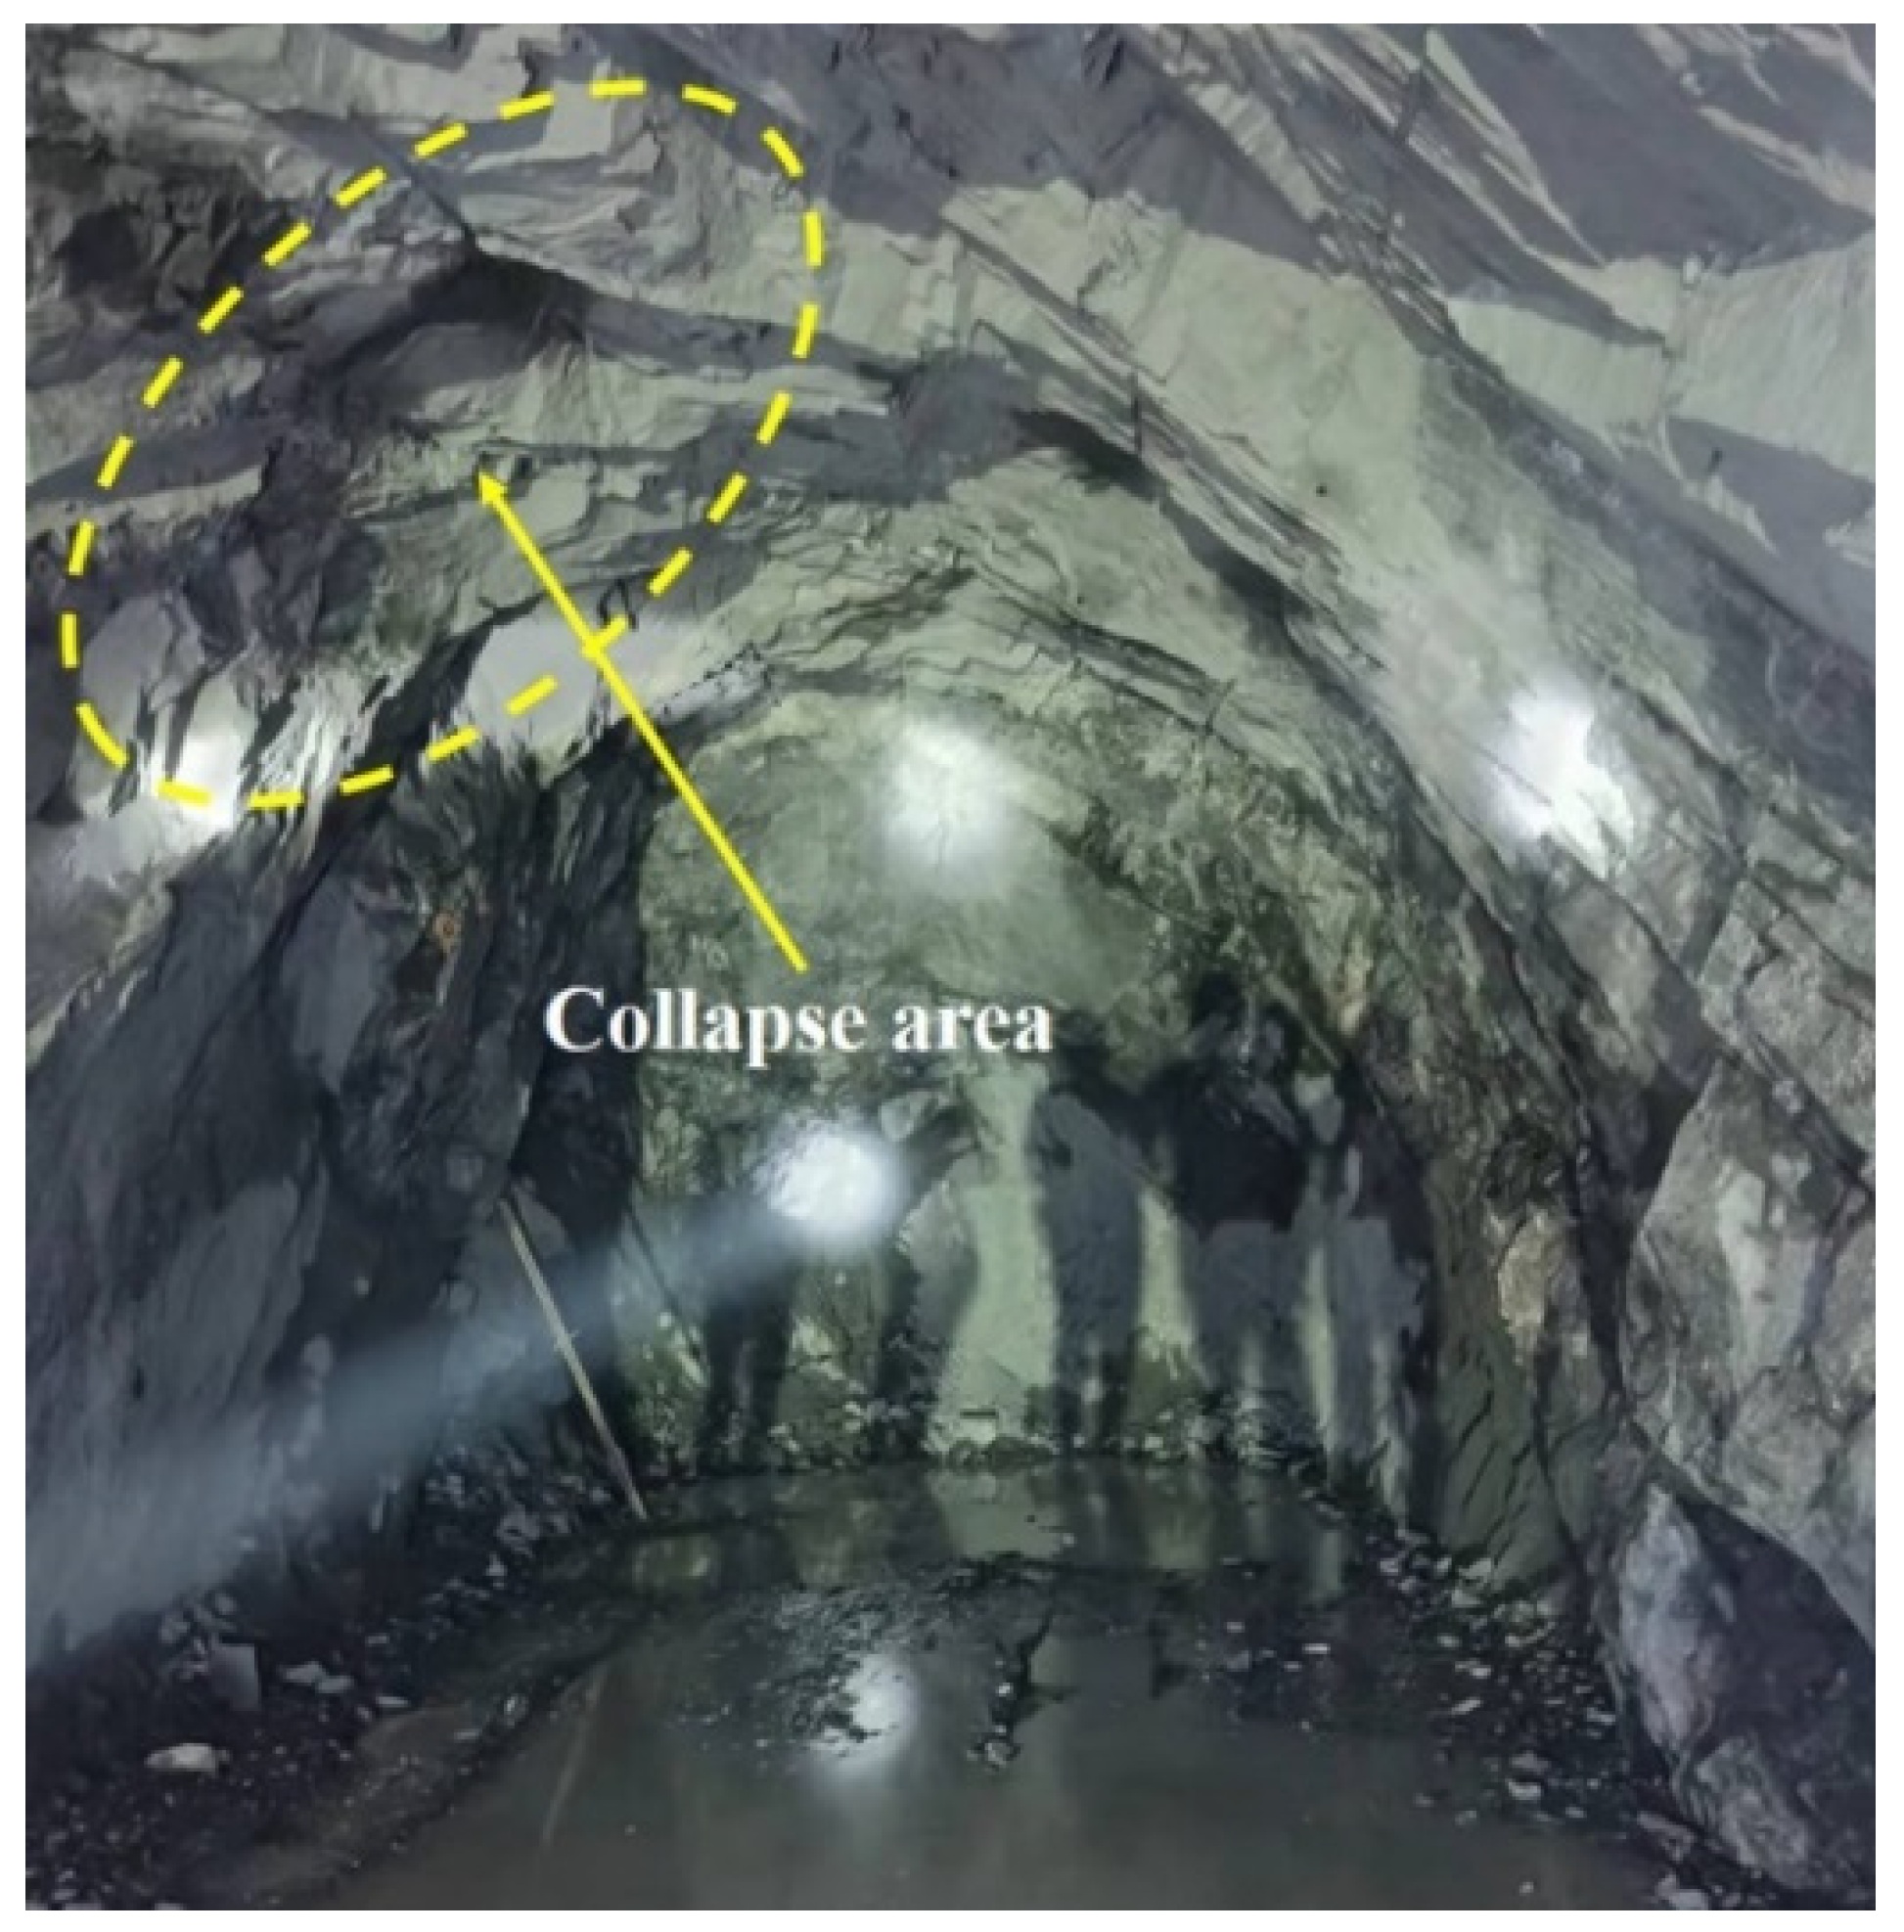
Analysis of the stress calculation results indicates that the −930 level tunnel of the Macheng iron mine has reached the stage of deep mining (depth exceeding 943 m). With increasing depth, the deformation and failure of the tunnel increase, and the difficulty of controlling tunnel stability increases. The in situ stresses play a fundamental role in causing various hazards in deep tunnels. Using the inversion method, the stress field was obtained, and the stress distribution in the surrounding rock of the −930 cross-cutting tunnel was analyzed (Figure 13). The maximum horizontal principal stress around the tunnel was found to be predominantly horizontal. With the excavation of the cross-cutting tunnel, a stress concentration appears at the upper-left corner of the arch roof, with magnitudes ranging from 45 to 51 MPa, exceeding 50% of the uniaxial compressive strength of the rock. Under the influence of blasting disturbance, this part of the surrounding rock is prone to collapse. Additionally, the observed collapse direction in the field (Figure 14) aligns with the direction of the maximum principal stress obtained from numerical simulations, further validating the reliability of the inversion method.

5. Conclusions

In the present study, the tunnel sidewall stress release method was utilized to obtain the elastic strain at finite measurement points on the tunnel surface. By integrating it with the developed SMARS algorithm, a stress-field inversion method for the stresses around a tunnel was proposed based on surface strain measurements. The results were applied to the inversion of the stress data from a deep tunnel and its surrounding rock mass in Macheng Iron Mine. Through validation and field application, the following conclusions can be drawn:
  • The utilization of the equilibrium stress subroutine can avoid errors caused by artificial stress or displacement boundary conditions. Secondly, by directly inverting the stress field based on strain measurements, it circumvents the secondary errors introduced by calculating stresses based on elastic principles. Additionally, by considering the excavation-induced plastic damage to the surrounding rock, severe distortion of the results arising from use of the governing constitutive model can be prevented.
  • Based on accuracy verification through examples and field applications in the Ma Cheng iron mine, the proposed stress inversion method can achieve an accuracy of over 90% in practical applications. Particularly for deeply buried rock masses, this method proves to be a simple and cost-effective approach.
  • According to the in situ stress measurement method proposed in this study, the maximum principal stress, intermediate principal stress, and minimum principal stress in the rock at the Ma Cheng iron mine were calculated as 38.78 MPa, 25.68 MPa, and 11.63 MPa, respectively. The ratio between the maximum and minimum principal stresses is 3.33:1, and the maximum principal stress is 1.43 times greater than the intermediate principal stress. The concentration of stress is evident in the left-hand side of the tunnel arch. These findings are consistent with the observed collapse phenomena.
In practice, we often encounter challenges related to the difficulty and high cost of measuring strain or stress, especially when measuring stress fields in deeply buried tunnels. The inversion method developed in the present study provides an effective solution to this problem. Through a small amount of measurement data, the stress distribution within the problem domain can be revealed without the need for extensive on-site measurements, saving valuable time and costly resources. The proposed method also shows certain limitations; when the rock mass surface is highly fractured or characterized by significant joint development, the accuracy of strain measurements may be compromised, leading to larger errors in the inversion results. Therefore, it is crucial to obtain accurate surface strains under special geological conditions and construct the corresponding geological models with precision. This will be the key to improving the accuracy of stress inversion and an important focus of future research.

Author Contributions

Conceptualization, Q.H. and F.Z.; methodology, Q.H.; software, Q.H.; validation, R.Y., J.P. and S.T.; investigation, Q.H.; resources, R.Y.; data curation, Q.H.; writing—original draft preparation, Q.H.; writing—review and editing, J.P. and F.Z.; visualization, R.Y. and J.P.; supervision, X.Y.; project administration, X.Y.; funding acquisition, F.Z. All authors have read and agreed to the published version of the manuscript.

Funding

This research was funded by the National Natural Science Foundation of China (Grant No. 52274114).

Institutional Review Board Statement

Not applicable.

Data Availability Statement

That data that support the findings of this study are available from the corresponding author, [Q.H.], upon reasonable request.

Conflicts of Interest

The authors declare no conflict of interest.

References

  1. Li, C.; Xu, J.; Pan, J.; Ma, C. Plastic zone distribution laws and its types of surrounding rock in large-span roadway. Int. J. Min. Sci. Technol. 2012, 22, 23–28. [Google Scholar] [CrossRef]
  2. Zhang, Z.; Gong, R.; Zhang, H.; Lan, Q.; Tang, X. Initial ground stress field regression analysis and application in an extra-long tunnel in the western mountainous area of China. Bull. Eng. Geol. Environ. 2021, 80, 4603–4619. [Google Scholar] [CrossRef]
  3. Cai, M.; Qiao, L.; Li, C.; Yu, J.; Yu, B.; Chen, G. Application of an Improved Hollow Inclusion Technique for in-Situ Stress Measurement in Xincheng Gold Mine, China. Int. J. Rock Mech. Min. Sci. Geomech. Abstr. 1995, 32, 735–739. [Google Scholar] [CrossRef]
  4. Sjöberg, J.; Klasson, H. Stress measurements in deep boreholes using the Borre (SSPB) probe. Int. J. Rock Mech. Min. Sci. 2003, 40, 1205–1223. [Google Scholar] [CrossRef]
  5. Funato, A.; Ito, T. A new method of diametrical core deformation analysis for in-situ stress measurements. Int. J. Rock Mech. Min. Sci. 2017, 91, 112–118. [Google Scholar] [CrossRef]
  6. Hayashi, K.; Sato, A.; Ito, T. In situ stress measurements by hydraulic fracturing for a rock mass with many planes of weakness. Int. J. Rock Mech. Min. Sci. 1997, 34, 45–58. [Google Scholar] [CrossRef]
  7. Liu, Y.; Li, H.; Luo, C.; Wang, X. In situ stress measurements by hydraulic fracturing in the Western Route of South to North Water Transfer Project in China. Eng. Geol. 2014, 168, 114–119. [Google Scholar] [CrossRef]
  8. Mohamadi, A.; Behnia, M.; Alneasan, M. Comparison of the classical and fracture mechanics approaches to determine in situ stress/hydrofracturing method. Bull. Eng. Geol. Environ. 2021, 80, 3833–3851. [Google Scholar] [CrossRef]
  9. Qiao, L.; Xu, Z.-H.; Zhao, K.; Li, Y.; Li, Y.; Wang, K.-J.; Cai, H. Study on Acoustic Emission In-situ Stress Measurement Techniques Based on Plane Stress Condition. Procedia Eng. 2011, 26, 1473–1481. [Google Scholar] [CrossRef]
  10. Li, X.; Chen, J.; Ma, C.; Huang, L.; Li, C.; Zhang, J.; Zhao, Y. A novel in-situ stress measurement method incorporating non-oriented core ground re-orientation and acoustic emission: A case study of a deep borehole. Int. J. Rock Mech. Min. Sci. 2022, 152, 105079. [Google Scholar] [CrossRef]
  11. Song, Z.; Yang, Z.; Huo, R.; Zhang, Y. Inversion Analysis Method for Tunnel and Underground Space Engineering: A Short Review. Appl. Sci. 2023, 13, 5454. [Google Scholar] [CrossRef]
  12. Wang, T.X.; Zheng, W.H.; Liang, S.J. Numerical Simulation of Regional Stress Field under Complex Geological Condition. Appl. Mech. Mater. 2011, 90–93, 531–536. [Google Scholar] [CrossRef]
  13. Zhang, S.; Yin, S. Determination of in situ stresses and elastic parameters from hydraulic fracturing tests by geomechanics modeling and soft computing. J. Pet. Sci. Eng. 2014, 124, 484–492. [Google Scholar] [CrossRef]
  14. Li, F.; Wang, J.-A.; Brigham, J.C. Inverse calculation of in situ stress in rock mass using the Surrogate-Model Accelerated Random Search algorithm. Comput. Geotech. 2014, 61, 24–32. [Google Scholar] [CrossRef]
  15. Li, Y.; Guo, Y.; Zhu, W.; Li, S.; Zhou, H. A modified initial in-situ Stress Inversion Method based onFLAC3D with an engineering application. Open Geosci. 2015, 7, 20150065. [Google Scholar] [CrossRef]
  16. Zhang, S.-R.; Hu, A.-K.; Wang, C. Three-dimensional inversion analysis of an in situ stress field based on a two-stage optimization algorithm. J. Zhejiang Univ. Sci. A 2016, 17, 782–802. [Google Scholar] [CrossRef]
  17. Li, G.; Hu, Y.; Li, Q.-B.; Yin, T.; Miao, J.-X.; Yao, M. Inversion Method of In-situ Stress and Rock Damage Characteristics in Dam Site Using Neural Network and Numerical Simulation—A Case Study. IEEE Access 2020, 8, 46701–46712. [Google Scholar] [CrossRef]
  18. Huang, Y.; Zolfaghari, N.; Ohanian, O.J.; Bunger, A.P. Technical Note: An inversion algorithm to estimate maximum and minimum horizontal stress based on field test data for sleeve fracturing. Comput. Geotech. 2021, 137, 104274. [Google Scholar] [CrossRef]
  19. Qian, L.; Yao, T.; Mo, Z.; Zhang, J.; Li, Y.; Zhang, R.; Xu, N.; Li, Z. GAN inversion method of an initial in situ stress field based on the lateral stress coefficient. Sci. Rep. 2021, 11, 21825. [Google Scholar] [CrossRef]
  20. Jin, C.; Lu, Y.; Han, T.; Chen, T.; Cui, J.; Cheng, D. Study on Refined Back-Analysis Method for Stress Field Based on In Situ and Disturbed Stresses. Int. J. Geomech. 2021, 21, 04021141. [Google Scholar] [CrossRef]
  21. Zhang, F.P.; Qiu, Z.G.; Feng, X.T. Non-complete relief method for measuring surface stresses in surrounding rocks. J. Cent. South Univ. 2014, 21, 3665–3673. [Google Scholar] [CrossRef]
  22. Zoback, M.L. First- and second-order patterns of stress in the lithosphere: The World Stress Map Project. J. Geophys. Res. Solid Earth 2012, 97, 11703–11728. [Google Scholar] [CrossRef]
  23. Amadei, B.; Stephansson, O. Rock Stress and Its Measurement; Chapman & Hall: London, UK, 1997. [Google Scholar]
  24. Brady, B.H.G.; Brown, E.T. Rock Mechanics for Underground Mining, 3rd ed.; Springer: Dordrecht, The Netherlands, 2006; pp. 85–141. [Google Scholar]
  25. Zhang, Z.; Qin, Y.; You, Z.; Yang, Z. Distribution Characteristics of In Situ Stress Field and Vertical Development Unit Division of CBM in Western Guizhou, China. Nat. Resour. Res. 2021, 30, 3659–3671. [Google Scholar] [CrossRef]
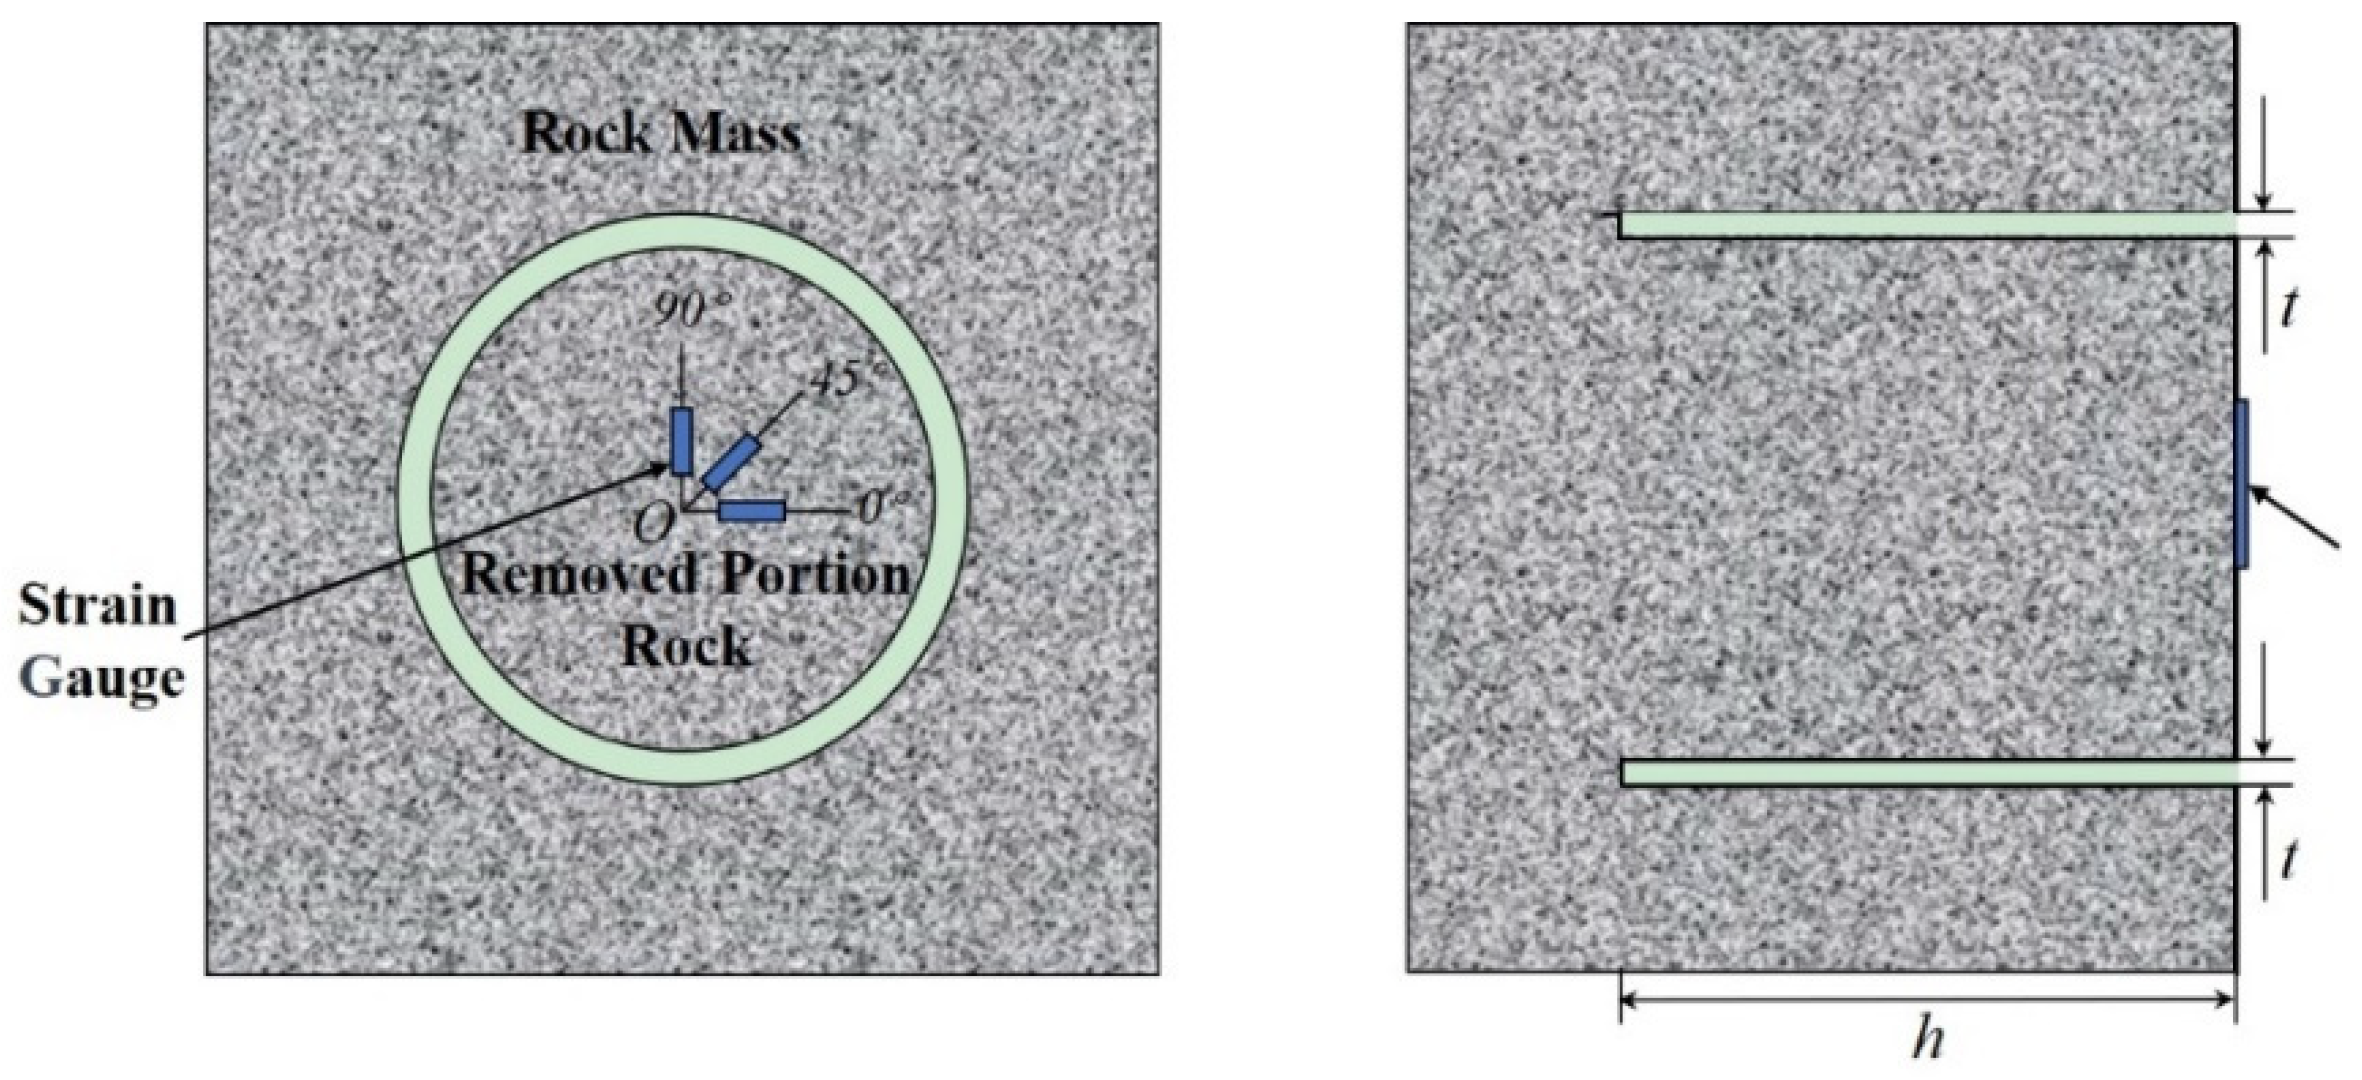
Figure 1. Borehole stress relief and strain gauge locations.
Applsci 13 12507 g001
Figure 2. Strain release values at a certain point varies with borehole depths.
Applsci 13 12507 g002
Figure 3. The inversion calculation process.
Applsci 13 12507 g003
Figure 4. Finite element model.
Applsci 13 12507 g004
Figure 5. Measurement points.
Applsci 13 12507 g005
Figure 6. Stress–strain curve.
Applsci 13 12507 g006
Figure 7. The convergence path of strain error.
Applsci 13 12507 g007
Figure 8. Improved surface-drilling real-time measurement equipment.
Applsci 13 12507 g008
Figure 9. Distribution of measurement points.
Applsci 13 12507 g009
Figure 10. The strain measurement process: (a) polishing; (b) attaching strain gauges; (c) wire bonding and waterproofing; (d) drilling and data collection; (e) post-drilling inspection for waterproofing; (f) core extraction.
Applsci 13 12507 g010
Figure 11. Field-measured strain curve.
Applsci 13 12507 g011
Figure 12. The numerical inversion model.
Applsci 13 12507 g012
Figure 13. The inverted stress field around the tunnel.
Applsci 13 12507 g013
Figure 14. Collapsed zone of the tunnel at the field site.
Applsci 13 12507 g014
Table 1. Measurement point target value during inversion.
Measurement Points ε x ( μ ε ) ε y ( μ ε ) ε z ( μ ε ) γ xy ( μ ε ) γ yz ( μ ε ) γ xz ( μ ε )
A97.37−263.86−20.3161.28−204.9768.75
B93.85−249.94−67.14−76.26−223.1358.03
C78.86−204.86−68.039.83−228.9978.62
D94.72−327.85−15.71−135.78−264.4084.46
E−182.6468.44−49.09−11.36−14.86−11.01
Table 2. Analysis of boundary stress errors.
σ x σ y σ z τ x y τ y z τ x z
Target value19.8018.0012.605.403.607.20
Inversion value19.3017.6912.285.453.767.34
Error2.53%1.72%2.54%0.93%4.44%1.94%
Table 3. Analysis of strain errors at measurement points.
Measurement Point ε x ε y ε z γ x y γ y z
AInversion value (με)-−260.08−18.76-−208.22
Error (%)-1.437.63-1.59
BInversion value (με)-−247.17−66.52-−228.03
Error (%)-1.110.92-2.20
CInversion value (με)-−201.75−67.22-−233.08
Error (%)-1.521.19-1.79
DInversion value (με)-−323.61−15.37-−270.68
Error (%)-1.292.18-2.38
EInversion value (με)−176.88-−47.45−11.54-
Error (%)3.15-3.341.58-
Table 4. Analysis of boundary stress errors (without considering plastic deformation).
σ x σ y σ z τ x y τ y z τ x z
Target value (MPa)19.8018.0012.605.403.607.20
Inversion value (MPa)18.4416.8411.394.734.127.11
Error6.87%6.44%9.60%12.41%14.44%1.25%
Table 5. Physico-mechanical parameters of the rock.
Density
(kg/m3)
Compressive Strength
(MPa)
Tensile Strength (MPa)Poisson’s RatioYoung’s Modulus
(GPa)
Friction Angle
(°)
Cohesion
(MPa)
Average value2530101.158.390.2672.474520
Standard deviation0.0116.730.730.038.576.583.62
Table 6. Strain data of measurement points.
Measurement Point ε x ( μ ε ) ε y ( μ ε ) ε z ( μ ε ) γ x y ( μ ε ) γ y z ( μ ε )
A-−80−16-−83
B-−6018-−75
C−5.2−219-−125-
D13−370-−42-
E11−168-−25-
F14−124-−108-
Table 7. Analysis of strain errors.
Measurement Point ε x ε y ε z γ x y γ y z
AInversion value (με)-78.95−16.74-−80.62
Error (%)-1.314.59-2.87
BInversion value (με)-−58.4118.60-−75.56
Error (%)-2.663.34-0.74
CInversion value (με)0.76216.69-−125.87-
Error (%)-1.05-0.7-
DInversion value (με)7.91−372.88-−38.75-
Error (%)-0.78-7.74-
EInversion value (με)11.63−166.29-−24.81-
Error (%)-1.02-0.76-
FInversion value (με)14−129.91-−107.93-
Error (%)-1.05-0.06-
Table 8. Inferred stress values from field inversion.
σ x σ y σ z τ x y τ x z τ y z
Inverted Values (MPa)34.72025.38015.982−3.400−6.9546.065
Table 9. Principal stresses and their direction cosines with respect to coordinate axes.
Stress Value (Mpa)Cosine Value with Respect to the x-AxisCosine Value with Respect to the y-AxisCosine Value with Respect to the z-Axis
Maximum
principal stress
38.780.85−0.390.35
Second principal stress25.680.470.84−0.28
Minimum
principal stress
11.63−0.170.410.90
Disclaimer/Publisher’s Note: The statements, opinions and data contained in all publications are solely those of the individual author(s) and contributor(s) and not of MDPI and/or the editor(s). MDPI and/or the editor(s) disclaim responsibility for any injury to people or property resulting from any ideas, methods, instructions or products referred to in the content.