Abstract
The Mahuagou gold deposit is among the most important gold deposits in the core of the Huangling Anticline. However, the geochemical exploration on the surface of the mining area presents challenges due to the thin overburden. This paper focuses on the overburden soil of the Fengxiangshugou (FXS)-Mahuanggou (MHG) section as the research object. It utilizes chemical form analysis of gold, soil halogen survey, and heat-released mercury survey to determine the key deep-penetrating geochemical methods for the mining area. The results indicated that Si and Al components of samples exhibit minimal variation, suggesting that drift loads did not influence the overburden soil. Based on the systematic clustering, As, Sb, Mo, Bi, W, and Hg emerge as ore-body or ore-belt front elements of hydrothermal gold deposits. In the study area, the predominant chemical form of gold in soil is the strong organic bond. Compared to the total amount, strong organic bound gold and heat-released mercury show higher anomaly contrasts, making them crucial indicators of faults, intrusions, and hidden ore bodies. Consequently, chemical form analysis of gold and heat-released mercury surveys can enhance the anomaly contrast, proving beneficial for geochemical prospecting for weak anomalies in this area.
1. Introduction
Mineral resource exploration is a vital aspect of contemporary society, driving economic growth and technological progress [1,2]. Gold has been highly regarded among various valuable minerals due to its rarity, enduring value, and versatile applications for centuries. However, the depletion of easily accessible reserves has made exploiting new gold deposits increasingly challenging. To address this challenge, scientists and geologists are pioneering innovative techniques, such as geochemical prospecting [3], and focusing on mineralization trials to understand subsurface permeability.
Geochemical exploration research focuses on analyzing the chemical composition of rocks, soils [4], stream sediments [5,6], and water systems [7] to target potential mineral deposits [8]. Key research methods include primary halos, secondary halos, stream sediments, enzyme leaching [9,10], MMI (Mobile Metal Ions) [11,12,13], MOMEO (Leaching of Mobile Forms of Metals in Overburden) [14,15], NAMEG (Collection of Nanoscale Metals in Earthgas) [14,16], electrogeochemistry [17,18], biogeochemistry [19], Feldspar IRSL (Infrared Stimulated Luminescence), and Quartz OSL (Optically Stimulated Luminescence) [20]. In addition, the Fine-Grained Soil Prospecting Method has displayed its effectiveness in identifying hidden deposits in recent years [21,22,23,24]. These techniques enable scientists to understand the forms and enrichment patterns of ore-bearing information on the Earth’s surface, identify geochemical anomaly zones, and locate concealed mineral bodies. Geochemical surveys are highly effective in delineating zones with potential gold mineralization in gold exploration. By examining the distribution of various elements and their concentration patterns, scientists can infer the geological processes responsible for gold anomalies and predict potential sources.
One of the primary challenges in exploring gold deposits is identifying and characterizing permeable conduits that govern the migration and accumulation of auriferous fluids or constituents within the surrounding lithospheric matrix [25]. These conduits, often associated with specific geotectonic features, such as faults, fractures, shear zones, and microporous domains, are intricately interconnected through various mechanistic associations [26,27]. Gold mineralization experiments provide researchers with a nuanced understanding of rock permeability and the multifaceted factors that drive the mobilization of auriferous fluids.
Gold mineralization trials involve a meticulous process, starting with carefully sampling and curating rock specimens from promising locations and proceeding with rigorous laboratory analyses. Electron microscopy [28], geochemical cartography, and stable isotopic assessment provide a comprehensive framework for elucidating the intricate interplay of mineralogical composition, chemical attributes, and alteration dynamics within gold mineralization [29]. By critically evaluating the attributes of gold-bearing minerals and their interaction with the host rock matrixes, scientific inquiry gains the capacity to unravel the underlying mechanisms driving gold enrichment phenomena, thereby facilitating the identification and delineation of potential exploration targets.
The insights derived from these experimental endeavors contribute to the discovery of novel gold reservoirs and provide invaluable data for the responsible extraction of existing reserves. A comprehensive understanding of the subsurface permeability is paramount in resource stewardship, guiding exploration initiatives while mitigating potential environmental impacts.
This paper involved the collection of samples and proceeded prospecting experiments in the Mahuagou gold deposit, Yiling District, Yichang City, and Hubei Province (Figure 1). This work analyzes major elements, trace elements, chemical forms of gold, and heat-released mercury. These deep-penetrating geochemical indicators will be identified to effectively prospect the Mahuagou gold deposit in Hubei Province, China. The research aims to unlock the potential of the Mahuagou gold deposit and contribute to the sustainable development of the mining industry.
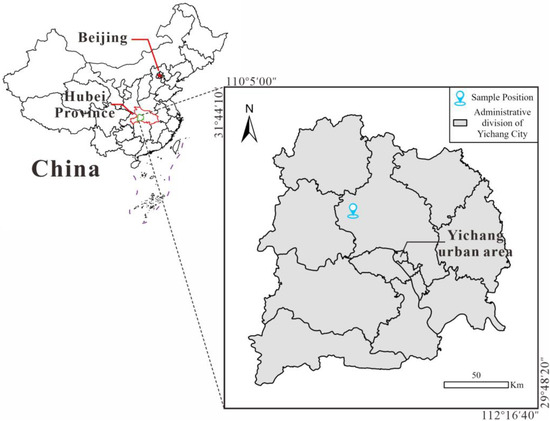
Figure 1.
Geographical location of the study area (data sources: the new (2022) version of the national provinces, cities, districts, and counties administrative boundaries of the nine-dash line vector map data).
2. Geological Setting
2.1. Regional Geological Setting
The Huangling Anticline is located at the intersection of the northern margin of the Yangtze Plate and the multi-directional tectonic lines within the plate [30]. The latitude and longitude of the Huangling Anticline are 30°45′ N to 31°30′ N and 110°45′ E to 111°30′ E, respectively. Since the discovery of primary quartz vein-type gold deposits in 1966, nearly three hundred gold-bearing quartz veins have been identified in this area, accompanied by over seventy occurrences of gold mineralization. Notable deposits include Mahuagou, Baizhuping, Shuiyuesi, and Bancanghe [31]. The region predominantly showcases the Middle to Lower Ordovician metamorphic rock series. In the northern part, these rocks are classified as the “Shuiyuesi Group”.
Meanwhile, in the southwestern part, they belong to the “Kongling Group”, as per the West Hubei Geological Brigade reports from 1987 and 1991. Both rock units form the foundational rocks of the Huangling Anticline, and the Huangling Anticline has been intruded by subsequent granitic formations [32]. They have later been collectively termed the Kongling Group, also known as the Kongling Complex or Huangling Complex, by the Hubei Provincial Bureau of Geology and Mineral Resources. The ancient exposed basement metamorphic rocks in this region have yielded an amphibolite Sm–Nd isochron dating age of 3290 ± 170 Ma from the Kongling Complex [33]. Hence, this region is crucial for gold mineralization in Hubei Province and offers valuable insights into the ancient basement of the Yangtze Plate [34,35].
As depicted in Figure 2a, the Huangling Anticline is a nearly north–south trending dome-shaped short-axis fold, spanning roughly 73 km in the north–south direction and about 36 km in the east–west orientation. The core of the Anticline is mainly composed of the Huangling Complex and Huangling Granite. In contrast, its limbs are predominantly made up of marine carbonate and clastic rocks from the South China Series to the Triassic, all dipping away from the core [36].
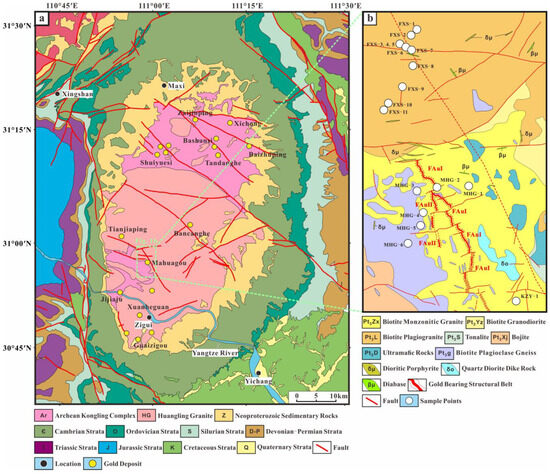
Figure 2.
Geological map of the Huangling Anticline and sample point locations: (a) geological map of the Huangling Anticline and some gold deposit locations in the Huangling Anticline (the map was modified according to Cui et al., 2022 [35], Wang et al., 2023 [37], Institute of Geology, Chinese Academy of Geological Sciences, and Seventh Geological Brigade, Hubei Geological Bureau); (b) geological map of Mahuagou gold deposit and sample point locations.
The Huangling Granite primarily characterizes the magmatic rocks exposed in the Huangling Anticline area. This granite is one of the few intracontinental Neoproterozoic granitic bodies within the Yangtze Plate [38]. The Huangling Granite mainly consists of granite porphyry, trondhjemite, biotite monzogranite, tonalite, and quartz diorite. In the study “Sequence, Evolution, and Gold-bearing Properties of Precambrian Metamorphic Complexes in the Huangling Anticline”, the West Hubei Geological Brigade (1996) categorized the acidic rocks in the core of the Huangling Anticline into four super units: Duanfangxi, Sandouping, Huanglingmiao, and Dalaoling, as well as the Xiaofeng composite pluton, with ages ranging from early Neoproterozoic to the middle Neoproterozoic.
2.2. Geological Setting of Mining Area
The Mahuagou gold deposit stands out as one of the most prominent gold deposits in the core area of the Huangling Anticline in Yichang, Hubei. This deposit is a medium- to low-temperature quartz vein-alteration/structural type gold deposit. It is governed by northwest-trending brittle–ductile shear zones and stands out for small scale, high grade, and ease of beneficiation [39]. Since exploration commenced in the 1990s, two major north–northwest-trending gold-bearing structural zones have been identified and labeled as FAuI and FAuII (as illustrated in Figure 2b) [40]. At a drilling elevation of around 800 m, the No. I and No. II ore-bodies within the FAuI zone are notable for their stability, high-grade content, significant thickness, and rapid thinning out [41]. As a result, the deeper gold mineral resources within this mining region show considerable exploration potential; this makes uncovering concealed ore bodies at greater depths a pivotal challenge for future exploration breakthroughs in the Mahuagou mining district.
The geological characteristics of the Mahuagou mining area are primarily defined by the contact zone between the biotite plagioclase gneiss in the Gucunping Formation (Pt2g) and the biotite monzonitic granite in Zongxifang Unit (γPt3Zx). The Gucunping Formation (Pt2g) is divided into two segments: Gucunping Formation Segment 1 (Pt2g1) and Gucunping Formation Segment 2 (Pt2g2). Both segments have similar lithology, characterized by alternating layers of biotite plagioclase gneiss and plagioclase amphibolite. Within the biotite monzonitic granite (γPt3Zx), there are numerous lens-shaped metamorphic enclaves and bits of early plagioclase granite enclaves. Plagioclase granite enclaves often exhibit mylonitization, and the biotite monzonitic granite locally displays foliation, indicating that the rock body was emplaced under the influence of strong shearing stresses. Within the mining area, various types of veins with diverse morphologies and orientations are exposed, including granite pegmatite veins, diorite porphyrite veins (δμ), diabase veins (βμ), and other mafic veins. These veins have been interpreted as the filler of early faults and fracture structures, with prevalent orientations in the nearly east–west and northwest–west orientations. The Mahuagou brittle–ductile shear zone is a significant mineralized structural zone formed during the early Neoproterozoic, situated at the contact zone between biotite monzonitic granite (γPt3Zx) and biotite plagioclase gneiss (Pt2g). During the intrusion of the granite (γPt3Zx), lateral compression and north–northwest orientation right lateral shearing persisted, giving rise to early compressional mineralized structures, with later tectonic activities displaying evident extensional and torsional features. Gold mineralization primarily occurs within the felsic cataclastic rock in the mineralized structural zone, with the occurrence of quartz micro veins and sulfide micro vein infillings.
3. Samples and Methods
3.1. Collection and Pretreatment of Soil and Rock Samples
Soil samples for this research were collected from the Fengxiangshugou–Mahuanggou section of the Mahuagou mining area (as shown in Figure 2b) located in Yiling District, Yichang City, Hubei Province (as shown in Figure 1). In the Fengxiangshu section, following the trend of the IP (Intensification Polarization) section, 11 bags (approximately 700 g/bag) of soil, fault gouge, and fault cataclastic rock samples were collected from the northeast to southwest. In the Mahuagou section, along exploration line No. 7 of the mining area, 6 bags (approximately 700 g/bag) of soil samples were collected from the northeast to southwest, crossing the ore body along the X206 village road. Additionally, 1 bag (approximately 700 g) of loose soil sample was taken from beside the Kaziya trench.
After returning the collected samples to the laboratory, the sealed bags were opened, and the moisture inside the bags was allowed to air dry for a day using ambient airflow naturally. After the preliminary drying, each sample was individually and evenly spread out on A4 paper. These samples were placed on a shaded, well-ventilated tabletop away from direct sunlight and areas with artificial airflow sources, such as air conditioning and frequent human activity. Subsequently, for a week, daily inspections, turning of samples, removal of small stones and plant roots, and gentle tapping of consolidated soil were conducted using small sticks; this ensured that the surface and interior of the samples dried thoroughly, preventing consolidation at the bottom. Once the drying process was completed, the samples were promptly returned to sealed bags and stored properly.
In order to accommodate the requirements of specific analytical tests, we subjected a portion of the total sample to grinding and sieving. Prior to grinding, we manually removed plant residues, stones, bricks, and non-soil components. The grinding process utilized an agate mortar and pestle while sieving employed a 200 mesh (75 µm) nylon sieve. Soil powder obtained after sieving was collected on A4 paper and labeled with corresponding numbers before being placed in paper bags, which were then sealed in plastic bags for preservation. Following the completion of grinding and sieving for each sample, all tools were rinsed with deionized water and then dried in an oven. Tabletops were cleaned, and A4 paper was replaced as needed. Throughout these procedures, stringent measures were taken to ensure the independence of each sample, preventing cross-contamination and mixing of sample components, thus ensuring the accuracy and effectiveness of subsequent experiments.
3.2. Analytical Methods
3.2.1. Mineral Composition Analysis by X-ray Diffraction (XRD)
According to the standard method, “Analysis Method for Clay Minerals and Ordinary Non-clay Minerals in Sedimentary Rocks by the X-ray Diffraction” (SY/T 5163-2018) [42], a 0.4 g sample was utilized. The sample powder was carefully placed into the groove of the sample slide, ensuring that the measured surface of the sample remained rough and maintained a flat and even alignment with the surface of the sample slide to avoid preferential crystal powder orientation. The TD-3500 diffractometer manufactured by Dandong Tongda Technology Co., LTD, Dandong, Liaoning, China, was used for detection under the following conditions: 30 kV acceleration voltage, 30 mA beam current, Cu Kα radiation, and Ni filter. The parameters for detection included a scanning range from 3.00° to 45.00° 2θ, a wide angle of 0.02°, a sampling time of 0.6 s, a scan speed of 0.033 s, and a total time (h:m:s) of 0:21:00.
The sample was detected to obtain X-ray diffraction spectra. Subsequently, the X-ray diffraction spectra were processed using the TD-3500′s data processing software (MDI JADE 6.5, ICDD, Livermore, CA, USA). The software utilized the Inorganic Crystal Structure Database (ICSD) based on the sample’s characteristics.
3.2.2. Soil Major Elements
According to the standard method, “Determination of Twenty-two Elements in Geological Samples by Inductively Coupled Plasma Optical Emission Spectrometry” (WSBB/004-2019) [43], an inductively coupled plasma optical emission spectrometer was used to quantify Al, Fe, Mg, Na, and S in the samples. A sample mass of 0.2500 g was weighed into a PTFE crucible and moistened with a small amount of water, followed by the addition of 6 mL of nitric acid, 10 mL of hydrofluoric acid, and 2 mL of perchloric acid. The mixture was decomposed on a 200 °C hotplate and was then evaporated. In case of incomplete decomposition, nitric acid and hydrofluoric acid were replenished before evaporation. The slightly cooled mixture was treated with 8 mL of aqua regia, heated on the hotplate until the solution volume was reduced to 3–5 mL, and the crucible walls were rinsed with approximately 10 mL of deionized water. Mild heating (5–10 min) was applied until the solution was clarified. The cooled solution was then transferred to a polyethylene tube, diluted with water, brought to a final volume of 25 mL, and thoroughly mixed. After 24 h of settling, the elemental content in the samples was determined using an ICP 7400-type plasma emission spectrometer produced by Thermo Fisher Scientific, Waltham, MA, USA. The calibration solution series medium is a 10% hydrochloric acid solution. A multi-point calibration curve is constructed using multiple calibration solutions, and the calibration curve is automatically generated by computer software. To ensure the quality of sample data, measurements of standard substances GSR-1, GSS 40, GSS 41, and GSD17a were taken during the experimental process and compared to their standard values, with errors of less than 5%. All samples were measured twice for repeatability. The Limit of Detection (LOD) values were as follows: 0.05% for Al and Mg, 0.1% for Fe and Na, and 20 μg/g for S. It is worth noting that the standard substance/repeat sample qualification rate was 100%.
According to the standard method, “Exploration Geochemical Sample Analysis Method X-Ray Fluorescence Spectrometry for Determining Thirty-four Major and Trace Elements” (WSBB/005-2004) [44], X-ray fluorescence spectrometry was employed to quantify Si, Ca, K, Mn, P, and Ti in the samples. A dried sample mass of 4.00 g was transferred to a sample container, evenly spread within it, and pressed using a pellet press to create a homogenous sample pellet. The prepared samples were directly analyzed for each element using a ZETIUM X-ray fluorescence spectrometer produced by Malvern Panalytical, Malvern, WR14 1XZ, UK. The matrix effects between elements were corrected using the empirical coefficient method and the internal standard method for scatter correction. The LOD were as follows: 0.1% for Si, 0.05% for Ca and K, and 10 μg/g for Mn, P, and Ti. The qualification rate for standard substances/repeat samples was 100%.
3.2.3. Soil Trace Elements
According to the standard method “Exploration Geochemical Sample Analysis Method for Determining Thirty-two Trace Elements by Inductively Coupled Plasma Mass Spectrometry” (WSBB/001-2021) [45], an inductively coupled plasma mass spectrometer was utilized to quantify Ag, Bi, Cd, Co, Cu, Mo, Ni, Pb, Sb, and W in the samples. The experimental procedure was consistent with that for major soil elements. Specifically, the iCAP Qc type inductively coupled plasma mass spectrometer produced by Thermo Fisher Scientific, Waltham, MA, USA, was used to determine the elemental content in the samples. The LOD were as follows: 20 ng/g for Ag, 0.05 μg/g for Bi and Sb, 1 μg/g for Co and Cu, 30 ng/g for Cd, 0.3 μg/g for Mo, 0.4 μg/g for W, and 2 μg/g for Ni and Pb. The qualification rate for standard substances/repeat samples was 100%.
3.2.4. Soil Halogen Elements
In addition to the above analysis, the elements Br and Cl were quantified in the samples using Axios PW4400/40 X-ray fluorescence spectrometry produced by PANalytical B.V., Almelo, The Netherlands, according to the standard WSBB/005-2004, with a 1 μg/g and 20 μg/g LOD, respectively. The ion-selective electrode method determined Fluoride (F), according to the standard GB/T 14506.12-2010 [46], with 100 μg/g LOD. Iodine (I) was measured using the standard WSBB/013-2020 [47] spectrophotometric method, with a 0.5 μg/g LOD. The qualification rate for standard substances/repeat samples of halogen elements was also 100%.
3.2.5. Soil Heat-Released Mercury
According to the standard “Mercury Vapor Measurement Specification” (DZ 0003-91) [48], the XG-7Z mercury measuring instrument produced by the Institute of Geophysical and Geochemical Exploration, Chinese Academy of Geological Sciences, Langfang, Hebei Province, China, was used in this experiment. The weight method was employed to determine heat-released mercury in soils at a heat-released temperature of 200 °C (test conditions as shown in Table 1).

Table 1.
Testing conditions of soil heat-released mercury instrument.
Approximately 0.1 g of the sample was placed into a quartz boat and introduced into the central part of a thermal decomposition furnace. Upon activating the air pump, the heat-release of mercury commenced automatically. The sample was exposed to the mercury vapor produced at this temperature, and its absorption was measured within the instrument’s absorption chamber, resulting in an absorbance value (AT). The sequence of temperature for determining heat-released mercury ranged from high temperature (800 °C) to low temperature (150 °C). After the determination of heat-released mercury at one temperature, an appropriate amount of the sample was reweighed for the subsequent temperature determination, and this process continued to cover all designated temperature levels for heat-released mercury measurements.
3.2.6. Chemical Form Analysis of Gold in Soil
The determination of chemical forms of gold in soil samples refers to the analytical specifications of “Ecological Geochemistry Assessment Sample Analysis Technical Requirements (Trial)” (DD2005-03) [49]. The Tessier (1979) modified sequential extraction method [50] (seven-step procedure) is employed for the chemical forms of gold in the soil. This technique divides elements into seven forms: extraction with water for the water-soluble form; 1.0 mol/L magnesium chloride extraction for the ion-exchangeable form; 1.0 mol/L sodium acetate solution for the carbonate-bound form; 0.1 mol/L sodium pyrophosphate extraction for the weakly organic (humic acid) bound form; 0.25 mol/L hydroxylamine hydrochloride—0.25 mol/L hydrochloric acid mixed solution extraction for the iron-manganese bound form; 30% hydrogen peroxide extraction for the strongly organic bound form; and hydrofluoric acid extraction for the residual form. After quantitatively collecting samples and performing extractions with the solvents above, the gold content in each form is analyzed using the ICP-MS produced by Thermo Fisher Scientific, Waltham, MA, USA, for a full spectrum direct reading analysis.
4. Geochemical Characteristics of Overburden Soils
4.1. Overburden Soil Mineral Composition
Utilizing X-ray Diffraction (XRD) analysis, a semi-quantitative assessment of the mineral composition of representative soil samples from the Mahuagou mining area was conducted, as illustrated in Figure 3. The X-ray diffraction peak intensities are measured using integrated intensities after background subtraction. Relevant data is obtained from the X-ray diffraction spectrum of the sample and then compared to standard X-ray diffraction data for minerals to determine the mineral species. Common mineral X-ray diffraction data can be found in SY/T 5163-2018-Appendix E. Formula (1) is used to calculate the total content of clay minerals and various non-clay minerals:
Xi represents the percentage content of mineral i, expressed as a percentage; Ii represents the integrated peak intensity of the selected diffraction peak of mineral i; and Ki represents the reference intensity of mineral i.
Broadly, soil samples from the FXS and MHG profiles exhibit two distinct mineral assemblages. In the FXS profile, the mineral composition of the soil is primarily comprised of clay minerals, such as illite, chlorite, and kaolinite, as well as primary minerals like quartz and sodium feldspar (e.g., FXS-5 and FXS-6). Illite is an intermediate transitional mineral between montmorillonite and mica, often formed through the alteration of potassium feldspar and mica or the replacement of montmorillonite [51,52,53]. Kaolinite predominantly forms during the weathering of silicate minerals like feldspar and common pyroxenes [54]. Chlorite is a secondary mineral that develops during the initial stages of soil formation, arising from the alteration of ferromagnesian minerals (e.g., biotite, hornblende, pyroxenes) in granite or other igneous rocks. Field observations indicate that the rock types exposed in the FXS profile consist mainly of moyite, monzonitic granite, granitic, and dioritic rocks, indicative of intermediate acidic intrusive rocks. Consequently, the formation of illite and kaolinite in the soil is connected to the weathering of minerals like mica and alkali feldspar in intermediate acidic parent rocks. At the same time, the development of chlorite often results from the weathering of dark-colored minerals in the parent rock.
FXS-3 and FXS-4 exhibit a characteristic mineral composition of fault gouge. The presence of montmorillonite and a small amount of calcite in the soil leads to a notably higher Ca element content compared to other soils. The formation of this mineral assemblage is attributed to the grinding of near-surface rocks by faults under low-temperature conditions, coupled with late-stage low-temperature hydrothermal alteration and metamorphism [55,56], resulting in the mixture of unconsolidated, powdery clay minerals (illite, chlorite, and montmorillonite) with fine particles from adjacent rocks (quartz and calcite) [57].
In the MHG profile, the clay mineral composition in the soil is relatively simple, primarily consisting of montmorillonite, with minimal presence of minerals like illite and chlorite. The content of biotite and minor plagioclase is significantly higher in the soil compared to the FXS profile. Diabase dikes (βμ) and other mafic dikes are widely exposed in MHG, which is the main factor affecting the local soil composition. Consequently, the formation of montmorillonite in the soil of MHG profile is closely related to the weathering of minerals from basic rocks in an alkaline environment [58].
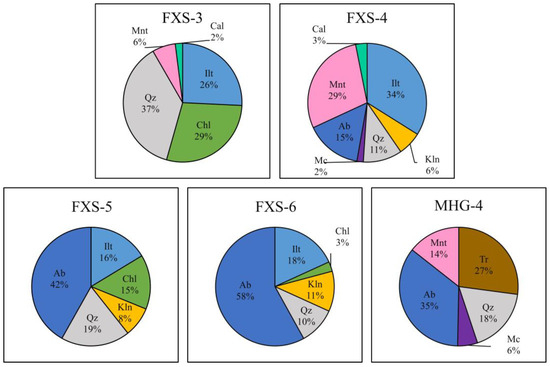
Figure 3.
Mineral composition of representative soil samples from the Mahuagou mining area (Ab: albite; Cal: calcite; Chl: chlorite; Ilt: illite; Kln: kaolinite; Mc: microcline; Mnt: montmorillonite; Qz: quartz; Tr: tremolite [59]).
The soil mineral composition adjacent to the KZY trench resembles that of the FXS profile, with illite being the primary clay mineral and a relatively lower content of quartz and sodium feldspar.
Considering the mineral composition of soils in the Mahuagou mining area, it can be inferred that the soils at FXS, MHG, and KZY locations are all products of the in situ weathering of parent rock. This process facilitates the capture and preservation of in situ ore-forming information. However, due to variations in weathering and erosion conditions among different areas, the content of various soil components and their ability to preserve materials may still differ.
4.2. Overburden Soil Major Elements
The results of soil major elements testing in the Mahuagou mining area, along with descriptive statistics, are presented in Table 2 and Table 3. Among the 18 samples, silicon (Si) exhibited a maximum value of 69.8%, a minimum value of 57.7%, and a mean value of 64.8%. Aluminum (Al) showed a maximum value of 19.2%, a minimum value of 12.9%, and a mean value of 15.7%. Both elements demonstrated a coefficient of variation (CV) below 15%, indicating relatively stable content within the samples. On the other hand, calcium (Ca) and magnesium (Mg) elements displayed variation coefficients exceeding 50%, implying significant content disparities within individual samples. Notably, samples FXS-3 and FXS-4 exhibited notably distinct calcium content from other samples, possibly attributed to mineralogical associations with abundant calcium and magnesium elements in the soil.
Table 2.
Test results of soil main elements in the Mahuagou mining area.
Table 3.
Descriptive statistical table of main elements in the Mahuagou mining area.
CIA (Chemical Index of Alteration) [60] and CIW (Chemical Index of Weathering) are two commonly used weathering indices. The CIA is based on the research of weathering of magmatic rocks with relatively uniform chemical composition, and its application premise is that the chemical composition of weathered parent rocks is relatively uniform [61,62]. Obviously, in this study, the parent rocks of the soil samples are not the same, and K2O may be active during metamorphism; biotite alteration can be affected by K2O concentrations, which can be rich in illite and smectite clay minerals. Therefore, it is appropriate to use the CIW to evaluate its weathering. The calculation Formula (2) for CIW is provided below:
CIW = 100% × Al2O3/(Al2O3 + CaO + Na2O)
The calculated results are depicted in Figure 4. In general, CIW values between 50% and 60% indicate that the samples are fresh and have not undergone significant chemical weathering. If the CIW value of a sample exceeds 70%, it signifies intense chemical weathering [63]. The samples from the Mahuagou mining area consistently exhibit CIW values above 70%, indicating a pronounced history of substantial weathering processes.
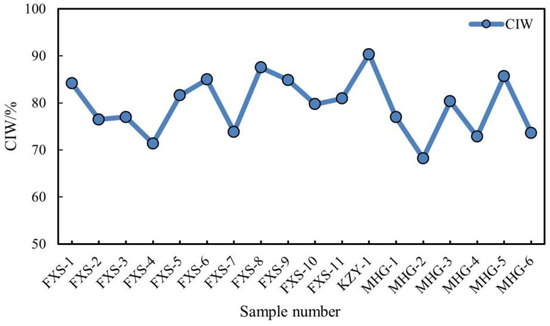
Figure 4.
CIW index of soil samples in the Mahuagou mining area.
To better illustrate the compositional characteristics of major elements, the samples were categorized based on their sampling point characteristics into five sections: fault material, above the faulted structures, around the MHG ore-body, above the trench and borehole, and peripheral areas. Utilizing the (Al/Si) × 100% ratio in conjunction with Ca (%) for plotting (refer to Figure 5), it was observed that the majority of samples exhibit a relatively stable ratio of Al to Si, forming a linear distribution parallel to the X-axis. However, some individual samples display elevated Al/Si ratios. Fault materials (fault mud and fault cataclastic rock) exhibit higher Ca content.
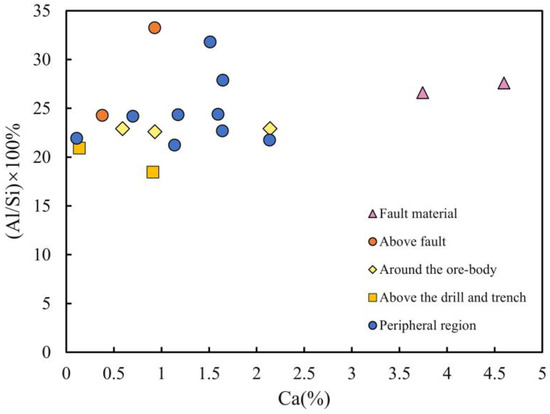
Figure 5.
Al/Si–Ca relationship diagram of representative samples from different regions in the Mahuagou mining area.
The variation in major element content among soil samples reflects the heterogeneity of their compositional materials. Based on the characteristics of their composition, inferences can be drawn regarding the provenance nature of the sampled region. The relatively consistent Si and Al variations in this experiment indicate a uniform degree of weathering, unaffected by transported materials, suggesting in situ weathering from the parent rock [64]. However, significant differences in Ca and Mg composition among samples suggest mineralogical influences. These differences may be caused by minerals such as chlorite, montmorillonite, and kaolinite.
4.3. Geochemical Characteristics of Trace Elements
Geochemical prospecting has proven to be an effective approach in gold exploration work so far, and the study of epithermal gold deposits has garnered significant attention from numerous scholars [65,66]. In the field of geochemical gold exploration, the analysis of coupled elemental relationships and the determination of their significance are of particular importance [67]. Studies such as the native halo of gold deposits, trace element patterns [68], and statistical relationships between various elements [69] play a crucial role in addressing gold exploration challenges. To elucidate the distribution patterns of geochemical elements within the overlying strata of the Mahuagou mining area and establish relationships among element combinations, this study conducted content analysis on soil samples containing 17 metallic and non-metallic elements closely associated with gold mineralization, including Ag, As, Be, Bi, Cd, Co, Cr, Cu, Hg, Mo, Ni, Pb, Sb, Sn, W, Zn, and Au. A statistical analysis was subsequently performed on the collected data.
A systematic clustering analysis was conducted on the 17 metallic elements in the soil samples. It is a data analysis technique that divides objects or data points in a dataset into different groups or categories, and it finds widespread applications in many domains. Prior to analysis, the Z-score method was applied to standardize the original data, unifying data of different magnitudes onto a common scale. Calculated Z-Score values replaced the original values for analysis, ensuring data comparability. Ward’s Method is used for processing sample data, and it is a systematic clustering method for dividing data points into different clusters or groups. The advantage of this method is to select, at each step, two existing clusters to merge in order to minimize the increase in their combined variance. Consequently, this method is capable of producing compact and relatively evenly-sized clusters. Employing squared Euclidean distance as the distance metric, the results of the analysis are presented in Figure 6.
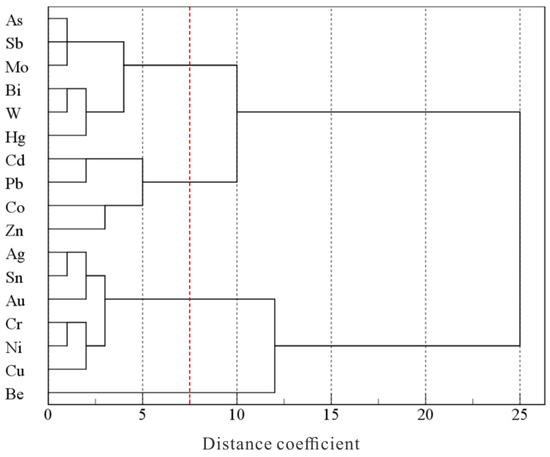
Figure 6.
Phylogenetic diagram of soil elements by systematic clustering analysis.
At a similarity level of 7.5 distance coefficient, all elements can be classified into four categories: The first category includes As, Sb, Mo, Bi, W, and Hg. Among them, the cooccurrence of Mo, W, and Bi elements is often associated with alkali granite related to W–Sn mineralization, consistent with the nature of soil parent rocks [70]. The combination of Hg, As, and Sb elements is closely linked to shallow, low-temperature hydrothermal mineralization, often manifesting as elements in the halo zone of hydrothermal gold deposits, serving as significant indicators for mercury, antimony, and gold deposits. This combination not only inherits the specific characteristics of the parent rock but also retains effective indicators of deep-seated mineralization. The second category encompasses Cd, Pb, Co, and Zn, which commonly occur in polymetallic sulfide hydrothermal mineralization and are also prominent lower-level elements in gold deposits [71]. The third category comprises Ag, Sn, Au, Cr, Ni, and Cu, forming a typical assemblage in medium-temperature ore-forming zones. Be elements constitute a separate category, typically acting as late-stage anomaly indicators in gold deposits.
Even more, the cluster analysis displays the relationship between elements and rock types. The first category (As, Sb, Mo, Bi, W, and Hg) is closely associated with granite; it may indicate the crucial metallogenic significance of the biotite monzonitic granite (γPt3Zx) in the mining area. The second category (Cd, Pb, Co, Zn, Ag, Sn, Au, Cr, Ni, and Cu) is associated with mafic rocks and ultramafic rocks, and Au has displayed an affinity for such elements; this may indicate that the mafic-ultra mafic veins have a significant influence on gold mineralization. Further analysis is conducted on the variations of the complete dataset of the first three categories of element combinations along profiles. In Figure 7, it can be observed that the anomalous elements at the front edge of the gold deposit, composed of elements such as As, Sb, and Hg (Category 1), exhibit consistent anomalies in profiles FXS and MHG.
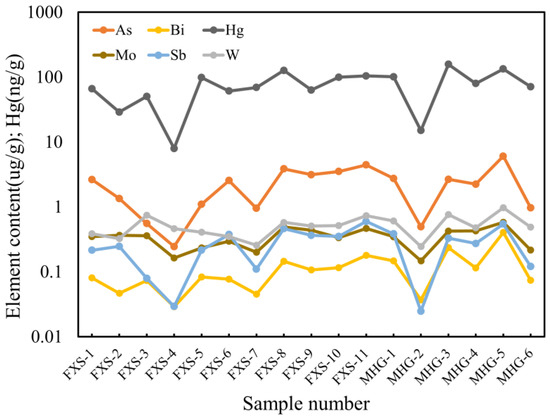
Figure 7.
The content change characteristics of the first type of element combination (As, Sb, Mo, Bi, W, and Hg).
On the FXS profile (first 11 points), points FXS-5 and FXS-8 demonstrate positive anomalies in element content. These sampling locations exhibit well-developed soil profiles and are positioned directly above fault structures. At point FXS-8, multiple phases of intrusive veins are evident, with the pronounced intrusion of potassium feldspar granite veins controlled by faulting. Magmatic activity during the upward intrusion and subsequent crystallization has led to the enrichment of valuable components through filling and replacement processes facilitated by favorable structural and lithological conditions at FXS-8. The hydrothermal fluids generated during these processes, influenced by factors like pressure gradients and temperature, have enabled the vertical migration of valuable components. These components have been preserved within the soil during their upward migration, resulting in the observed positive anomalies.
On the MHG profile (last 6 points), the elements exhibit a distinct bimodal distribution. Points MHG-3 and MHG-5 show positive anomalies, and these correspond to the mineralized segment of the MHG profile. From the results, this distribution pattern suggests a certain indicative effect of the first category of element combinations on the mineral body. However, further validation is required through subsequent unconventional exploration methods.
The content variations of the second and third categories of elements at each point along the profile are significant. Moreover, there are substantial differences in the trends of variation among elements within the same type without evident anomalous features (Figure 8). Elements like Au and Hg in soil samples beside the KZY exploration trench display much higher concentrations compared to other samples. This phenomenon may be attributed to the disturbance caused by trench excavation. This disturbance leads to the fragmentation of mineralized outcrops, allowing mineral particles to mix with the soil and subsequently be preserved. Hence, this sample is not considered for discussing the geochemical characteristics of the overlying cover in the mining area.
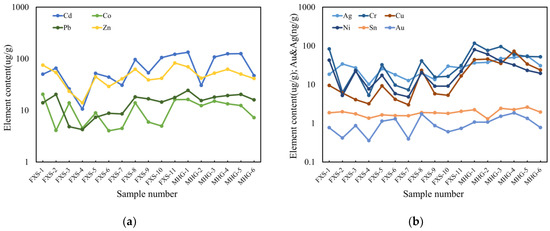
Figure 8.
The content change characteristics of the second combination elements and the third combination elements: (a) variation characteristics of Cd, Co, Pb, and Zn content; (b) variation characteristics of Ag, Cr, Cu, Ni, Sn, and Au content.
5. Deep-Penetrating Geochemical Result
5.1. Abnormal Characteristics of Soil Heat-Released Mercury
The soil heat-released mercury survey method involves heating the soil to release mercury that is adsorbed within the soil and is related to mineral bodies. Subsequently, the released mercury content is measured. This approach, combined with geological and mineralogical characteristics, allows for the further analysis of concealed mineral bodies or underlying structures. In this exploration study, soil heat-released mercury surveys were conducted in two locations near the Fengxiangshugou (FXS) induced IP profile and the Mahuanggou (MHG) mining area along Line 7 in the core area of the Huangling Anticline gold deposit. The results were compared with the gold content in the soil (Figure 9).
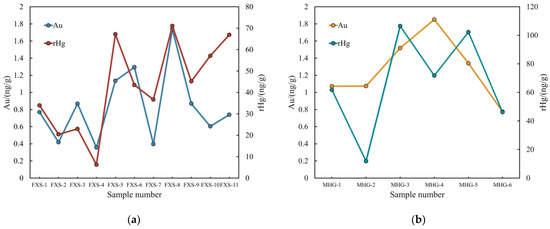
Figure 9.
Line chart of soil heat-released mercury anomaly: (a) soil heat-released mercury anomaly of Fengxiangshugou; (b) soil heat-released mercury anomaly of Mahuanggou.
The soil heat-released mercury anomalies along the FXS profile closely correspond to the gold content anomalies, exhibiting a bimodal distribution at points FXS-5 and FXS-8 (Figure 9a). FXS-5 is positioned directly above the fractured zone of the fault, while FXS-8 is located beneath rock masses with distinct characteristics of multiple phases of intrusive veins, notably controlled by faulting. The soil heat-released mercury results along the FXS profile demonstrate a good indication of the faulted zone and multi-phase intrusions. Furthermore, in comparison to gold content anomalies, soil heat-released mercury surveys exhibit higher anomaly contrast, thus offering a superior indication effect over gold anomalies.
In contrast, the soil heat-released mercury anomalies along the MHG profile exhibit differing characteristics from the overall gold anomalies (Figure 9b). The soil heat-released mercury anomalies align with the first category of element combinations (As, Sb, Hg, Mo, Bi, and W) identified through cluster analysis (Figure 7). These anomalies consistently appear along the MHG profile, presenting a bimodal distribution at points 3–5. On the other hand, the gold anomaly peaks at point 4 along the MHG profile, with diminishing intensities on both sides. The known mineralized segment on the MHG profile is represented by points 3–5, and both methods show anomalous indications along this profile.
5.2. Chemical Mobile Forms of Gold in Soil
In this exploratory study, the gold fractionation of 18 soil samples from three locations—Fengxiangshugou (FXS), Mahuanggou (MHG), and Kaziya (KZY)—was conducted using the seven-step sequential extraction method. The ratios of gold content in different fractions to the total mobile gold content are illustrated in Figure 10.
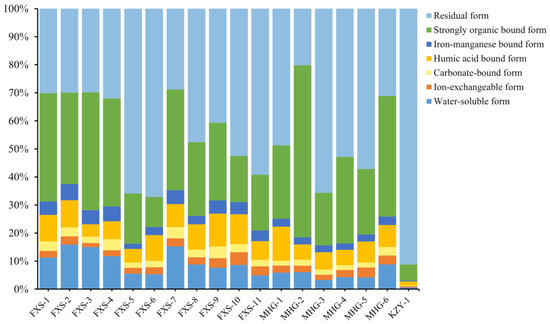
Figure 10.
Chemical Mobile Forms distribution of gold in soil samples.
Residual and strongly organically bound forms of gold are predominant in the soil, while water-soluble, exchangeable, and carbonate-bound forms are in smaller proportions. With the exception of samples from KZY, the primary chemical form of gold in the remaining soil samples is the strongly organically bound form. This form involves the central heavy metal ion surrounded by organic functional groups as ligands, or it combines with sulfur ions to generate water-insoluble compounds [72]. Materials in the strongly organically bound form can undergo degradation of their contained organic molecules under oxidative conditions, leading to the leaching of some metal ions and resulting in anomalies in the soil or environmental impacts [73].
A comparison between the strongly organically bound form of gold and the anomalous gold content is presented in Figure 11 for this experiment. Along the FXS profile, distinct anomalies are observed in samples within the FXS-3 faulted zone and above the potassium feldspar granite intrusion at FXS-8 (Figure 11a). However, unlike the heat-released mercury anomalies, the strongly organically bound form of gold does not exhibit anomalies directly above the fault. Both methods exhibit particularly pronounced indications for the potassium feldspar granite intrusion, with anomaly contrast surpassing gold content.
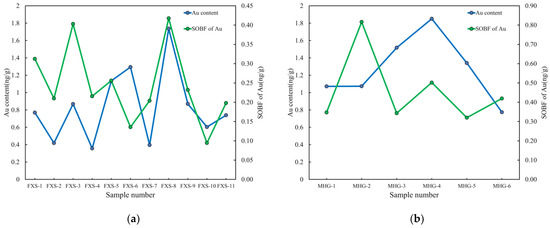
Figure 11.
Line chart of the strong organic bound form (SOBF) of Au and Au content in soil: (a) anomaly of SOBF of Au in Fengxiangshugou; (b) anomaly of SOBF of Au in Mahuanggou.
The anomalies of the strongly organically bound gold along the MHG profile do not align with the heat-released mercury anomalies or the total gold anomalies, indicating a shift in peak positions (Figure 11b). It is hypothesized that the formation of this anomaly might be influenced by the vein morphology and the topography of the cover layer, both of which could lead to the displacement of mineralization-induced anomalies.
The KZY samples consist of loose soil adjacent to the exploration trench, with the primary chemical form of gold being the residual form. Residual forms of metals generally exist within primary minerals, secondary minerals, silicates, and other lattice structures. These forms are stable in nature, not easily released in surface environments, remain stable in soils, are poorly absorbed by plants, and exhibit limited migration capabilities.
5.3. Abnormal Characteristics of Soil Halogen
Halogen elements consist of four elements: F, Cl, Br, and I. These elements possess high electronegativity, strong electron-accepting capabilities, exhibit pronounced non-metallic properties, and readily form halides and halogen complexes with most metals. This property is advantageous for the migration of metallic elements in ore-forming fluids, making halogens crucial components in polymetallic mineralization processes.
The anomalous display of the four elements (F, Cl, Br, and I) along the FXS profile is relatively weak (Figure 12). Among them, F and Cl exhibit distinct enrichment and peak values in fault-related material, followed by a gradual decrease. Br and I show an overall increasing trend in content, with a single negative anomaly peak at point FXS-7. These two anomaly patterns lack correlation with geological facts and exhibit unclear indication effects.
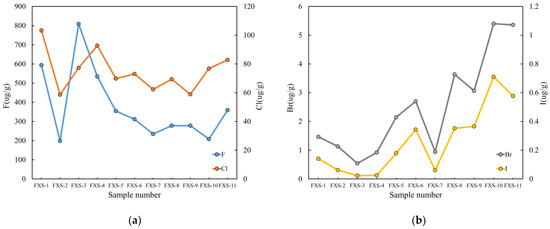
Figure 12.
Halogen anomaly in the soil of FXS: (a) F and Cl anomaly in the soil of FXS; (b) Br and I anomaly in the soil of FXS.
Similarly, the F, Cl, Br, and I elements along the MHG profile display two different anomaly patterns (Figure 13). The anomalies of F and Cl resemble the overall gold anomalies, peaking at point MHG-4 with diminishing intensity on both sides. The anomalies of Br and I align with the heat-released mercury anomalies and the anomaly characteristics of the first category of element combinations identified through cluster analysis, displaying a bimodal distribution at points 3–5 along the MHG profile. Both types of anomaly patterns for the halogen elements on the MHG profile provide specific indicative effects for the underlying mineral bodies.
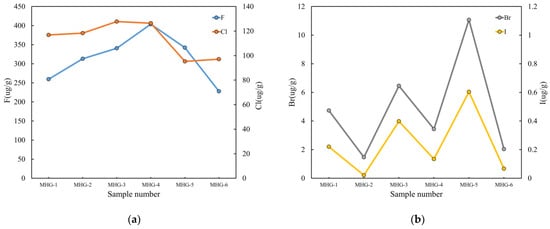
Figure 13.
Halogen anomaly in the soil of MHG: (a) F and Cl anomaly in the soil of MHG; (b) Br and I anomaly in the soil of MHG.
5.4. Discussion of Anomaly
Soil heat-released mercury anomalies exhibit prominent indications of concealed mineral bodies and underlying structures. Mercury possesses a significant affinity for sulfur and commonly exists in the forms of native mercury and mercury compounds within sulfides during hydrothermal stages. In surface environments, mercury-bearing metal sulfides can undergo a series of redox reactions to generate mercury oxides or chlorides. Through groundwater flow and migration in structural fractures, these mercury compounds can be adsorbed onto clay minerals, organic matter, and iron-manganese oxides in the overlying soil, thus forming soil mercury anomalies.
The lush vegetation and extensive tree-covered terrain in the Mahuagou mining area result in organic-rich and moist soils. Gold released from concealed mineral bodies and their primary halos can interact with soil organic matter through complexation, forming complexes with varying solubilities [74,75]. Therefore, the dominant chemical form of gold is the strongly organically bound form. This form of gold exhibits a similar anomaly indication effect as soil heat-released mercury surveys. It is more likely to form metal-active anomalies in locations conducive to element migration, such as near structures or above mineral bodies [75].
Soil halogen element anomalies in this area exhibit limited indication effects. On the FXS profile, the anomaly characteristics display unclear indications, whereas on the MHG profile, they provide some indication of underlying mineral bodies. This discrepancy can be attributed to the local parent rock properties. The FXS profile predominantly exposes medium -acidic intrusive rocks, while widespread basic dike intrusions characterize the MHG profile. The variation in parent rock types leads to differences in soil properties, affecting the preservation of halogen anomalies [76].
6. Conclusions
This paper comprehensively tests and analyzes major elements, mineral components, and various metallic and non-metallic elements in 18 soil samples from the Mahuagou gold deposit region. Through a comprehensive analysis of geochemical data and statistical methods, several significant indicators have been identified.
- The element combination of As, Sb, Hg, Bi, W, and Mo holds significant indicative implications for hydrothermal gold deposits in the area. Moreover, it demonstrates a favorable coupling relationship with the unconventional exploration work conducted in this study. In future work, attention should be given to this element combination, as it may play a crucial role in gold prospecting within the Huangling syncline region;
- The measurement of chemical forms of gold reveals that the predominant chemical-migration form of gold in the overburden of the Mahuagou mining area is strongly organically bound. This form can indicate the faulted zone and multi-phase intrusions and exhibit higher anomaly contrast. This conclusion provides a vital theoretical foundation for the exploration of concealed ore deposits in the study area;
- Penetration geochemical methods, such as soil heat-released mercury measurement and gold form measurement, demonstrate good applicability in the Mahuagou mining area. The experimental results indicate that in areas with relatively thin cover layers, like Mahuagou, penetration geochemical methods remain effective tools for gold prospecting. This finding offers technical support for mineral exploration efforts in the region. By prioritizing and utilizing the key indicators identified in this paper, exploration teams can enhance their efficiency and accuracy in targeting potential gold mineralization zones.
Author Contributions
Conceptualization, Q.X. and S.X.; methodology, Z.C. and Q.X.; software, W.Z.; validation, M.W.; formal analysis, S.X.; investigation, W.Z., D.L. and S.X.; resources, L.L. and Y.G.; data curation, W.Z. and M.W.; writing—original draft preparation, W.Z.; writing—review and editing, W.Z., S.X., S.F.A. and O.Y.; visualization, W.Z.; supervision, D.L. and S.X.; project administration, L.L. and Y.G.; funding acquisition, L.L. and Y.G. All authors have read and agreed to the published version of the manuscript.
Funding
This research was funded by the National Natural Science Foundation of China (41872250).
Data Availability Statement
The data presented in this study are available on request from the corresponding author. The data are not publicly available due to the confidentiality of the project.
Acknowledgments
During fieldwork, sample processing, and testing and analysis procedures, we received assistance from professors and fellow students from the Faculty of Earth Sciences and the Faculty of Earth Resources at China University of Geosciences, Wuhan, as well as guidance and support from experts of The Seventh Geological Brigade, Hubei Geological Bureau, Yichang. We express our gratitude to all for their contributions.
Conflicts of Interest
The authors declare no conflict of interest.
References
- Zhai, M.; Hu, R.; Wang, Y.; Jiang, S.; Wang, R.; Li, J.; Chen, H.; Yang, Z.; Lü, Q.; Qi, T.; et al. Mineral Resource Science in China: Review and perspective. Geogr. Sustain. 2021, 2, 107–114. [Google Scholar] [CrossRef]
- Hu, R.; Liu, J.; Zhai, M. Mineral Resources Science in China: A Roadmap to 2050; Science Press: Beijing, China, 2010; pp. 1–94. [Google Scholar]
- Han, Z.; Liao, J.; Zhang, Y.; Zhang, B.; Wang, X. Review of deep-penetrating geochemical exploration methods. Adv. Earth Sci. 2017, 32, 828–838. [Google Scholar]
- Wang, Y.; Yang, C.; Liang, J.; Liu, W.; Song, J. Method for Determining Lower Limit of Soil Geochemical Anomaly and Its Advantages and Disadvantages. Environ. Resour. Ecol. J. 2023, 7, 52–60. [Google Scholar]
- Han, Z.; Lu, H.; Zhang, B.; Cheng, Z.; Fu, W.; Lao, C.; Xu, C. Delineating preliminary prospective areas of ion-adsorption rare earth deposits with stream sediments geochemical mapping in South China. J. Asian Earth Sci. 2023, 243, 105520. [Google Scholar] [CrossRef]
- Dushyantha, N.; Ratnayake, N.; Premasiri, R.; Batapola, N.; Panagoda, H.; Jayawardena, C.; Chandrajith, R.; Ilankoon, I.; Rohitha, S.; Ratnayake, A.; et al. Geochemical exploration for prospecting new rare earth elements (REEs) sources: REE potential in lake sediments around Eppawala Phosphate Deposit, Sri Lanka. J. Asian Earth Sci. 2023, 243, 105515. [Google Scholar] [CrossRef]
- Ayari, J.; Barbieri, M.; Boschetti, T.; Barhoumi, A.; Sellami, A.; Braham, A.; Manai, F.; Dhaha, F.; Charef, A. Major- and Trace-Element Geochemistry of Geothermal Water from the Nappe Zone, Northern Tunisia: Implications for Mineral Prospecting and Health Risk Assessment. Environments 2023, 10, 151. [Google Scholar] [CrossRef]
- Sarala, P. Surficial Geochemical Exploration Method. In Mineral Deposits of Finland; Elsevier: Amsterdam, The Netherlands, 2015; pp. 711–731. [Google Scholar]
- Clark, R.J.; Meier, A.L.; Riddle, G. Enzyme leaching of surficial geochemical samples for detecting hydromorphic trace-element anomalies associated with precious-metal mineralized bedrock buried beneath glacial overburden in northern Minnesota. In Proceedings of the Gold’90 Symposium-Gold’90, Littleton, CO, USA, 26 February–1 March 1990. [Google Scholar]
- Wen, X. Deep-Penetrating Geochemistry: Theoretical Consideration, Methodology and Application in Desert Terrain. Ph.D. Thesis, Chang’an University, Xi’an, China, 2008. [Google Scholar]
- Mann, A.W.; Birrell, R.D.; Mann, A.T.; Humphreys, D.B.; Perdrix, J.L. Application of the mobile metal ion technique to routine geochemical exploration. J. Geochem. Explor. 1998, 61, 87–102. [Google Scholar] [CrossRef]
- Mann, A.; Reimann, C.; De Caritat, P.; Turner, N.; Birke, M. Mobile Metal Ion® analysis of European agricultural soils: Bioavailability, weathering, geogenic patterns and anthropogenic anomalies. Geochem. Explor. Environ. Anal. 2015, 15, 99–112. [Google Scholar] [CrossRef]
- Sadeghi, M.; Albanese, S.; Morris, G.; Ladenberger, A.; Andersson, M.; Cannatelli, C.; Lima, A.; De Vivo, B. REE concentrations in agricultural soil in Sweden and Italy: Comparison of weak MMI® extraction with near total extraction data. Appl. Geochem. 2015, 63, 22–36. [Google Scholar] [CrossRef]
- Wang, X.; Cheng, Z.; Lu, Y.; Xu, L.; Xie, X. Nanoscale metals in Earthgas and mobile forms of metals in overburden in wide-spaced regional exploration for giant deposits in overburden terrains. J. Geochem. Explor. 1997, 58, 63–72. [Google Scholar] [CrossRef]
- Wang, X. Leaching of mobile forms of metals in overburden: Development and application. J. Geochem. Explor. 1998, 61, 39–55. [Google Scholar]
- Liu, X.; Cao, J.; Li, Y.; Hu, G.; Wang, G. A study of metal-bearing nanoparticles from the Kangjiawan Pb-Zn deposit and their prospecting significance. Ore Geol. Rev. 2019, 105, 375–386. [Google Scholar] [CrossRef]
- Sun, B.; Zhang, X.; Liu, Z.; Zhou, G.; Zhang, B.; Chen, Y. A preliminary study of the formation mechanism of the geoelectric chemistry anomaly. Geophys. Geochem. Explor. 2015, 39, 1183–1187. [Google Scholar]
- Liu, P.; Luo, X.; Wen, M.; Zhang, J.; Gao, W.; Ouyang, F.; Duan, X. Using electrogeochemical approach to explore buried gold deposits in an alpine meadow-covered area. Acta Geochim. 2018, 37, 402–413. [Google Scholar] [CrossRef]
- Crowther, T.W.; van den Hoogen, J.; Wan, J.; Mayes, M.A.; Keiser, A.D.; Mo, L.; Averill, C.; Maynard, D.S. The global soil community and its influence on biogeochemistry. Science 2019, 365, eaav0550. [Google Scholar] [CrossRef]
- Zhang, Y.; Chen, Y.; Li, D.; Zhao, J.; Zhang, N.; Kang, H. Application of optically stimulated luminescence in volcanic hydrothermal uranium deposits in the Guyuan Basin, North China. J. Geochem. Explor. 2022, 241, 107054. [Google Scholar] [CrossRef]
- Lu, Y.; Zhang, B.; Wang, X.; Liu, H.; Yan, T.; Wang, Q.; Liu, Q.; Liu, D.; Xu, Y. Application of the fine-grained soil prospecting method in a loess-covered area of central China. Appl. Geochem. 2022, 143, 105377. [Google Scholar] [CrossRef]
- Noble, R.R.P.; Morris, P.A.; Anand, R.R.; Lau, I.C.; Pinchand, G.T. Application of ultrafine fraction soil extraction and analysis for mineral exploration. Geochem. Explor. Environ. Anal. 2020, 20, 129–154. [Google Scholar] [CrossRef]
- Noble, R.R.P.; Lau, I.C.; Anand, R.R.; Pinchand, G.T. Refining fine fraction soil extraction methods and analysis for mineral exploration. Geochem. Explor. Environ. Anal. 2020, 20, 113–128. [Google Scholar] [CrossRef]
- Anand, R.R.; Aspandiar, M.F.; Noble, R.R.P. A review of metal transfer mechanisms through transported cover with emphasis on the vadose zone within the Australian regolith. Ore Geol. Rev. 2016, 73, 394–416. [Google Scholar] [CrossRef]
- Wu, Y.-F.; Evans, K.; Li, J.-W.; Fougerouse, D.; Large, R.R.; Guagliardo, P. Metal remobilization and ore-fluid perturbation during episodic replacement of auriferous pyrite from an epizonal orogenic gold deposit. Geochim. Cosmochim. Acta 2019, 245, 98–117. [Google Scholar] [CrossRef]
- Jamtveit, B.; Yardley, B. Fluid Flow and Transport in Rocks: Mechanisms and Effects; Springer Science & Business Media: Berlin/Heidelberg, Germany, 1997; p. 319. [Google Scholar]
- Kolb, J.; Rogers, A.; Meyer, F.M.; Vennemann, T.W. Development of fluid conduits in the auriferous shear zones of the Hutti Gold Mine, India: Evidence for spatially and temporally heterogeneous fluid flow. Tectonophysics 2004, 378, 65–84. [Google Scholar] [CrossRef]
- Wang, X.; Zhang, B.; Ye, R. Nanoparticles Observed by TEM from Gold, Copper-Nickel and Silver Deposits and Implications for Mineral Exploration in Covered Terrains. J. Nanosci. Nanotechnol. 2017, 17, 6014–6025. [Google Scholar] [CrossRef]
- Wang, X.; Zhang, B.; Lin, X.; Xu, S.; Yao, W.; Ye, R. Geochemical challenges of diverse regolith-covered terrains for mineral exploration in China. Ore Geol. Rev. 2016, 73, 417–431. [Google Scholar]
- Deng, M. Structural Modeling of the Huangling Anticline and Its Peripheral Structural Belt. Ph.D. Thesis, China University of Geosciences, Beijing, China, 2018. [Google Scholar]
- Xiang, M.; Hu, S.; Nie, K.; Lu, J.; Yang, P.; Zhou, Z. Geochemical Characteristics and Genesis of Gold Deposits in the Core of Huangling Anticline, Western Hubei. Resour. Environ. Eng. 2021, 35, 787–793+874. [Google Scholar]
- Liu, S.; Yang, C.; Li, F.; Liao, Z.; Zhang, Q.; Cheng, C. Cause and Ore-bearing Characteristics of Gold Deposit in Xiangxi-Western Hubei Metallogenic Belt of Huangling Anticline. Resour. Environ. Eng. 2015, 29, 150–154. [Google Scholar]
- Ma, D.; Li, Z.; Xiao, Z. The Constitute, Geochronology and Geologic Evolution of the Kongling Complex, Western Hubei. Acta Geosci. Sin. 1997, 18, 233–241. [Google Scholar]
- Xiong, C.; Wei, C.; Jin, G.; Li, W.; Xiang, W. Basic characteristics and metallogenetic regularity of the gold ore deposits in the middle core of Huangling anticline, western Hubei province. Geol. Miner. Resour. South China 1998, 1, 32–40. [Google Scholar]
- Cui, X.; Zhu, W.; Wang, X. Neoproterozoic modification of heterogeneous continental lithosphere beneath the Yangtze interior: Revealed from mafic dykes from the Huangling area, South China. Int. J. Earth Sci. 2022, 111, 27–51. [Google Scholar] [CrossRef]
- Xiong, C.; Wei, C.; Jin, G.; Tan, W.; Li, W. Pre-Sinian Paleostructural Framework and Major Geological Events in the Huangling Anticline, Western Hubei. J. Geomech. 2004, 10, 97–112. [Google Scholar]
- Wang, H.; Xia, Q.; Zhou, Z.; Lei, L.; Chen, C.; Yang, P.; Gong, Y.; Hua, Q.; Bao, Q. Orogenic gold mineralization in the Huangliang region and its intimate tectonic linkage to the Neoproterozoic orogeny of South China. Precambrian Res. 2023, 394, 107105. [Google Scholar] [CrossRef]
- Guo, Y. Petrological and Geochemical Characteristics and Its Geodynamic Significance of Huangling Granite Batholith in Western Hubei Province. Master’s Thesis, Chengdu University of Technology, Chengdu, China, 2019. [Google Scholar]
- Wei, C.; Xiong, C.; Jin, G.; Li, W.; Xiang, W. Temporal-spatial pattern of the Mahuagou gold ore deposit, western Hubei, and the search for likely locations. J. Geomech. 2000, 6, 81–90. [Google Scholar]
- Xiang, M.; Jiang, D.; Wan, X.; Wu, Q. Ore Prospecting Model and Prediction of Structural Superimposed Halo in Mahuagou Gold Deposit of Yichang City, Hubei Province. Resour. Environ. Eng. 2017, 31, 688–695. [Google Scholar]
- Zhang, Q.; Xiang, M.; Wan, X.; Qu, Y. Discussion on Geological Characteristics and Prospecting Direction of Mahuagou Gold Deposit in Yiling District, Yichang City. Resour. Environ. Eng. 2015, 29, 383–386. [Google Scholar]
- SY/T 5163-2018; Analysis Method for Clay Minerals and Ordinary Non-Clay Minerals in Sedimentary Rocks by the X-ray Diffraction. National Energy Administration: Beijing, China, 2018.
- WSBB/004-2019; Determination of Twenty-Two Elements in Geological Samples by Inductively Coupled Plasma Optical Emission Spectrometry. Institute of Geophysical and Geochemical Exploration, Chinese Academy of Geological Sciences: Langfang, China, 2019.
- WSBB/005-2004; Exploration Geochemical Sample Analysis Method X-ray Fluorescence Spectrometry for Determining Thirty-four Major and Trace Elements. Institute of Geophysical and Geochemical Exploration, Chinese Academy of Geological Sciences: Langfang, China, 2004.
- WSBB/001-2021; Exploration Geochemical Sample Analysis Method for Determining Thirty-Two Trace Elements by Inductively Coupled Plasma Mass Spectrometry. Institute of Geophysical and Geochemical Exploration, Chinese Academy of Geological Sciences: Langfang, China, 2021.
- GB/T 14506.12-2010; Methods for Chemical Analysis of Silicate Rocks-Part 12: Determination of Fluorine Content. Standards Press: Beijing, China, 2010.
- WSBB/013-2020; Methods for Analysis of Exploration Geochemical Samples Catalytic Kinetic Spectrophotometry for Determination of Iodine Content. Institute of Geophysical and Geochemical Exploration, Chinese Academy of Geological Sciences: Langfang, China, 2020.
- DZ 0003-91; Code of Practice for Mercury Vapor Survey. Ministry of Natural Resources of the People’s Republic of China: Beijing, China, 1991.
- DD2005-03; Ecological Geochemistry Assessment Sample Analysis Technical Requirements (Trial). China Geological Survey: Beijing, China, 2005.
- Tessier, A.; Campbell, P.G.C.; Bisson, M. Sequential extraction procedure for the speciation of particulate trace metals. Anal. Chem. 1979, 51, 844–851. [Google Scholar] [CrossRef]
- Altaner, S.P.; Ylagan, R.F. Comparison of structural models of mixed-layer illite/smectite and reaction mechanisms of smectite illitization. Clays Clay Miner. 1997, 45, 517–533. [Google Scholar] [CrossRef]
- Mancktelow, N.; Zwingmann, H.; Mulch, A. Timing and conditions of clay fault gouge formation on the Naxos detachment (Cyclades, Greece). Tectonics 2016, 35, 2334–2344. [Google Scholar] [CrossRef]
- Zwingmann, H.; Mancktelow, N.; Antognini, M.; Lucchini, R. Dating of shallow faults: New constraints from the AlpTransit tunnel site (Switzerland). Geology 2010, 38, 487–490. [Google Scholar] [CrossRef]
- Yuan, J.; Yang, J.; Ma, H.; Su, S.; Chang, Q.; Kormarneni, S. Hydrothermal Synthesis of nano-kaolinite from K-feldspar. Ceram. Int. 2018, 44, 15611–15617. [Google Scholar] [CrossRef]
- Xu, X.; Deng, F.; Wang, D.; Luo, X. Advances in composition and dating methods of fault gouge and weakening mechanisms of earthquake faults in bedrock area. Bull. Geol. Sci. Technol. 2022, 41, 122–131. [Google Scholar]
- Argante, V.; Tanner, D.C.; Brandes, C.; von Hagke, C.; Tsukamoto, S. The Memory of a Fault Gouge: An Example from the Simplon Fault Zone (Central Alps). Geosciences 2022, 12, 268. [Google Scholar] [CrossRef]
- Kanitpanyacharoen, W.; Chornkrathok, S.; Morley, C.K.; Wenk, H.R. Microstructural evolution and deformation mechanisms of Khao Kho Fault, Thailand. J. Struct. Geol. 2020, 136, 104055. [Google Scholar] [CrossRef]
- Uddin, F. Montmorillonite: An Introduction to Properties and Utilization; IntechOpen: London, UK, 2018; pp. 1–202. [Google Scholar]
- Warr, L.N. Recommended abbreviations for the names of clay minerals and associated phases. Clay Miner. 2020, 55, 261–264. [Google Scholar] [CrossRef]
- Nesbitt, H.W.; Young, G.M. Early Proterozoic climates and plate motions inferred from major element chemistry of lutites. Nature 1982, 299, 715–717. [Google Scholar] [CrossRef]
- Babechuk, M.G.; Fedo, C.M. Analysis of chemical weathering trends across three compositional dimensions: Applications to modern and ancient mafic-rock weathering profiles. Can. J. Earth Sci. 2023, 60, 839–864. [Google Scholar] [CrossRef]
- Sergeev, N. Quantifying weathering intensity using chemical proxies: A weathering index AFB. Aust. J. Earth Sci. 2023, 70, 260–284. [Google Scholar] [CrossRef]
- Harnois, L. The CIW index: A new chemical index of weathering. Sediment. Geol. 1988, 55, 319–322. [Google Scholar] [CrossRef]
- Yu, S.; Xiang, W.; Li, Q.; Xie, S.; Xu, Q. Identification and interpretation of nonore-causative geochemical anomalies in arid grasslands: An example of the D2 area in the Hongennihuduge steppe, Inner Mongolia. Geol. Explor. 2014, 50, 1118–1125. [Google Scholar]
- Cooke, D.R.; Simmons, S.F. Characteristics and genesis of epithermal gold deposits. Rev. Econ. Geol. 2000, 221–244. [Google Scholar]
- Zhu, Y.; An, F.; Tan, J. Geochemistry of hydrothermal gold deposits: A review. Geosci. Front. 2011, 2, 367–374. [Google Scholar] [CrossRef]
- Goldfarb, R.J.; Hofstra, A.H.; Simmons, S.F. Critical elements in Carlin, epithermal, and orogenic gold deposits. In Rare Earth and Critical Elements in Ore Deposits; Society of Economic Geologists, Incorporated: Littleton, CO, USA, 2016. [Google Scholar]
- Silberman, M.L.; Berger, B.R. Relationship of trace element patterns to alteration and morphology in epithermal precious-metal deposits. Rev. Econ. Geol. 1985, 2, 203–232. [Google Scholar]
- Kadel-Harder, I.M.; Spry, P.G.; McCombs, A.L.; Zhang, H. Identifying pathfinder elements for gold in bulk-rock geochemical data from the Cripple Creek Au-Te deposit: A statistical approach. Geochem. Explor. Environ. Anal. 2021, 21, 2020–2048. [Google Scholar] [CrossRef]
- Li, B.; Wang, X.; Tang, G.; Liu, Y.; Zou, G. S-Pb isotopes and tectono-geochemistry of the Lunong ore block, Yangla large Cu deposit, SW China: Implications for mineral exploration. Ore Geol. Rev. 2021, 136, 104249. [Google Scholar] [CrossRef]
- Liu, C. Progress in Studies on Primary Halos of Ore Deposit. Acta Geol. Sin. 2006, 80, 1528–1538. [Google Scholar]
- Pence, N.S.; Larsen, P.B.; Ebbs, S.D.; Lettham, D.L.D.; Lasat, M.M.; Garvin, D.F.; Eide, D.; Kochian, L.V. The molecular physiolosy of heave metal transport in the Zn/Cd hyperaccumulator. Proc. Natl. Acad Sci. USA 2000, 97, 4956–4960. [Google Scholar] [CrossRef]
- An, Z. Reliability Assessment and Geochemical Significance of Heavy Metal Sequential Extraction in Soils and Sediments. Master’s Thesis, Chinese Academy of Geological Sciences, Beijing, China, 2009. [Google Scholar]
- Yang, F.; Xie, S.; Carranza, E.J.M.; Yao, L.; Tian, H.; Chen, Z. Vertical distribution of major ore-forming elements and the speciation in the semiarid system above the concealed Baiyinnuoer Pb-Zn deposit in inner Mongolia, China. Geochem. Explor. Environ. Anal. 2019, 19, 46–57. [Google Scholar] [CrossRef]
- Sanyal, S.K.; Shuster, J.; Reith, F. Cycling of biogenic elements drives biogeochemical gold cycling. Earth Sci. Rev. 2019, 190, 131–147. [Google Scholar] [CrossRef]
- Epp, T.; Marks, M.A.W.; Neidhardt, H.; Oelmann, Y.; Markl, G. Halogen (F, Cl, Br, I) contents in silt and clay fractions of a Cambisol from a temperate forest. Am. Miner. 2022, 107, 946–954. [Google Scholar] [CrossRef]
Disclaimer/Publisher’s Note: The statements, opinions and data contained in all publications are solely those of the individual author(s) and contributor(s) and not of MDPI and/or the editor(s). MDPI and/or the editor(s) disclaim responsibility for any injury to people or property resulting from any ideas, methods, instructions or products referred to in the content. |
© 2023 by the authors. Licensee MDPI, Basel, Switzerland. This article is an open access article distributed under the terms and conditions of the Creative Commons Attribution (CC BY) license (https://creativecommons.org/licenses/by/4.0/).