Article

Scripts to Insert Cohesive Elements at the Interfaces between Matrix and Precipitates with Irregular Shapes in Representative Volume Elements in ABAQUS

by
Mohammadmehdi Shahzamanian
1,2,*,
Zhutian Xu
3 and
Peidong Wu
1,*
1
Department of Mechanical Engineering, McMaster University, Hamilton, ON L8S 4L7, Canada
2
Department of Civil, Construction, and Environmental Engineering, North Carolina State University, Raleigh, NC 27695, USA
3
School of Mechanical Engineering, Shanghai Jiao Tong University, Shanghai 200240, China
*
Authors to whom correspondence should be addressed.
Appl. Sci. 2023, 13(22), 12281; https://doi.org/10.3390/app132212281
Submission received: 19 October 2023 / Revised: 4 November 2023 / Accepted: 6 November 2023 / Published: 13 November 2023
(This article belongs to the Special Issue Advanced Finite Element Method and Its Applications)

Abstract

:
A MATLAB algorithm was developed to insert cohesive elements at the interfaces between the matrix and precipitates in two dimensional (2D) representative volume elements (RVEs) of metals. The RVEs were created using OOF2 and imported into the “Complete ABAQUS Environment” (CAE) interface. These RVEs are based on actual images of the metal at the microscale, where the precipitates have irregular shapes. The RVEs contain precipitates that are dispersed into matrix materials. Commercial finite element (FE) ABAQUS software does not provide the option to automatically generate cohesive elements at the interfaces. The presented algorithm enables the insertion of cohesive elements at the interfaces between the matrix and precipitate in a convenient manner. This algorithm enables the simulation of the fracture process, including initiation at the interfaces and propagation at microscale, for metals that contain precipitates and/or particles. This algorithm extends the simulation capabilities of the FE solver ABAQUS.

1. Introduction

This paper provides a MATLAB script for inserting cohesive elements at the interfaces between the matrix and the precipitates in a 2D RVE for metals. The RVEs contain particles that are spread throughout the surrounding materials. Available finite element (FE) software does not have a feature that allows one to automatically create cohesive elements at the interfaces. The algorithm presented herein allows for the easy insertion of cohesive elements at the interfaces between the surrounding material and particles. The metadata for the codes, which include the link to access them, are provided in Table 1 and Table 2. This article provides some background information about the simulation of RVE to study ductile fracture analysis. The aim and significance of implementing the code for ductile fracture analysis are also described. Additionally, a section that explains the use of OOF2 software to generate a 2D RVE using a real image of metal microstructure is included. Then, the subsequent section is dedicated to explaining the implementation of the MATLAB script. The following section displays the response of a unit cell and a 2D RVE when decohesion occurred at the interfaces. A brief discussion about the insertion of cohesive elements is provided, and at the end of the paper, a summary of the work is presented. A code implementation similar to this has been documented in the literature for various other software. However, as far as the authors know, a code specifically designed to insert cohesive elements at the interface between the matrix and precipitates with irregular shapes in a 2D RVE created in ABAQUS has not been reported or made available online for the public. Overall, this type of modeling can be used for any material, regardless of the loading conditions, which causes separation at the interfaces between the matrix and precipitates. The proposed model can be applied to any problem where decohesion occurs.

2. Background: Steps of RVE Simulation for Fracture Analysis at the Microscale

There are various models available for accurately predicting a wide range of fracture types [3,4,5]. In the present study, our focus is on simulating an RVE for metals in which decohesion begins at the interfaces between the matrix material and second-phase particles.

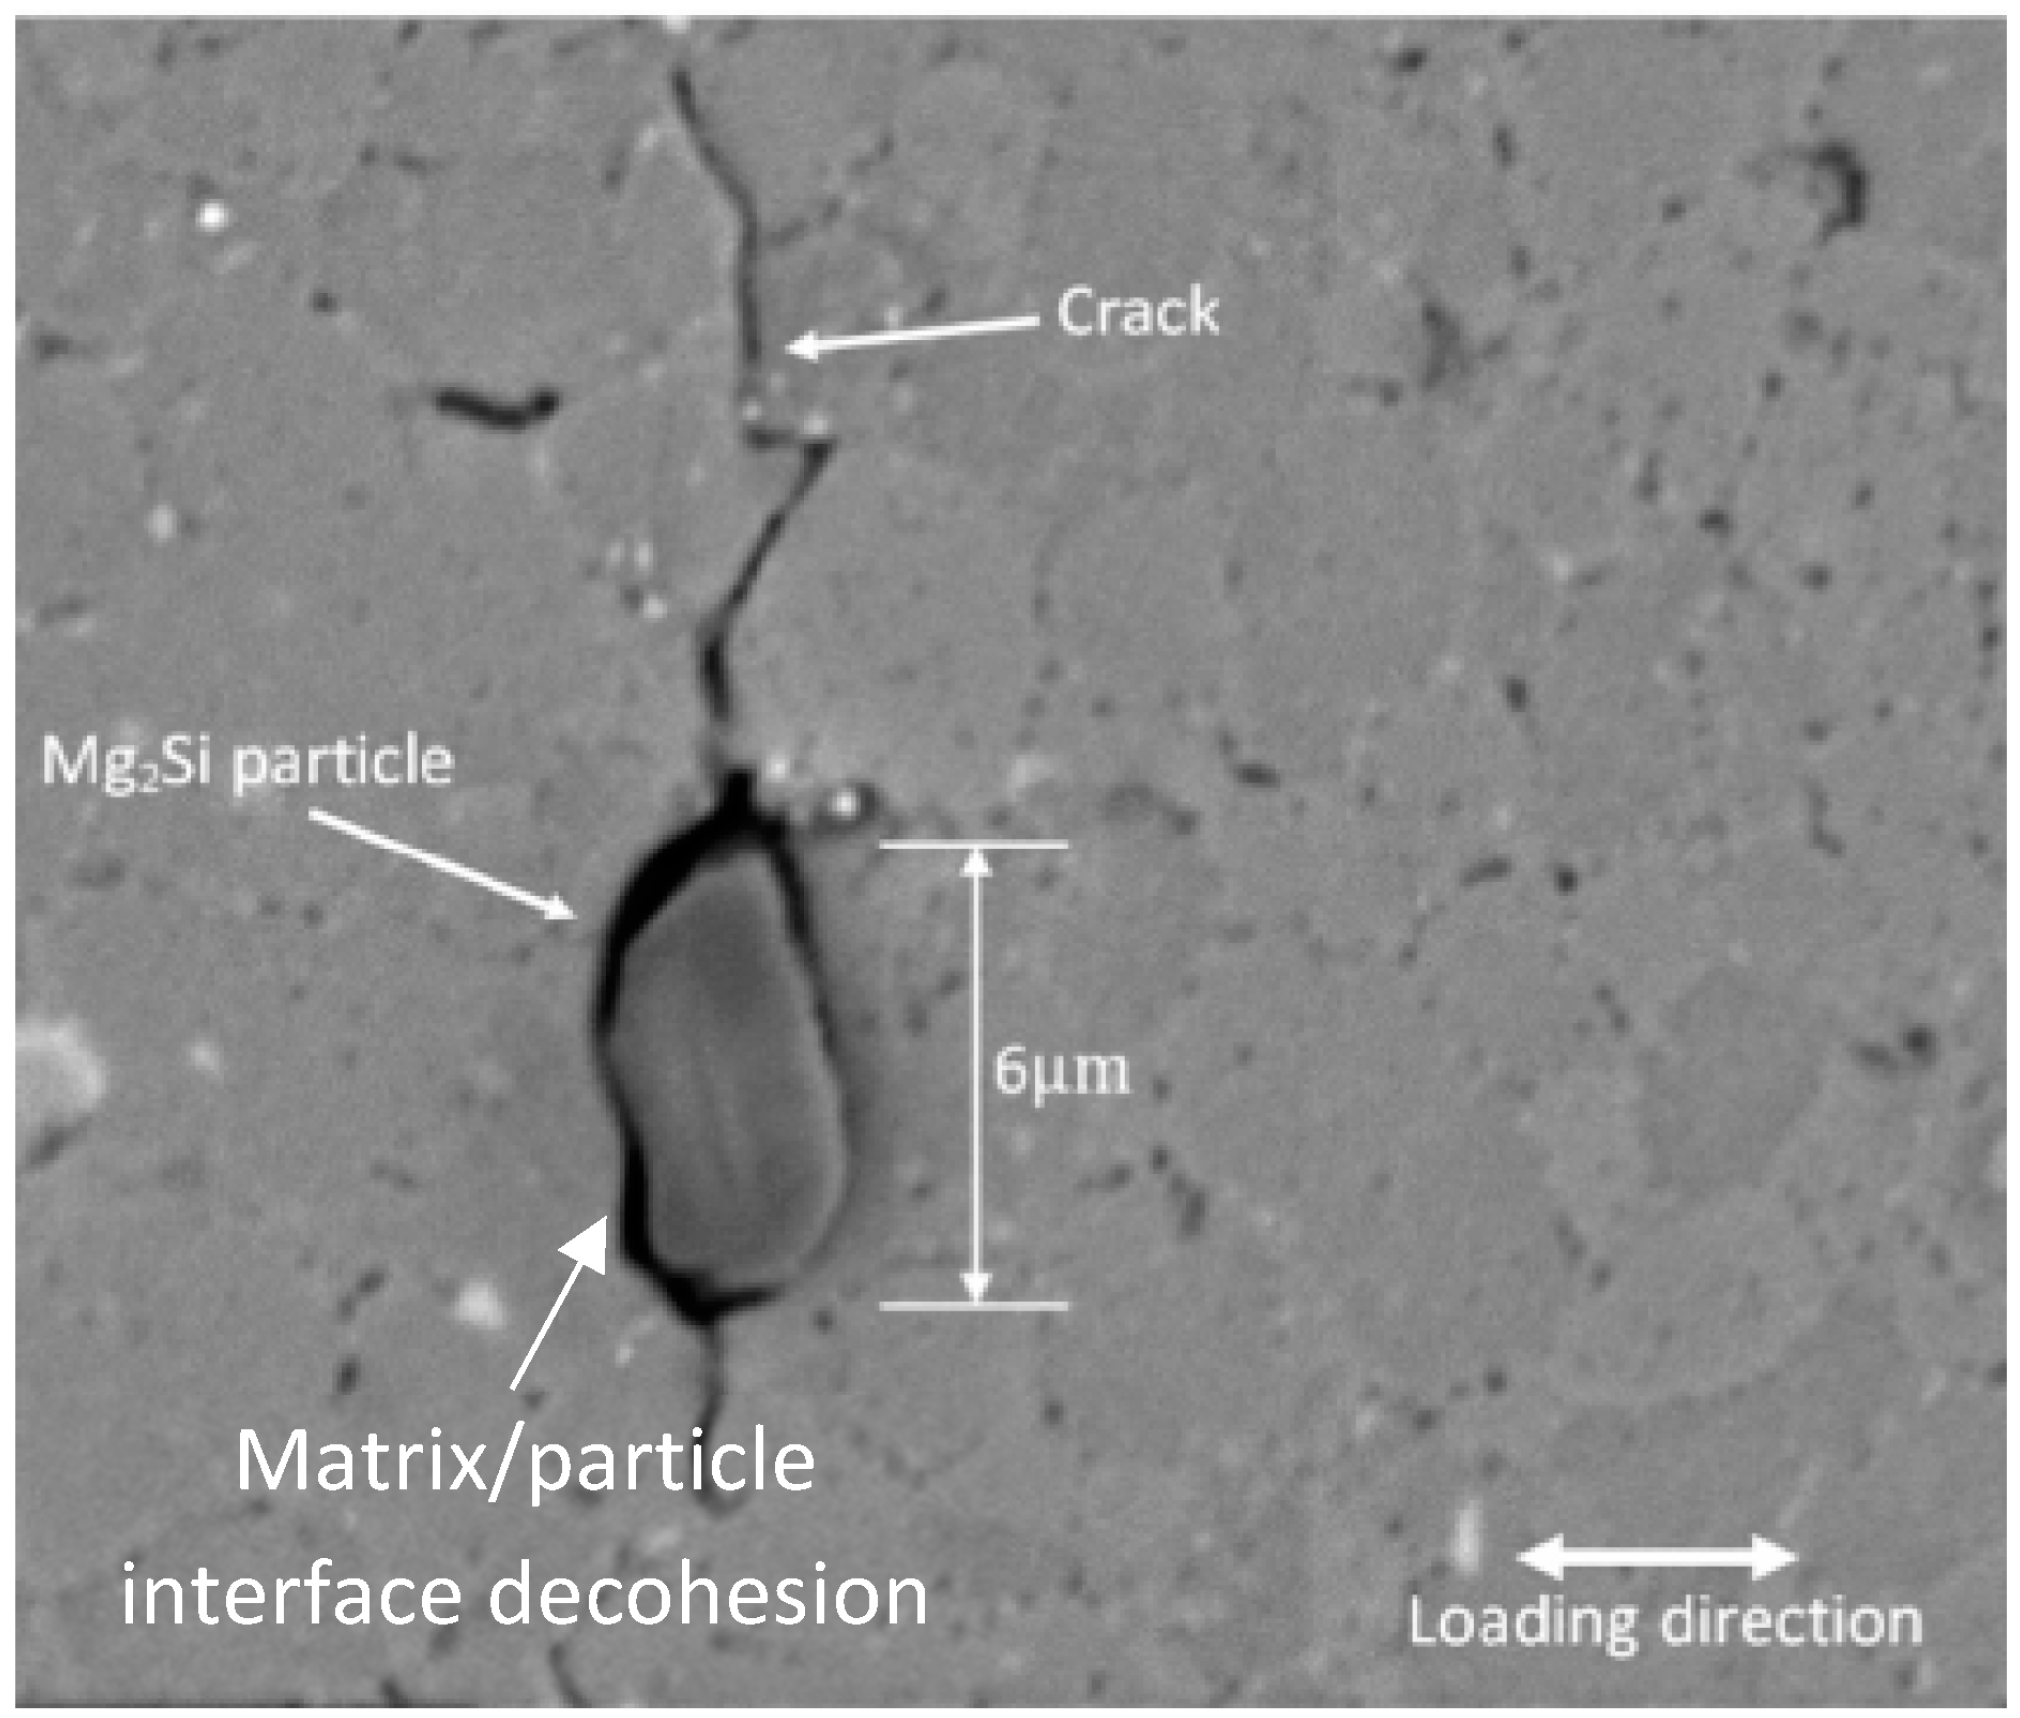
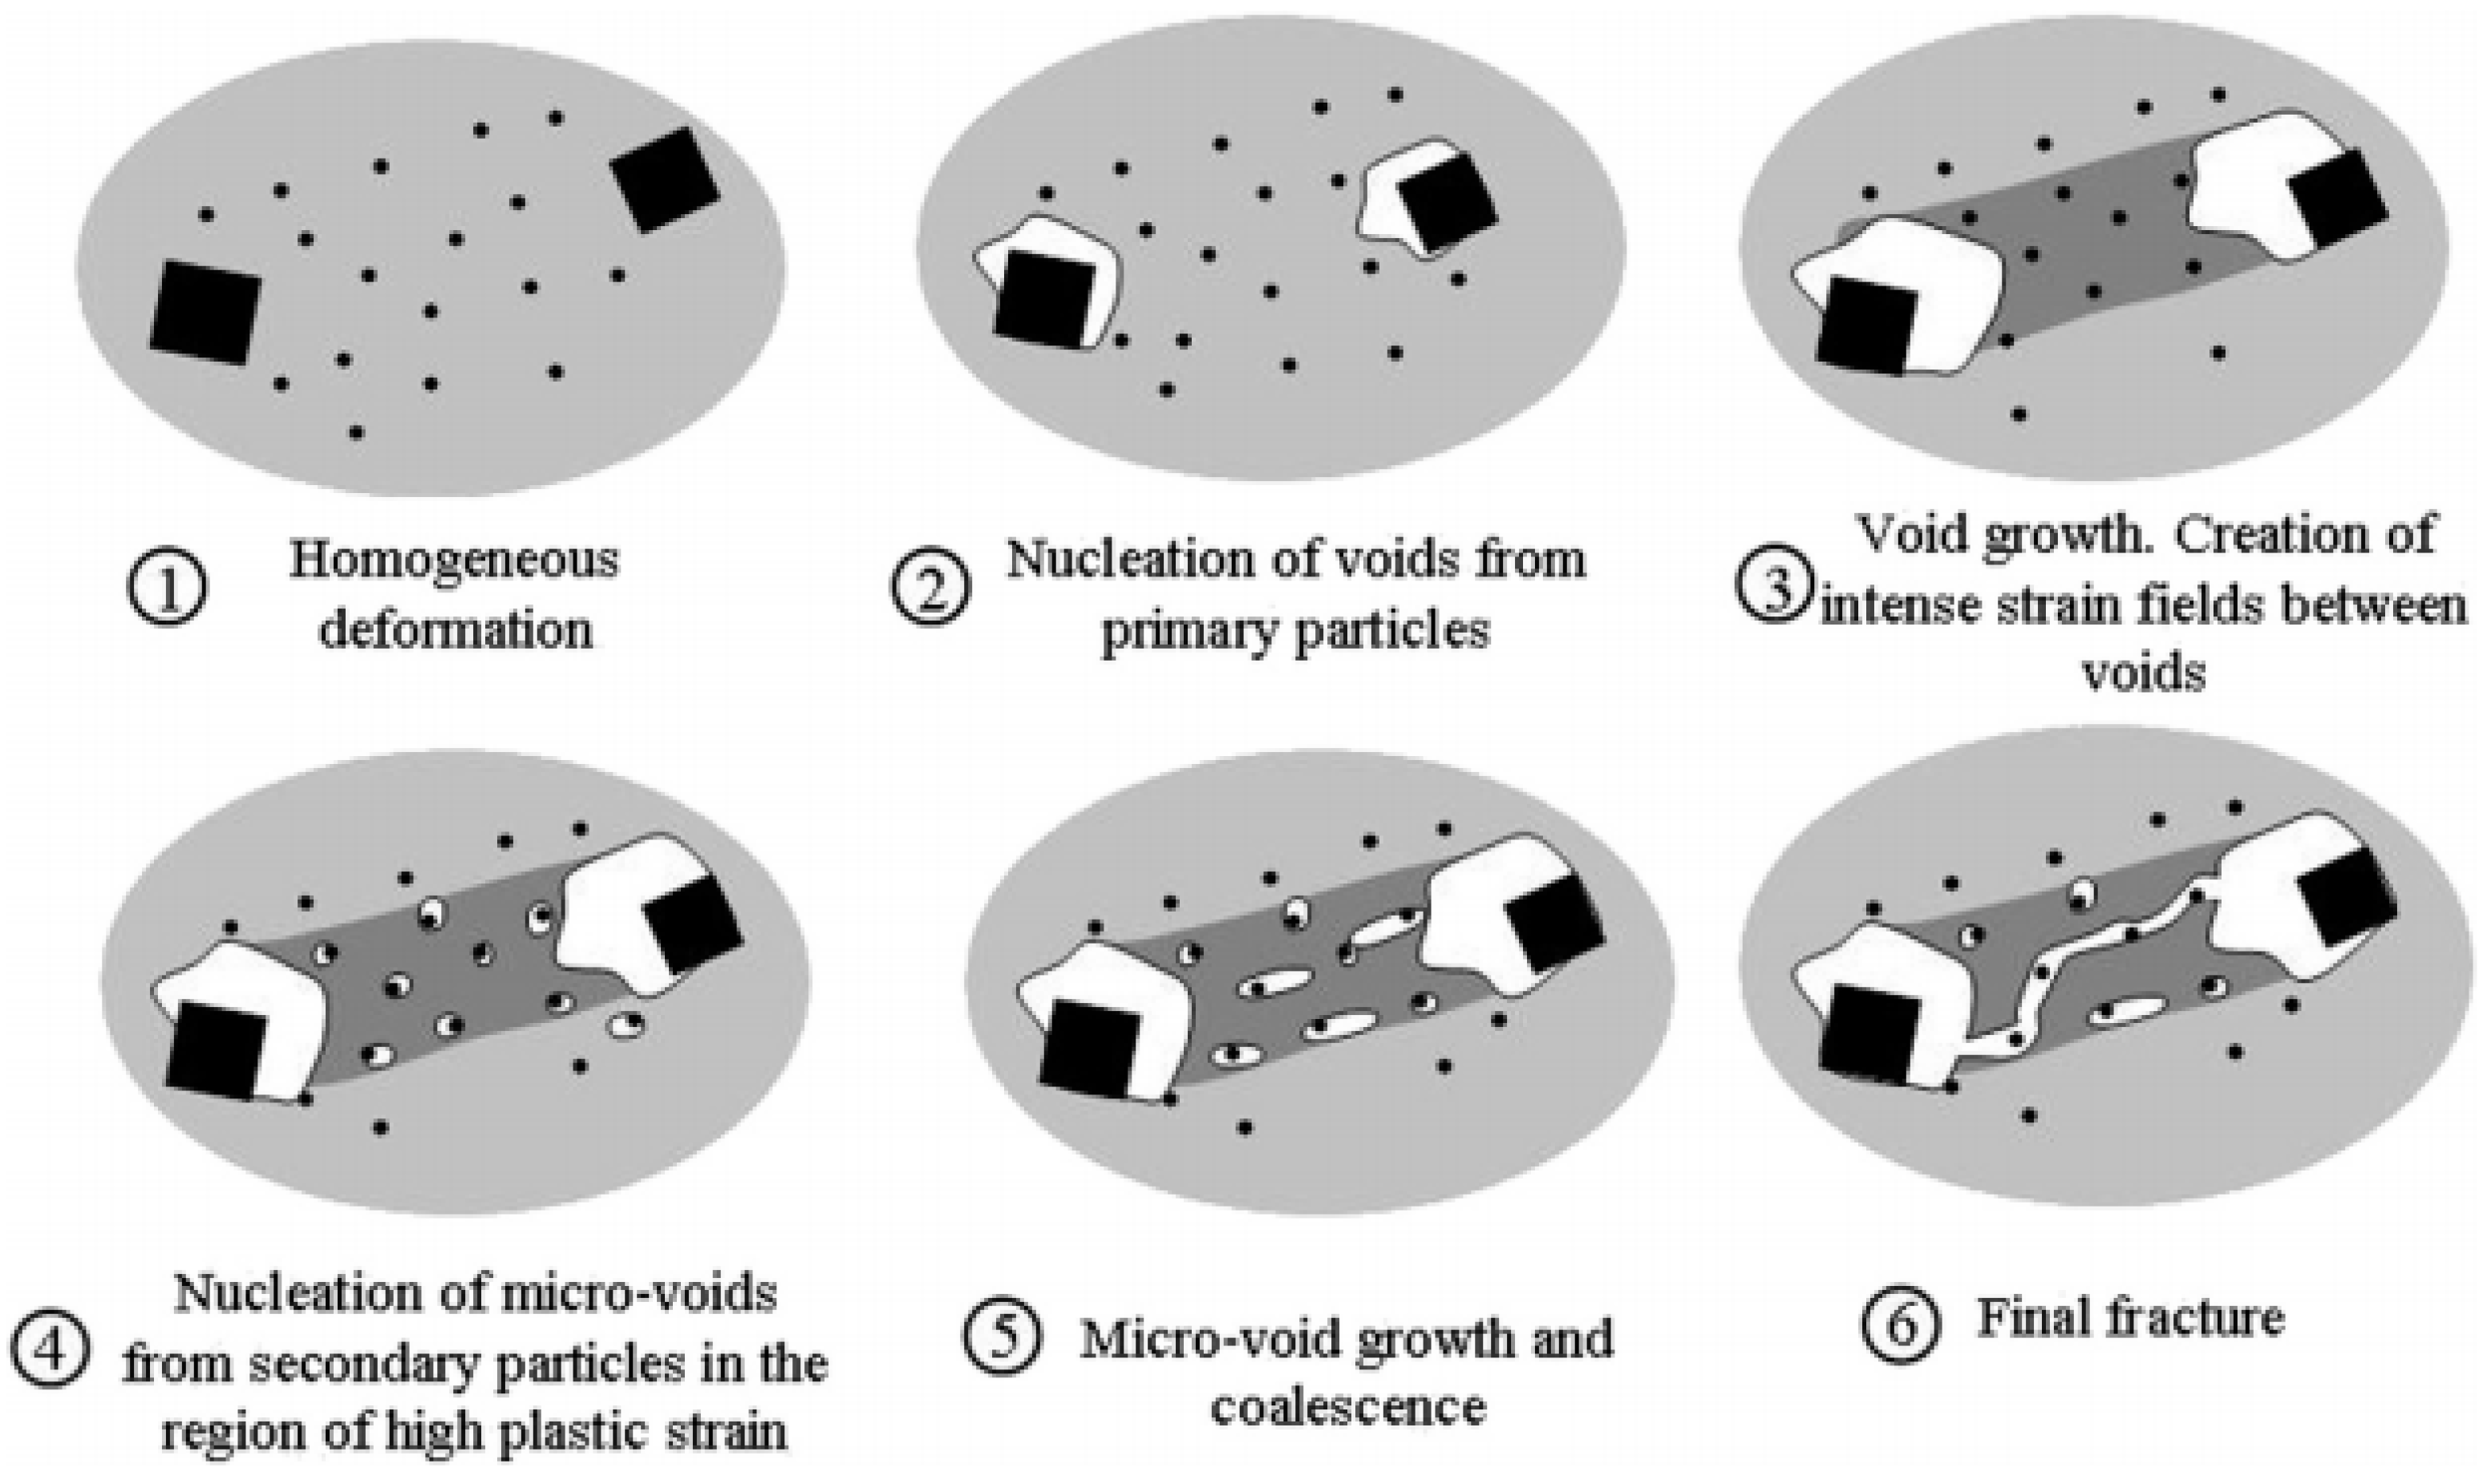
2.1. Decohesion at the Interface between Matrix and Particles

To comprehend the fracture mechanism in metals, it is necessary to simulate microstructures, particularly when precipitates or particles have a significant influence [6,7,8]. The separation between the constituent particles and the matrix, along with particle fractures, are the initial causes of damage growth within some materials [9]. Finite element simulation allows us to comprehend the impact of decohesion on ductile fractures, which in turn decreases the requirement for costly trial and error experiments. Figure 1 displays the separation of a crack at the interface between the matrix and particles in a typical aluminum alloy known as AA7075-T6 [9].
Metals like aluminum and steel have second-phase particles. For instance, an AA7075 aluminum sheet consists of various kinds and arrangements of small precipitates, which vary based on the temper of the sheet. Additionally, the sheet contains different particles from upstream ingot casting, homogenization, and sheet processing, which are considerably larger and have diverse size distributions and shapes. Both precipitates and constituent particles can influence the mechanical properties, ductility, formability, strain localization, and failure processes of aluminum sheet materials. Recently, two distinct particles were discovered in an AA7075-T73 sheet, one containing iron (Al7Cu2Fe) and the other containing silicon (Mg2Si). Their mechanical properties were evaluated using Scanning Electron Micrograph (SEM)-based micropillar compression testing [10] (Figure 2a). It was observed that both of these particles exhibited elastic behavior. Furthermore, the stress–strain curve and plastic behavior of the aluminum matrix were also determined (Figure 2b).

2.2. Representative Volume Element (RVE)-Based Simulations

Systems based on RVEs ensure the measurement of material properties effectively while incorporating scalable capabilities [11,12,13,14,15,16,17,18]. An RVE is the smallest volume of material that encompasses the bulk properties. An RVE may be defined as a volume that shows the same overall material properties irrespective of the boundary conditions applied [19,20,21,22,23]. RVE-type models typically involve a microstructure at only one length-scale, but these microstructures provide effective material properties, as well as local microstructural responses. RVEs of metals like steel and aluminum have been developed and imported into FE software in order to examine how the microstructure affects the nonlinear elastoplastic stress–strain behavior of the material [6,24]. Studying decohesion at the interface between the matrix and particles by incorporating cohesive elements in RVEs is crucial. Grilli et al. [25] recently created a script that inserts cohesive elements at the grain boundary interfaces in a crystalline material. However, to the best of the authors’ knowledge, no similar work involving the insertion of cohesive elements at the matrix/precipitate interfaces of 2D RVEs for metals has been described in the literature. This is especially relevant for those created using OOF2 software, and most importantly, the script is publicly accessible.
There are several software programs that allow one to generate the RVE for materials, such as CEMHYD3D for cement past materials [26], Dream.3D [27], and Neper [28] for metals. There is software available for generating RVEs based on actual metal images, such as OOF2, which was developed by the National Institute of Standards and Technology (NIST) [29]. OOF2 generates the RVE containing multiple phases, and the resulting output can be imported into the FE software ABAQUS. Every phase is assigned to a separate element set with specific material properties. The RVE in OOF2 can be meshed using rectangular elements with four nodes or triangular elements with three nodes [29].
In order to obtain accurate outcomes, it is necessary to have experimental microstructure data, which helps in constructing the RVE. In addition, it is also necessary to consider the responses of the matrix and its constituent particles. The separation at the boundary between the matrix and particles, along with the fracture of particles, results in the void coalescence and eventually the final fracture of metals [30,31]. The phenomenon has been clearly demonstrated in a typical sheet made of an AA2xxx series aluminum alloy [32]. However, information regarding the behavior of individual microstructural components and the interface between the matrix and constituents in aluminum sheet materials is scarce in the existing literature. Moreover, experimenting to accurately define this behavior can be more difficult. It may be necessary to estimate it by taking into account additional theoretical considerations.
ABAQUS/ CAE offers more advanced features. The shape of the geometry can be changed by using extrusions of various shapes, and it is possible to put together multiple parts to create a model; thus, samples with arbitrary shapes can be reproduced. The mesh generation capabilities of ABAQUS/CAE are also more advanced. Different element types and meshing algorithms can be used [25]. Therefore, performing FE analysis of the RVE created using the software OOF2 and importing it into ABAQUS is an ideal approach to comprehend and accurately depict the elastic–plastic behavior of metals, as well as the fracture process [24].
To summarize, matrix/precipitate or matrix/particle interfaces are 2D interfaces that offer crack nucleation and propagation sites in various metals [6]. The mechanical properties of these interface elements, which describe this phenomenon, can be modeled using a traction–separation law [33]. The elements at the matrix/precipitate elements constitute a 2D mesh. However, commercial FE software does not provide the option to automatically generate cohesive elements at the interfaces. MATLAB software can be used to manipulate the ABAQUS input file in order to insert the cohesive elements at the interfaces.
RVE-type models typically involve microstructures at a single length-scale, but they also offer effective material properties and local microstructural responses. RVEs of metals such as steel and aluminum have been created and imported into FE software to study the effects of microstructures on the nonlinear elastoplastic stress–strain response of the material [6,24]. Also, RVE-based approaches have been applied to plane stress (2D) to different stages of ductile fractures of high-strength steels containing randomly distributed particles such as void nucleation, growth, and coalescence [6] (Figure 3). Moreover, a real microstructure of a typical sheet material can be created using OOF2 software, as shown in Figure 4 [24], where an RVE is subjected to the uniaxial tension and damage evaluation, and the stress–strain response curves are shown and compared with experimental data.

2.3. Determination of Cohesion Properties

In order to achieve realistic results, experimental microstructure data are required to create the RVE and the constitutive responses of the matrix and associated constituent particles. Furthermore, cohesive properties are required between the matrix/interface, and maximum stress is necessary for particle cracking and matrix failure. It is important to note that the study conducted by Ramazani et al. [24] focuses on dual-phase (DP) steels, which exhibit a significant volume fraction of martensite and experience extensive damage that is often easily quantified. For instance, the accumulation of damage in the tensile test for DP600 dual-phase steels has been studied and presented in [34]. The high-strength aluminum sheet materials used in the automotive sector have a much smaller fraction of second-phase particles distributed within the aluminum matrix phase. The constitutive response of the individual microstructural components and the matrix/constituent interface for aluminum sheet materials is often not available in the literature, and characterizing it experimentally is more challenging. It may be necessary to estimate it by taking into account additional theoretical considerations. In aluminum-based metal-matrix composites, which have a much higher volume of particles compared to automotive aluminum sheet materials, it has been mentioned that the stage of void nucleation starts when particles fracture or when there is decohesion at the interface between the matrix and particles [32]. Decohesion between the matrix and particles, along with particle breakdown leading to coalescence, is clearly observed in a typical sheet of AA2xxx series aluminum alloy, as depicted in Figure 5 [32]. It is stated that stress does not exceed a critical level in the soft matrix, and particle decohesion from the matrix takes place. Furthermore, it can be deduced that the principal damage mechanism in a soft matrix is the separation of particles from the matrix caused by tensile loading. On the other hand, particle cracking is the primary damage mechanism observed in hard matrix systems. This type of cracking mainly occurs along surfaces that are approximately perpendicular to the tensile axis. However, particle/matrix decohesion is also observed in hard matrix materials, but it occurs at a significantly lower level of plastic strain. Furthermore, it has been observed that the proportion of particles that have become detached tends to decrease as the volume fraction of reinforcement increases. In another study [35], it was discovered that as the temperature increases, the main cause of damage changes from particle cracking to the separation of the matrix and particles when the matrix becomes softer. On the contrary, it is also observed that the strength of the particles remains the same in both the soft and hard matrix materials [36]. However, determining the accuracy of this assumption for the strength of the matrix/particle interface is quite challenging [36].
The process of particle breakdown is controlled by the stress level, whereas the debonding of interfaces depends on the plastic strain that has accumulated in the matrix near the interface. The particle/matrix interface can only fail due to the accumulation of damage caused by the proximity of plasticity to the particle [36]. The results regarding the cracking of particles are relatively easy to explain and are primarily associated with the transmission of a load from the matrix to the particle. Overall, the complexity of the stress/strain fields surrounding the particle makes it difficult to reach a unanimous agreement on decohesion [32]. It is noticeable that once decohesion is initiated, it begins to expand [37]. In other words, the growth threshold is equal to the initiation threshold.
For this study, the nanoindentation test, one of the indentation hardness tests for measuring the mechanical properties of materials, was used. The elastic properties of inclusion and the elastic–plastic stress–strain curve of the matrix in the AA7075 material were obtained using the nanoindentation test [10]. The most well-known method for calculating the Young’s modulus of a sample is based on the theory of Hertz’s model [38]. The Young’s modulus of a material can be determined during the load–unload step.
The cumulative numerical fraction of damaged particles because of particles cracking and interface decohesion for pure aluminum matrix and Al2124 alloy reinforced by 4 vol% or 20 vol% of spherical hard ceramic particles are calculated using X-ray tomography by Babout et al. [39]. A Weibull distribution was employed to analyze a population of particles that were dispersed within a matrix and subjected to a local mechanical field (denoted as “x”). The percentage of sites that have been affected by damage can be described as follows [39]:
W x = 1 e x p x / x 0 m
where W(x) is the cumulative numerical fraction for the damaged particle, and “x” is the local mechanical field, such as von Mises stress or elastic strain energy. A unit cell was simulated in ABAQUS using the method outlined by Babout et al. [39] (Figure 6). The unit cell includes a matrix and a spherical particle with no interface between the matrix and particle. The volume of the particle is determined by the volume fraction of particles dispersed in the matrix. Additionally, only one quarter of the unit cell was simulated due to its symmetrical configuration.
The stress–strain behaviors of both the matrix and particles were calculated using the nanoindentation method as described by Babout et al. [39]. Elasticity was considered for the particles, and plasticity was considered following the power law for the matrix. Then, the unit cell is exposed to loads, and the responses of the unit cell at various values of plastic strains are presented. As mentioned by Babout et al. [39], the stress and strain fields within the particle elements are uniform. However, the stress and strain fields over the interface between the matrix and particle are non-uniform. Therefore, the average values of stresses and strains at the interface between the matrix and particle are calculated and taken into consideration to determine the maximum stress when complete decohesion occurs. When the stress and strain fields as well as elastic energy density of particle and interface are calculated, the values of “m” and “x0” at two points based on cumulative numerical fractions are obtained. Finally, the maximum values of stress can be obtained with known values of “m” and “x0”. Elasticity is taken into account for the precipitate, while plasticity is considered for the matrix. Then, the unit cell is subjected to uniaxial loads, and then the average von Mises stress at the interface is calculated. Finally, the maximum stress at failure is found using the known values of “m” and “x0”. In fact, the maximum stress criterion is also used to determine decohesion at the interface. However, as indicated in the literature, the stress–displacement behavior utilized for cohesive materials does not adhere to the maximum stress criterion. Therefore, the maximum stress criterion will be utilized solely for particle fracturing. Readers are advised to refer to Ref. [39] for any details regarding the numerical results on how the cohesive elements were calculated.

3. OOF2: 2D Real Microstructure RVE Generation

An RVE of a typical microstructure with precipitates was created by employing a commercially available meshing program called OOF2, developed by NIST. The OOF2 interface can be accessed online [40], so there is no need for installation. The RVE was generated by utilizing data from an electron backscattered diffraction (EBSD) experiment conducted on a standard aluminum alloy sheet. The experiment was performed using SEM to capture images of the specimen. OOF2 distinguishes the pixel colors of each phase, merges them into a single group, and automatically generates the ABAQUS input file. Figure 7 displays the binary representation of the actual image of the typical aluminum alloy (AA7075-O aluminum alloy at room temperature [41]) at the microscale. This representation was achieved by applying thresholding using ImageJ and the RVE generated in ABAQUS. The length and width of the RVE are in the micrometer scale.
To provide a clear explanation of how an RVE can be simulated, a flow chart is presented in Figure 8. This figure demonstrates the sequential process of generating the RVE in OOF2 [29].

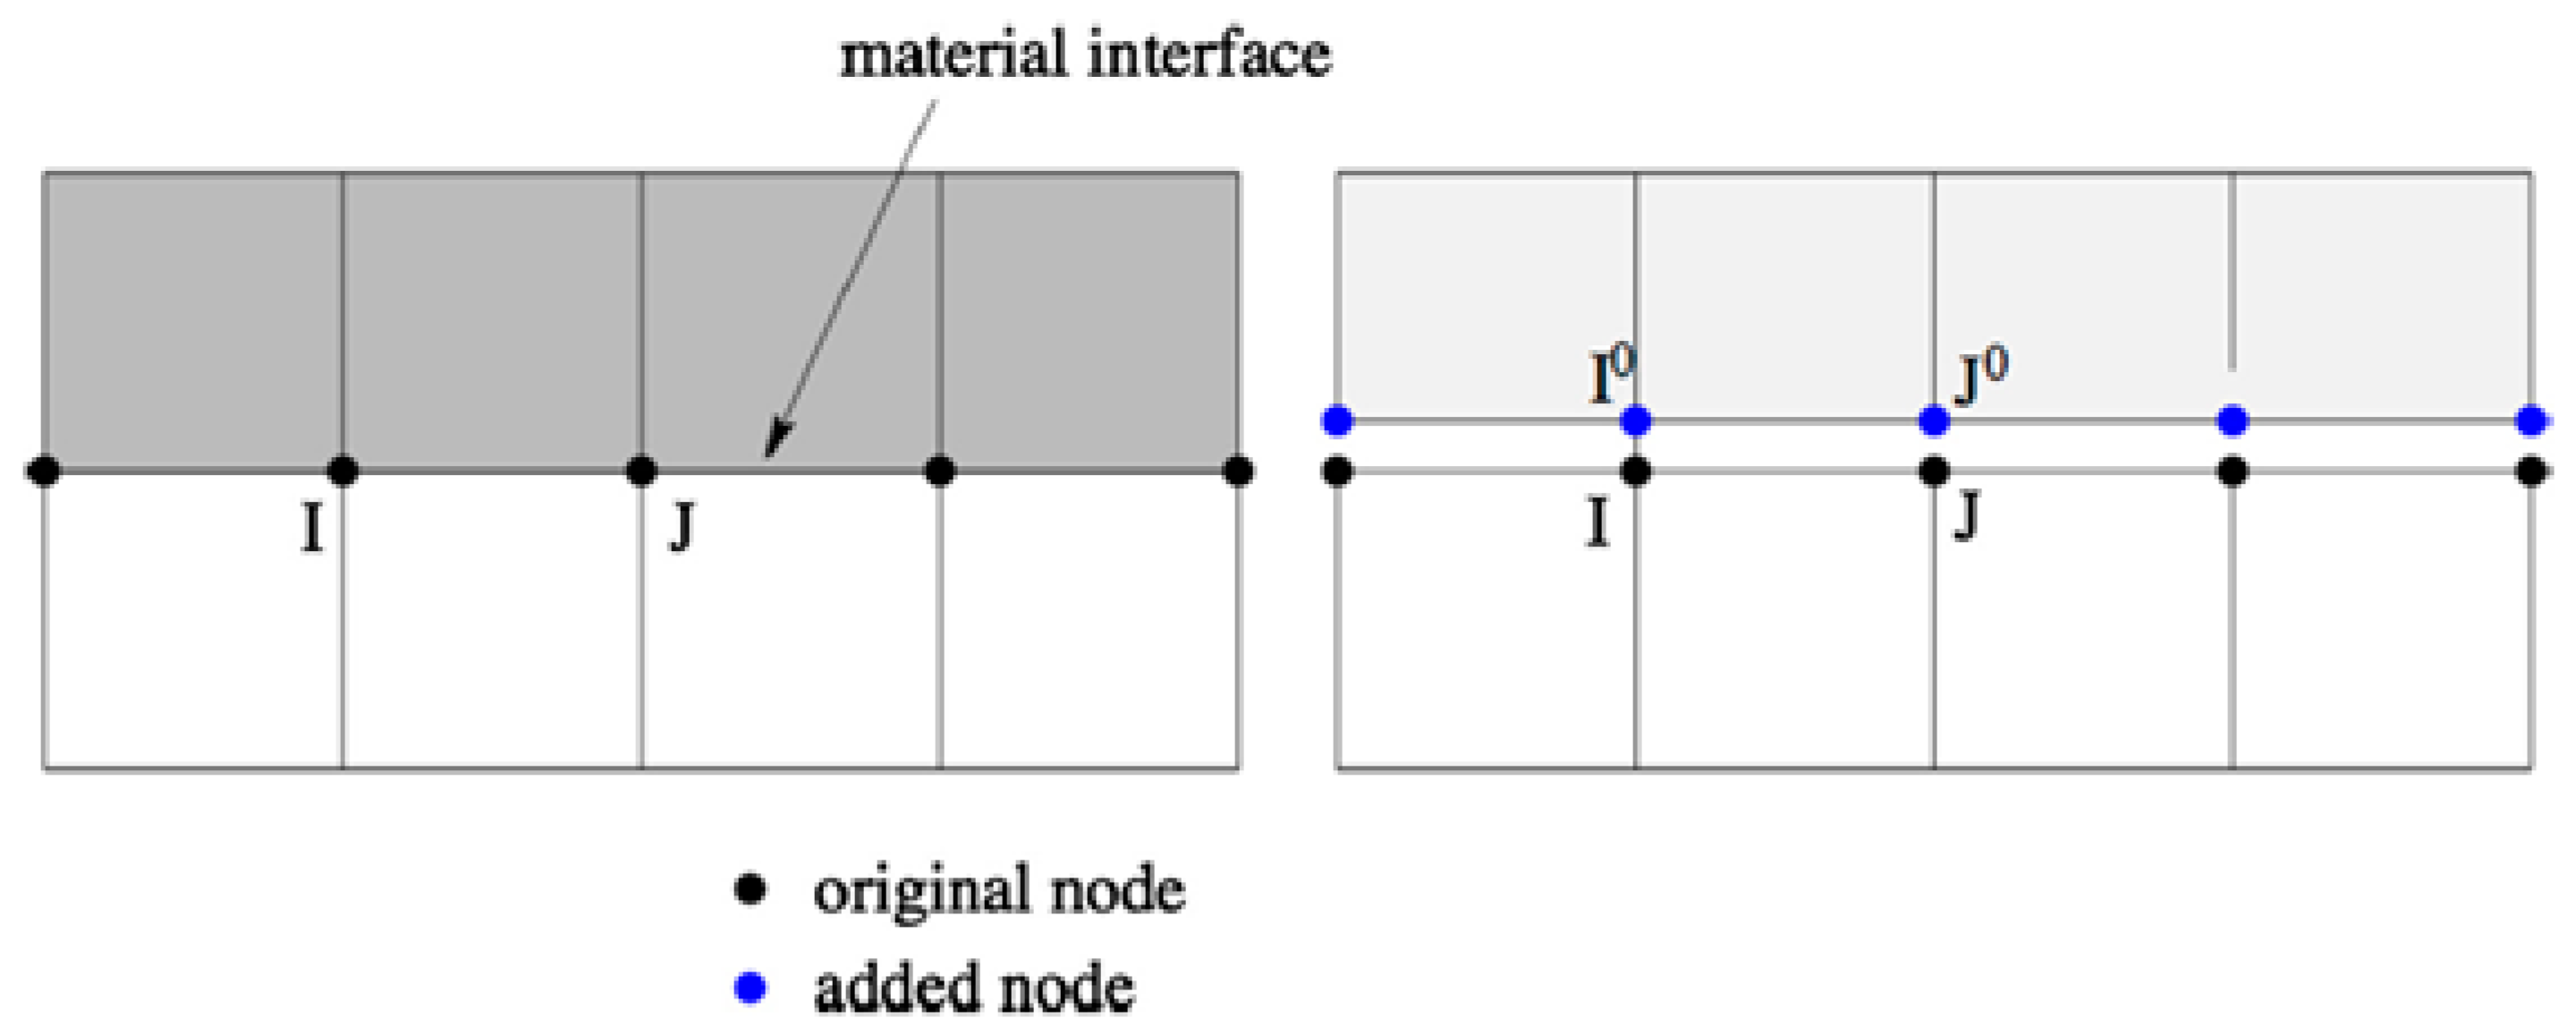
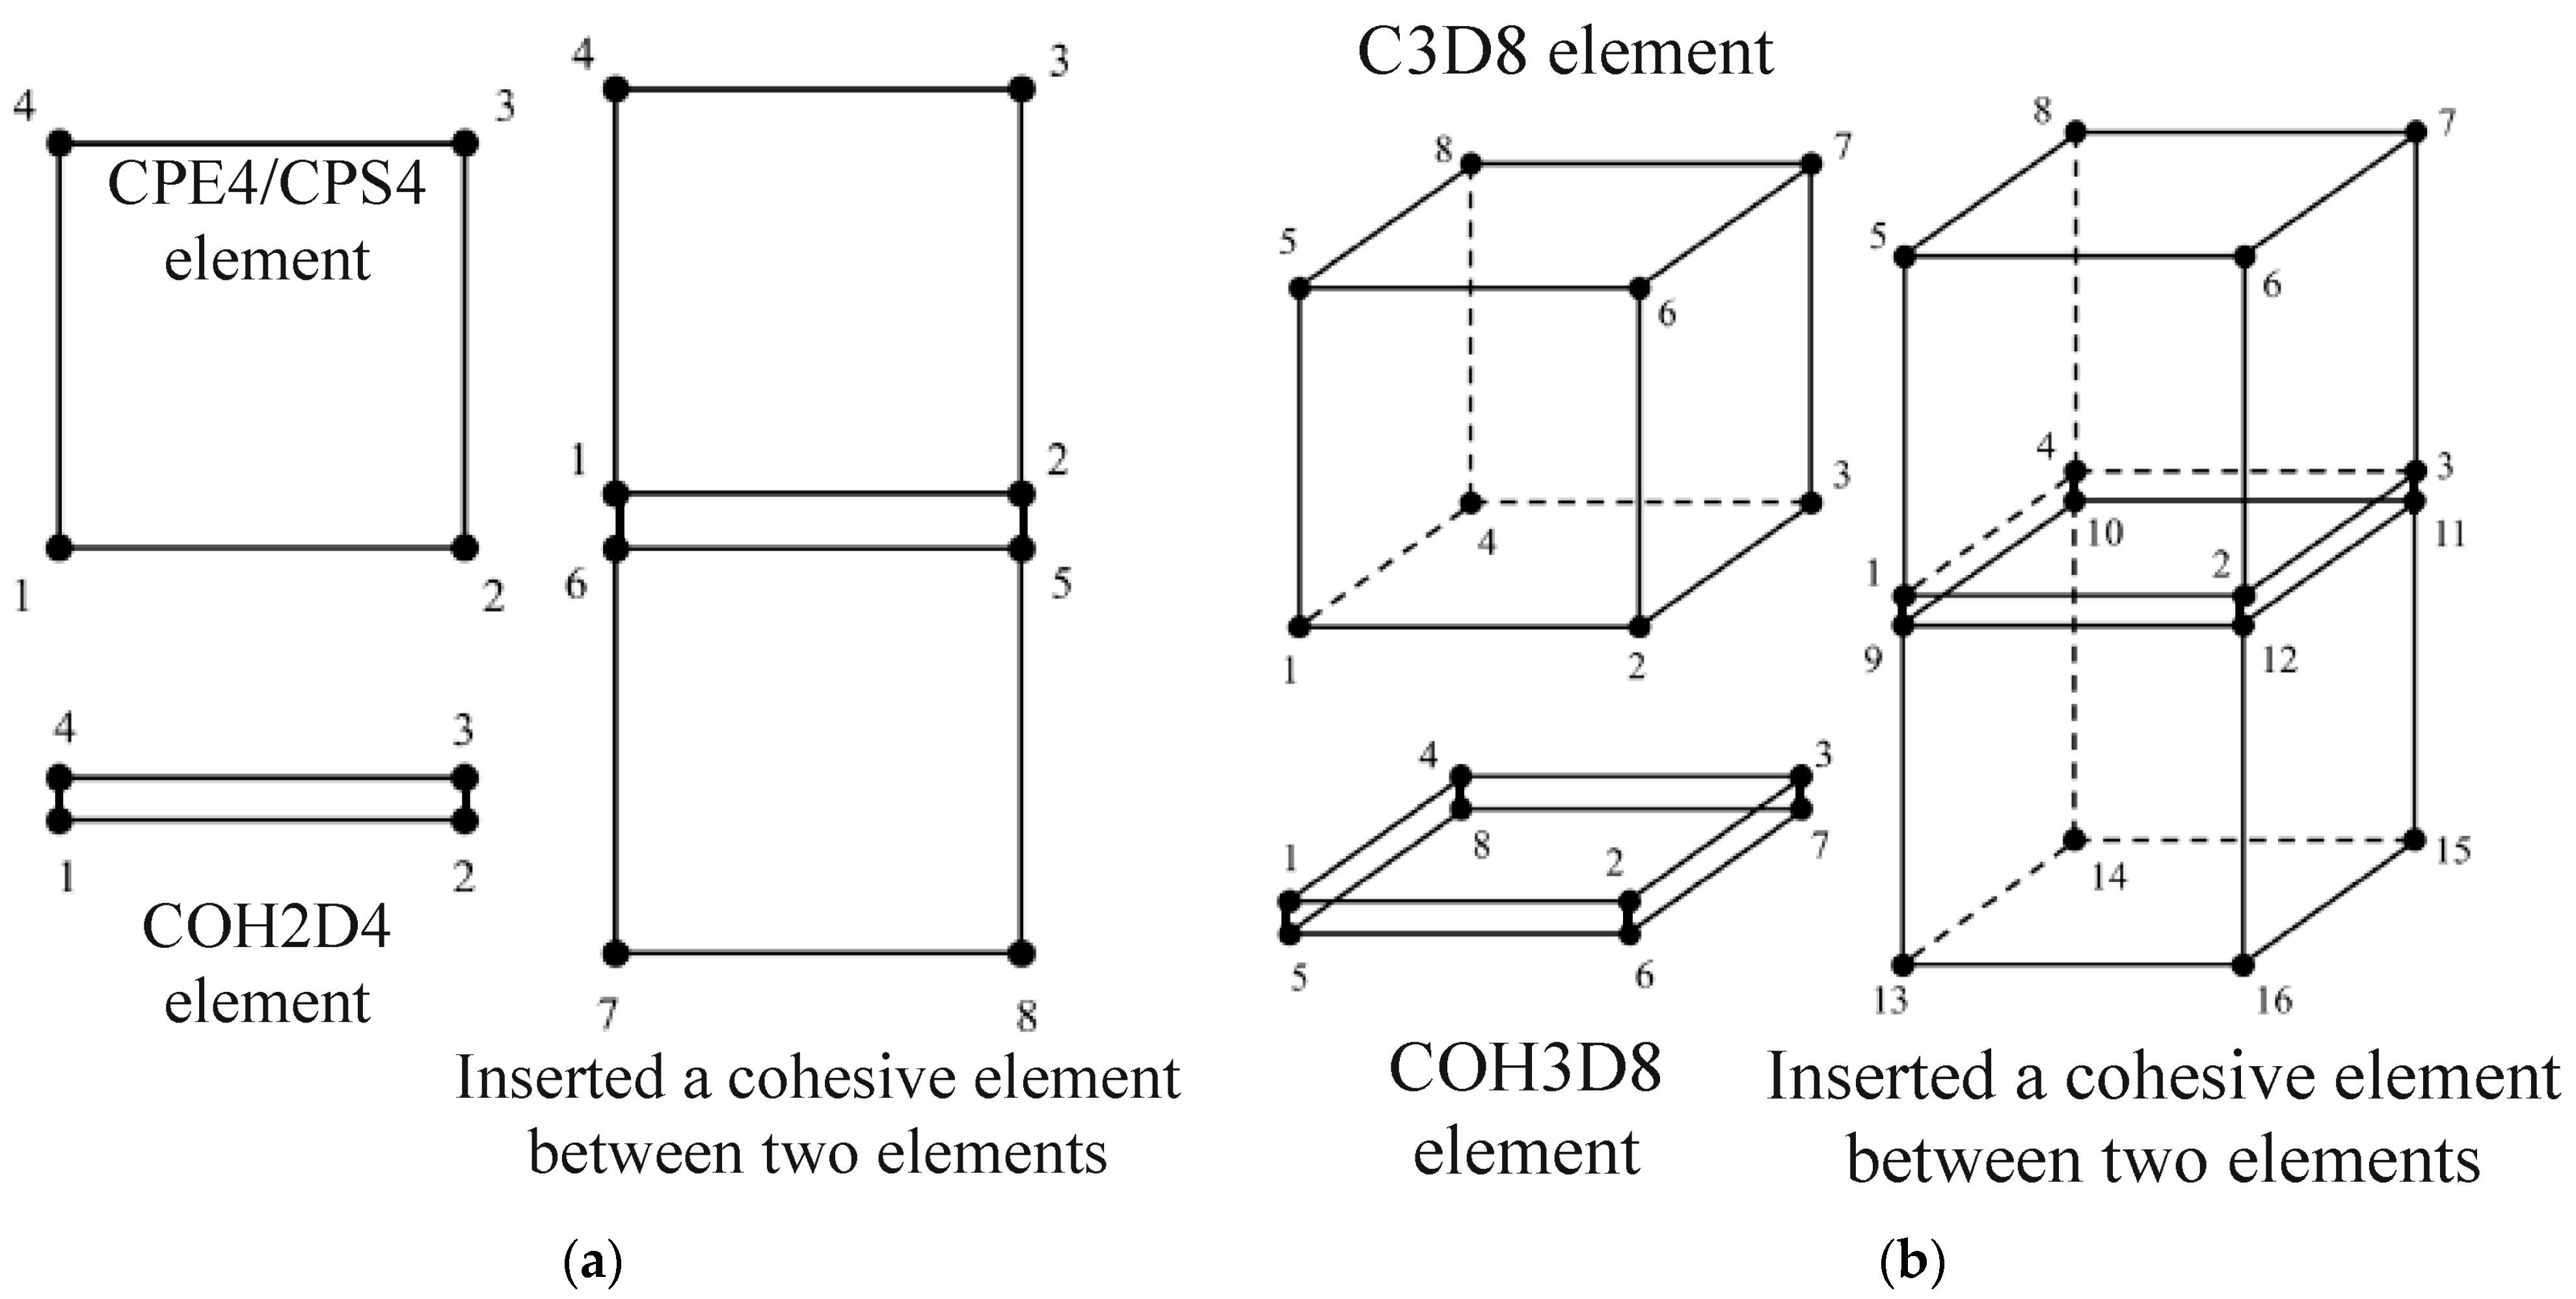
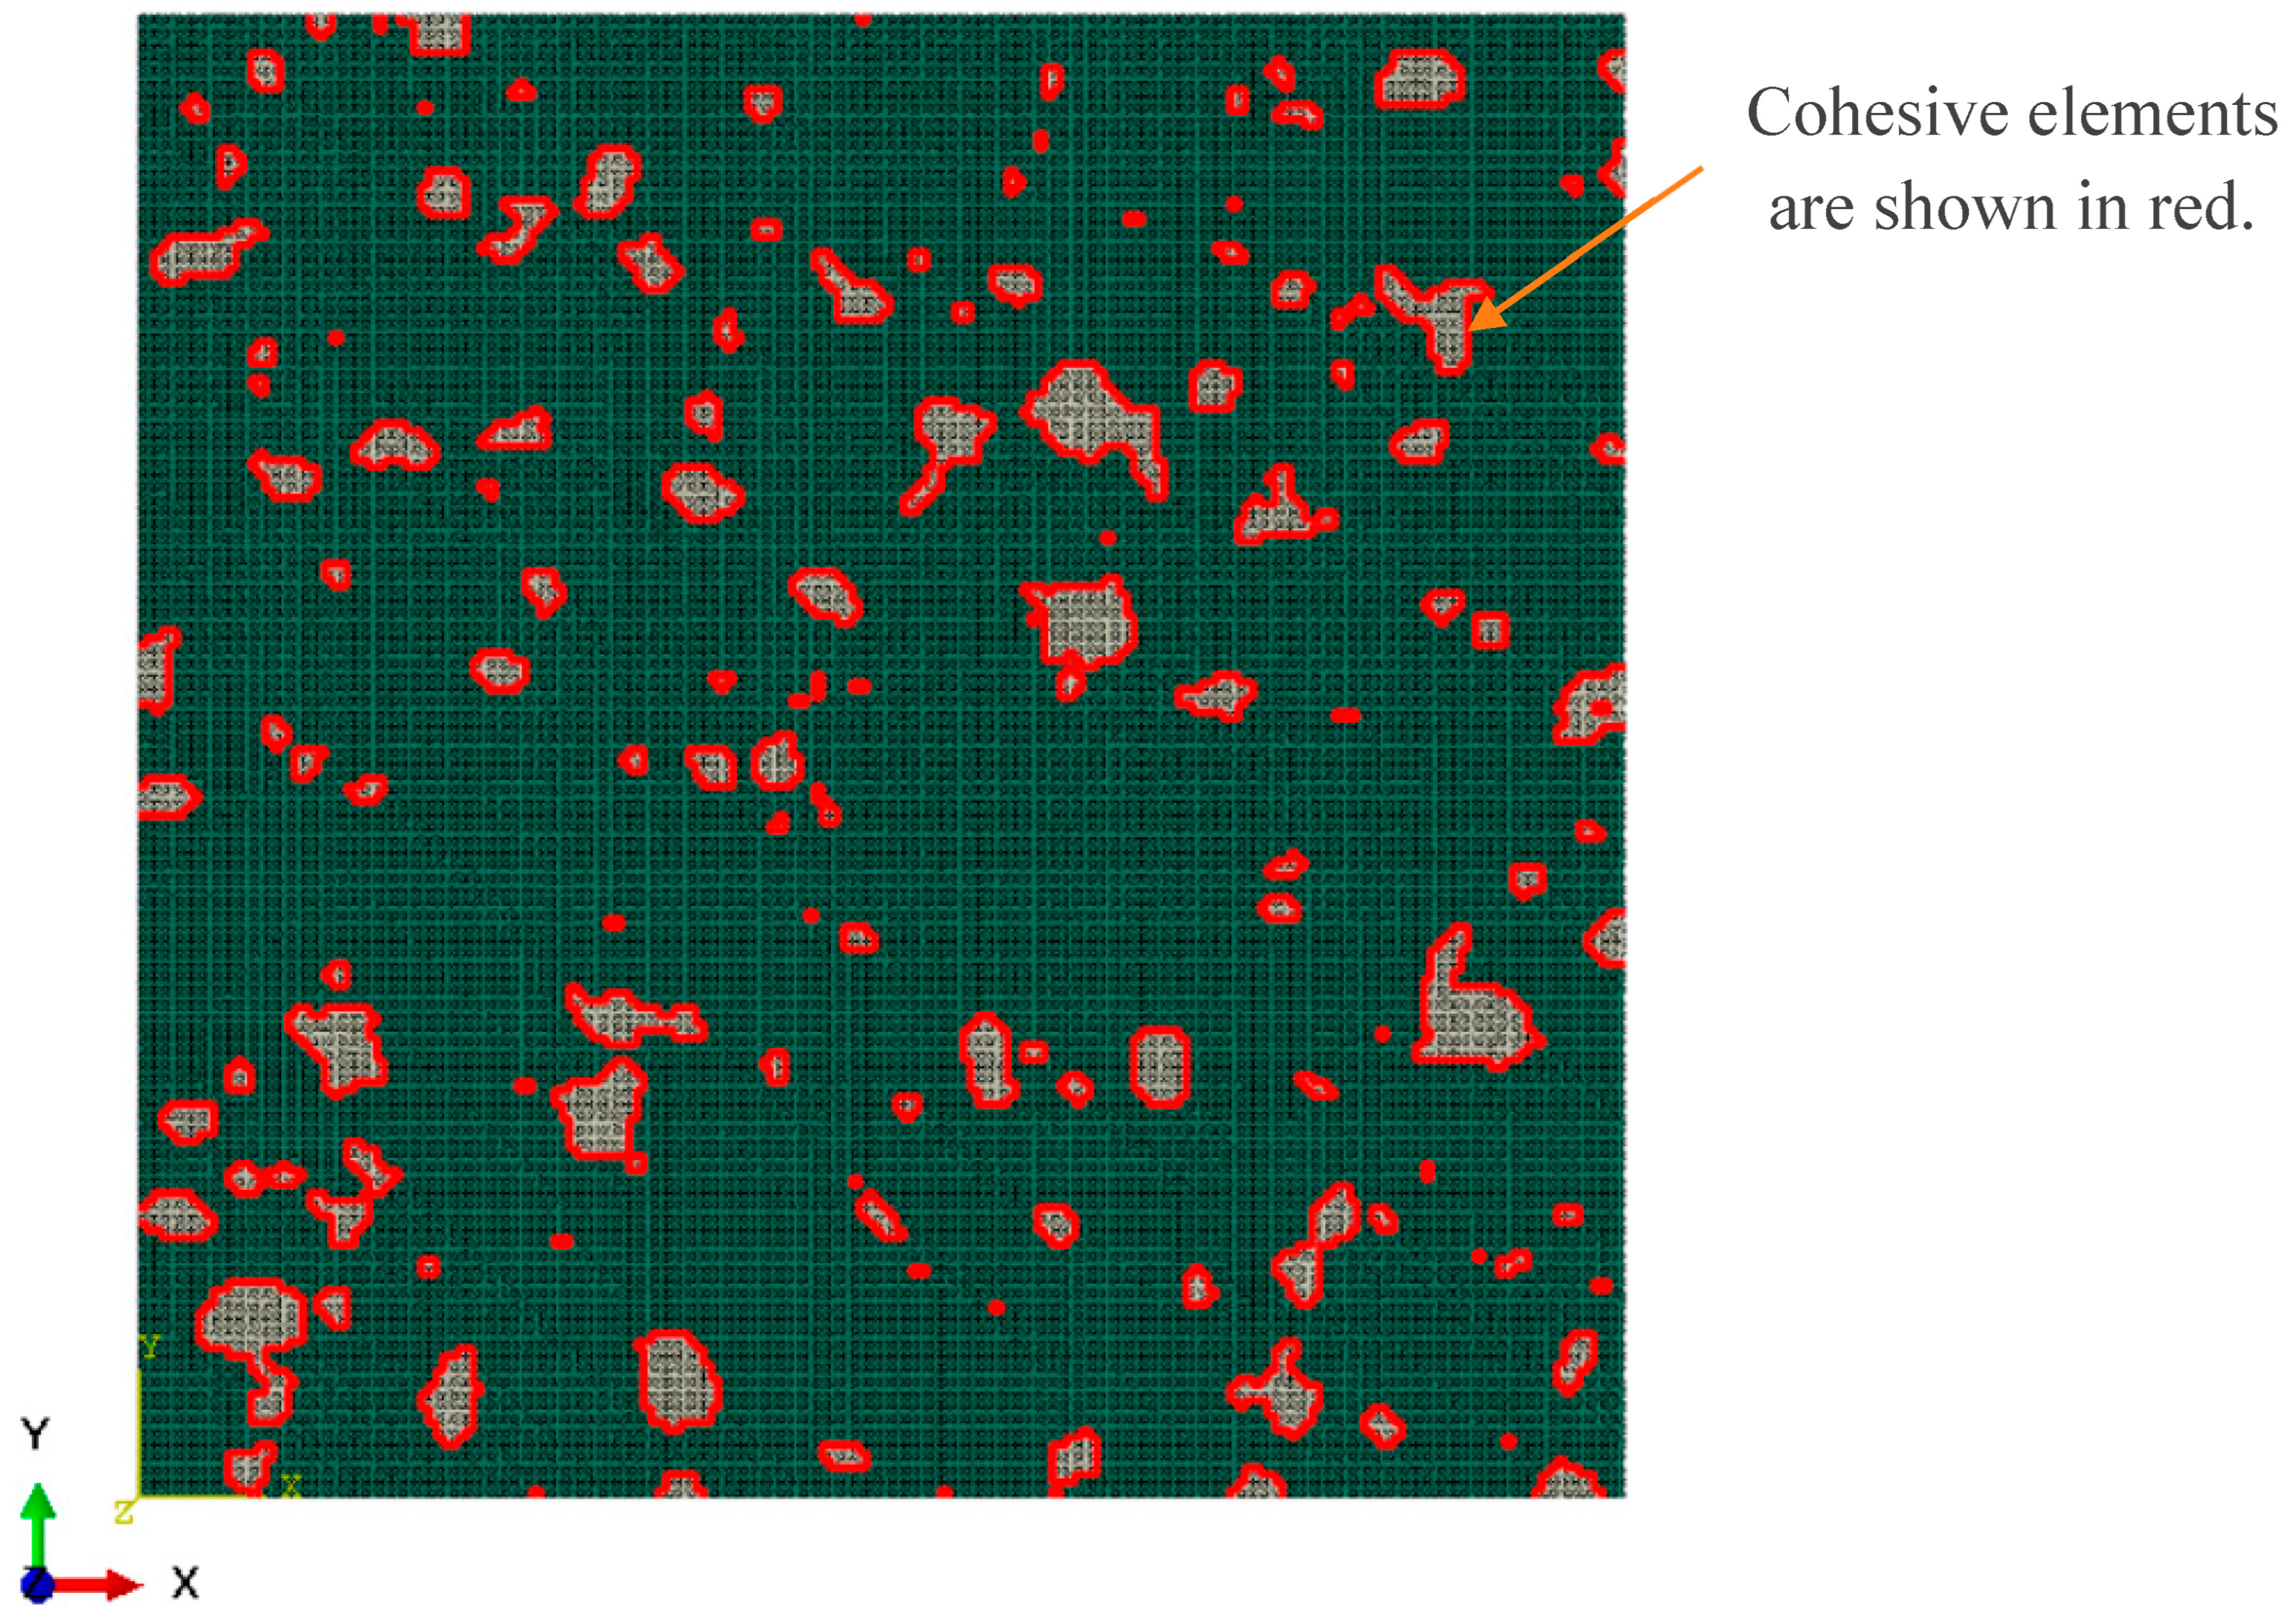
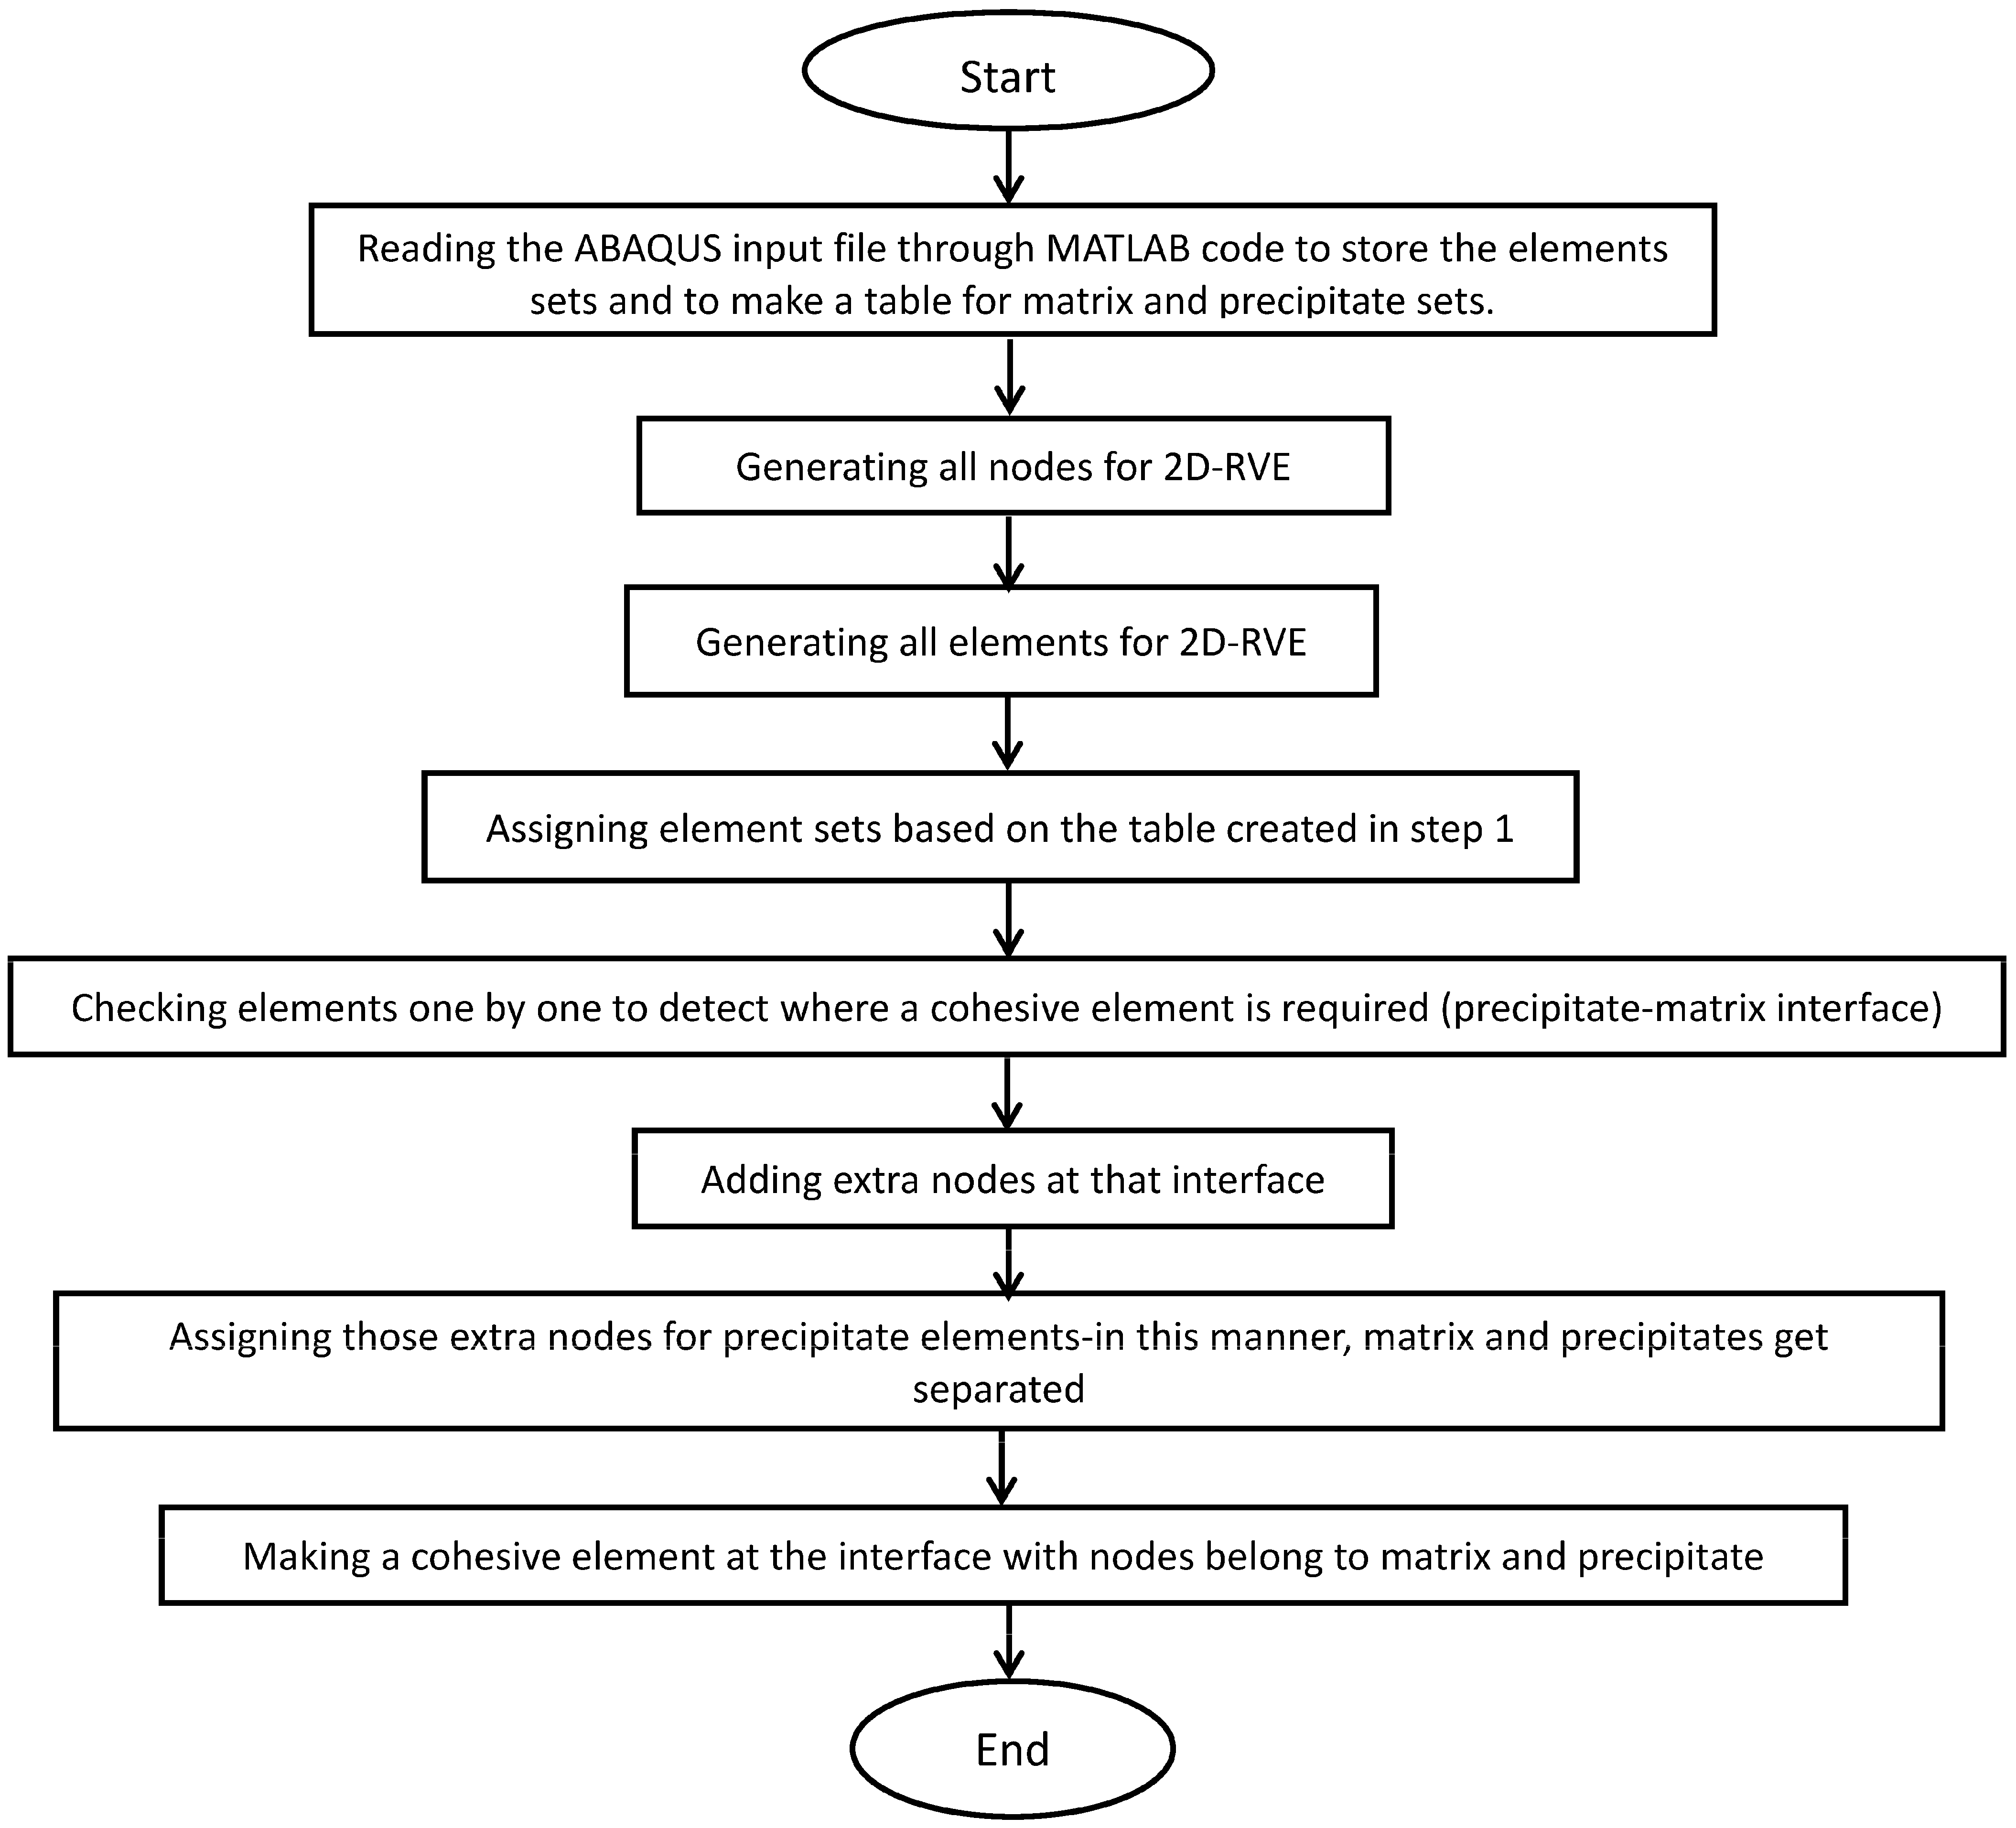
4. MATLAB Script: Inserting Cohesive Elements at the Matrix/Precipitate Interface

A MATLAB algorithm has been developed to insert cohesive elements between the matrix and precipitate elements. Figure 9 displays the included cohesive elements (depicted in red). The algorithm starts by reading the ABAQUS input file that is generated by the OOF2 software. Afterwards, it proceeds to generate nodes and elements in a sequential manner. The RVE is generated once more, and then the algorithm examines each element individually to identify the locations that require cohesive elements (the interface between the matrix and precipitate) where the material sets are different. Afterwards, it disconnects the matrix and precipitates elements by adding additional nodes and forms a unified element. An additional node is inserted in such a manner that it forms a cohesive element with zero thickness. In order to add the cohesive elements, the algorithm ensures that nodes and elements do not overlap. Placing cohesive elements at various locations is entirely distinct. The algorithm should initially check whether the cohesive element is meant to be inserted at the left, right, top, or bottom sides of a particle. Each case has its own scenario for disconnecting the matrix and precipitate elements and inserting the cohesive elements, including a cohesive element at each corner (specifically, at the top-left, bottom-left, top-right, or bottom-right corners), which also possess their own specific scenarios.
To provide a clear explanation of how cohesive elements are inserted within an RVE, a flow chart is presented in Figure 10. Figure 10 presents a thorough depiction of the algorithm’s procedure.
To insert 2D and three-dimensional (3D) elements (COH2D4 and COH3D8, respectively) in 2D RVEs in ABAQUS, two algorithms were implemented. Two-dimensional plane strain and stress elements such as CPE4 and CPS4, as well as a 3D element, namely C3D8, are considered. There is only one element in the thickness direction for the RVE when the 3D elements are used. These two algorithms are available through the following repositories [1,2]. Figure 11 demonstrates how an interface separates between two elements that possess different material properties, achieved by introducing additional nodes. Furthermore, Figure 12 displays a schematic representation of the separation of elements in both 2D and 3D.
As explained by Hu et al. [42], plane strain and plain stress conditions occur in the necking region, where fracture initiates. Therefore, it is necessary to create the 2D RVE. However, in some cases, users may only be able to create a 2D model using a 3D element and only one element in the thickness direction due to limited available tools. Thus, we have provided an algorithm for inserting cohesive elements for the 3D cases as well. It is important to note that the number of elements in the thickness is only one, and for instance, the case of plane strain can be considered when the element is thick.
Figure 11. An interface between two elements is separated through adding extra nodes [43].
Applsci 13 12281 g011
Figure 12. Schematic view of cohesive and bulk elements for (a) 2D and (b) 3D geometries [44]. Numbers belong to the nodes of every element.
Applsci 13 12281 g012

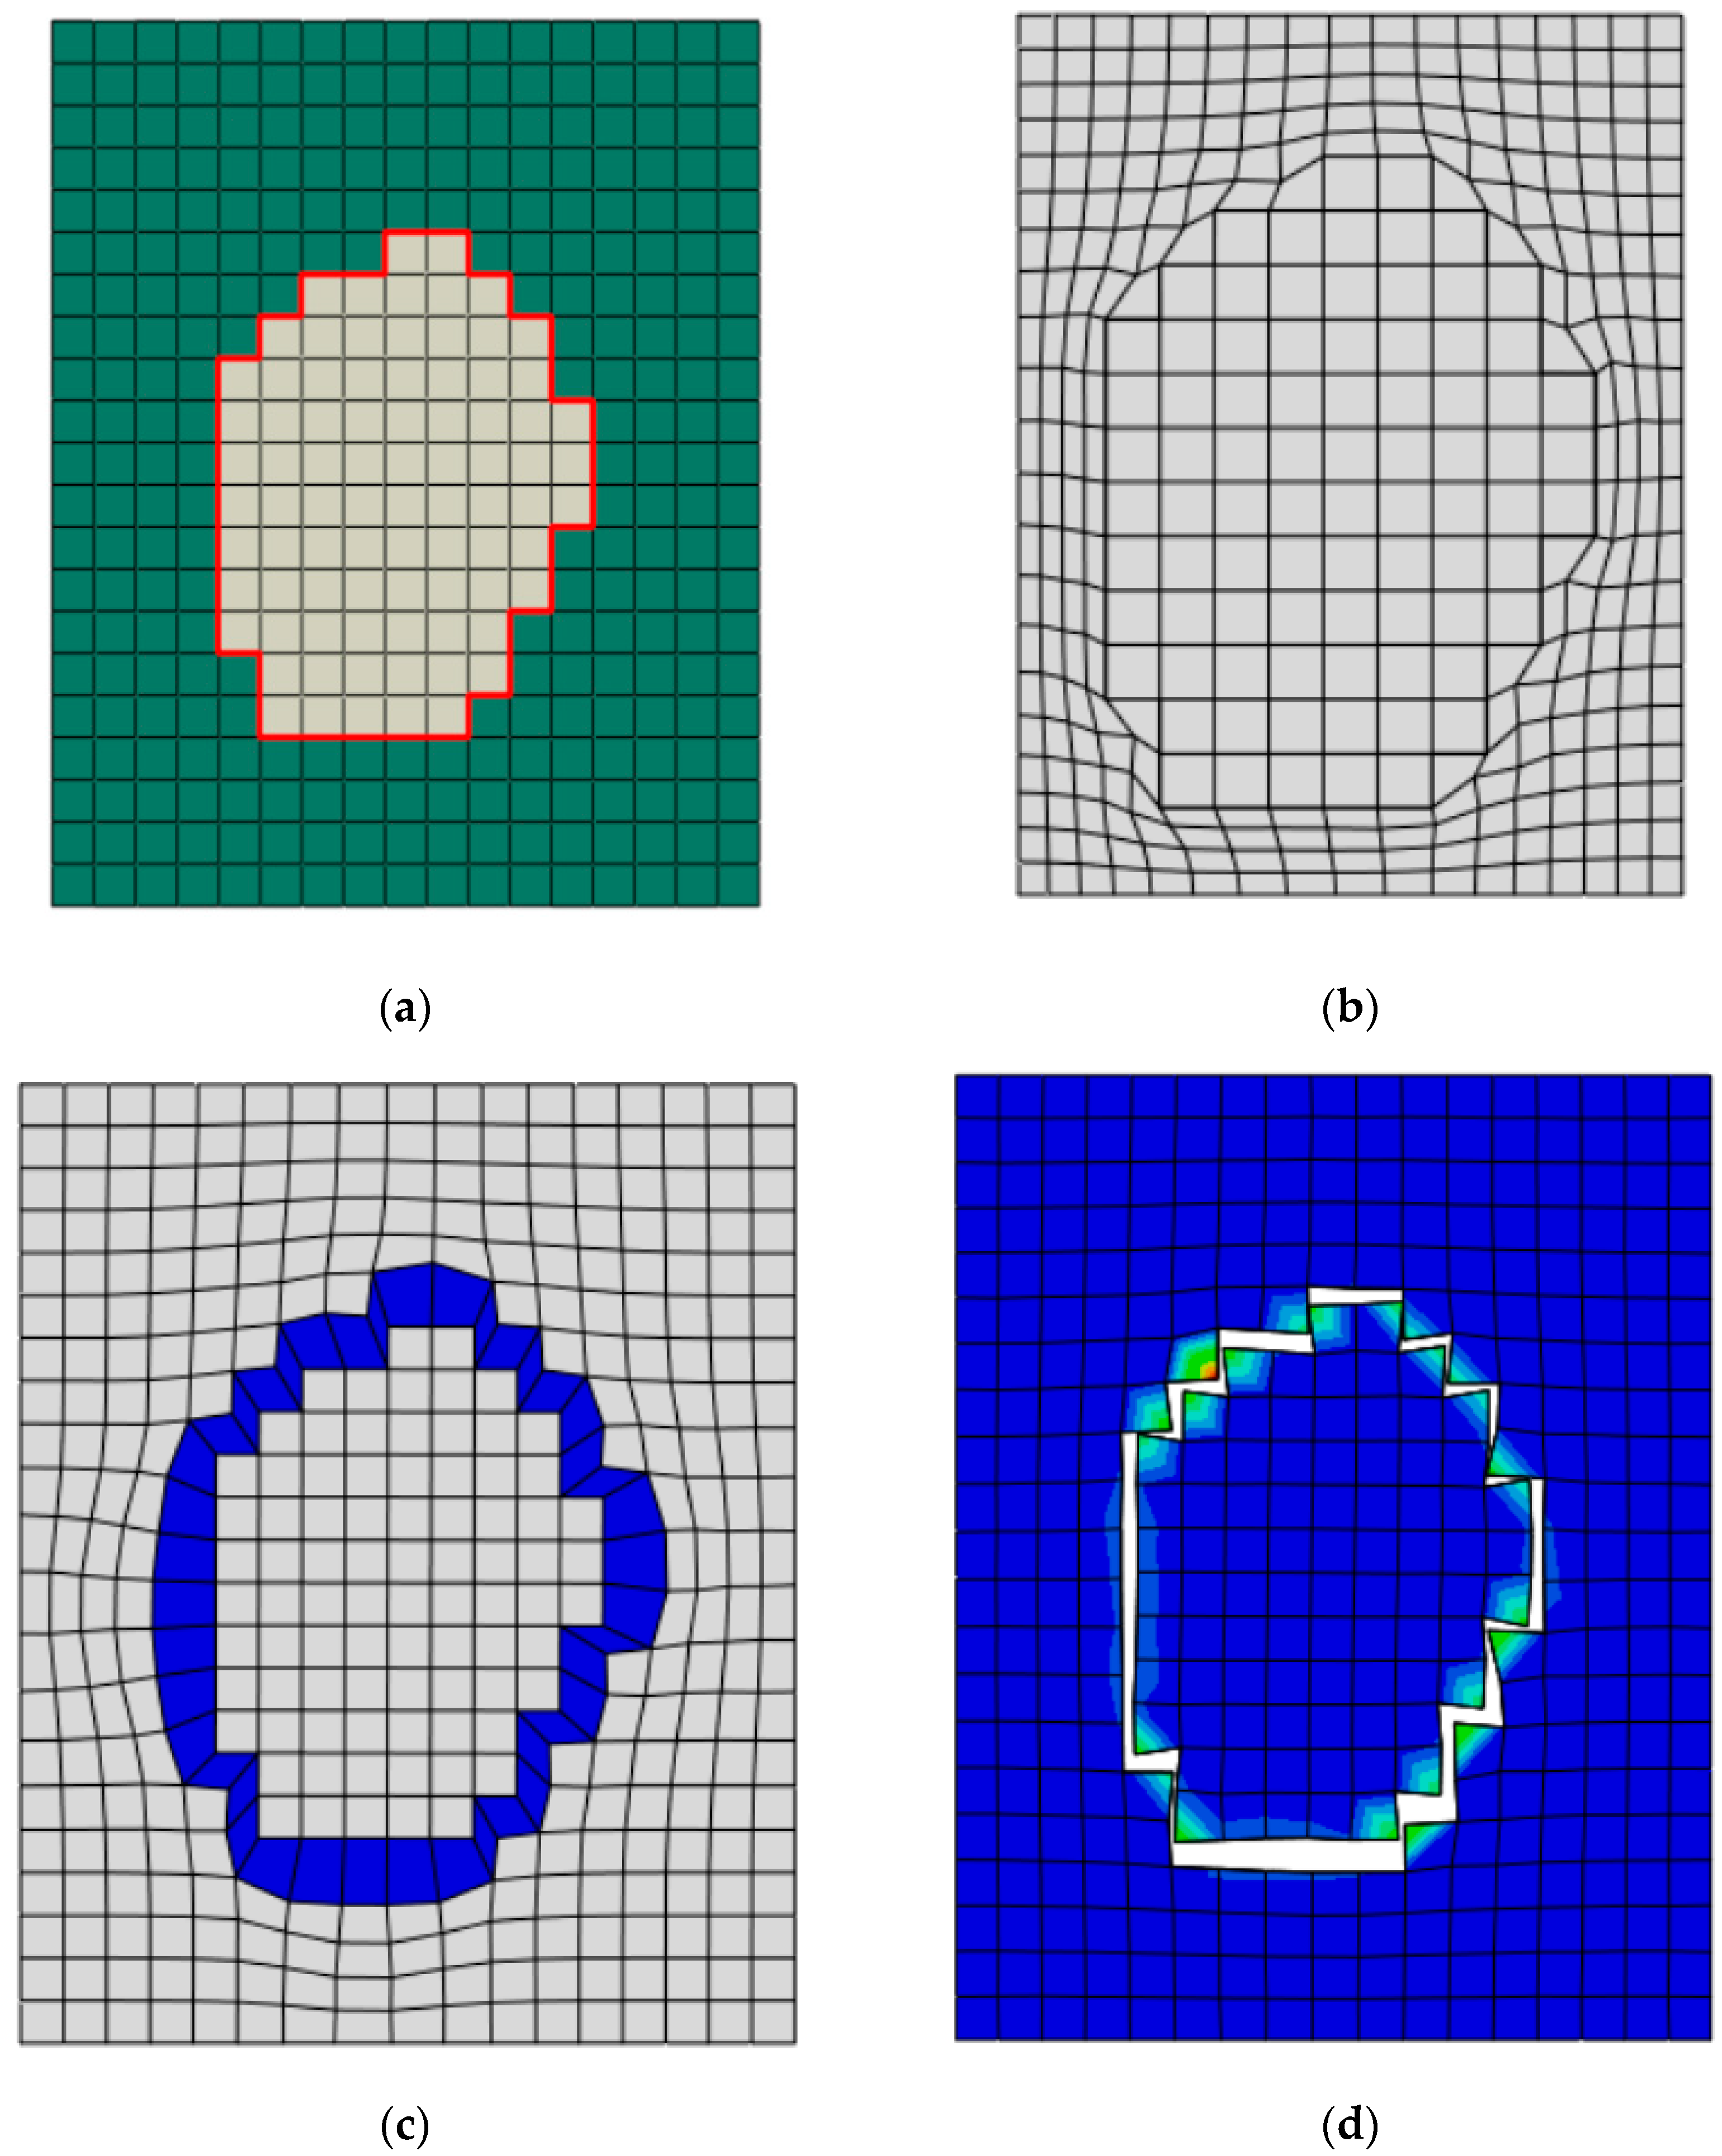
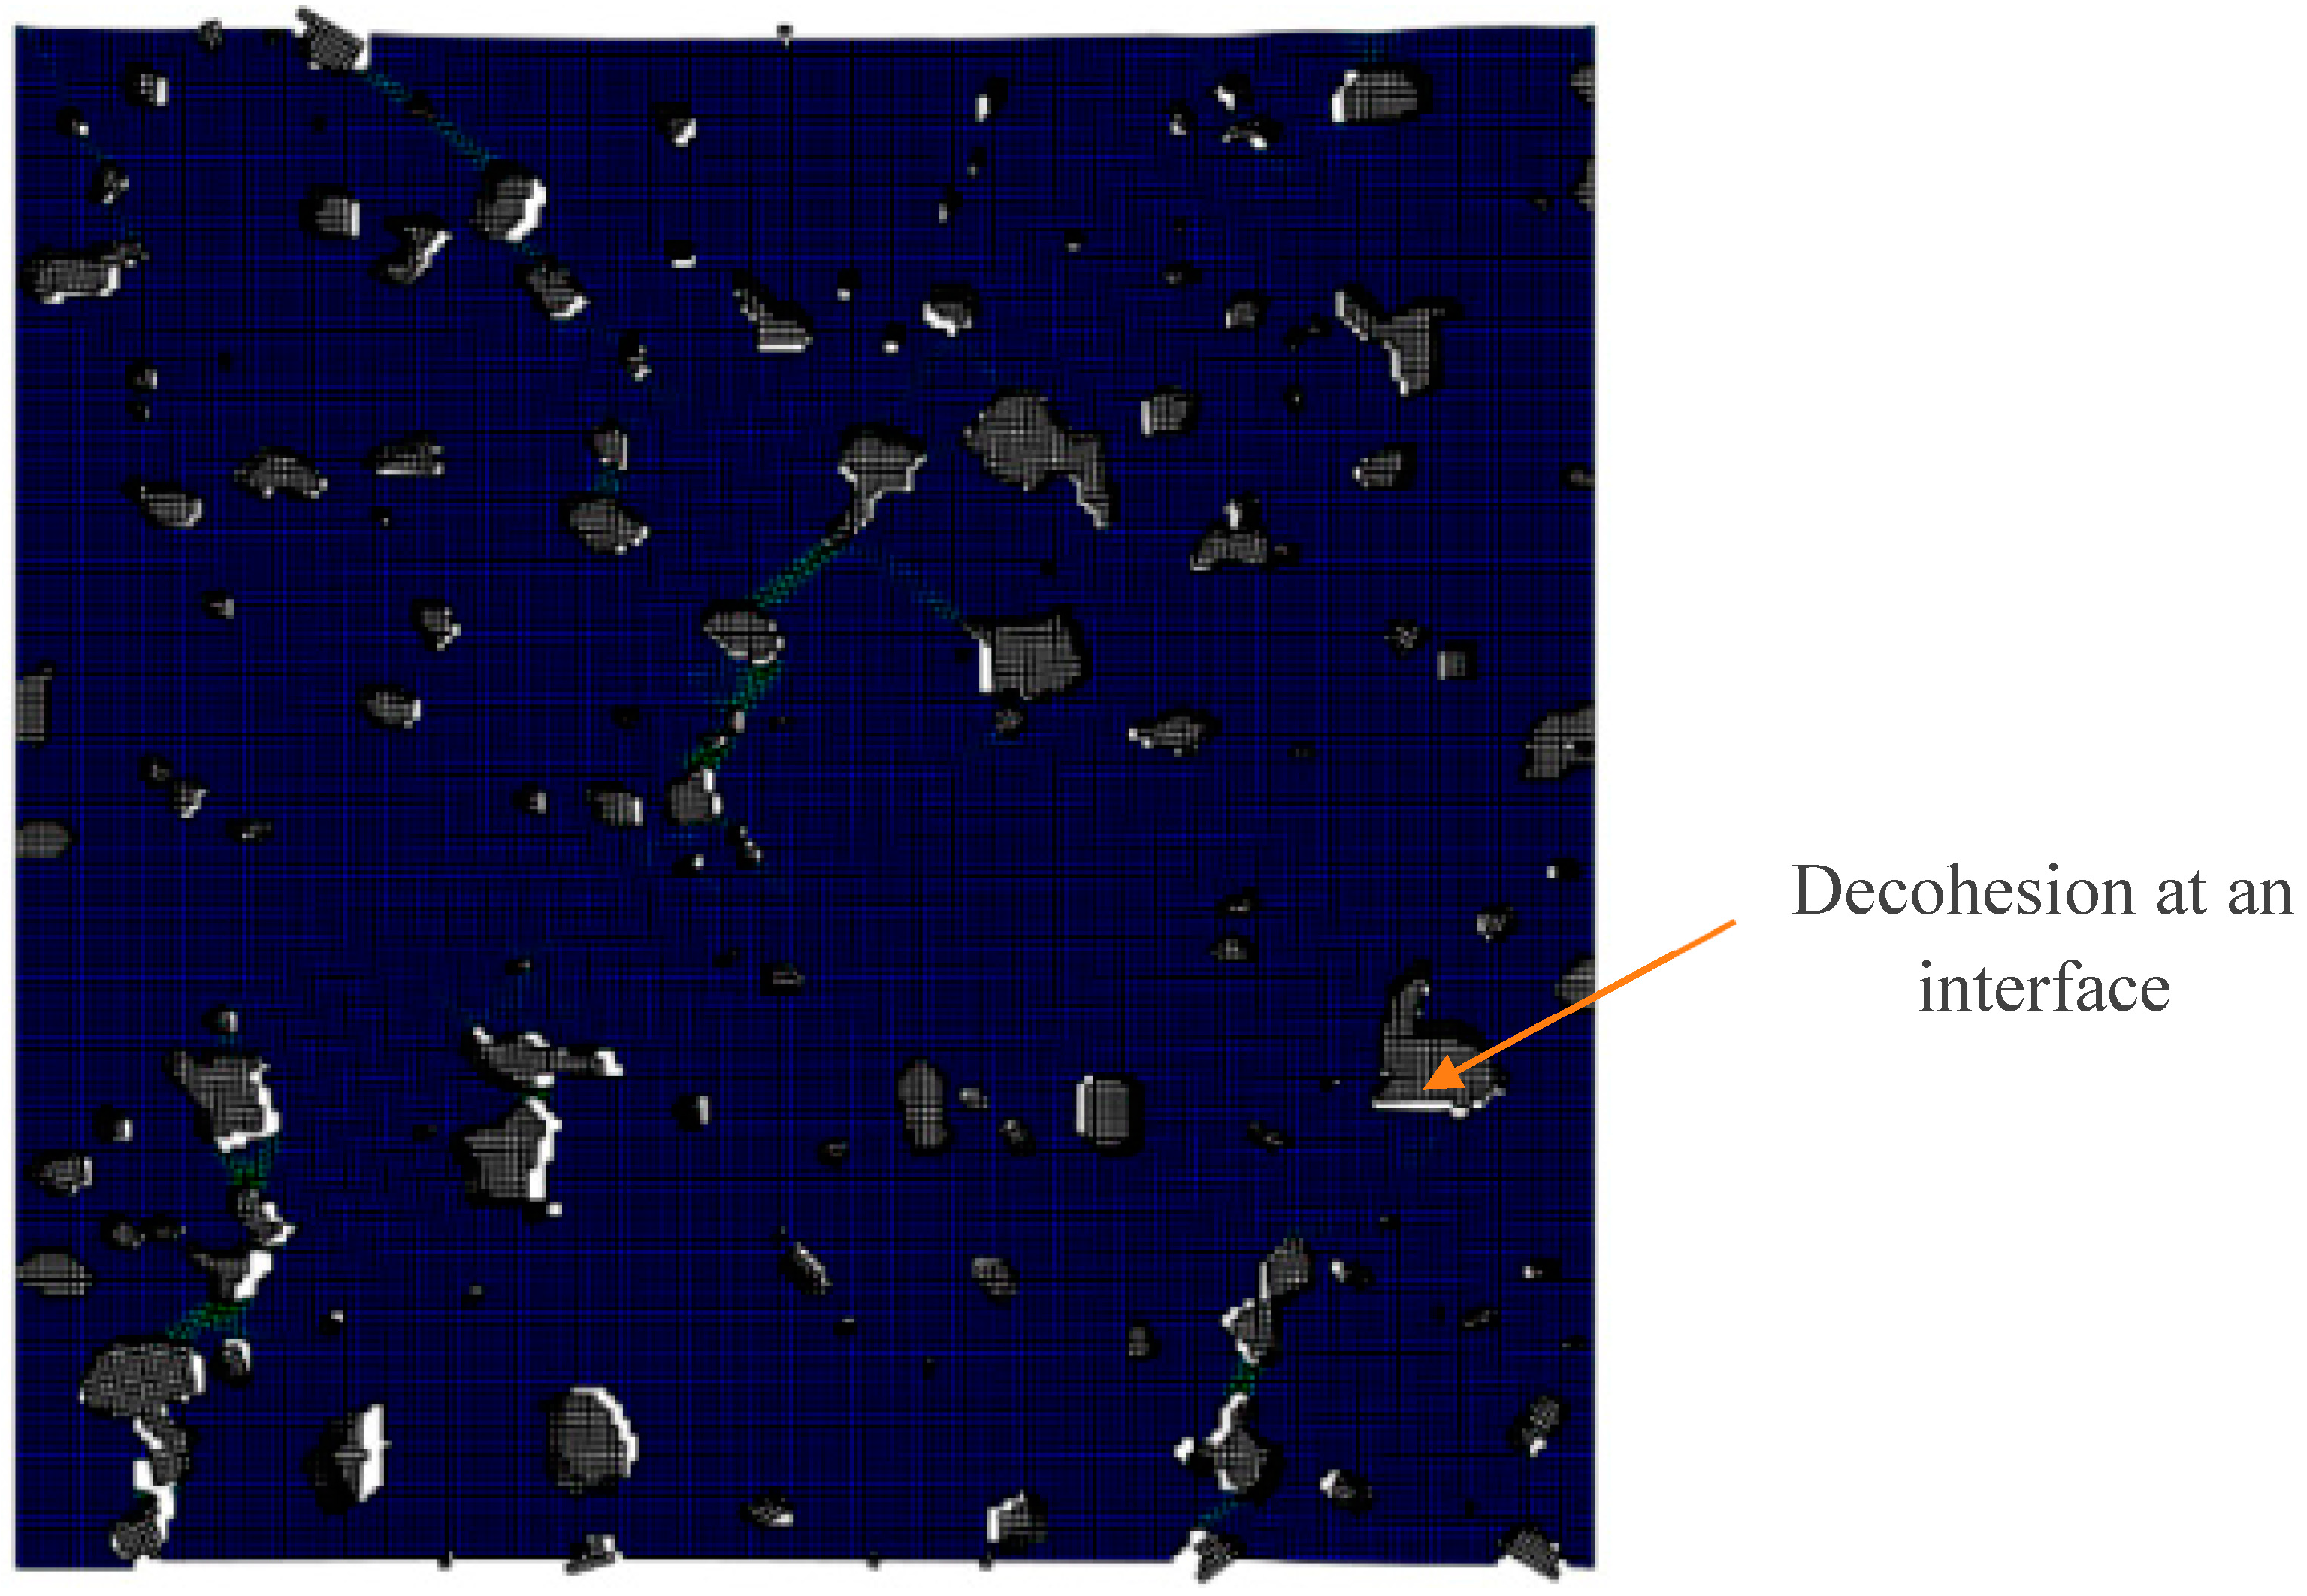
5. Response: Decohesion at the Interface between Matrix and Precipitates in the 2D RVE

The traction–separation relationship of the cohesive zone presented in [36,45,46] is shown in Figure 13. From the figure, the traction reaches a maximum value, and at this point, decohesion becomes triggered, or the so-called damage initiation occurs; however, separation does not occur. After the damage progresses, the stress gradually decreases until it reaches a value of zero. At this point, separation occurs. The cohesive response can be either linear or nonlinear, as shown in Figure 13a,b, respectively.
A unit cell that includes only one particle was generated, and it is shown in Figure 14a. The red color indicates the cohesive elements. Firstly, the elastic response of the cohesive elements at the interface is tested while the unit cell is subjected to an equibiaxial compressive loading condition. In this case, we are considering a significantly high value of stiffness for the cohesive elements. It should be noted that applying periodic boundary conditions (PBCs) is essential for RVEs [18]. PBCs can be applied after inserting the cohesive elements. However, it is important to note that the application of the PBC is not within the scope of the current study. We did not use it to reduce computational time because our sole focus was to test the effectiveness of the cohesive element insertion algorithm. Figure 14b displays a compressive response for the interface elements. The elastic response of the cohesive elements at the interface is tested by disabling the damage initiation and progression. Figure 14c illustrates the purely elastic response of the cohesive elements when the unit cell is subjected to equibiaxial tensile loading conditions. The elements that are cohesive (colored blue) expand at the interfaces. Then, the response of the cohesive elements, taking into account damage initiation and evolution, is examined. This is illustrated in Figure 14d. As illustrated in this figure, separation takes place around the particle at the interfaces, just like what happens in the experiments and what is demonstrated in Figure 1. This statement signifies the main result of the current paper and demonstrates that the code functions effectively in inserting cohesive elements at the interfaces. It is evident that when a unit cell, which contains only one particle, is subjected to external loading, it triggers and initiates damage to the cohesive elements, resulting in their deletion. Such a modeling approach can be used for any material where decohesion between the matrix and interfaces takes place, regardless of the type of loadings.
Decohesion at the interface occurs through the insertion of the cohesive elements, as depicted in Figure 14. The algorithm that has been developed inserts the cohesive elements at the interfaces in a 2D RVE generated by OOF2 when rectangular or cubical elements are utilized.
Using a subroutine to define appropriate material properties that differentiate between tensile and compressive properties at the cohesive elements may prevent them from penetrating one another. However, executing the ABAQUS file and obtaining suitable results are not the focus of this study. Our primary objective was solely to insert the cohesive elements at the interfaces.
To evaluate the effectiveness of the script in inserting cohesive elements, an RVE was used. The RVE consisted of multiple second-phase particles randomly distributed in the matrix materials, as illustrated in Figure 7. The RVE was subjected to uniaxial tensile loading, with the perimeter edges left unrestrained. The process of choosing material parameters for the cohesive elements has been previously explained in Section 2.3. However, when dealing with such a problem, the bonding at the interface was deliberately made weak, and the material properties for the scenario where a unit cell holds a single particle were employed for the 2D RVE. This was carried out by selecting cohesive elements with material properties that allowed for the separation of the interfaces in order to test whether the cohesive elements were correctly inserted at the interfaces. Figure 15 shows the deformed shape of the RVE, and it is evident that decohesion at interfaces takes place for various materials. The script provided in this article is effective.

6. Brief Discussion: Insertion of Cohesive Elements at the Interfaces between Matrix/Precipitates

The objective and aim of inserting cohesive elements in an RVE at the interfaces between the matrix and precipitates was mentioned and explained in the “background” section of this paper. Babout et al. [39] conducted an analysis on a fracture competition between particle cracking and decohesion at the interfaces of the matrix and particles. In this instance, Babout et al. [39] did not include cohesive elements at the interfaces. As a result, failure in elements that belonged to the matrix material next to the particles was regarded as decohesion. However, the properties of those materials were similar to those of the matrix material. On the contrary, elasticity is taken into account in the traction–separation law [36,45,46]. Therefore, it is crucial to include cohesive elements at the interfaces and ensure that the model closely resembles reality.
The 2D RVE is a more straightforward approach for analyzing the behavior of materials compared to the 3D RVE, particularly when there are constraints on computational time and cost. Running a 3D RVE requires a significant amount of time and computational effort. OOF2 is an online interface that allows users to create a 2D RVE based on a real microstructure image of the desired material. To create an RVE in ABAQUS using triangular elements, the size of each element must be extremely small. However, this requirement results in an increased number of elements and higher computational cost. Therefore, rectangular elements can be used efficiently to create an RVE that effectively displays the results, especially when there are limitations in computational resources and cost. Finally, the current MATLAB script can be utilized to insert cohesive elements at the interfaces in order to conveniently examine microscale fractures.

7. Summary

An algorithm for inserting the cohesive elements at the matrix/precipitate interfaces in 2D RVEs of metals was developed, and it has been proposed in this paper. The program that has been achieved is freely accessible via download. This code is useful for conducting research on the modeling of fractures in structures and materials. These features are not available in ABAQUS/CAE, but they are typically necessary for modeling mechanical properties at the micrometer length scale.
The algorithm for cohesive matrix/precipitate interface element generation is of general interest. First, the data for the element set are extracted from the RVE generated by OOF2 using the actual image of the material. Then, nodes and elements are reconstructed, and the algorithm serves as an example of detecting interfaces within the mesh. Finally, the interfaces are separated by the insertion of additional nodes, and the cohesive elements are created. The algorithm has been tested with respect to inserting cohesive elements at the interfaces between the matrix and a single particle in a unit cell and a 2D RVE containing several distributed particles, and the results indicate that the algorithm functions effectively. It is important to note that the code used to insert the cohesive elements and the proposed modeling approach are generally suitable for the fracture mode in which the ductile fracture is triggered by decohesion at the second-phase particles.
The software will be used in the future to understand the cohesive response of metals and the role they play in fractures.

Author Contributions

Conceptualization, M.S. and P.W.; methodology, M.S.; software, P.W.; validation, M.S., Z.X. and P.W.; formal analysis, M.S., Z.X. and P.W.; investigation, M.S., Z.X. and P.W.; resources, P.W.; data curation, M.S.; writing—original draft preparation, M.S.; writing—review and editing, M.S., Z.X. and P.W.; visualization, M.S., Z.X. and P.W.; supervision, P.W.; project administration, P.W.; funding acquisition, P.W. All authors have read and agreed to the published version of the manuscript.

Funding

M.S. and P.W. would like to acknowledge that this work was supported by the Natural Sciences and Engineering Research Council of Canada (NSERC, Project No: RGPIN-2016-06464) at McMaster University, Canada.

Data Availability Statement

The data presented in this study are available in article.

Conflicts of Interest

The authors declare no conflict of interest.

References

  1. Available online: https://github.com/mmshahzamanian/2D_Cohesive-element-insertion-into-a-2D_RVE- (accessed on 13 March 2022).
  2. Available online: https://github.com/mmshahzamanian/3D_Cohesive-element-insertion-into-a-2D_RVE (accessed on 13 March 2022).
  3. Shahzamanian, M.; Thomsen, C.; Partovi, A.; Xu, Z.; Wu, P. The effect of superimposed hydrostatic pressure on shear decohesion in round bar tensile specimens. Int. J. Fract. 2022, 233, 179–194. [Google Scholar] [CrossRef]
  4. Dipasquale, D.; Sarego, G.; Prapamonthon, P.; Yooyen, S.; Shojaei, A. A Stress Tensor-based Failure Criterion for Ordinary State-based Peridynamic Models. J. Appl. Comput. Mech. 2022, 8, 617–628. [Google Scholar]
  5. Shahzamanian, M.; Kainat, M.; Yoosef-Ghodsi, N.; Adeeb, S. Systematic literature review of the application of extended finite element method in failure prediction of pipelines. J. Pipeline Sci. Eng. 2021, 1, 241–251. [Google Scholar] [CrossRef]
  6. Vernerey, F.J.; Liu, W.K.; Moran, B.; Olson, G. A micromorphic model for the multiple scale failure of heterogeneous materials. J. Mech. Phys. Solids 2008, 56, 1320–1347. [Google Scholar] [CrossRef]
  7. Bindumadhavan, P.; Wah, H.K.; Prabhakar, O. Assessment of particle–matrix debonding in particulate metal matrix composites using ultrasonic velocity measurements. Mater. Sci. Eng. A 2002, 323, 42–51. [Google Scholar] [CrossRef]
  8. Tagliavia, G.; Porfiri, M.; Gupta, N. Analysis of hollow inclusion–matrix debonding in particulate composites. Int. J. Solids Struct. 2010, 47, 2164–2177. [Google Scholar] [CrossRef]
  9. He, C.; Liu, Y.; Dong, J.; Wang, Q.; Wagner, D.; Bathias, C. Fatigue crack initiation behaviors throughout friction stir welded joints in AA7075-T6 in ultrasonic fatigue. Int. J. Fatigue 2015, 81, 171–178. [Google Scholar] [CrossRef]
  10. Singh, S.S.; Guo, E.; Xie, H.; Chawla, N. Mechanical properties of intermetallic inclusions in Al 7075 alloys by micropillar compression. Intermetallics 2015, 62, 69–75. [Google Scholar] [CrossRef]
  11. Hill, R. Elastic properties of reinforced solids: Some theoretical principles. J. Mech. Phys. Solids 1963, 11, 357–372. [Google Scholar] [CrossRef]
  12. Hashin, Z.; Shtrikman, S. A variational approach to the theory of the elastic behaviour of multiphase materials. J. Mech. Phys. Solids 1963, 11, 127–140. [Google Scholar] [CrossRef]
  13. Willis, J.R. Variational and related methods for the overall properties of composites. In Advances in Applied Mechanics; Elsevier: Amsterdam, The Netherlands, 1981; pp. 1–78. [Google Scholar]
  14. Qing, H. 2D micromechanical analysis of SiC/Al metal matrix composites under tensile, shear and combined tensile/shear loads. Mater. Des. 2013, 51, 438–447. [Google Scholar] [CrossRef]
  15. Geers, M.G.; Kouznetsova, V.G.; Brekelmans, W. Multi-scale computational homogenization: Trends and challenges. J. Comput. Appl. Math. 2010, 234, 2175–2182. [Google Scholar] [CrossRef]
  16. Mohammadpour, E.; Awang, M.; Kakooei, S.; Akil, H.M. Modeling the tensile stress–strain response of carbon nanotube/polypropylene nanocomposites using nonlinear representative volume element. Mater. Des. 2014, 58, 36–42. [Google Scholar] [CrossRef]
  17. Chan, L.; Lu, X.; Yu, K. Multiscale approach with RSM for stress–strain behaviour prediction of micro-void-considered metal alloy. Mater. Des. 2015, 83, 129–137. [Google Scholar] [CrossRef]
  18. Shahzamanian, M.; Tadepalli, T.; Rajendran, A.; Hodo, W.D.; Mohan, R.; Valisetty, R.; Chung, P.; Ramsey, J. Representative volume element based modeling of cementitious materials. J. Eng. Mater. Technol. 2014, 136, 011007. [Google Scholar] [CrossRef]
  19. Nemet-Nasser, S.; Hori, M. Micromechanics: Overall Properties of Heterogeneous Materials; Elsevier: Amsterdam, The Netherlands, 1999. [Google Scholar]
  20. Sab, K. On the homogenization and the simulation of random materials. Eur. J. Mech. A Solids 1992, 11, 585–607. [Google Scholar]
  21. Shahzamanian, M.; Akhtar, S.; Arif, A.; Basirun, W.; Al-Athel, K.; Schneider, M.; Shakelly, N.; Hakeem, A.S.; Abubakar, A.A.; Wu, P. Thermo-mechanical properties prediction of Ni-reinforced Al2O3 composites using micro-mechanics based representative volume elements. Sci. Rep. 2022, 12, 11076. [Google Scholar] [CrossRef]
  22. Bahrami-Novin, N.; Mahdavi, E.; Shaban, M.; Mazaheri, H. Multi-objective optimization of tensile properties of the corrugated composite sheet. J. Compos. Mater. 2022, 56, 811–821. [Google Scholar] [CrossRef]
  23. Talaie, P.; Shaban, M.; Khoshlesan, S. Flexural analysis of second-order corrugated composite cores: Experimental, numerical, and theoretical studies. J. Strain Anal. Eng. Design 2023, 58, 03093247231152569. [Google Scholar] [CrossRef]
  24. Ramazani, A.; Schwedt, A.; Aretz, A.; Prahl, U.; Bleck, W. Characterization and modelling of failure initiation in DP steel. Comput. Mater. Sci. 2013, 75, 35–44. [Google Scholar] [CrossRef]
  25. Grilli, N.; Tarleton, E.; Cocks, A.C. Neper2CAE and PyCiGen: Scripts to generate polycrystals and interface elements in Abaqus. SoftwareX 2021, 13, 100651. [Google Scholar] [CrossRef]
  26. Bentz, D.P.; Bentz, D.P. CEMHYD3D: A Three-Dimensional Cement Hydration and Microstructure Development Modelling Package, 2nd ed.; US Department of Commerce, National Institute of Standards and Technology: Gaithersburg, MD, USA, 2000.
  27. Groeber, M.A.; Jackson, M.A. DREAM. 3D: A digital representation environment for the analysis of microstructure in 3D. Integr. Mater. Manuf. Innov. 2014, 3, 56–72. [Google Scholar] [CrossRef]
  28. Edrees, S.A.; Rafea, A.; Fathy, I.; Yahia, M. NEPER: A multiple strategy wheat expert system. Comput. Electron. Agric. 2003, 40, 27–43. [Google Scholar] [CrossRef]
  29. Reid, A.C.; Lua, R.C.; García, R.E.; Coffman, V.R.; Langer, S.A. Modelling microstructures with OOF2. Int. J. Mater. Prod. Technol. 2009, 35, 361–373. [Google Scholar] [CrossRef]
  30. Shahzamanian, M. Anisotropic Gurson-Tvergaard-Needleman plasticity and damage model for finite element analysis of elastic-plastic problems. Int. J. Numer. Methods Eng. 2018, 115, 1527–1551. [Google Scholar] [CrossRef]
  31. Shahzamanian, M.; Wu, P. Study of forming limit diagram (FLD) prediction of anisotropic sheet metals using Gurson model in MK method. Int. J. Mater. Form. 2021, 14, 1031–1041. [Google Scholar] [CrossRef]
  32. Babout, L.; Brechet, Y.; Maire, E.; Fougeres, R. On the competition between particle fracture and particle decohesion in metal matrix composites. Acta Mater. 2004, 52, 4517–4525. [Google Scholar] [CrossRef]
  33. Barenblatt, G.I. The mathematical theory of equilibrium cracks in brittle fracture. In Advances in Applied Mechanics; Elsevier: Amsterdam, The Netherlands, 1962; pp. 55–129. [Google Scholar]
  34. Avramovic-Cingara, G.; Ososkov, Y.; Jain, M.; Wilkinson, D. Effect of martensite distribution on damage behaviour in DP600 dual phase steels. Mater. Sci. Eng. A 2009, 516, 7–16. [Google Scholar] [CrossRef]
  35. Zhao, D.; Tuler, F.; Lloyd, D. Fracture at elevated temperatures in a particle reinforced composite. Acta Metall. Mater. 1994, 42, 2525–2533. [Google Scholar] [CrossRef]
  36. Charles, Y.; Estevez, R.; Bréchet, Y.; Maire, E. Modelling the competition between interface debonding and particle fracture using a plastic strain dependent cohesive zone. Eng. Fract. Mech. 2010, 77, 705–718. [Google Scholar] [CrossRef]
  37. Babout, L.; Maire, E.; Buffière, J.-Y.; Fougeres, R. Characterization by X-ray computed tomography of decohesion, porosity growth and coalescence in model metal matrix composites. Acta Mater. 2001, 49, 2055–2063. [Google Scholar] [CrossRef]
  38. Pathak, S.; Kalidindi, S.R. Spherical nanoindentation stress–strain curves. Mater. Sci. Eng. R Rep. 2015, 91, 1–36. [Google Scholar] [CrossRef]
  39. Babout, L.; Maire, E.; Fougeres, R. Damage initiation in model metallic materials: X-ray tomography and modelling. Acta Mater. 2004, 52, 2475–2487. [Google Scholar] [CrossRef]
  40. Available online: https://www.ctcms.nist.gov/oof/oof2/ (accessed on 13 March 2022).
  41. Abdelaty, I. Elevated Temperature Deformation and Forming Behaviour of AA7075 Aluminum Sheet Material. Ph.D. Thesis, McMaster University, Hamilton, ON, Canada, 2019. [Google Scholar]
  42. Hu, X.; Jain, M.; Wilkinson, D.; Mishra, R. Microstructure-based finite element analysis of strain localization behavior in AA5754 aluminum sheet. Acta Mater. 2008, 56, 3187–3201. [Google Scholar] [CrossRef]
  43. Nguyen, V.P. An open source program to generate zero-thickness cohesive interface elements. Adv. Eng. Softw. 2014, 74, 27–39. [Google Scholar] [CrossRef]
  44. Truster, T.J. DEIP, discontinuous element insertion Program—Mesh generation for interfacial finite element modeling. SoftwareX 2018, 7, 162–170. [Google Scholar] [CrossRef]
  45. Tan, H.; Liu, C.; Huang, Y.; Geubelle, P. The cohesive law for the particle/matrix interfaces in high explosives. J. Mech. Phys. Solids 2005, 53, 1892–1917. [Google Scholar] [CrossRef]
  46. Needleman, A. A continuum model for void nucleation by inclusion debonding. J. Appl. Mech. 1987, 54, 525–531. [Google Scholar] [CrossRef]
Figure 1. Debonding occurs at the interface between the matrix and particle in the AA7075-T6 alloy. The formation of microcracks is caused by the separation between the Mg2Si particle and the matrix in AA7075-T6 [9].
Applsci 13 12281 g001
Figure 2. Characteristics of the AA7075-T73 alloy: (a) SEM image of inclusions in the AA7075-T73 alloy; (b) stress–strain curves comparing inclusions and the matrix [10].
Applsci 13 12281 g002
Figure 3. Stages of a ductile fracture of a high-strength steel [6]. The black dots and black squares resemble the fine and large particles of the second phase, which are randomly distributed within the matrix material.
Applsci 13 12281 g003
Figure 4. The results of a uniaxial tension test using a microstructure-based FE model: (a) identification of strain localization and damage; (b) comparison between experimental and simulated stress–strain curves [24]. The amount of damage was determined in the areas indicated by the red circles.
Applsci 13 12281 g004
Figure 5. (ad) Decohesion and particle breakdown lead to coalescence and eventually result in a ductile fracture in a typical material [32].
Applsci 13 12281 g005
Figure 6. Unit cell simulated to predict the particle cracking and matrix/particle decohesion using the method described by Babout et al. [39]. Black arrows show the applied loads.
Applsci 13 12281 g006
Figure 7. Typical results achieved by utilizing OOF2 for creating an RVE in ABAQUS: (a) an actual microstructure image [41]; (b) the generated RVE within ABAQUS.
Applsci 13 12281 g007
Figure 8. Procedure of creating the RVE in OOF2.
Applsci 13 12281 g008
Figure 9. Inserted cohesive elements between matrix and precipitate; the cohesive elements are in red.
Applsci 13 12281 g009
Figure 10. Procedure of inserting cohesive elements at the matrix/precipitate interfaces.
Applsci 13 12281 g010
Figure 13. (a) Linear and (b) nonlinear traction–separation for the cohesive zone [36,45].
Applsci 13 12281 g013
Figure 14. (a) Unit cell including only one particle; (b) elastic response of the cohesive interface when damage is switched off; (c) cohesive response at the interface following traction–separation law. (d) The cohesive elements at the interface deleted due to damage.
Applsci 13 12281 g014
Figure 15. The decohesion at the interfaces in a deformed shape of an RVE containing multiple second-phase particles randomly distributed within the matrix material.
Applsci 13 12281 g015
Table 1. Code metadata for 2D_Cohesive element insertion into a 2D RVE [1].
Permanent link to codehttps://github.com/mmshahzamanian/2D_Cohesive-element-insertion-into-a-2D_RVE-
Access date 13 March 2022
Software code languagesMATLAB
Compilation requirementsMATLAB R2018a
Link to developer documentationhttps://github.com/mmshahzamanian/2D_Cohesive-element-insertion-into-a-2D_RVE-
Support email for questions[email protected]
Table 2. Code metadata for 3D_Cohesive element insertion into a 2D RVE [2].
Permanent link to codehttps://github.com/mmshahzamanian/3D_Cohesive-element-insertion-into-a-2D_RVE
Access date 13 March 2022
Software code languagesMATLAB
Compilation requirementsMATLAB R2018a
Link to developer documentationhttps://github.com/mmshahzamanian/3D_Cohesive-element-insertion-into-a-2D_RVE
Support email for questions[email protected]
Disclaimer/Publisher’s Note: The statements, opinions and data contained in all publications are solely those of the individual author(s) and contributor(s) and not of MDPI and/or the editor(s). MDPI and/or the editor(s) disclaim responsibility for any injury to people or property resulting from any ideas, methods, instructions or products referred to in the content.

