Abstract
In order to explore the creep characteristics of red clay under different pressures, the stress–strain curve and stress–strain–time curve of red clay under different pressures were obtained, and the triaxial shear and creep characteristics of red clay under different pressures were analysed. A triaxial shear test and creep test were carried out on red clay from Guilin as the research object under different pressures. The results show that: ➀ the cohesion and the angle of internal friction of red clay from Guilin, obtained from a triaxial shear test, are 57.20 kPa and 22.47°, respectively; ➁ according to the physical meaning of the parameters of the Burgers creep model, a simple and practical parameter inversion method is proposed, which can be used to obtain the parameters of the Burgers model for red clay under different perimeter pressures and differing deviatoric stress; and ➂ when comparing the calculation results with the test results, the correlation coefficients R2 of the two are above 0.9, with a good fitting effect, so the model can accurately describe the creep characteristics of red clay from Guilin. This study can provide a theoretical basis and technical support for engineering construction in the red clay area of Guilin.
1. Introduction
Red clay is a regional special soil, rich in iron and aluminium oxides, formed by carbonate rocks under the action of moisture, heat, and laterization, and its appearance is red. Red clay is widely distributed in China, with an area of 1.08 million square kilometres, and is mainly concentrated in the Guangxi, Hunan, Yunnan, and Guizhou provinces. The different formation environments and processes, as well as special mineral compositions, lead to a great difference from other clays in terms of physical, mechanical and hydrophysical properties. Red clay is mainly characterised by a high shear strength, large pore ratio, and low compressibility.
Guilin is located in the north of Guangxi, and red clay is widely distributed in its territory. Infrastructure construction in Guilin is in full swing; however, a series of engineering safety problems, brought about by infrastructure construction, need to be solved urgently. These include the destruction and instability of red clay artificial slopes under the action of an external load for a long period of time, the slow vertical displacement of foundations and roadbeds, the deformation and destabilisation of earth and stone dams, and the collapse of cavernous fissures, as well as other engineering problems. These problems affect the normal use of infrastructure and even threaten people’s lives and the safety of their properties, restricting economic construction and social development of the region [1,2]. At the same time, these engineering problems have time-cumulative effects; creep damage occurs in the soil body under the external effects of long-term additional loads, dry and wet cycles, freezing and thawing, and loading and unloading. Therefore, it is necessary to study the creep characteristics of red clay soils in Guilin and then provide a theoretical basis and technical support for foundation settlement prediction and disaster prevention and control in red clay areas.
Regarding the creep properties of soils, many scholars have carried out a series of experimental studies, from one-dimensional consolidation creep tests to triaxial creep tests with controlled perimeter pressures. Yuan et al. [3] carried out one-dimensional compression consolidation tests on alkali residue and obtained the strain–time–creep curves of alkali residue at different depths under different consolidation pressures. Chang et al. [4] used a one-dimensional consolidation creep test to study the creep characteristics of sand and fine mixed soil in front of a warping dam on the Loess Plateau of central Ningxia and established an empirical creep model. Ruan et al. [5] conducted consolidation creep tests on in situ peaty soils, obtained with separately loaded creep curves, and established a semi-empirical and semi-theoretical consolidation creep model to analyse creep properties. Zhou et al. [6] used a straight shear creep test to study the creep properties of slip zone soil. Yang et al. [7] carried out creep tests under different perimeter pressures on cured blow–fill mud-consolidated soil and established a prediction formula that reflected the creep characteristics of mud-consolidated soil. Li et al. [8] conducted a triaxial unloading creep test on expanded soil and proposed a nonlinear four-element creep model, which described the evolution of the axial strain of expanded soil over time, under triaxial compressive stress and under equal circumferential pressure, by comparing the experimental results with the simulation results. Li et al. [9] conducted a triaxial unloading creep test on artificially frozen soil and described its creep characteristics. Cong et al. [10] conducted triaxial compression creep experiments on expanded soil under a freeze–thaw cycle and established a prediction formula that reflected the creep characteristics of mud-cured soil, and the test structure matched well with the model calculation results. Guan et al. [11] carried out a graded loading creep test on open pit mine slip zone soil and established a fractional order damage creep model based on fractional order calculus and damage mechanics theory. Xue et al. [12] obtained the shear strength of red clay using triaxial consolidation and a drainage shear test and obtained the strain–time curve using a creep test on red clay under graded loading, establishing a creep model of red clay based on the Burgers model. Gao et al. [13] studied the creep behaviour of IMT (interactive marine-terrestrial) sedimentary soil in Ningbo using a triaxial drainage creep test and then established a triaxial creep model describing the IMT sedimentary soil by applying fractal order theory. Zhang et al. [14] used the slip zone soil of a landslide near the Jinping hydropower station as their research object and carried out an indoor triaxial creep test to describe the creep behaviour of IMT sedimentary soil, establishing the Burgers creep model. Shahbodagh et al. [15] proposed a viscoplastic model to describe the creep properties of soils and compared the simulation results with experimental data, which met the conditions for application. Xiang et al. [16] introduced the Almeida fractional derivative into the classical elastic–viscoelastic model and established a new soft soil model. In order to establish a new soft soil fractional order creep model, the model calculation results and the experimental results needed to have good consistency between them and, compared with the traditional model, the model had higher accuracy and convenience. Focusing on the creep characteristics of red clay, Li et al. [17] studied the effect of densification on the creep characteristics of red clay in the Changsha area. Sun et al. [18] carried out triaxial creep tests under suction control conditions to study the creep characteristics and long-term strength of unsaturated red clay in the Shaanxi region. Yang et al. [19] conducted an unconsolidated and undrained creep test of sludge-solidified soil under a freeze–thaw cycle and established a creep model of sludge-solidified soil and a long-term strength prediction formula, which considered the effect of a freeze–thaw cycle. Wang et al. [20] studied the creep properties of soil in the sliding zone of a loess landslide under different moisture contents, analysed the influence of moisture contents on the creep properties of loess, and obtained the long-term strength of the loess using the isochronal curve method. Wang et al. [21] established a hyperbolic creep prediction model using a self-made coarse-grained soil filler unit model test system to carry out a series of two-dimensional creep tests. For the mechanical properties of red clay in the Guilin region, Zeng et al. [22] investigated the effect of water content on the shear strength of red clay and determined and classified the content and type of adsorbed bound water in red clay, which elucidated the microscopic mechanism by which bound water affects the strength properties of red clay. Li et al. [23] studied the shear strength and compressibility of red clay in different concentrations of a (NH4)2CO3 solution. In summary, scientists at home and abroad have studied one-dimensional and three-dimensional creep tests of soil and established creep models. The test methods and expressions adopted by scholars at home and abroad are different, but there are three problems in the above research results: (1) The research on the mechanical properties of Guilin red clay soil has achieved certain results mainly based on some conventional tests such as direct shear test. (2) At present, the test results of soil creep are mainly concentrated on slip zone soil, sandy soil, soft soil, and other fields, and the research on Guilin red clay is extremely rare, especially for the deformation and strength change in Guilin red clay sites during long-term operation. (3) The parameter identification of the constructed model is complex and difficult to understand. To address the above problems, the triaxial creep test of Guilin red clay under consolidated and undrained conditions is carried out in this paper to explore the long-term deformation law of red clay and construct a prediction formula that can reflect the creep characteristics of red clay.
At present, most of the red clay area in Guilin has become the core of urban development, and many projects are built on sites where red clay is distributed. The presence of red clay has seriously affected the safety and stability of the structures built on it, so it is particularly important to study its creep characteristics in-depth. However, there are relatively few studies on the creep characteristics of red clay under different confining pressures using the Burgers creep constitutive model. Therefore, in this paper, triaxial creep tests are conducted on red clay in the Guilin area, and the influence of the deviatoric stress level and confining pressure on the creep characteristics of red clay is mainly analysed. According to the physical meaning of the parameters in the Burgers model, a simple and practical parameter inversion method is proposed to obtain the parameters of the Burgers model suitable for red clay under different confining pressures and deviatoric stresses. The obtained fitting data are compared with the experimental data, which verified the effectiveness of the inversion method. This study can provide a basis for the reasonable selection of calculation parameters of foundation consolidation settlement and be used in engineering practice to provide guidance for the prevention and control of creep disasters of buildings built on red clay sites and preventive measures.
2. Materials and Methods
2.1. Soil and Equipment for Test
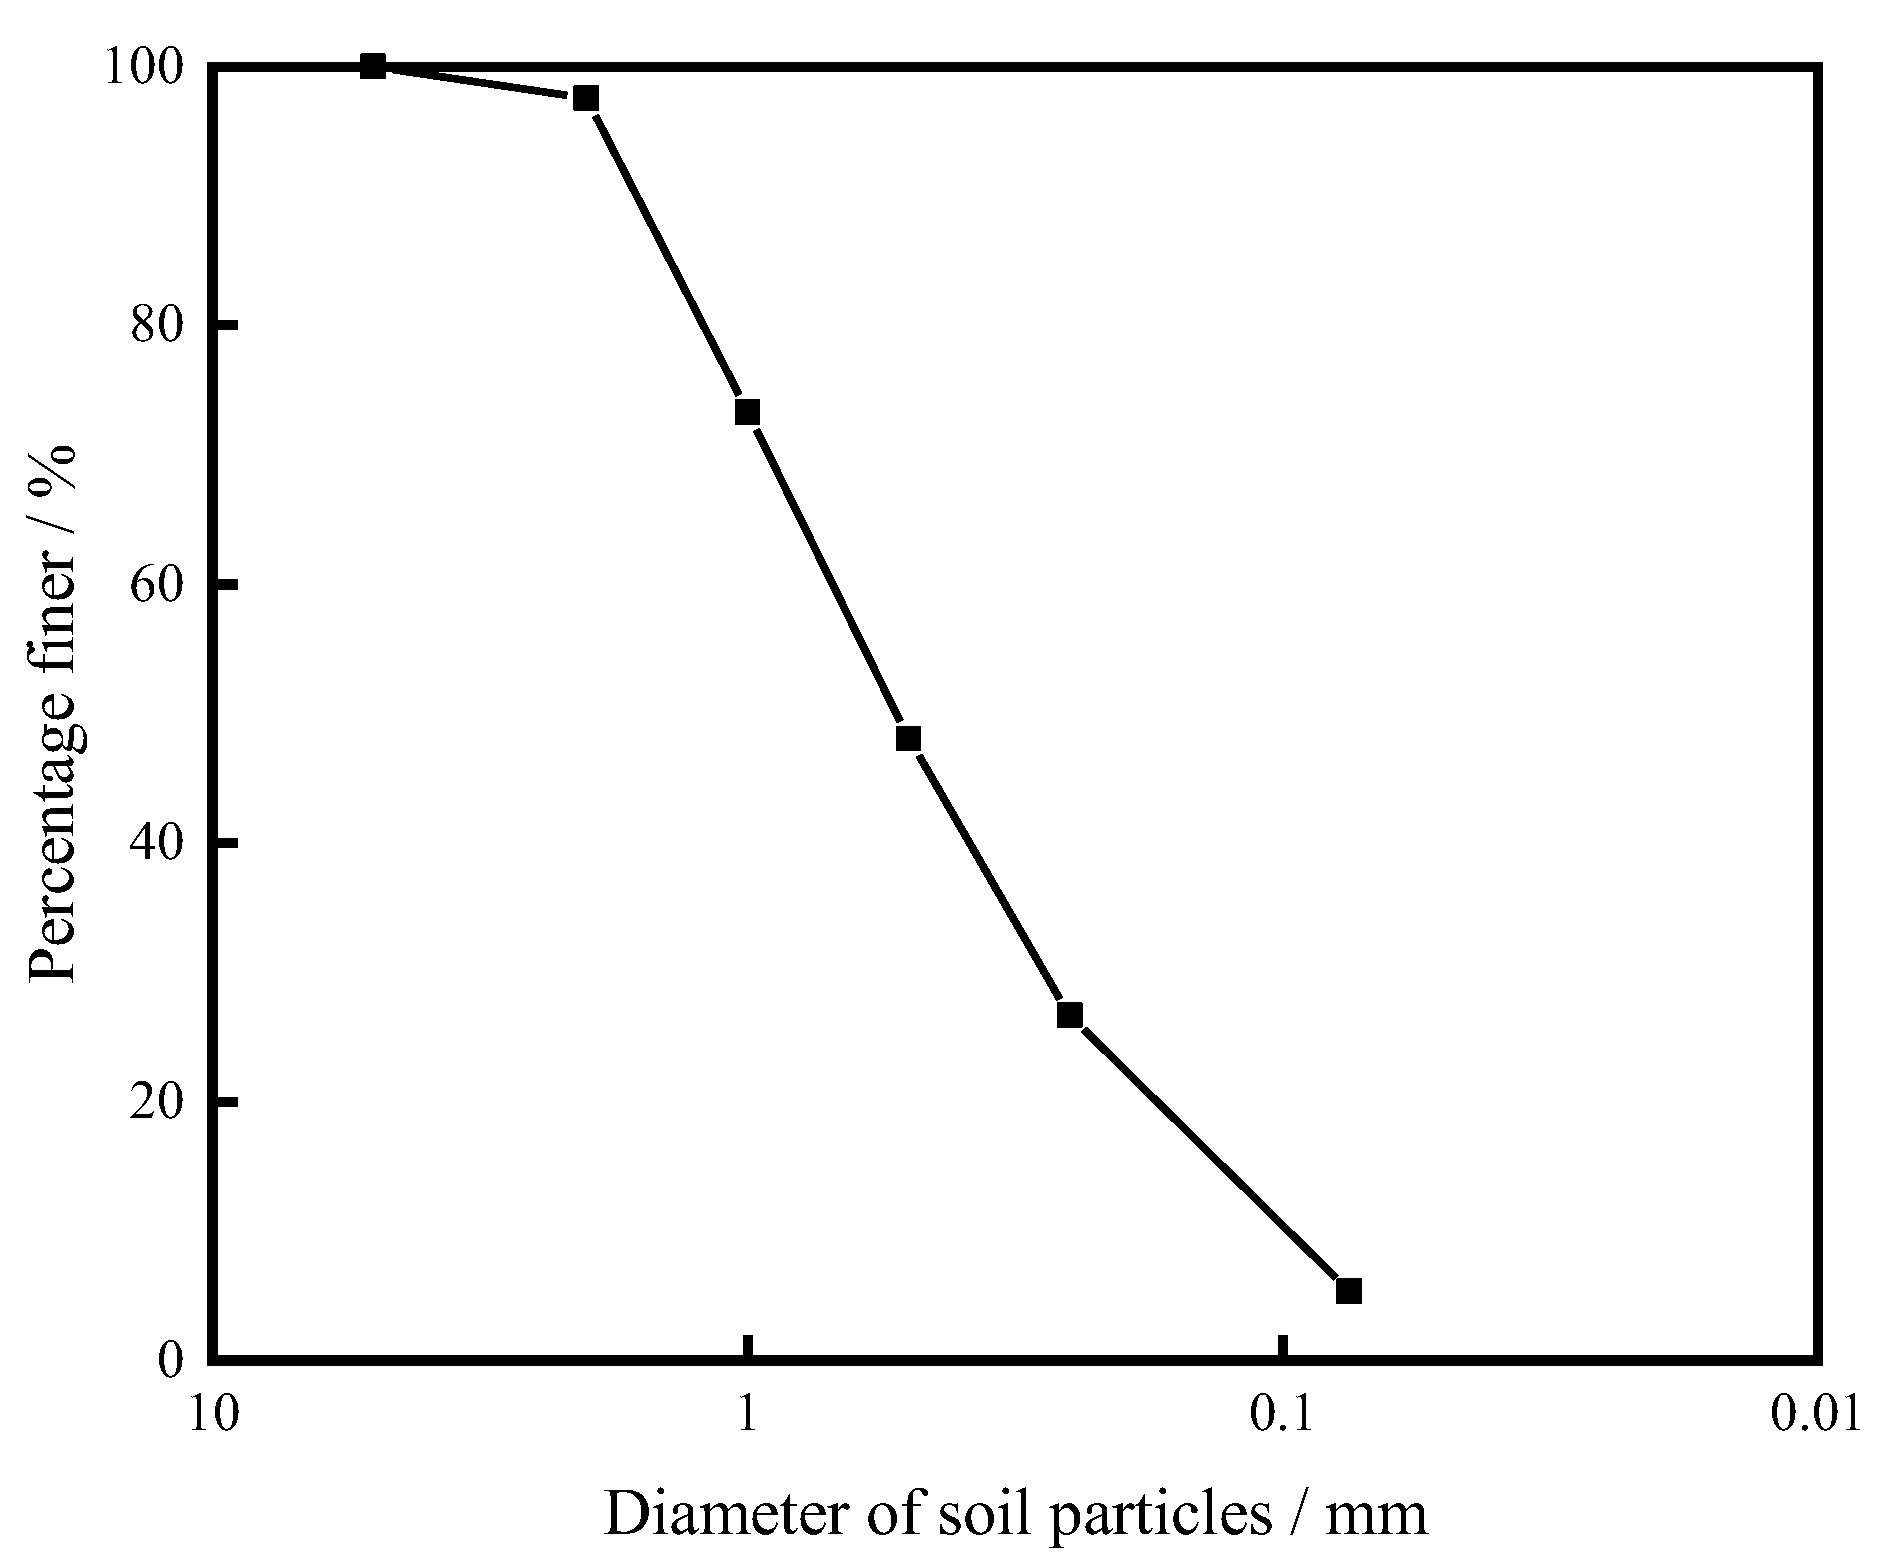
Test soil samples were collected from a pit site in downtown Guilin. The red clay was excavated, air-dried, and then crushed to remove impurities and passed through a 2 mm sieve. According to the “Standard of Geotechnical Test Methods (GB/T50123-2019)”, the relevant physical and mechanical parameters of the soil samples were tested, as shown in Table 1. The particle size distribution curve of the red clay used in the test is shown in Figure 1.

Table 1.
Basic physical properties of red clay.

Figure 1.
Grain size distribution curve of red clay.
According to the “Standard for geotechnical testing method (GB/T50123-2019)”, the triaxial sample was prepared: the diameter of the sample was 39.1 mm and the height was 80 mm. The sieved red clay was stirred with water to the target moisture content, sealed in a plastic bag, placed in a humidified cylinder for 24 h, and then re-tested. The error of moisture content was within ±1%. To calculate the mass of soil required for a single sample, we weighed the corresponding mass of red clay for layered compacted samples, placed it in a vacuum cylinder for pumping and saturation, and then loaded the sample into the testing equipment.
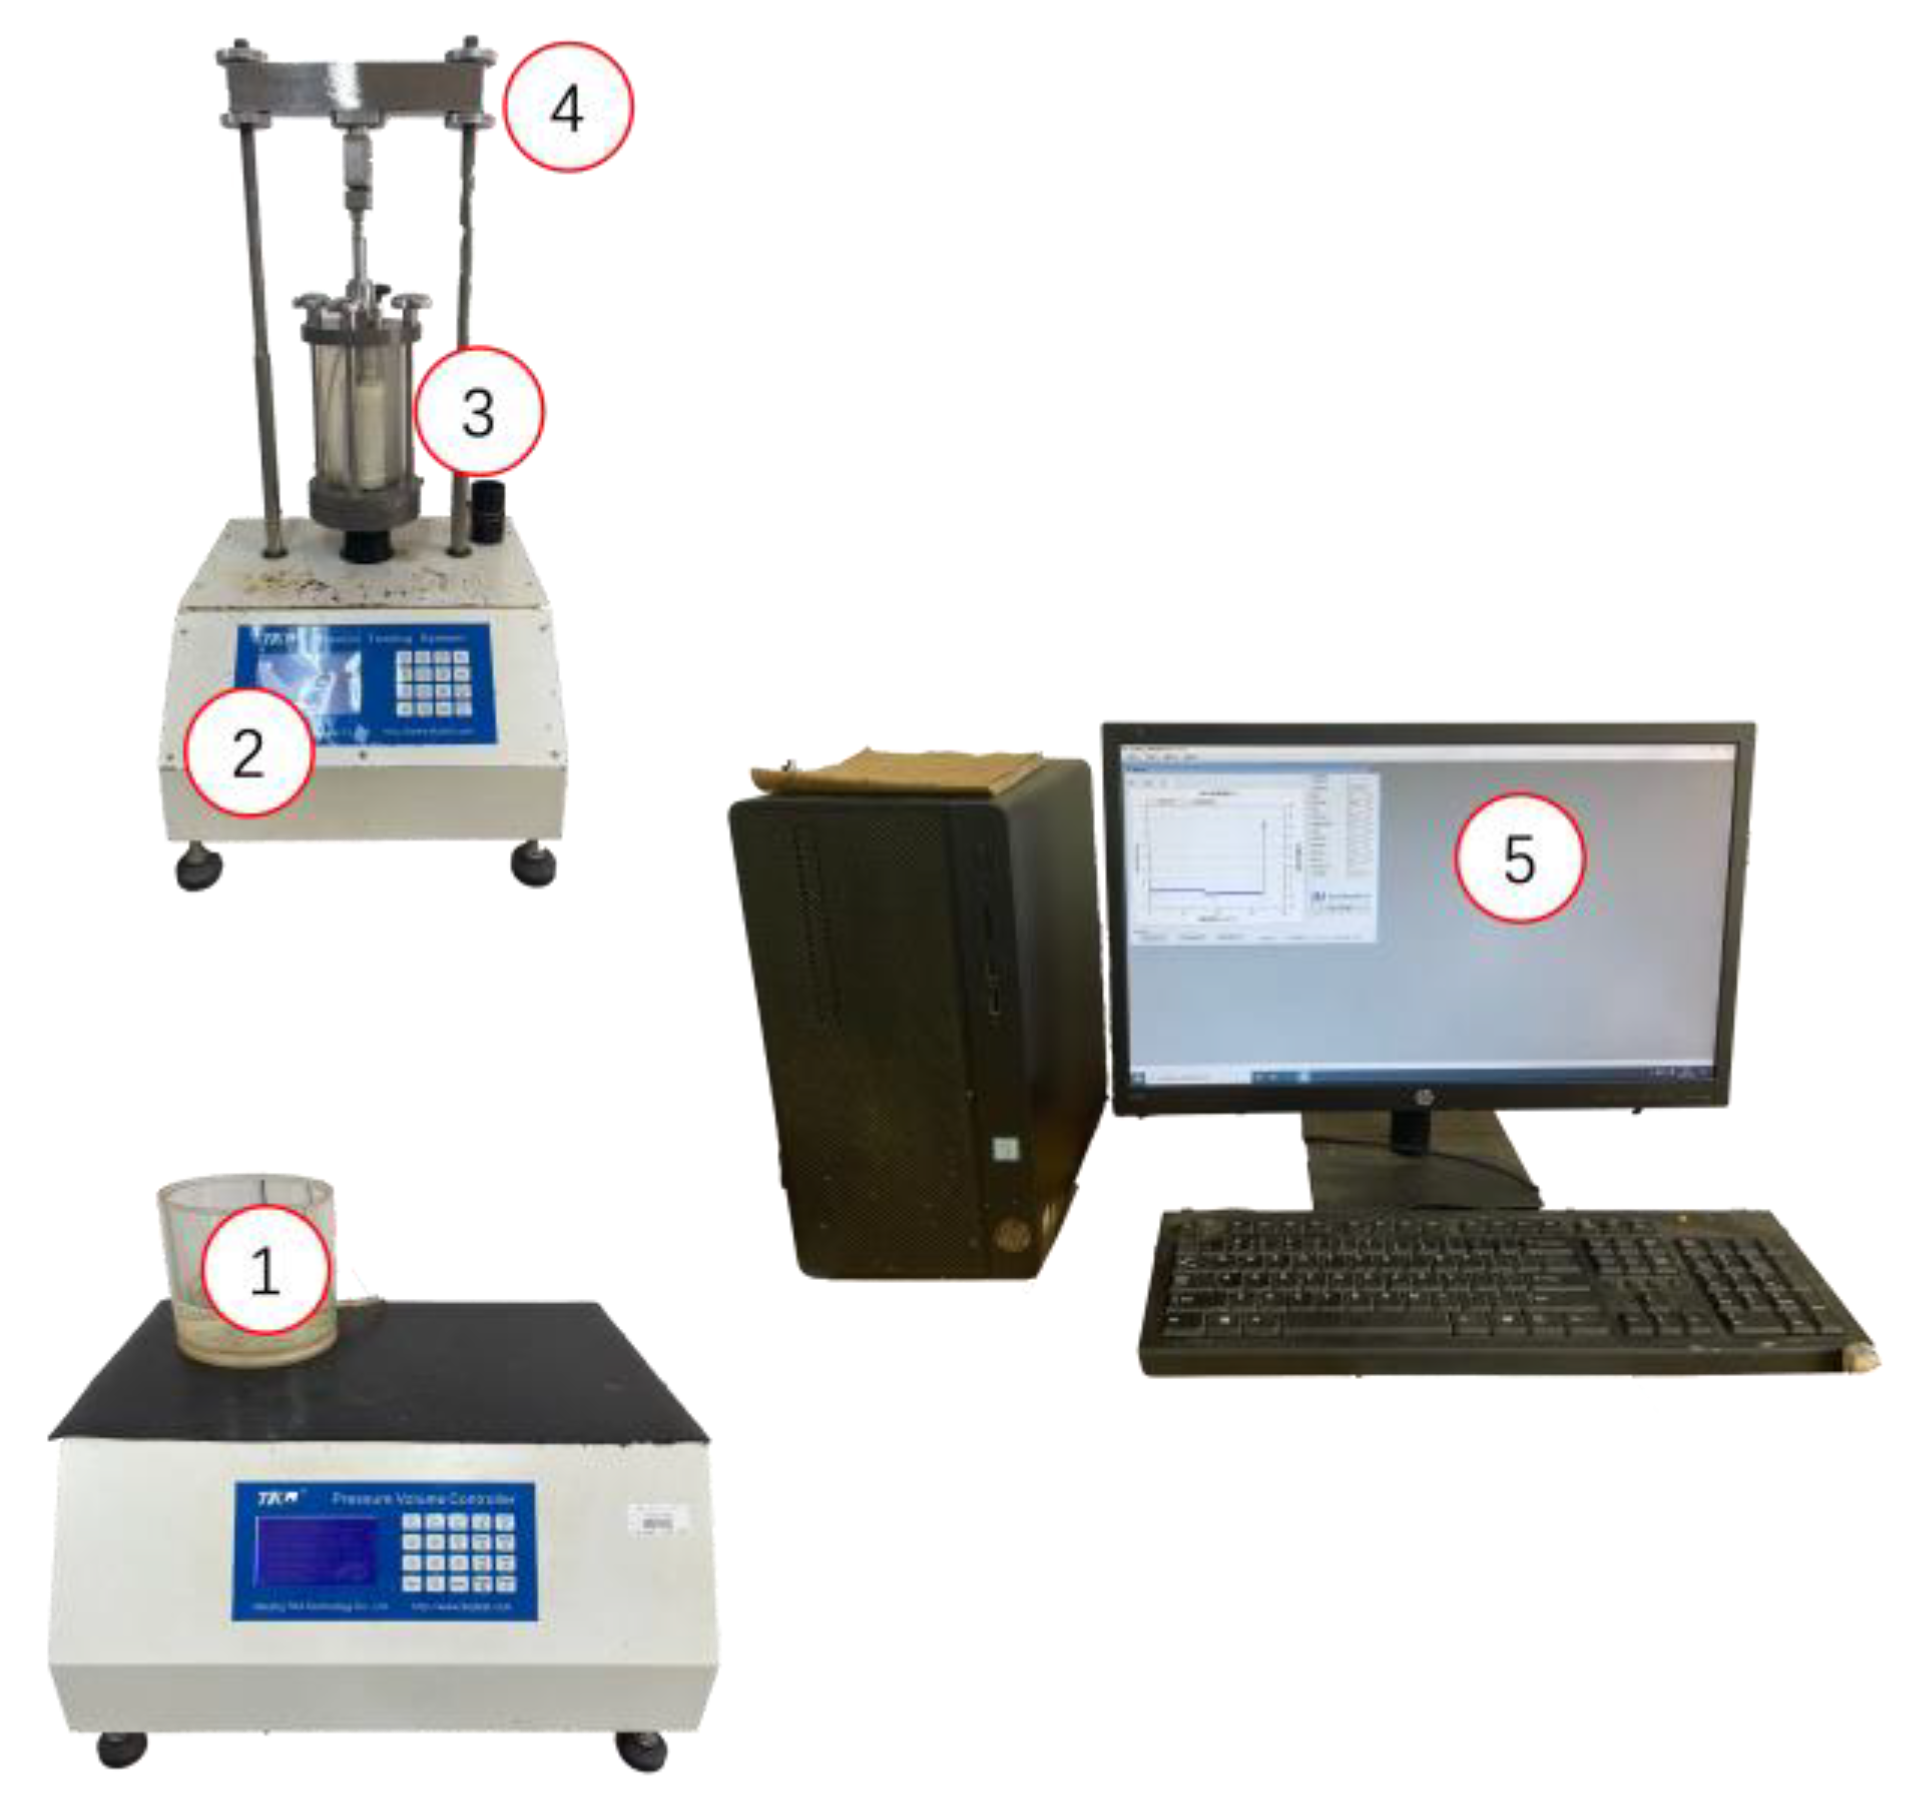
The test equipment adopts a fully automatic triaxial instrument (Figure 2) to perform the triaxial creep test. The fully automatic triaxial instrument mainly consists of the pressure chamber, cell pressure and back pressure controller, axial pressure controller, data collector, and computer control system.
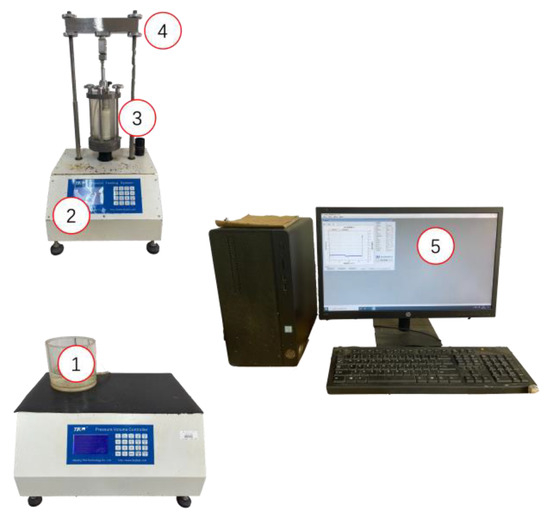
Figure 2.
Triaxial test equipment: 1, cell pressure and back pressure controller; 2, axial pressure controller; 3, pressure chamber; 4, data collector; and 5, computer control systems.
2.2. Triaxial Shear Test Method and Results
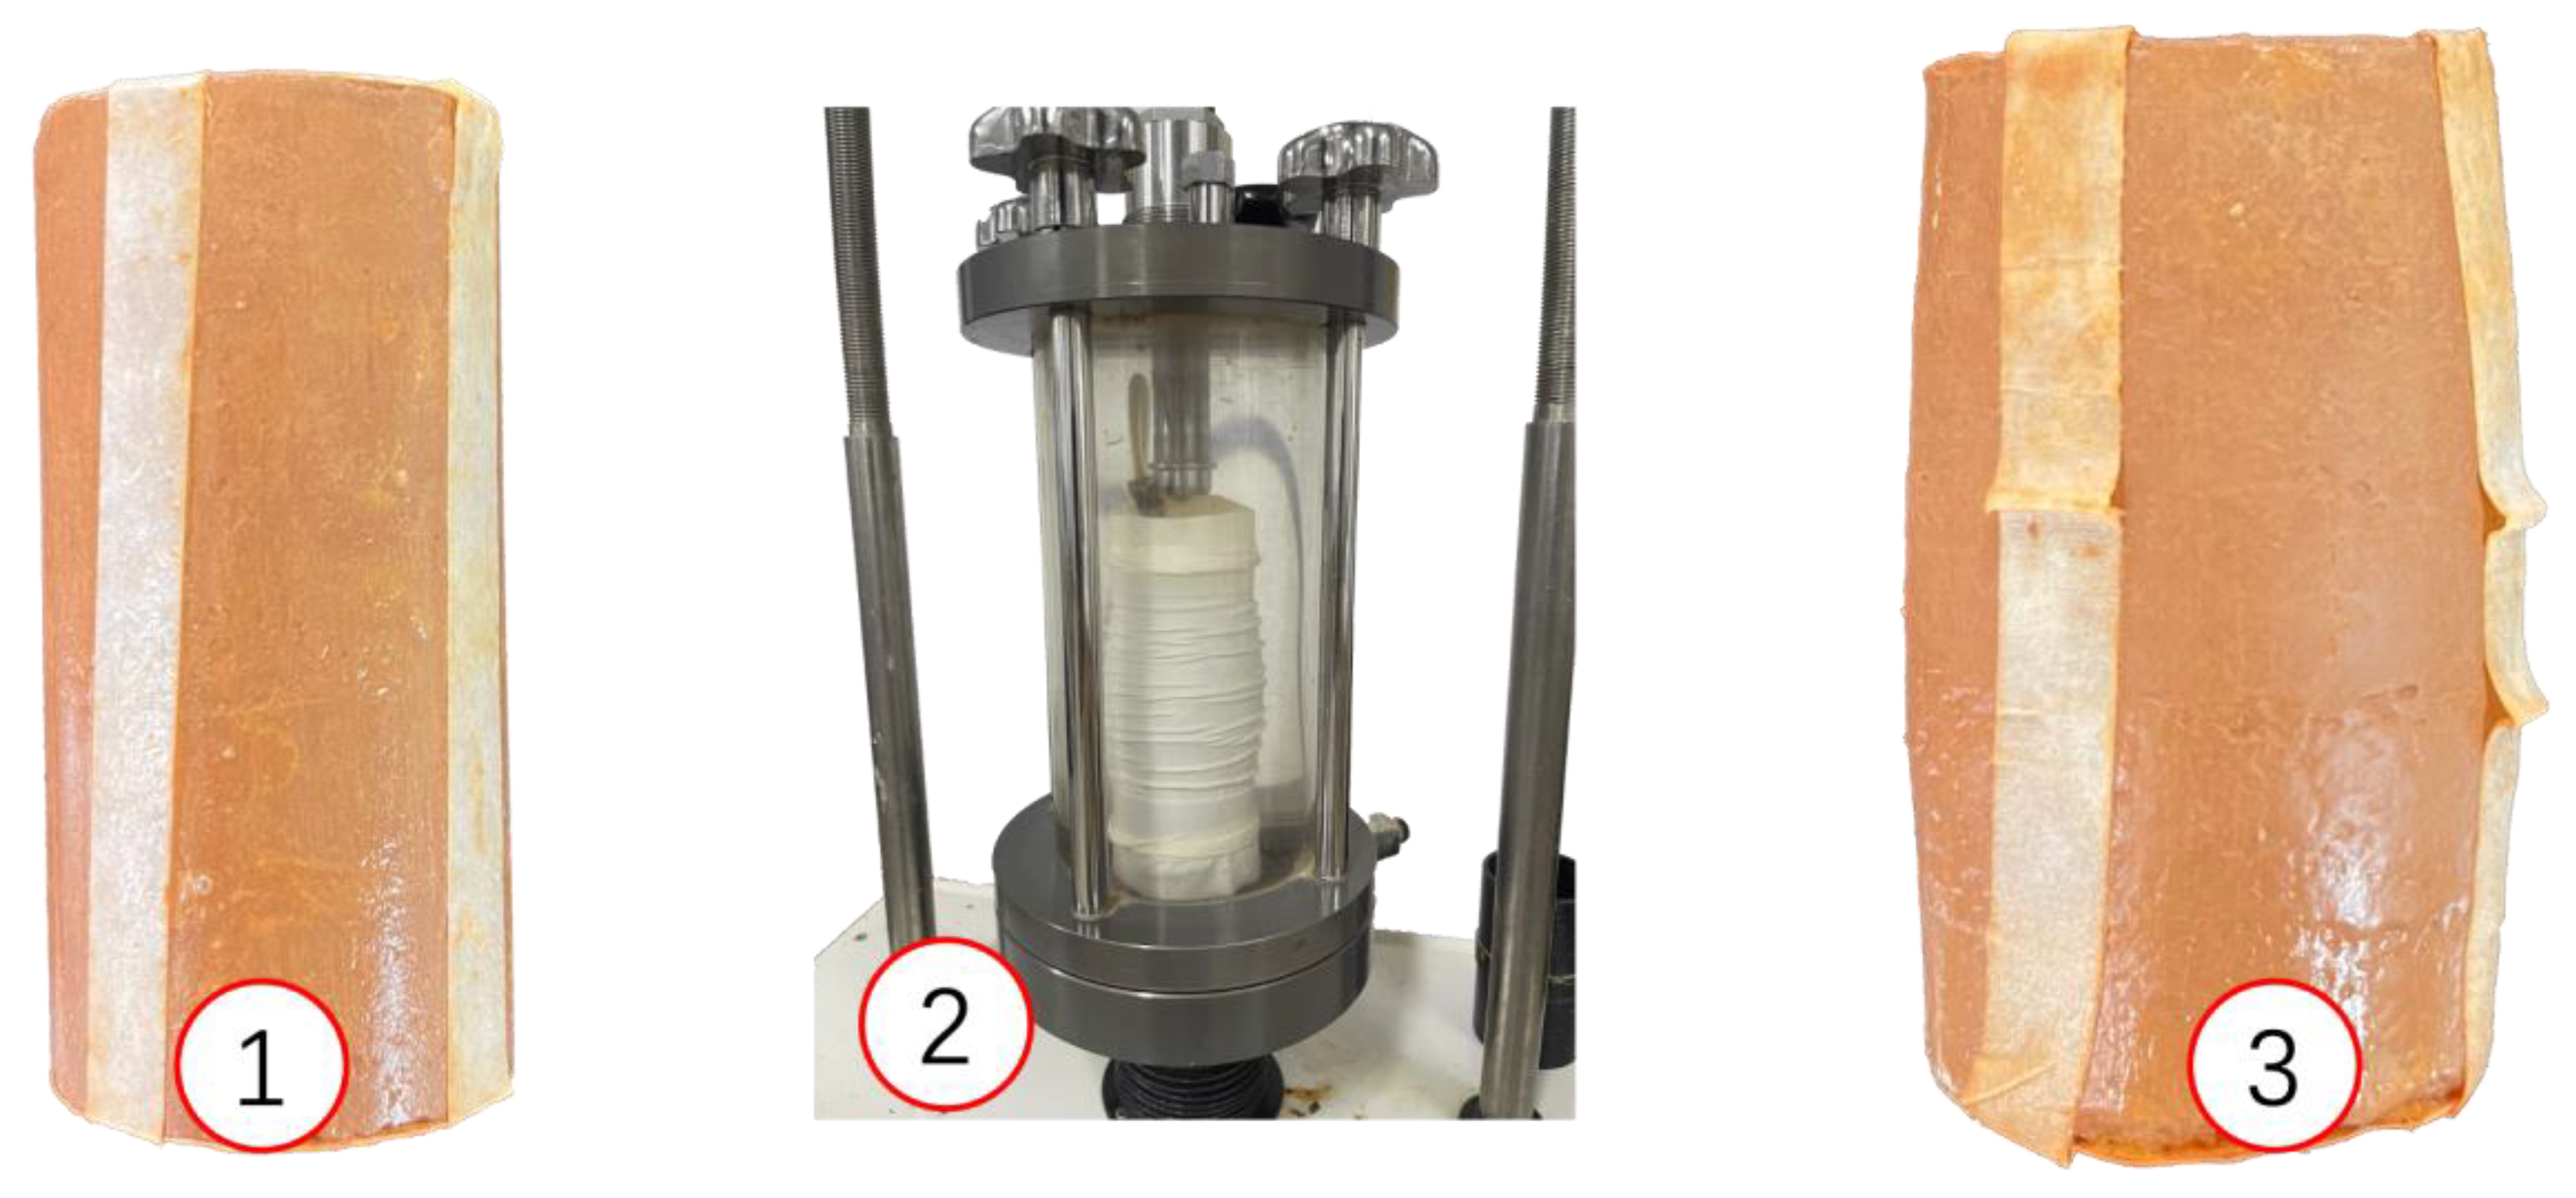
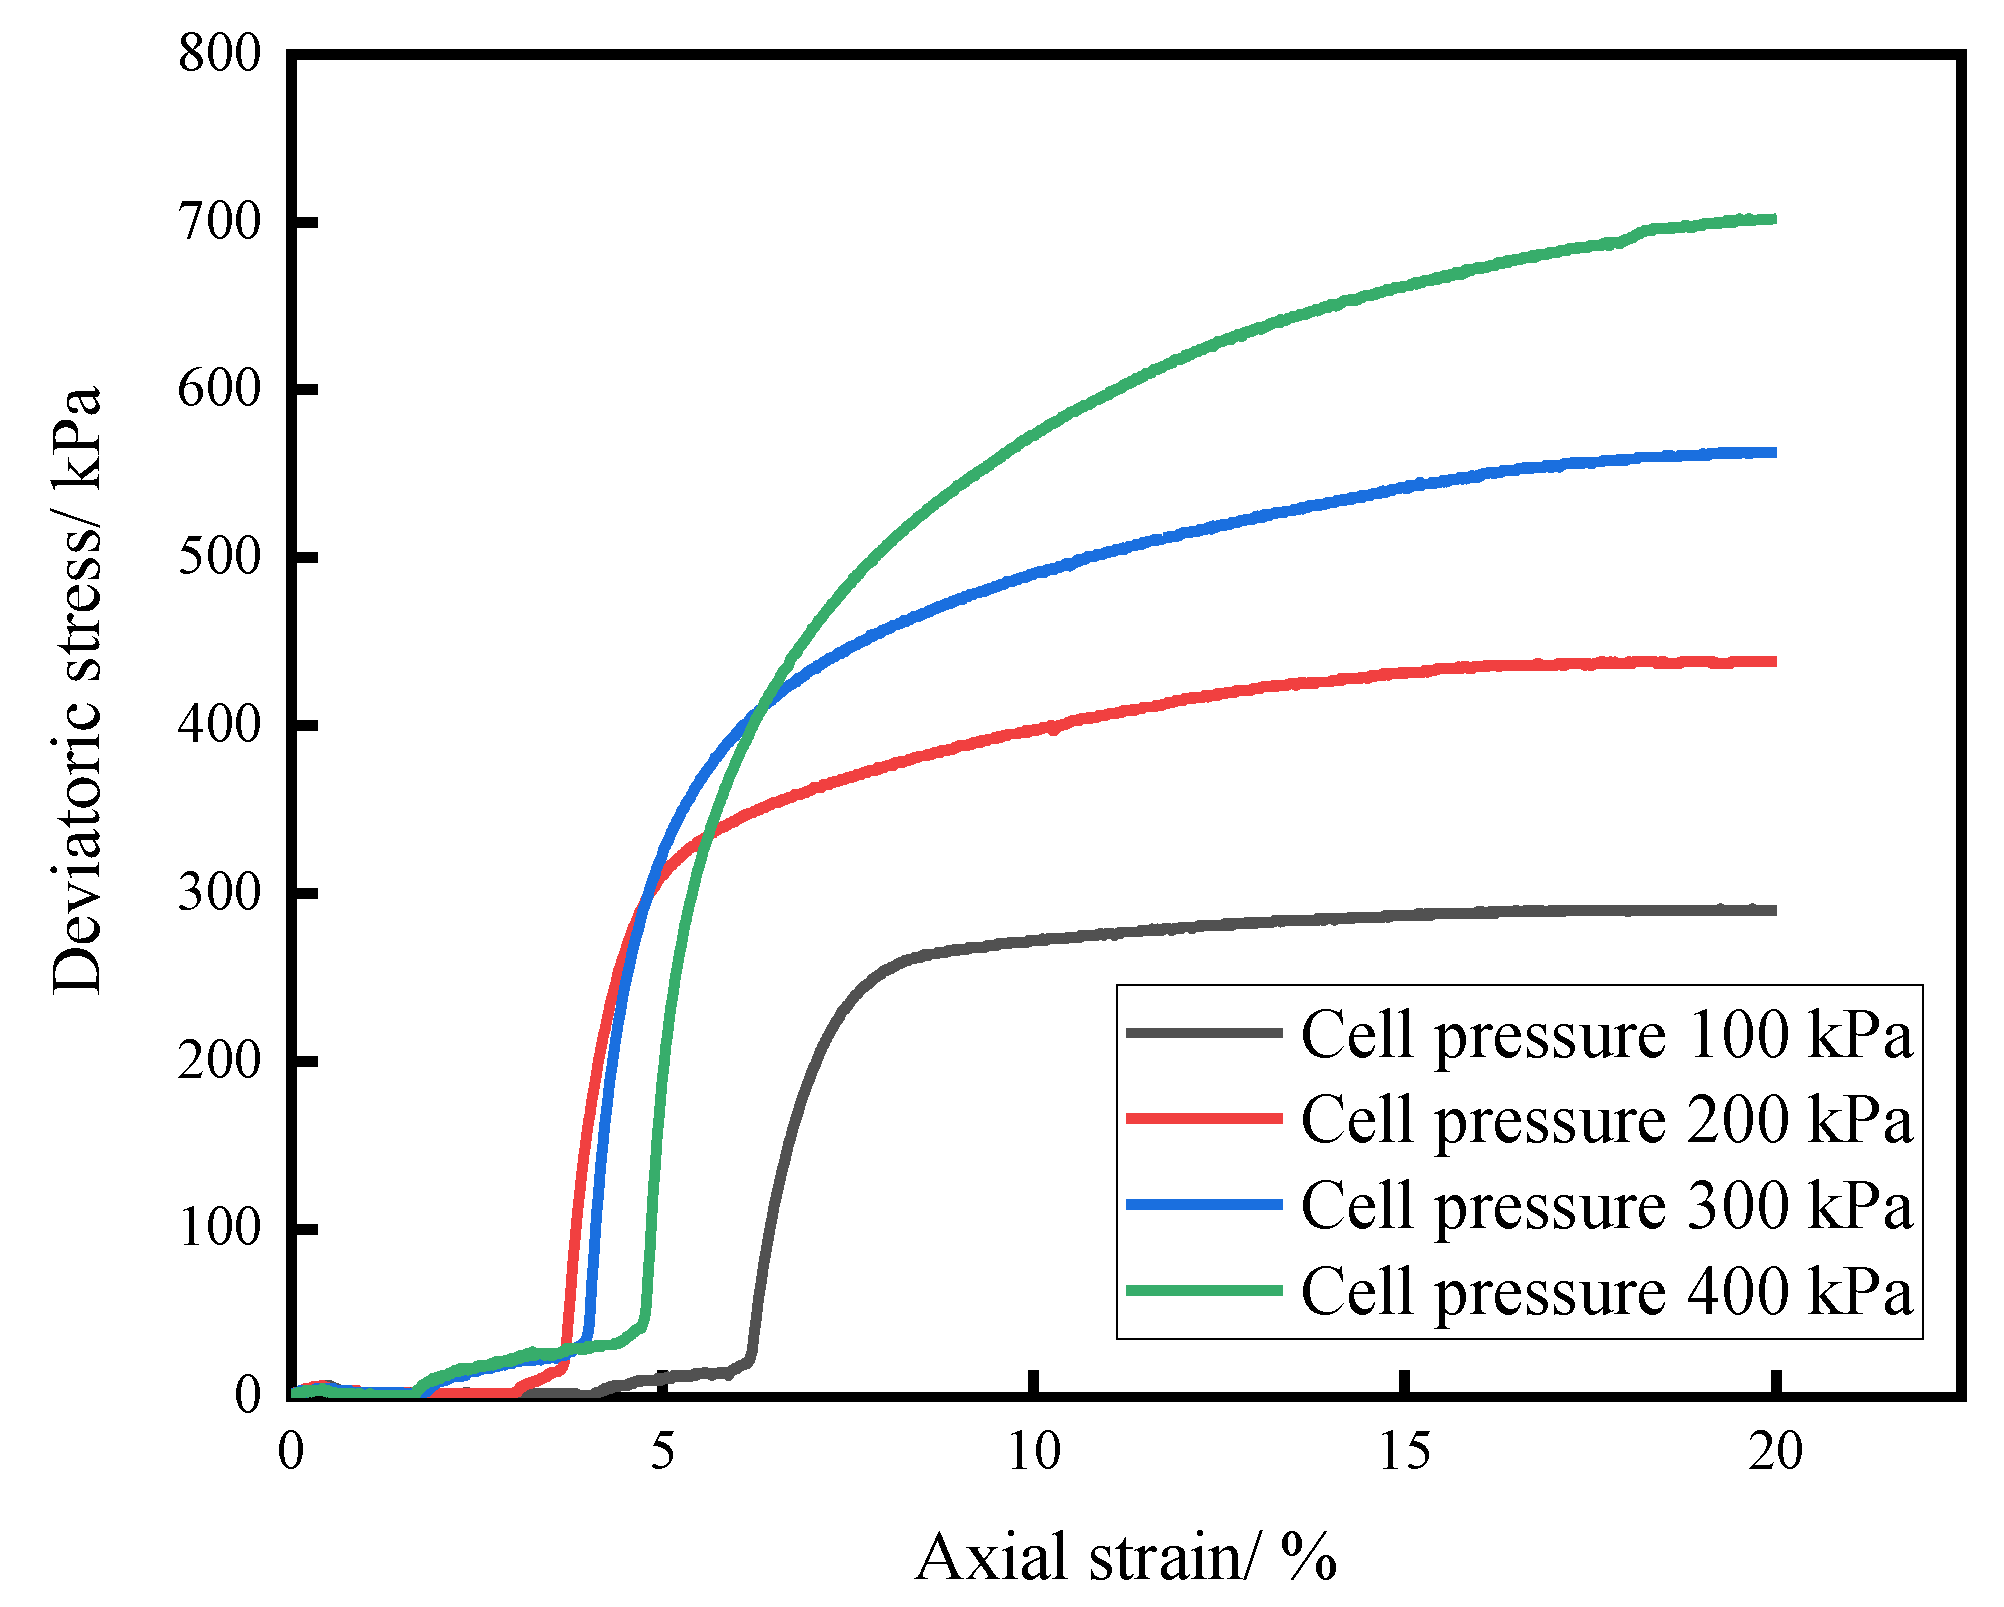
A triaxial shear test was performed according to the “Standard for geotechnical testing method (GB/T50123-2019)”. According to the moisture content and dry density in Table 1, to make a sample (Figure 3 left), the sample production was completed after reaching the pump saturation requirement. Then, the sample was loaded into the test apparatus for the test (, where is the pore pressure change and is the cell pressure change). When > 0.95, the sample was fully saturated, and conversely, the sample was saturated with the counter pressure of the sample until a value of > 0.95 was reached. The saturated samples were subjected to consolidated undrained shear tests at cell pressures of 100 kPa, 200 kPa, 300 kPa, and 400 kPa, respectively, at a shear rate of 0.08 mm/min, and the test procedure is shown in Figure 3. The stress–strain curves obtained from the triaxial shear tests are shown in Figure 4.
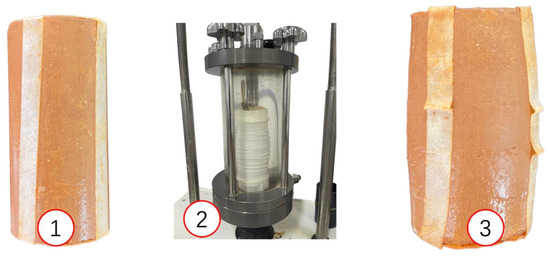
Figure 3.
Triaxial test sample and test process (1. triaxial sample; 2. sample being sheared; and 3. shear damage of the sample).
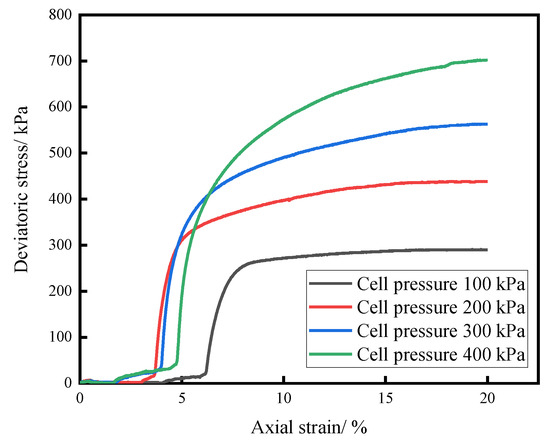
Figure 4.
Triaxial shear stress–strain diagram of red clay.
It can be seen from Figure 4 that a large deformation occurs after applying deviatoric stress in the initial stage of shear. This is due to the existence of large pores and microscopic pores between soil particles and soil particles inside the sample These pores are connected with each other, which makes the pore water flow phenomenon occur inside, and this kind of structure easily causes the sample to produce a large deformation after applying deviatoric stress. As the axial load increases, the soil particles are gradually compacted; if the soil skeleton is to be further compacted, the axial stress required per unit strain gradually increases, and the ability of the sample to withstand external loads increases. However, during the deformation of the sample, structural fractures occurred, which resulted in a weakening of the connectivity between the soil particles and a weakening of the cementation capacity of the red clay. This structural damage affected the shear resistance of the red clay, causing the stress–strain curve to gradually flatten.
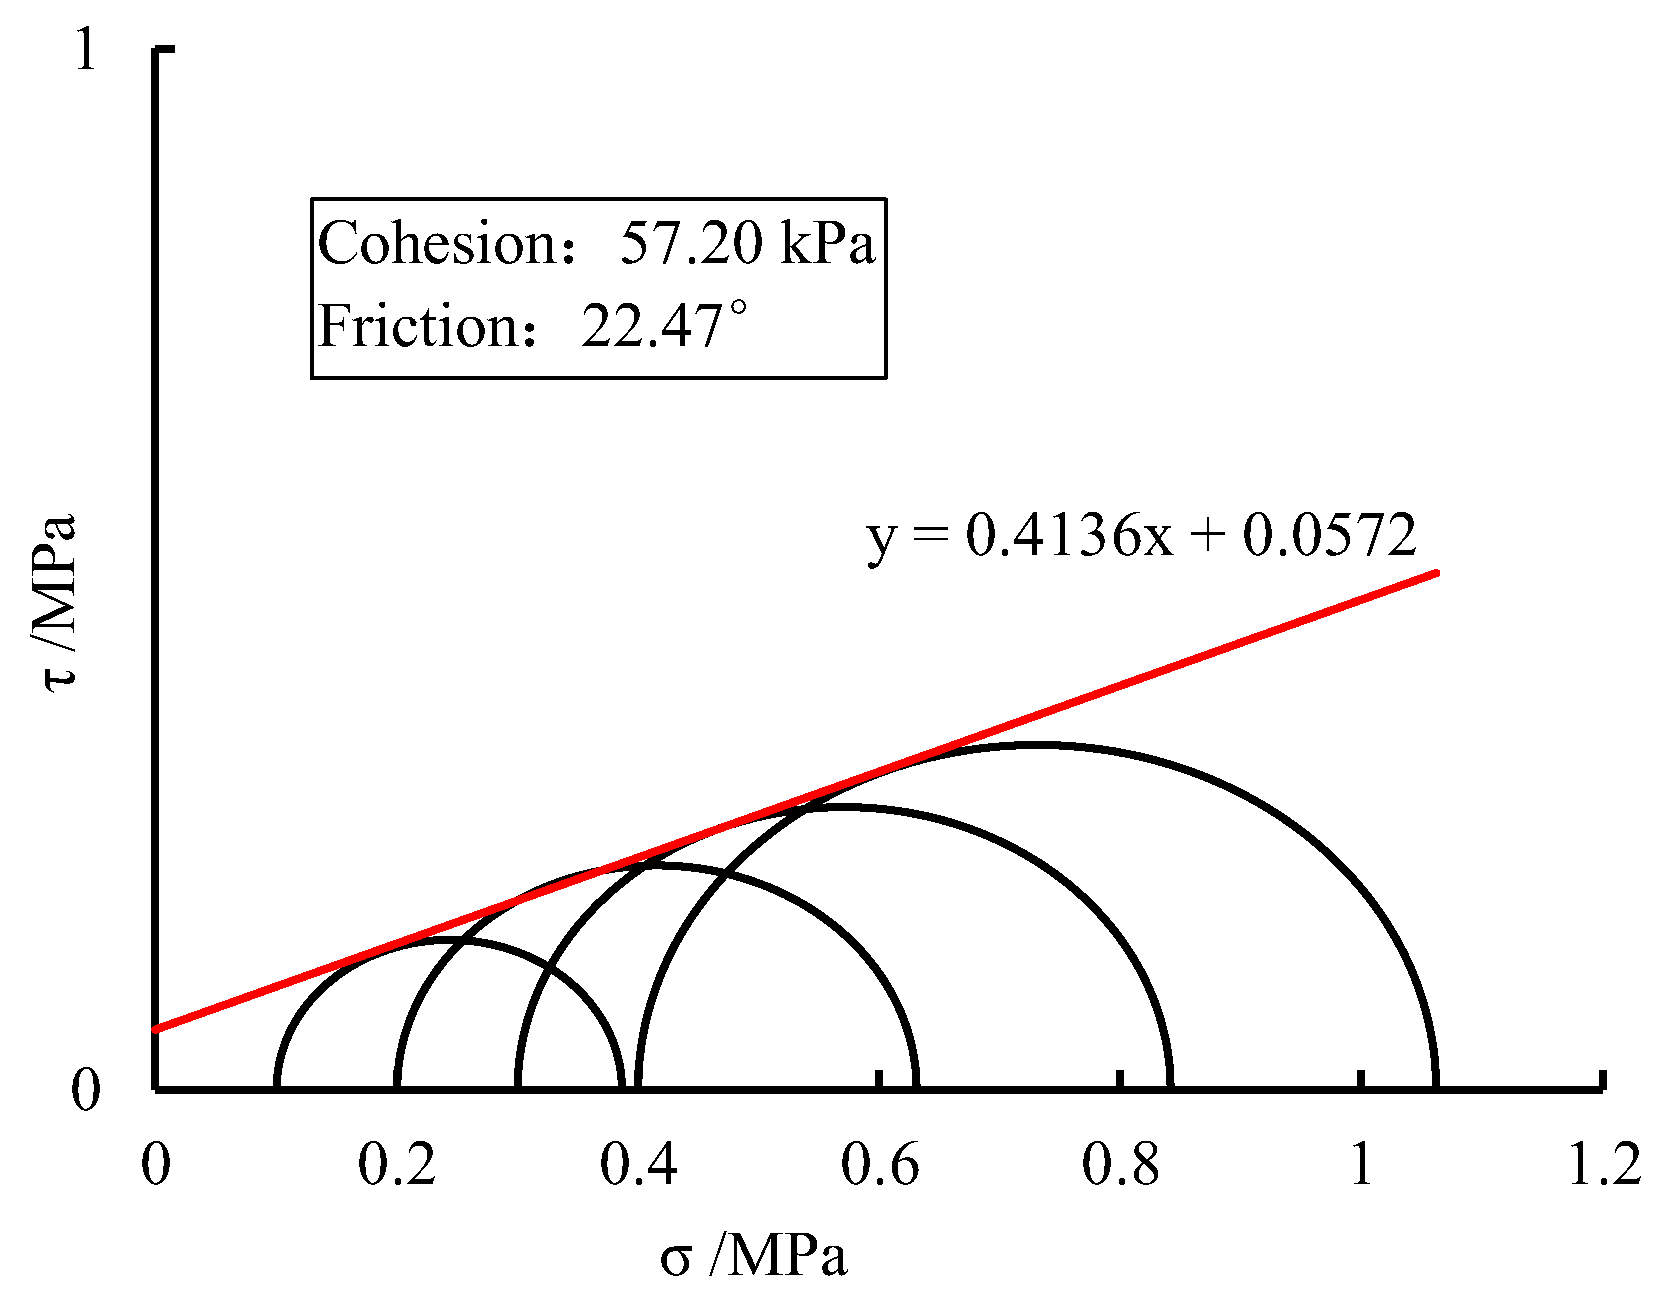
From Figure 4, it can be seen that when the red clay is subjected to consolidated undrained shear, the stress–strain curve shows a continuous hardening type. The destructive deviatoric stress is taken as the deviatoric stress corresponding to an axial strain of 15%, the cell pressures are 100 kPa, 200 kPa, 300 kPa, and 400 kPa, respectively, and the deviatoric stresses required for the destruction of the samples are 287 kPa, 431 kPa, 542 kPa, and 662 kPa, respectively. From the stress–strain curves, it can be seen that as the cell pressure increases, the deviatoric stress required to damage the sample in shear increases. At 400 kPa, the deviatoric stress required to destroy the sample is approximately 2.3 times greater than at 100 kPa. The destructive deviatoric stress obtained from the triaxial test was plotted on Mohr’s stress circle with the common tangent line, as shown in Figure 5, which indicates that the cohesion and angle of internal friction of the red clay are 57.20 kPa and 22.47°, respectively.
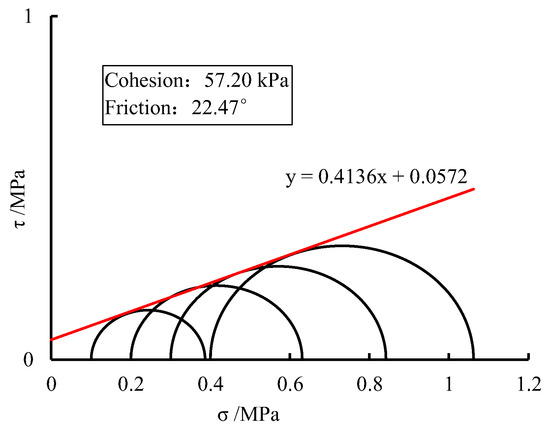
Figure 5.
Mohr stress circle.
2.3. Triaxial Creep Test Scheme
The deviatoric stress at the time of damage to the soil sample was determined using conventional triaxial shear testing, and this was used to set the magnitude of loading for each stage of the creep test. The creep test was performed in a graded loading mode using 50%, 60%, 70%, 80%, and 90% of the deviatoric stress in the triaxial shear test as the magnitude of the deviatoric stress for each stage of loading. The triaxial creep test used the same sample as the triaxial shear test, and the test standards were in accordance with the “Standard for geotechnical testing method (GB/T50123-2019)”. The sample was then placed in the test equipment for the test. If >0.95, it means that the sample is saturated; otherwise, it must be saturated with back pressure until the value is > 0.95. Before loading, the sample was consolidated for 24 h at constant pressure, and then the sample was loaded in stages. The loading scheme is given in Table 2. The sample was isotropically consolidated for 24 h prior to loading, and then the sample was loaded in a graded manner. The loading scheme is shown in Table 2. The creep stability criterion was that the axial deformation of the sample was less than 0.01 mm in 24 h. Red clay has the characteristics of high strength, low compressibility, etc., and the sample can basically reach the stability criterion within 24 h after loading [17], so the loading time of each stage of loading was set to 24 h. The loaded sample was then loaded with deviatoric stress of 80% and 90% as the magnitude of each stage of loading.
Table 2.
Loading scheme of deviatoric stress in the triaxial creep test.
2.4. Triaxial Creep Test Results
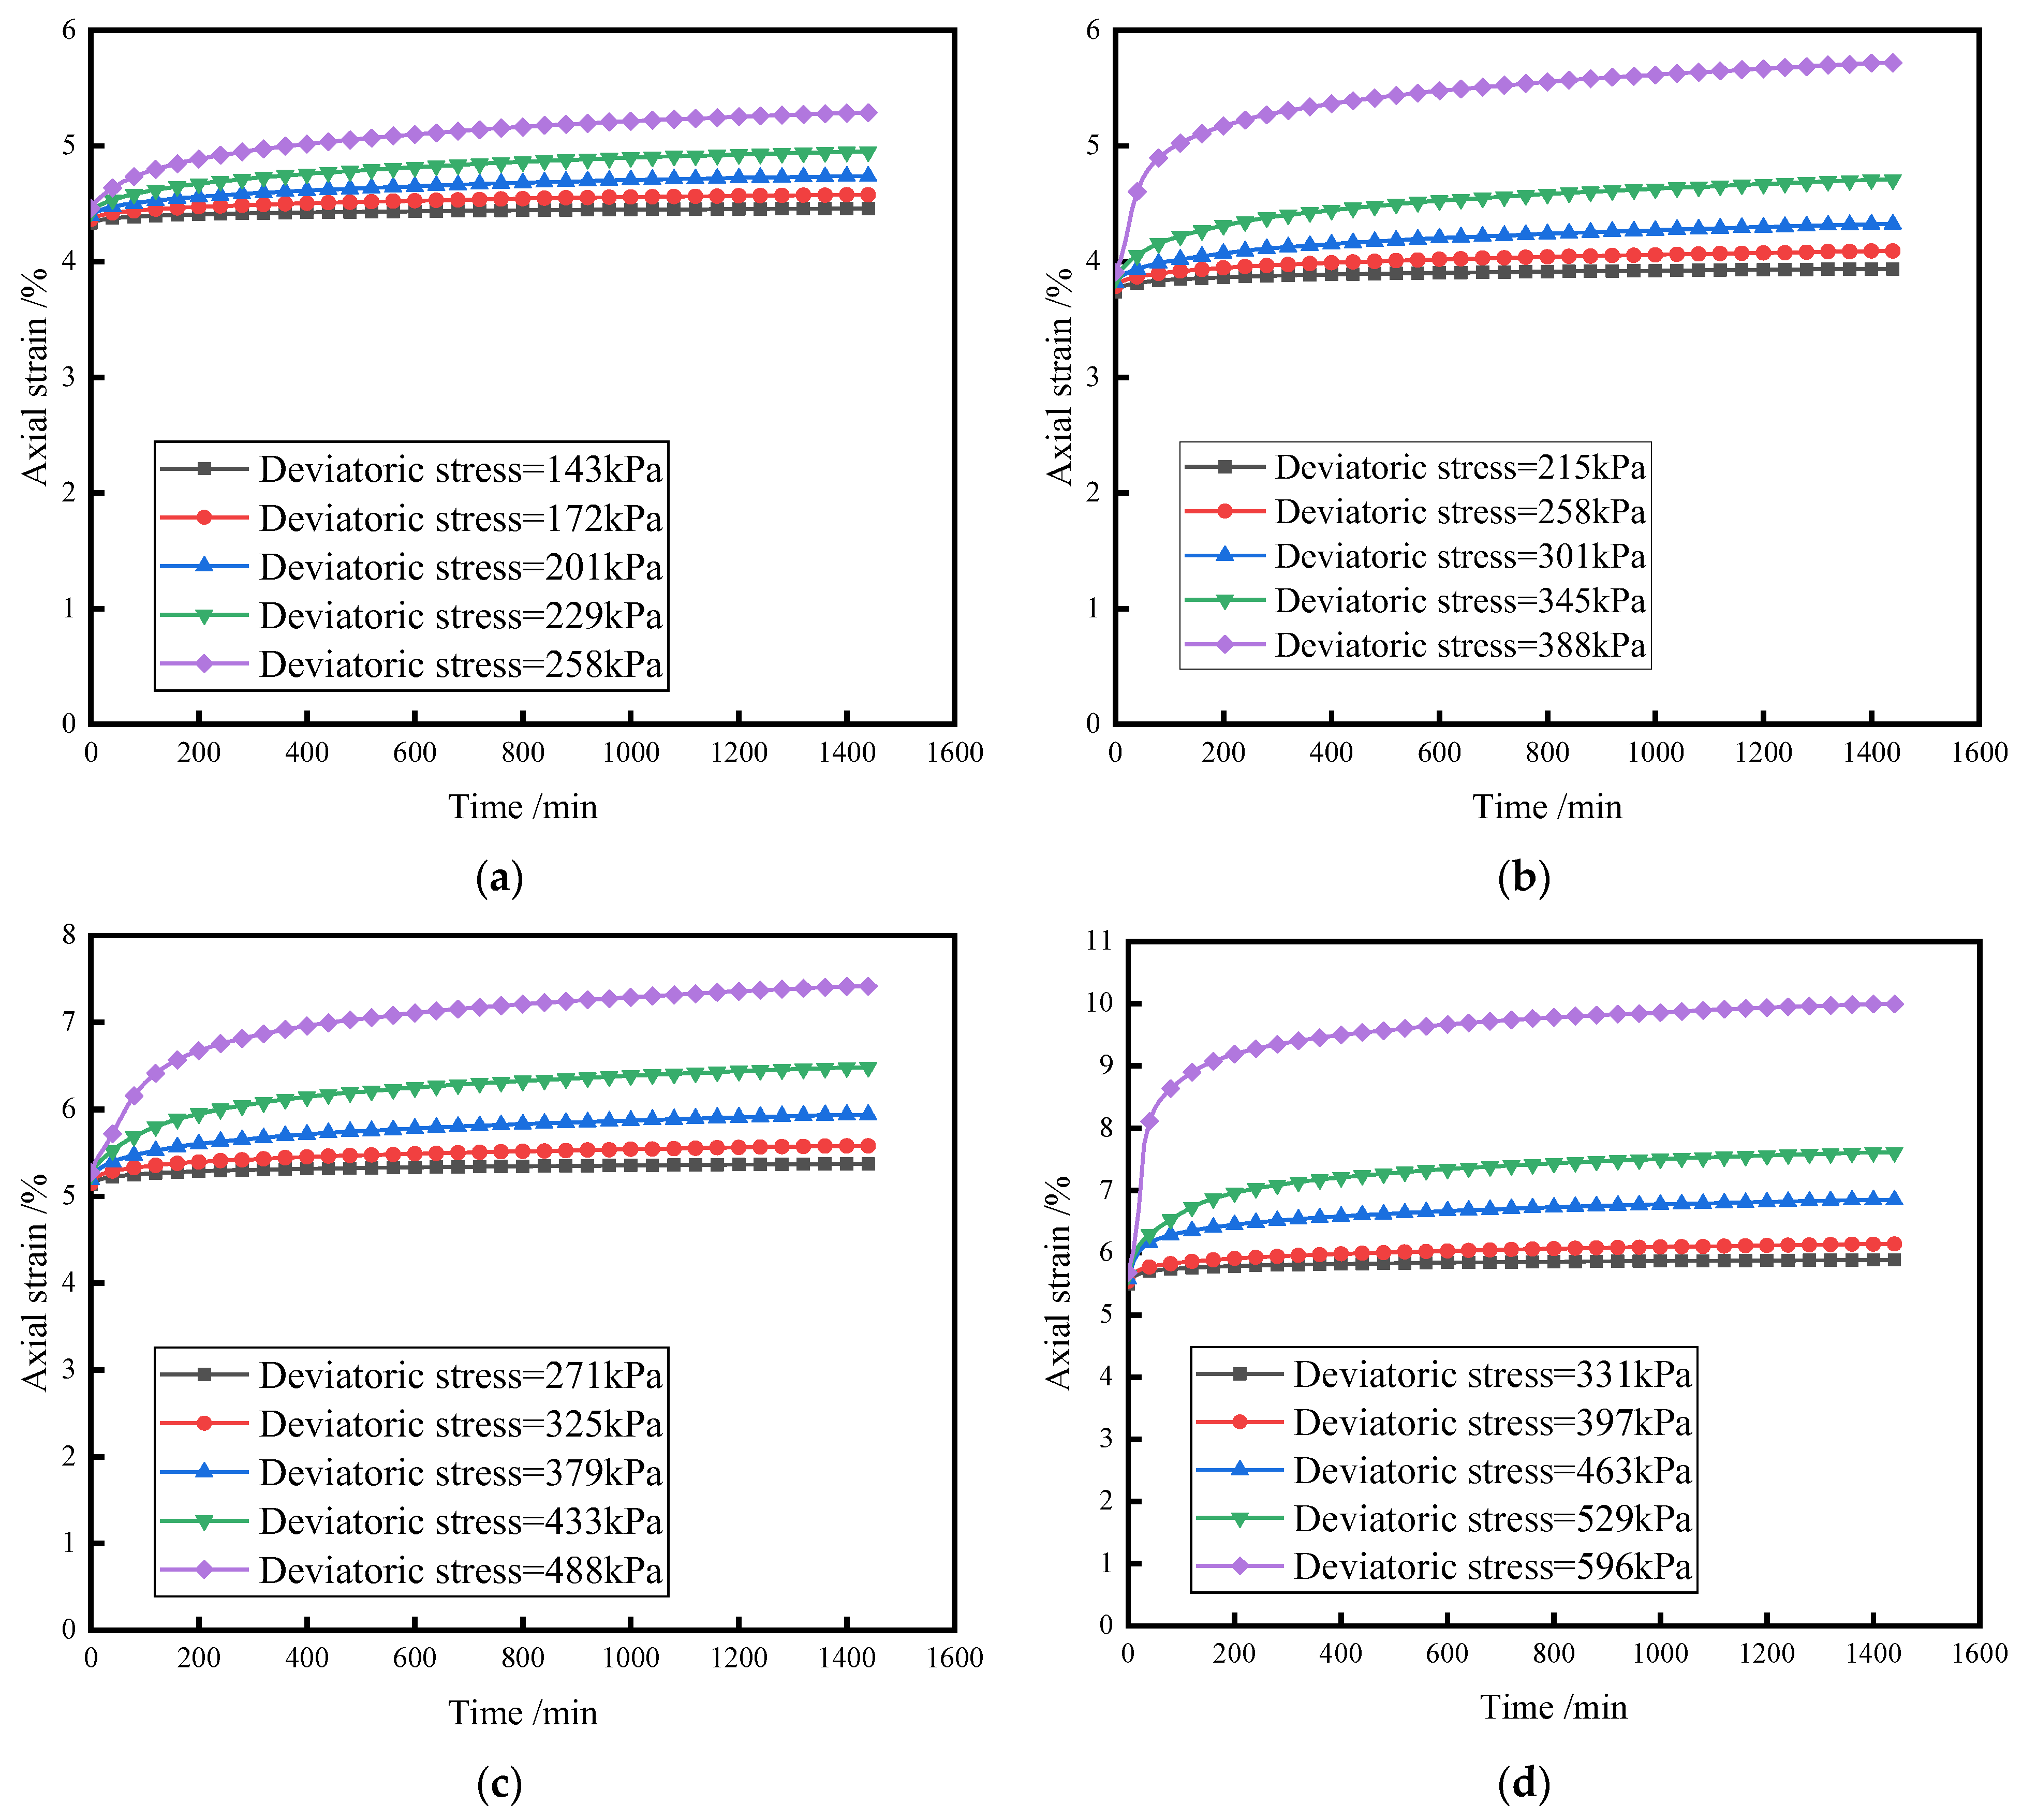
A triaxial creep test is the same sample graded loading method to obtain a graded loading curve, in which the graded loading of the whole process of the curve into a separate loading curve is performed using the method of “Boltzmann linear superposition” and “Chen’s superposition method”. The Boltzmann linear superposition method considers the sample as a linear creep body and completes coordinate translation of the data and then superposition processing, while Chen’s superposition method considers the effect of nonlinear cumulative deformation of the sample in the loading process with the appropriate superposition method for data processing [24]. In this paper, Chen’s superposition method is used to process and analyse the test data.
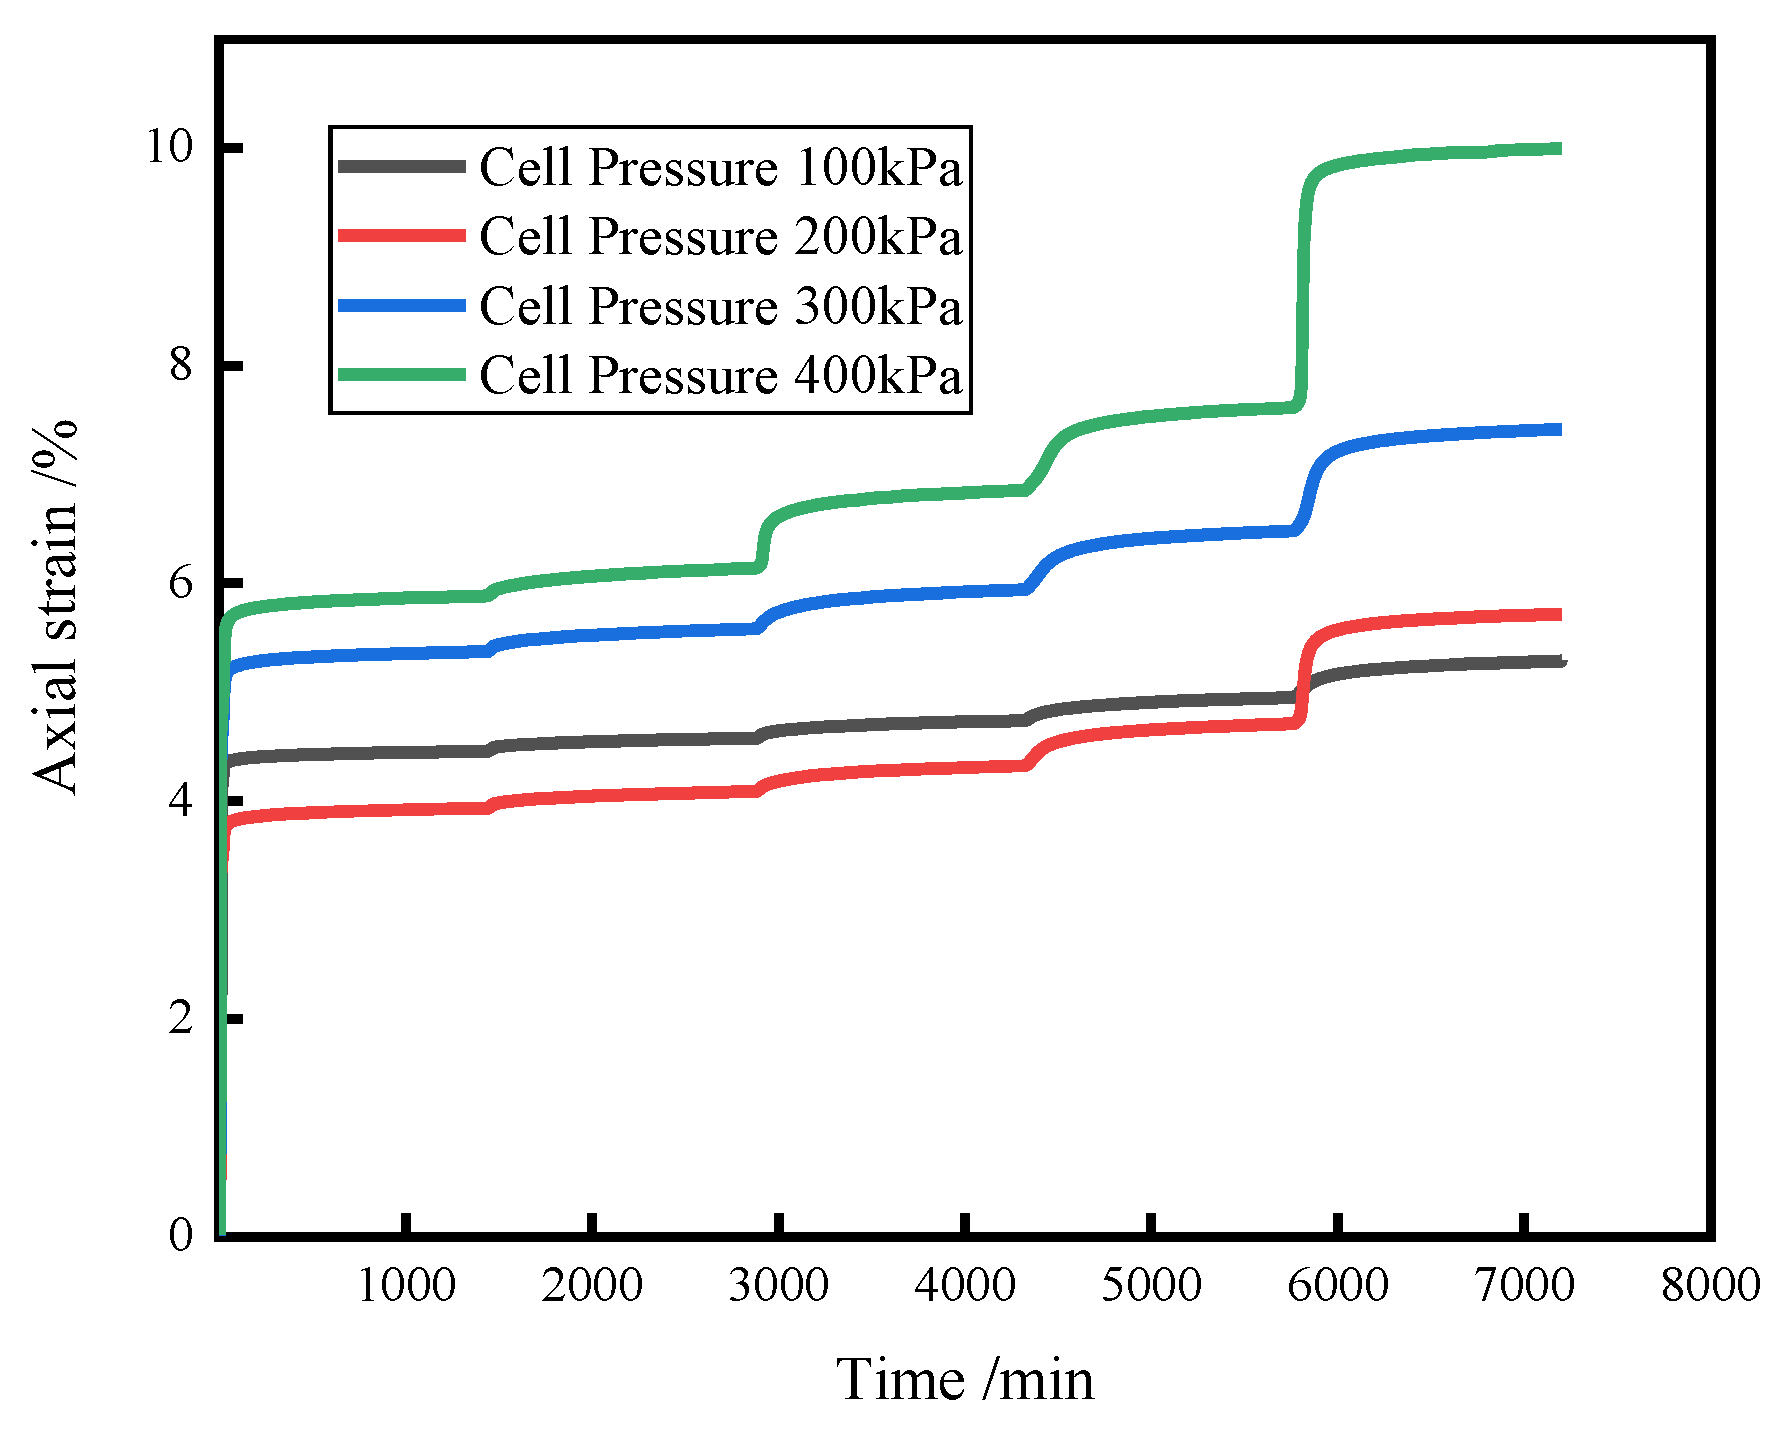
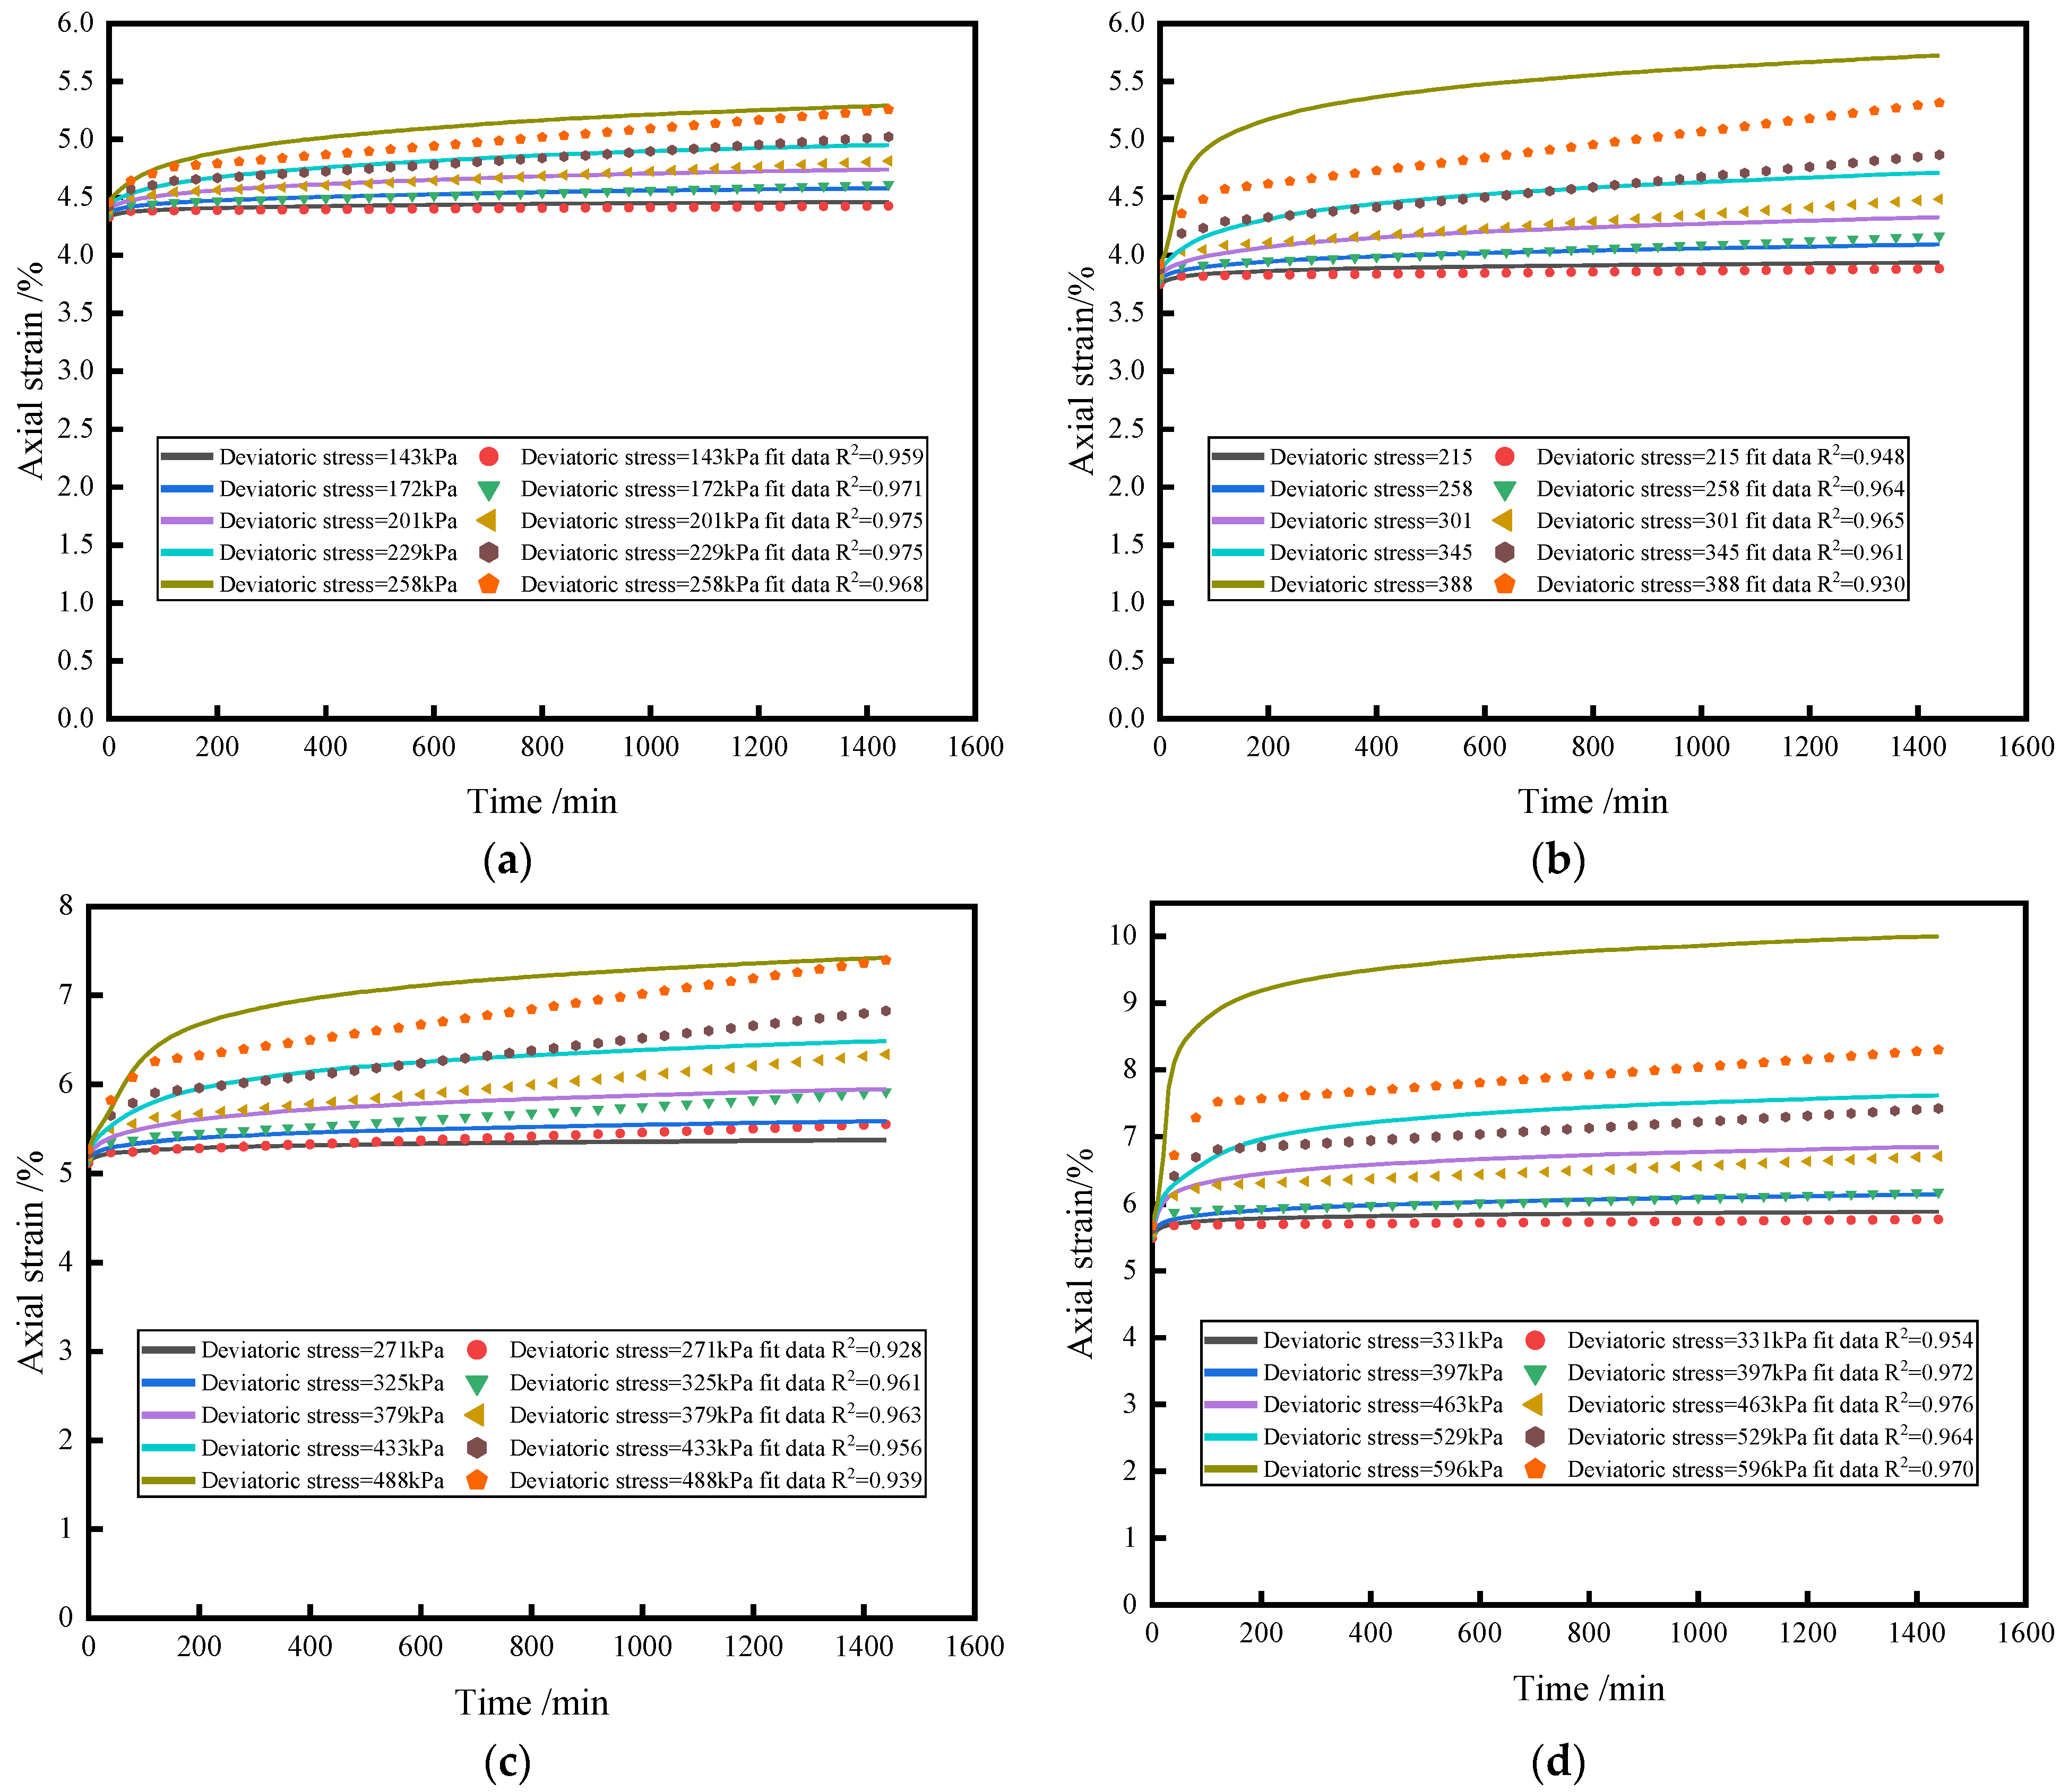
The whole process test curve is shown in Figure 6, from which it can be seen that the sample produces a large deformation during the initial loading, which is due to the long time required for the initially applied deviatoric stress to increase from zero to the target deviatoric stress. The sample produces a large deformation in the process of continuously applying the deviatoric stress, and then the rate of axial strain growth gradually decreases and tends to stabilise. When the deviatoric stress is large, the phenomenon of stagnation of axial strain growth occurs during the application of deviatoric stress, corresponding to the obvious inflexion points in Figure 7, which is consistent with the literature [25] and can be explained by the “Mandel-Cryer” effect that produces this phenomenon.

Figure 6.
Graph of the whole process of the triaxial creep test.
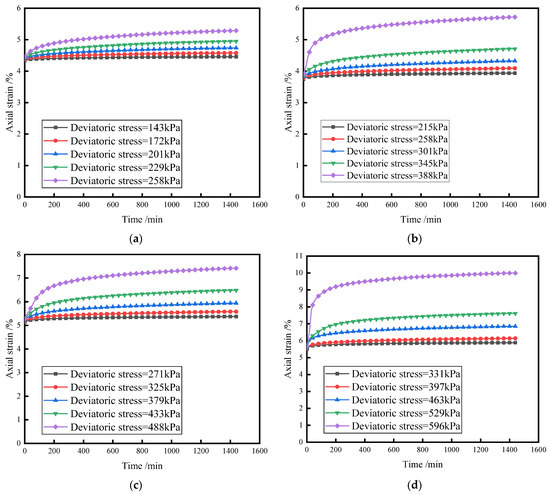
Figure 7.
Triaxial creep loading curves under different cell pressures. (a) Cell pressure of 100 kPa. (b) Cell pressure of 200 kPa. (c) Cell pressure of 300 kPa. (d) Cell pressure of 400 kPa.
From Figure 6, it can be seen that the creep curve has three stages: instantaneous elastic deformation, decay creep, and stable creep. In the early stage of loading, the red clay produces a large deformation under the action of deviatoric stress at all levels, which is the transient elastic deformation stage. Subsequently, the strain rate gradually decreases, the curve shows an upward convex non-linear pattern, the axial strain tends to stabilise with time, and the strain–time curve becomes flat, which is the decay stage. As the strain rate in the steady state creep stage is very small, the relationship between strain and time is approximated as a straight line.
In this paper, only the creep deformation of red clay is considered, so the elastic deformation produced at the stage of gradually increasing the deviatoric stress to the target deviatoric stress is removed. The whole process curve of creep is processed using Chen’s loading method, and the separate loading curves are obtained, as shown in Figure 7. The final axial strain produced by the sample under the action of each level of deviatoric stress is shown in Table 3. As can be seen from Figure 7, under the action of all levels of deviatoric stress, the red clay produces a large elastic deformation when the deviatoric stress is applied; under the action of different deviatoric stresses and cell pressures, the red clay sample eventually enters the creep steady-state stage, and the slope of the creep curve tends to a constant value. When the applied deviatoric stress is for the destruction of the deviatoric stress of 50–70%, the sample requires a short period of time to transition from the weakening of the creep stage to the steady state creep stage, the strain rate of the steady state creep stage is small, and the curve tends to flatten out almost a straight line. When the deviatoric stress is for the destruction of the deviatoric stress of 80–90%, the axial strain of the sample is significantly larger for the phenomenon of hysteresis of the growth of strain. In the case of constant cell pressure, i.e., a low-stress level, the creep deformation of red clay is not obvious. With an increase in deviatoric stress, the creep deformation of red clay has a significant increase, which is due to the low compression of red clay under low stress. When the deviatoric stress exceeds the yield stress, the compression of red clay also increases. From a microscopic point of view, under the action of low stress, the structural unit of red clay changes less, and the pore size between soil particles changes little, so its creep deformation is small. When red clay is in a state of high stress, the structural unit of red clay changes more, and the soil particles are extruded by the force, causing the pore size between the particles to become smaller. Here, the structural unit of red clay is changed more, so the deformation of the sample is larger under the state of high stress.
Table 3.
The axial strain value of the sample after loading under different cell pressures and different deviatoric stresses.
3. The Burgers Creep Model
3.1. Model Introduction
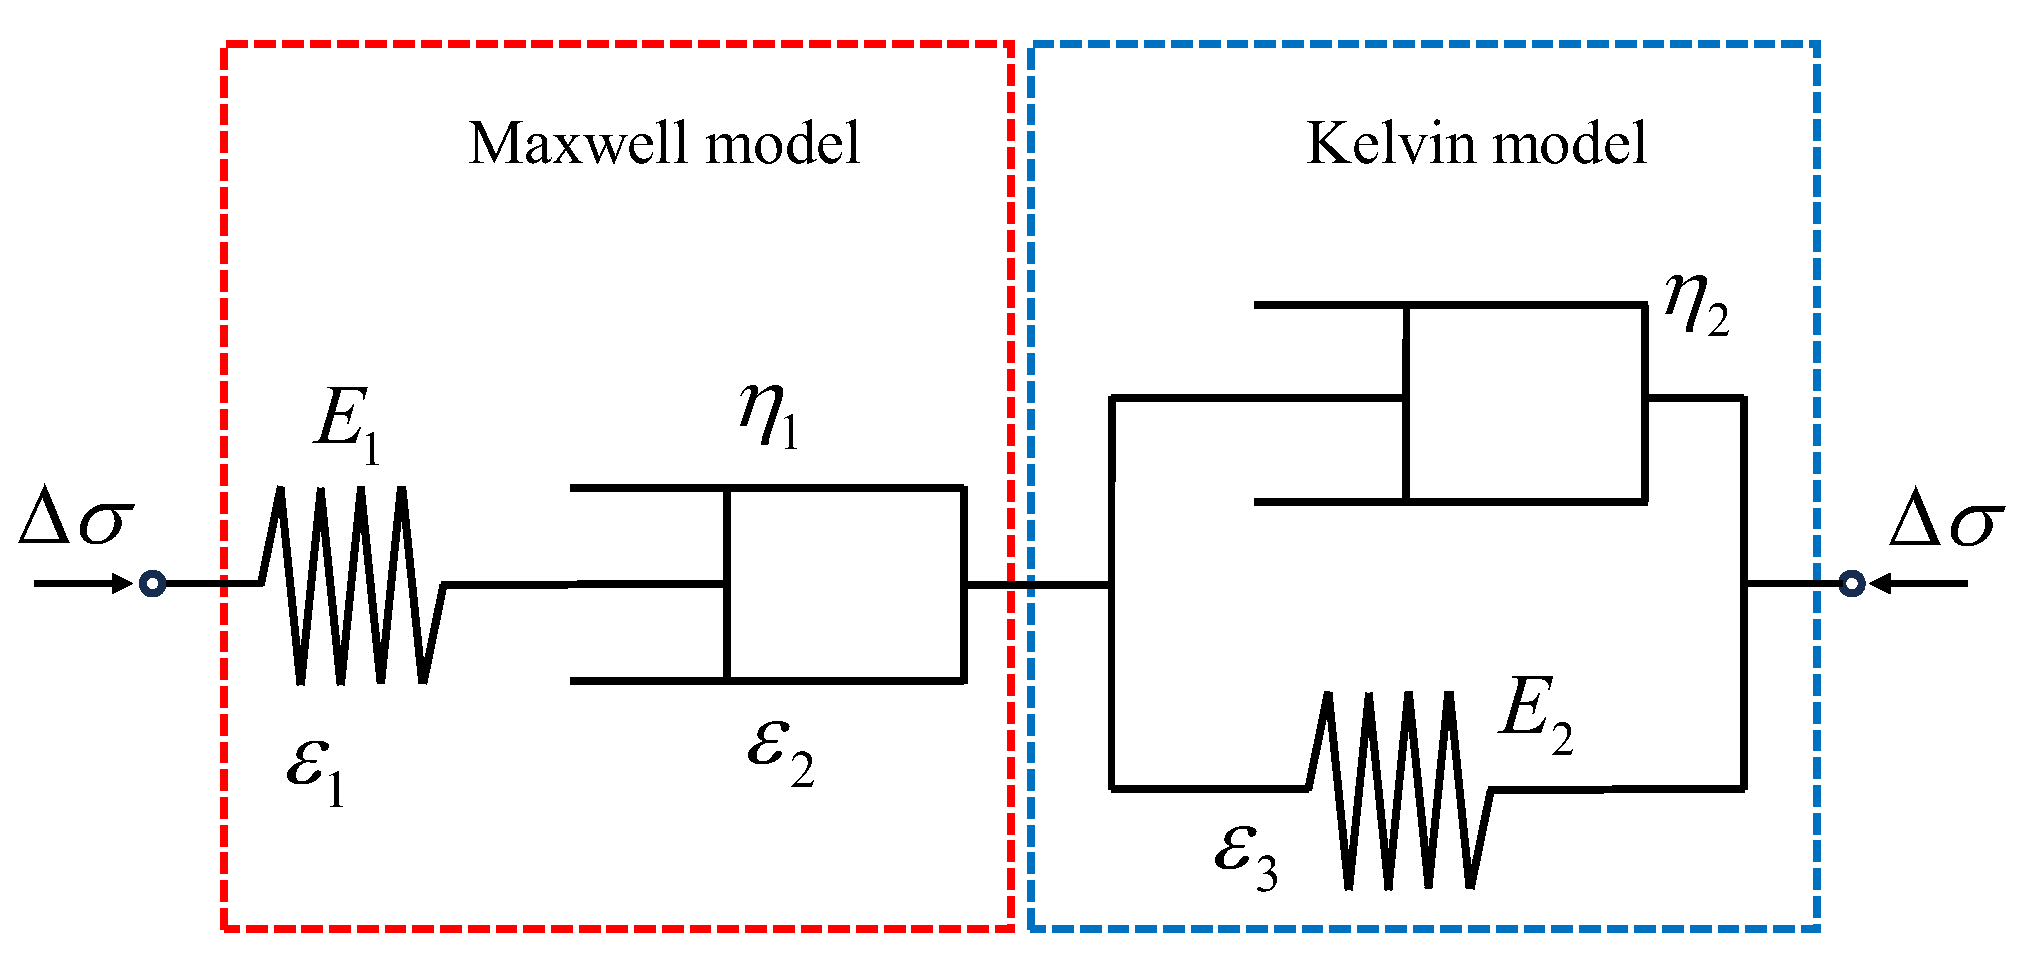
The Burgers model has high accuracy in describing the decay and stable creep stages of geotechnical bodies [26], so this paper establishes a Burgers creep model applicable to red clay in the Guilin area. The Burgers model is a four-component viscoelastic creep model consisting of the Maxwell model and the Kelvin model in tandem, and its structure is shown in Figure 8. The Maxwell model is a viscoelastic model composed of a Hooke’s spring and a Newtonian clay pot connected in series, which can describe the characteristics of the soil body in the case of constant stress with an increase in strain with time (creep). The Kelvin model is a viscoelastic model composed of a Hooke’s spring and a Newtonian clay pot connected in parallel, which is suitable for describing the attenuation creep characteristics of the soil body.
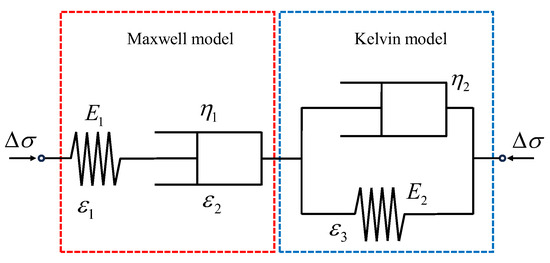
Figure 8.
Burgers model structure.
The Burgers model equation is composed of the deformation of the Hooker spring in the Maxwell model , the deformation of the Newton sticky pot corresponds to the constant velocity creep stage , and the deformation corresponding to the Kelvin model , as shown in Equation (1).
where is the applied deviator stress; , is the modulus of elasticity; , is the sticky pot coefficient, and is time.
The relationship between strain rate and time can be obtained from Equation (1) :
When :
When , the strain produced by the Kelvin model tends to a constant value. Substituting Equations (2) and (3), we obtain:
The calculation equation of Burgers model parameters can be obtained by simultaneously using Equations (3) and (4) as follows:
where is the initial creep rate; is the stable creep rate; is the strain rate; and is the final value of strain is generated for the Kelvin model.
3.2. Derivation of Model Parameters
As can be seen from Figure 8, all the above parameters can be determined from the test curve. Below is an example of the creep curve at 100 kPa cell pressure, which is used to illustrate the method of parameter determination.
- (1)
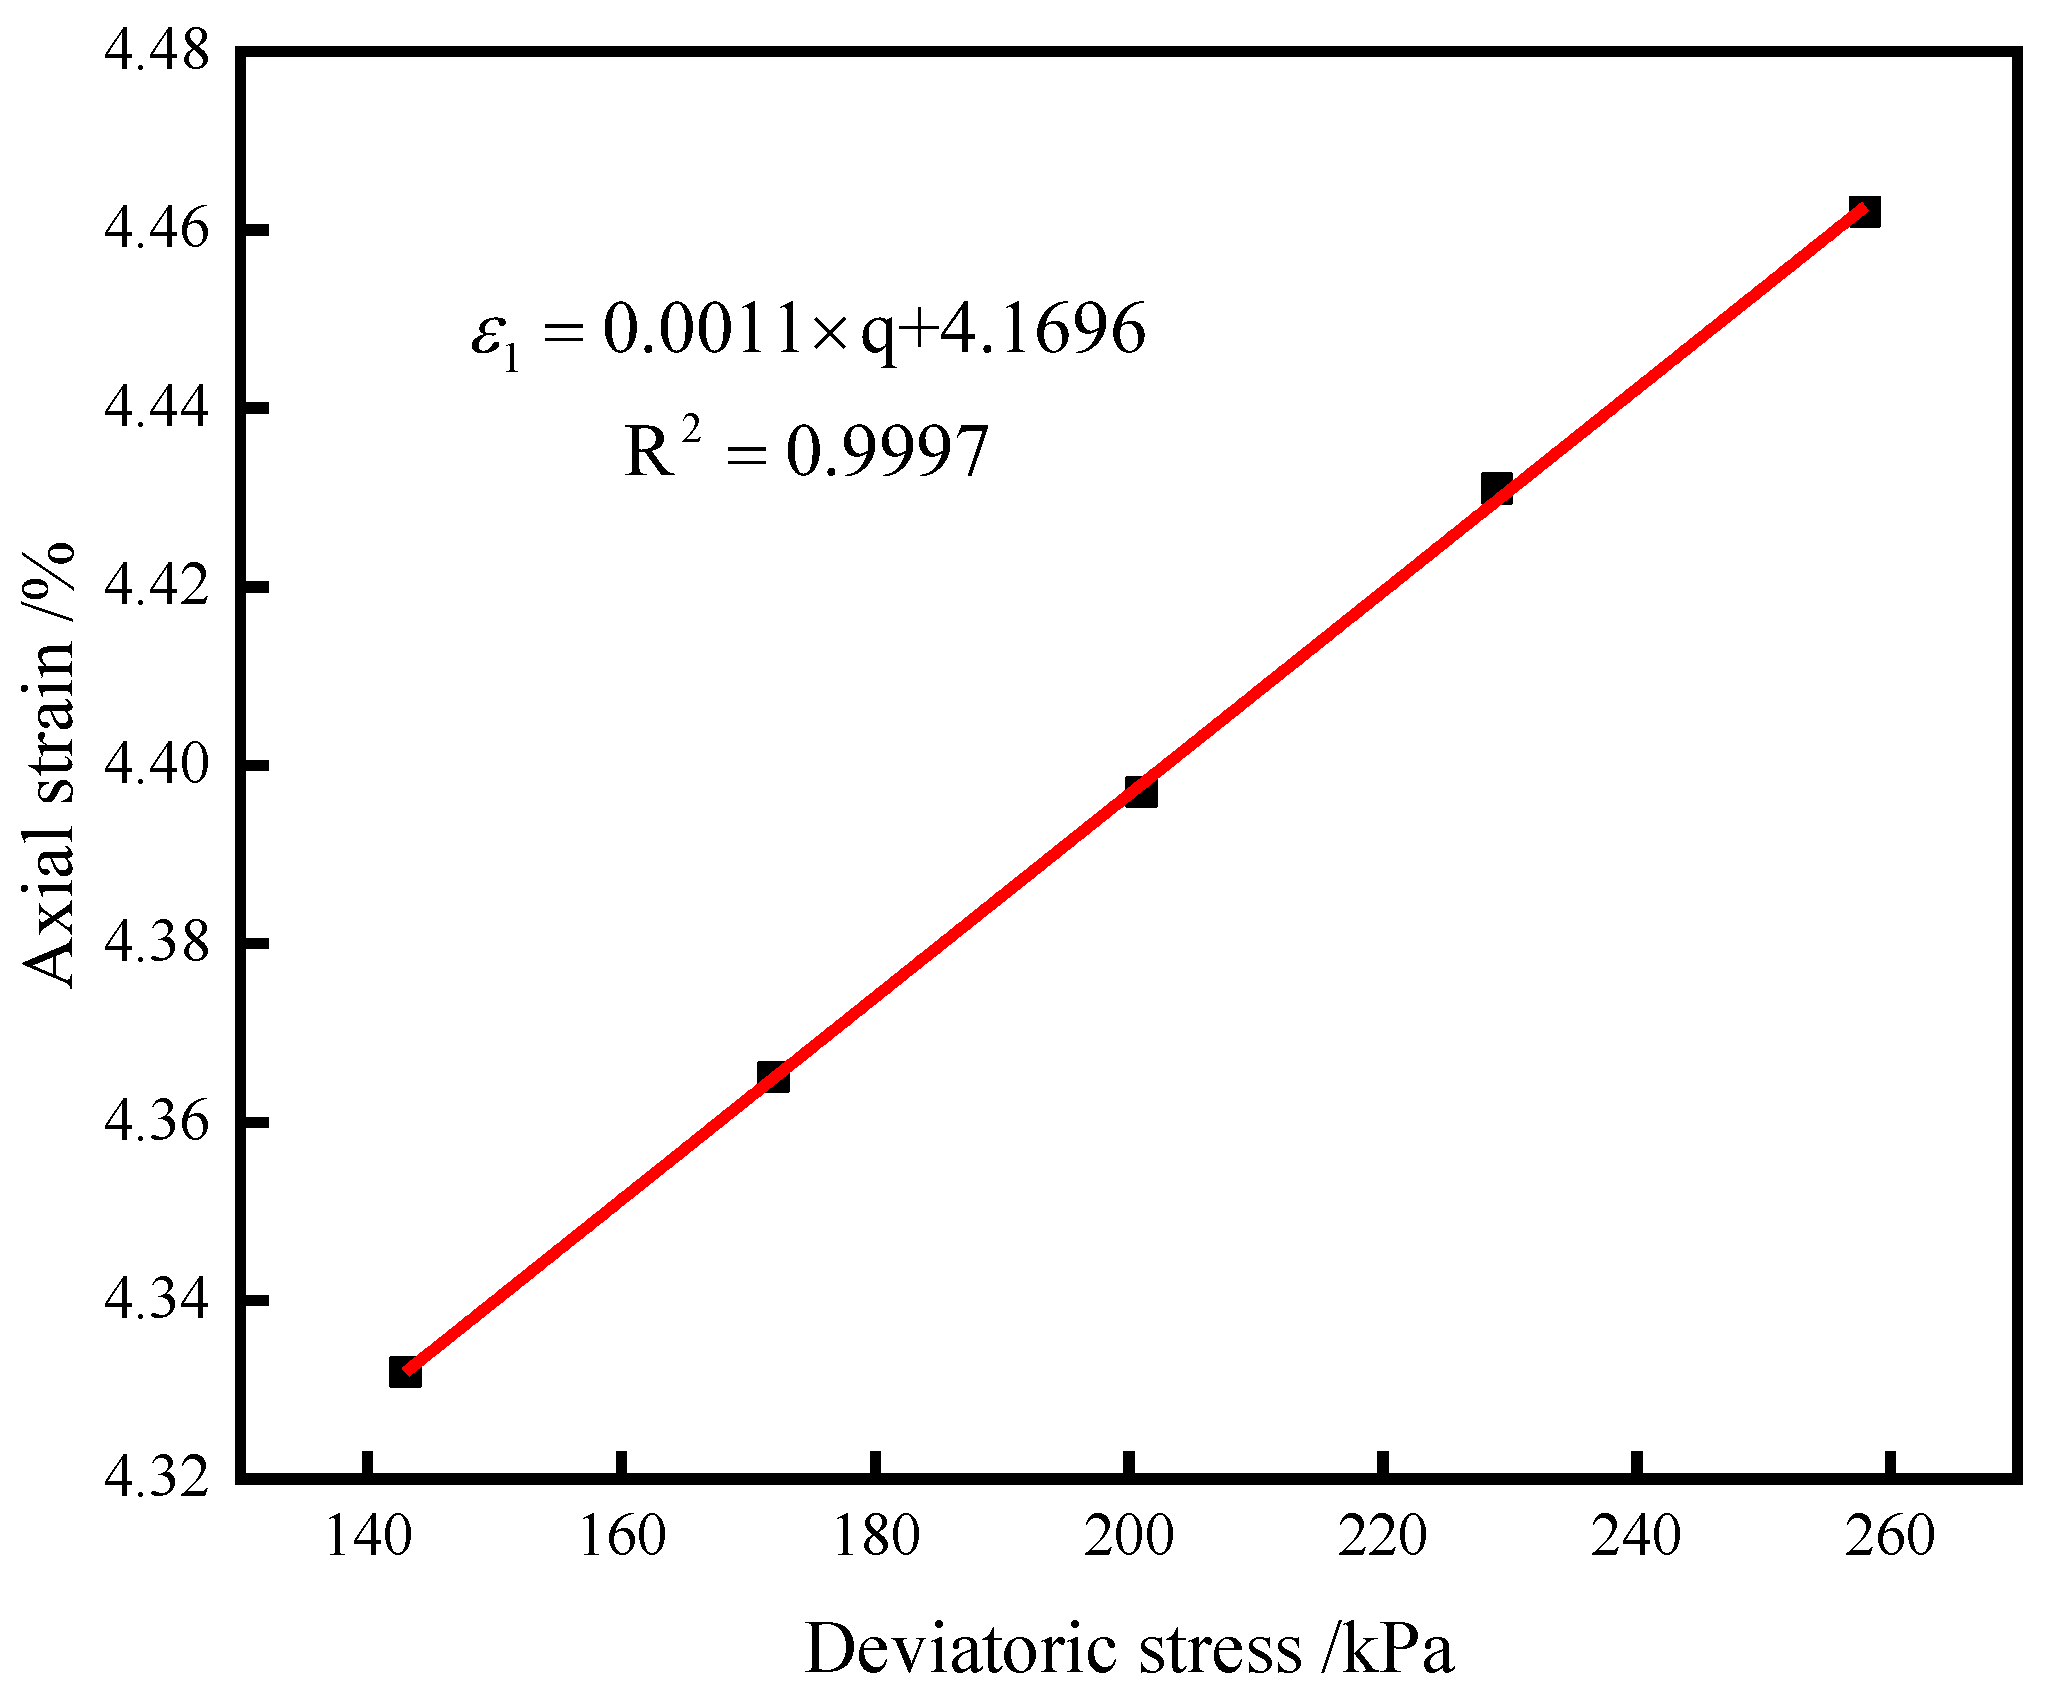
- Elastic modulus
As can be seen from the above, , the deformation produced during the eccentric stress application stage, corresponds to the strain at the start of the creep curve in Figure 7. The relationship between deviator stress and axial strain at each stage is shown in Figure 9, and the relationship between deviator stress and axial strain is linear. From this empirical formula, the elastic modulus can be derived as follows:
where and B are fitting coefficients and q is the deviator stress.
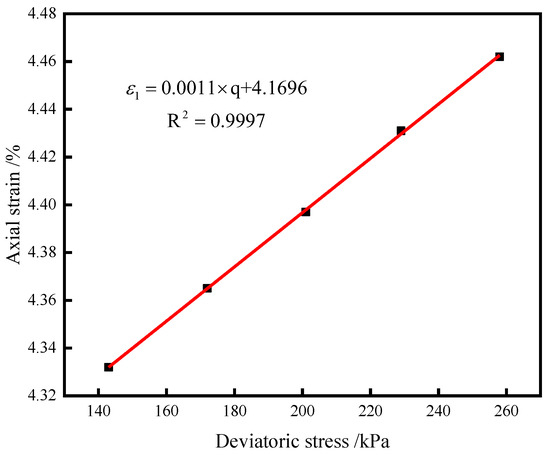
Figure 9.
Relationship between axial strain and deviatoric stress q.
- (2)
- Elastic modulus
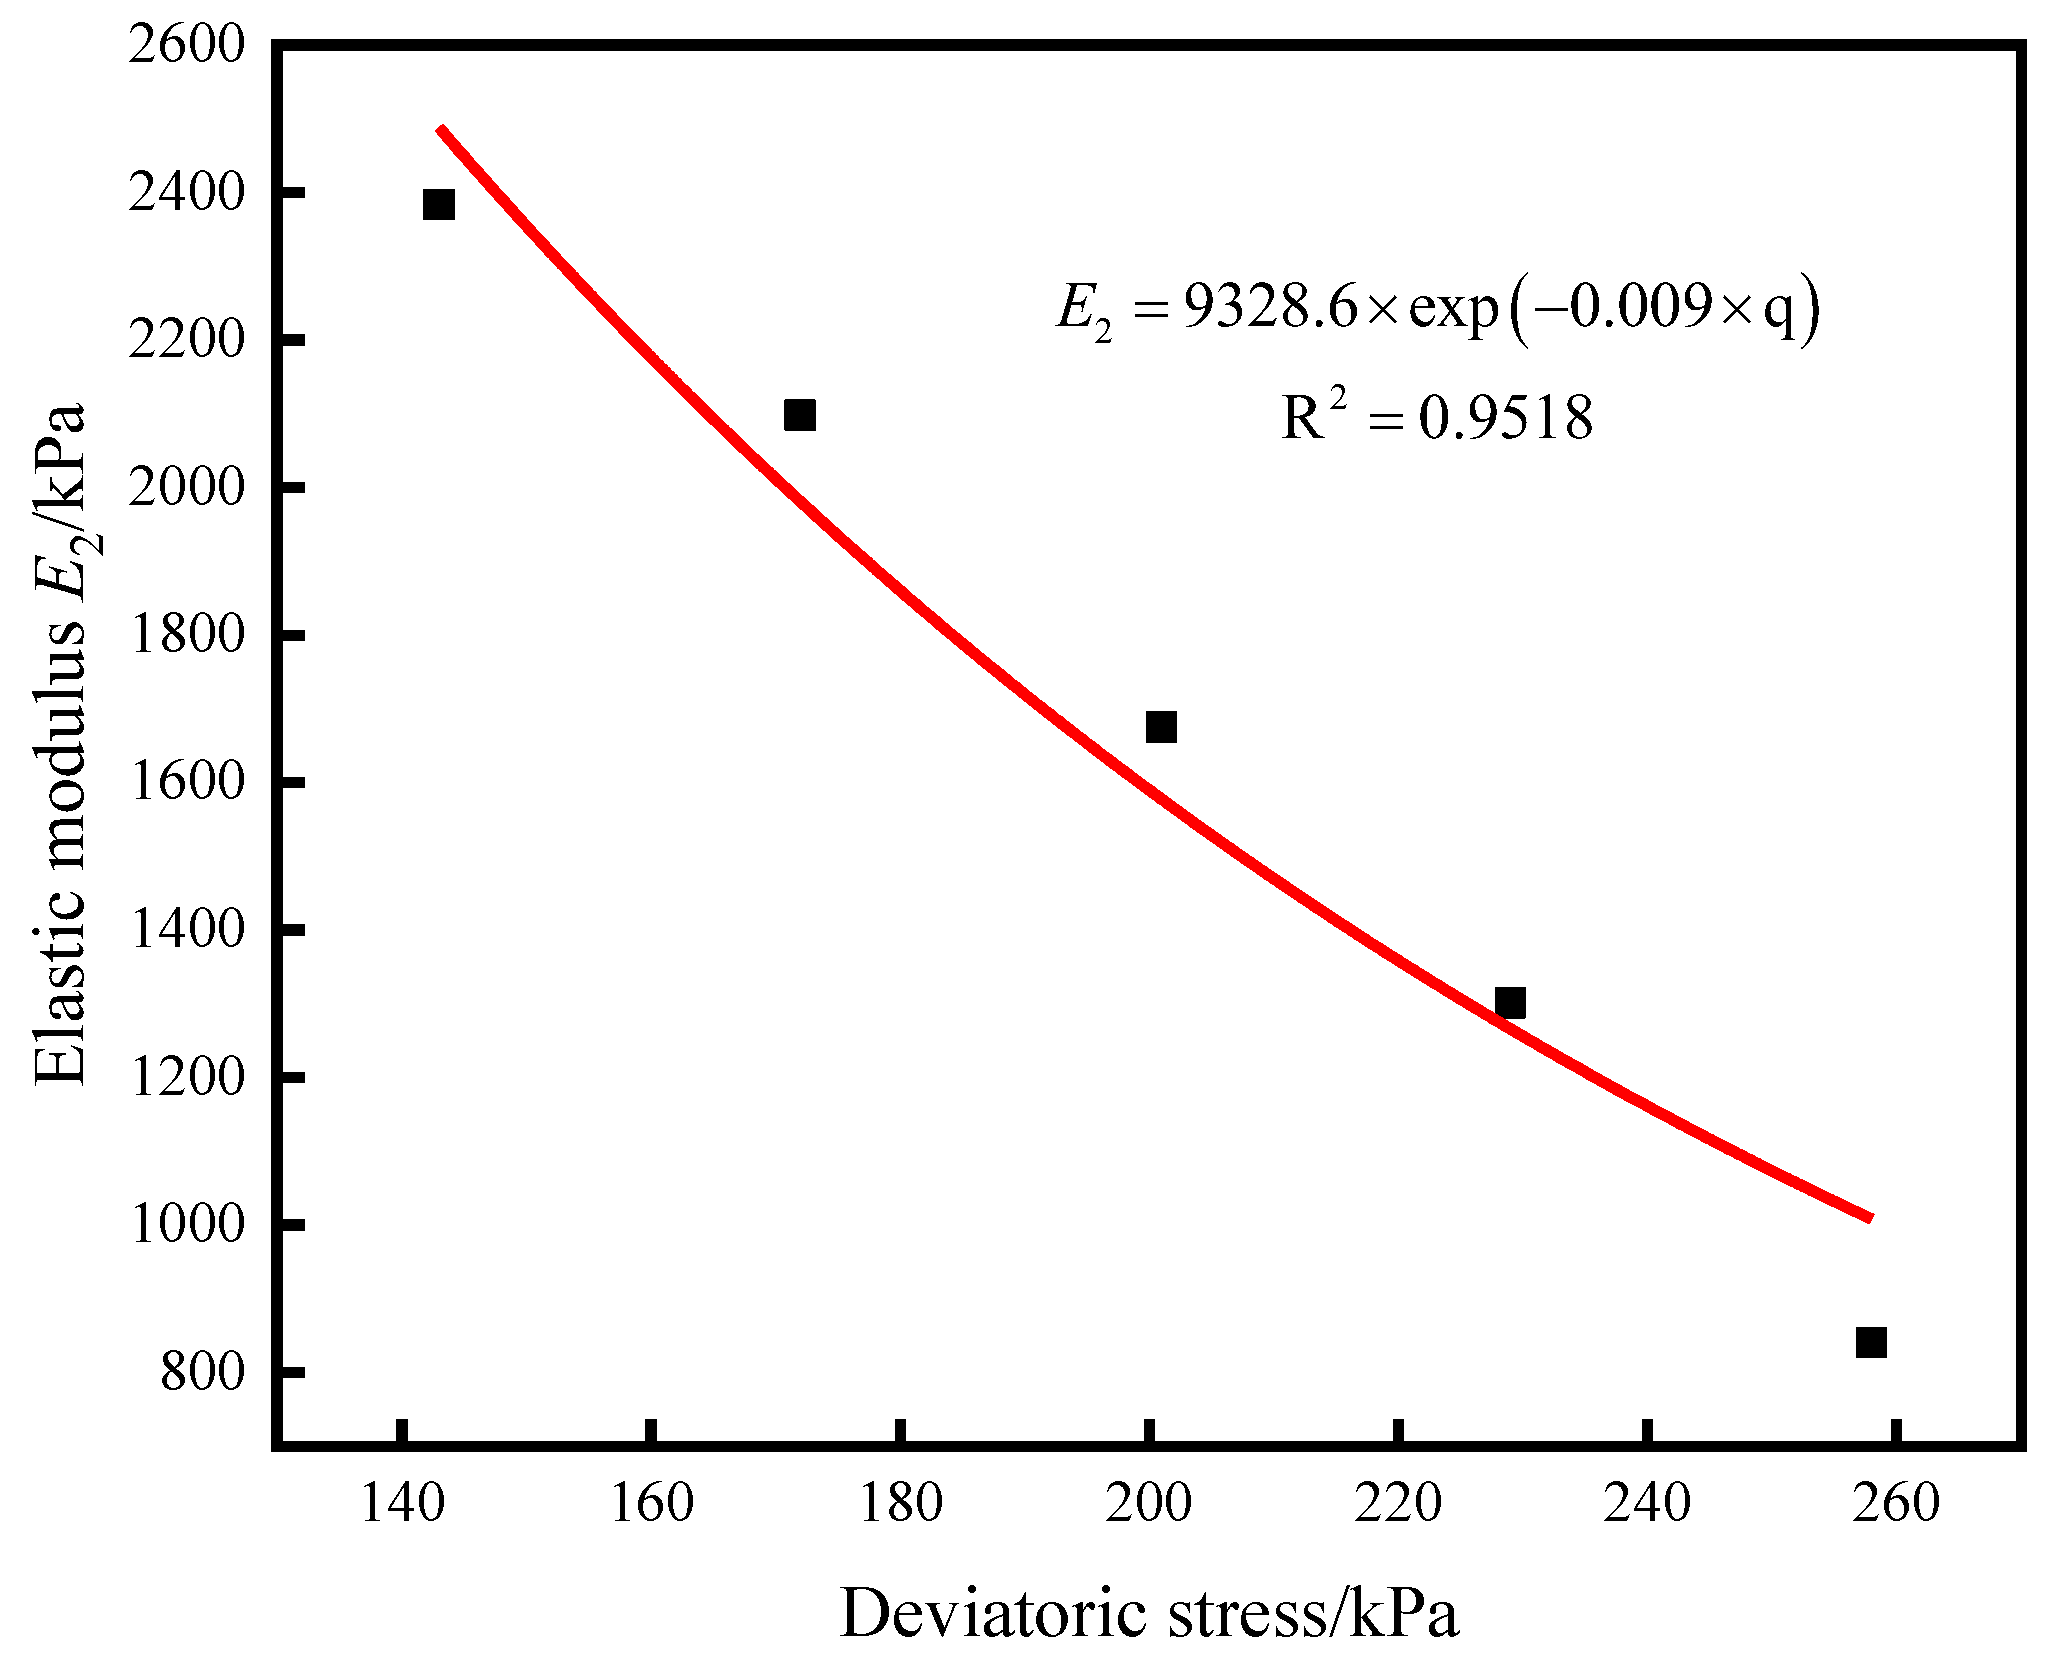
According to the above analysis, the strain produced with the Kelvin model approaches a constant value with increasing time under the action of the deviatoric stress, and the strain produced with the Kelvin model can be obtained by removing the creep strain at steady state. The strain produced with the Kelvin model corresponding to each deviatoric stress is shown in Table 4. It can be seen from Equation (4) that the elastic modulus is the ratio of deviator stress to strain , and the relationship between the elastic modulus and deviator stress q is approximately an exponential function, as shown in Figure 10. The empirical relationship can be obtained by fitting it to Equation (7).
Table 4.
Axial strain under different deviatoric stresses.
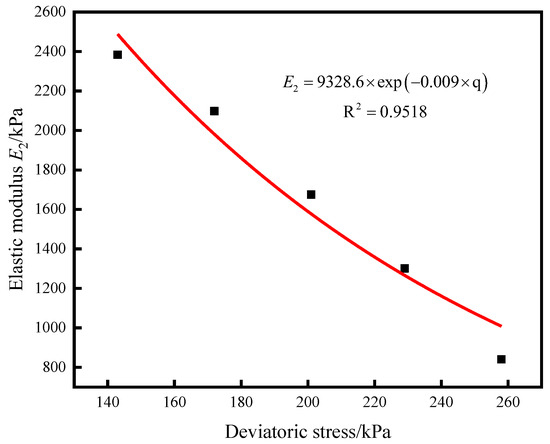
Figure 10.
Relation curve between elastic modulus and deviatoric stress q.
In the formula, , is the fitting coefficient and q is the deviator stress.
- (3)
- Coefficient of sticky pot
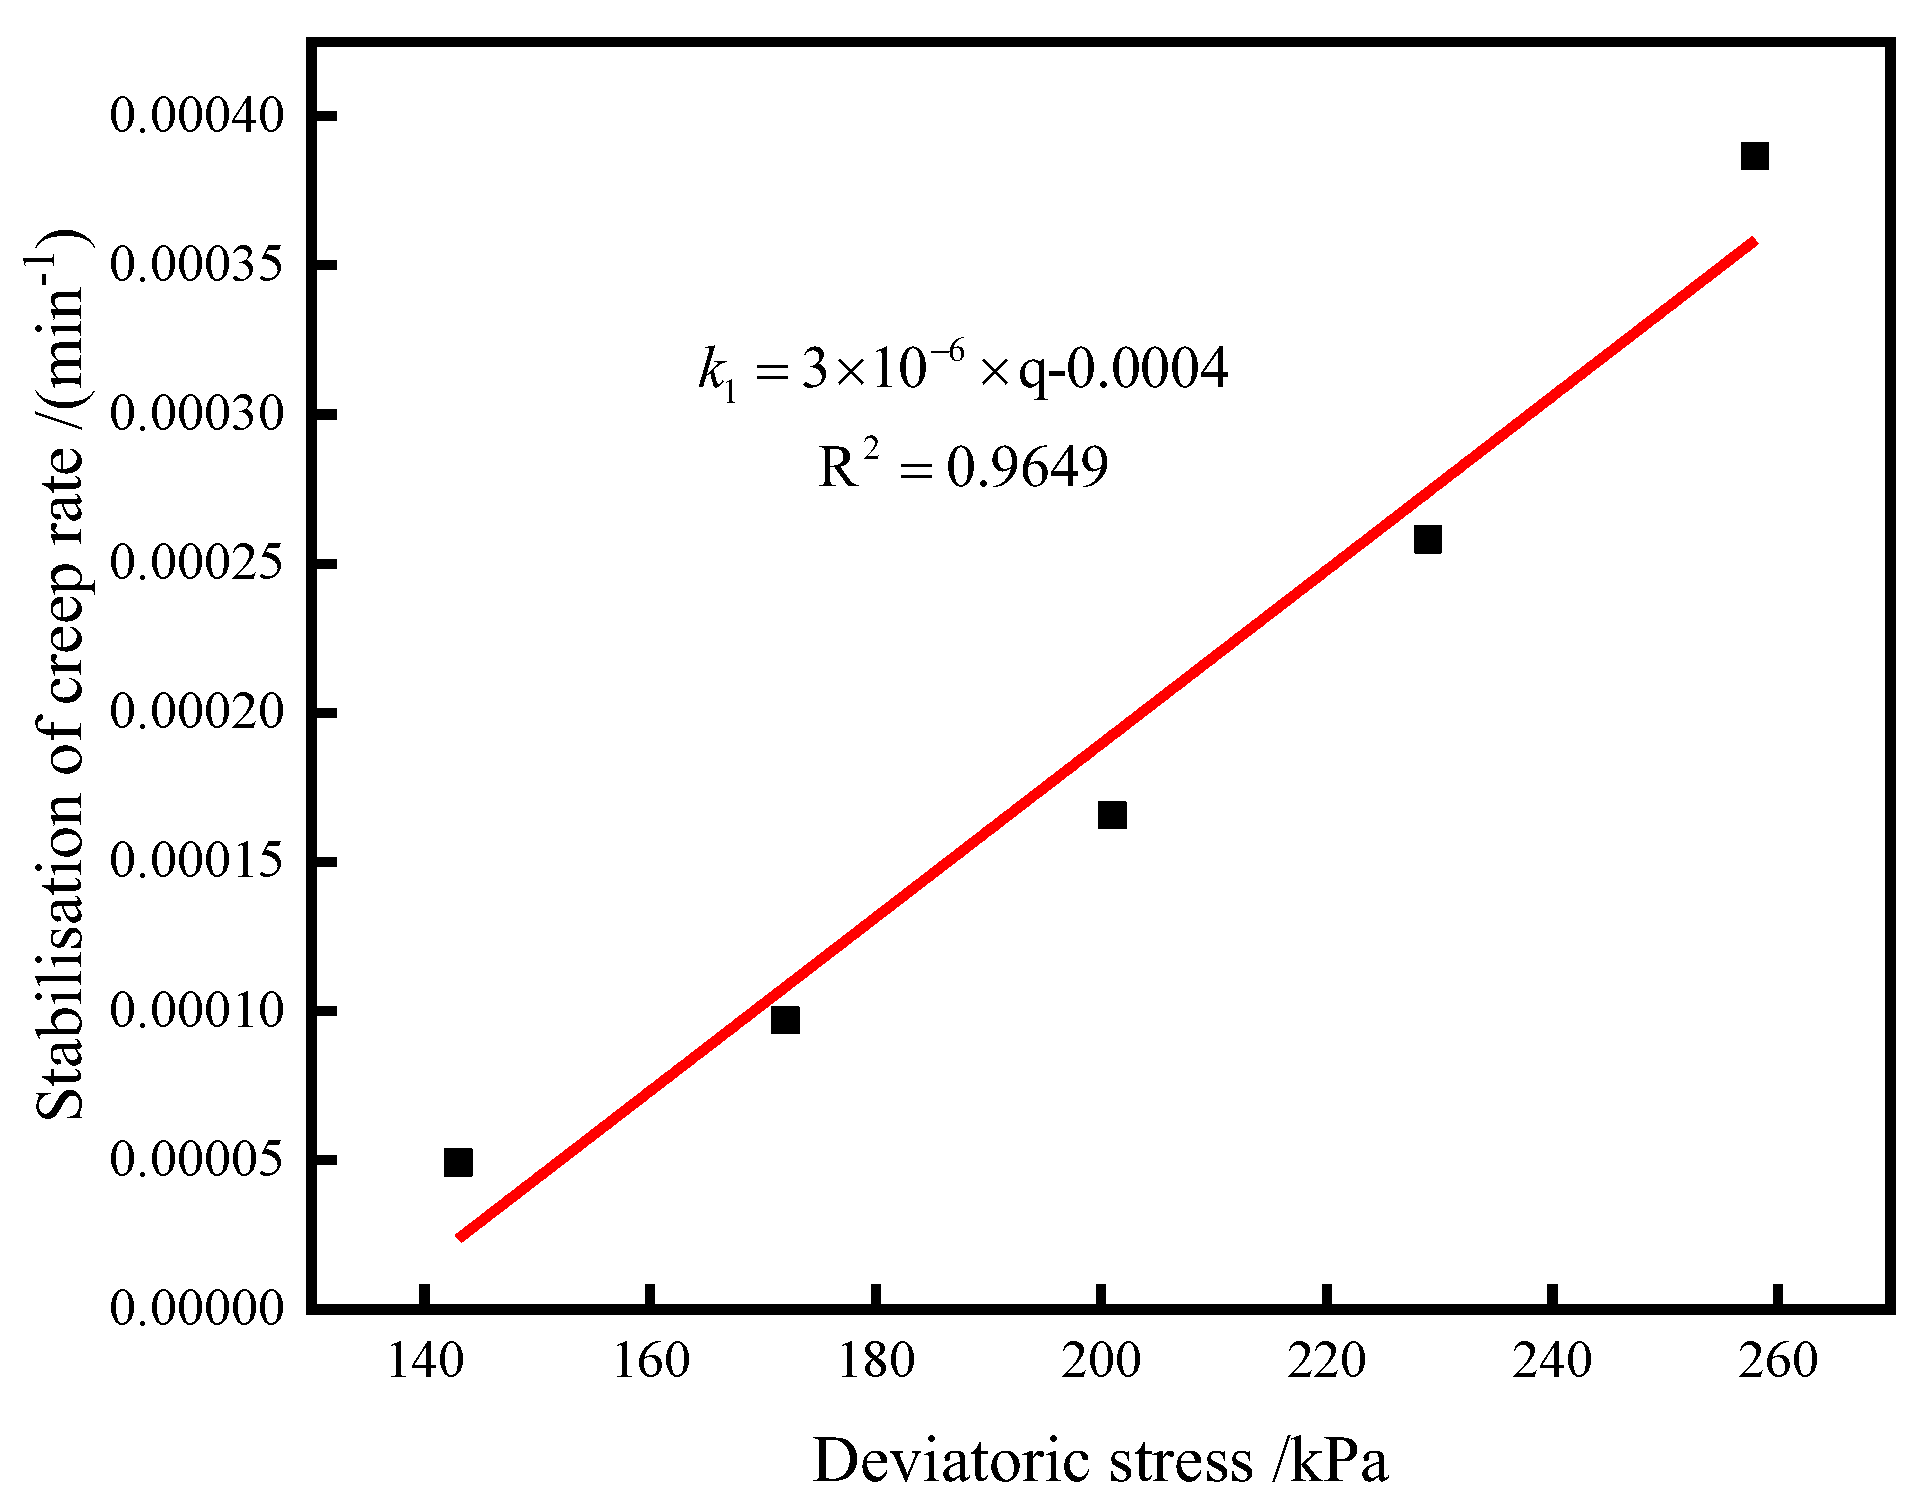
As can be seen from Figure 8, when the Kelvin model decays to a constant value, the sample enters a steady creep phase, at which time the creep rate remains unchanged, and the slope of the curve is . When , the creep curve is approximately a straight line, and the sample enters the steady creep phase. The steady state creep rates at various deviator stresses are shown in Table 5. The relationship between deviator stress and a steady creep rate is shown in Figure 11, which shows a linear functional relationship. An empirical relationship can be established by fitting it with Equation (8).
Table 5.
Stable creep rates corresponding to different deviatoric stresses.
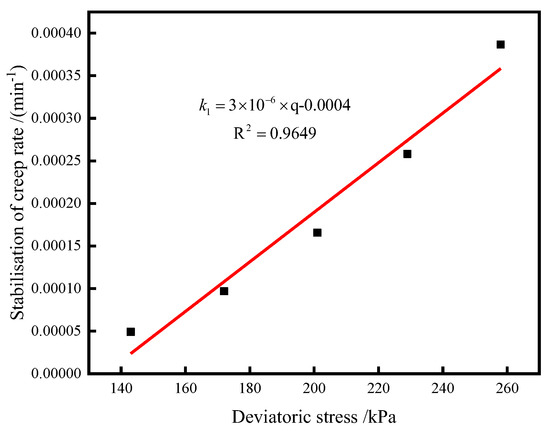
Figure 11.
Relation curve between steady creep rate and deviatoric stress q.
- (4)
- Coefficient of sticky pot
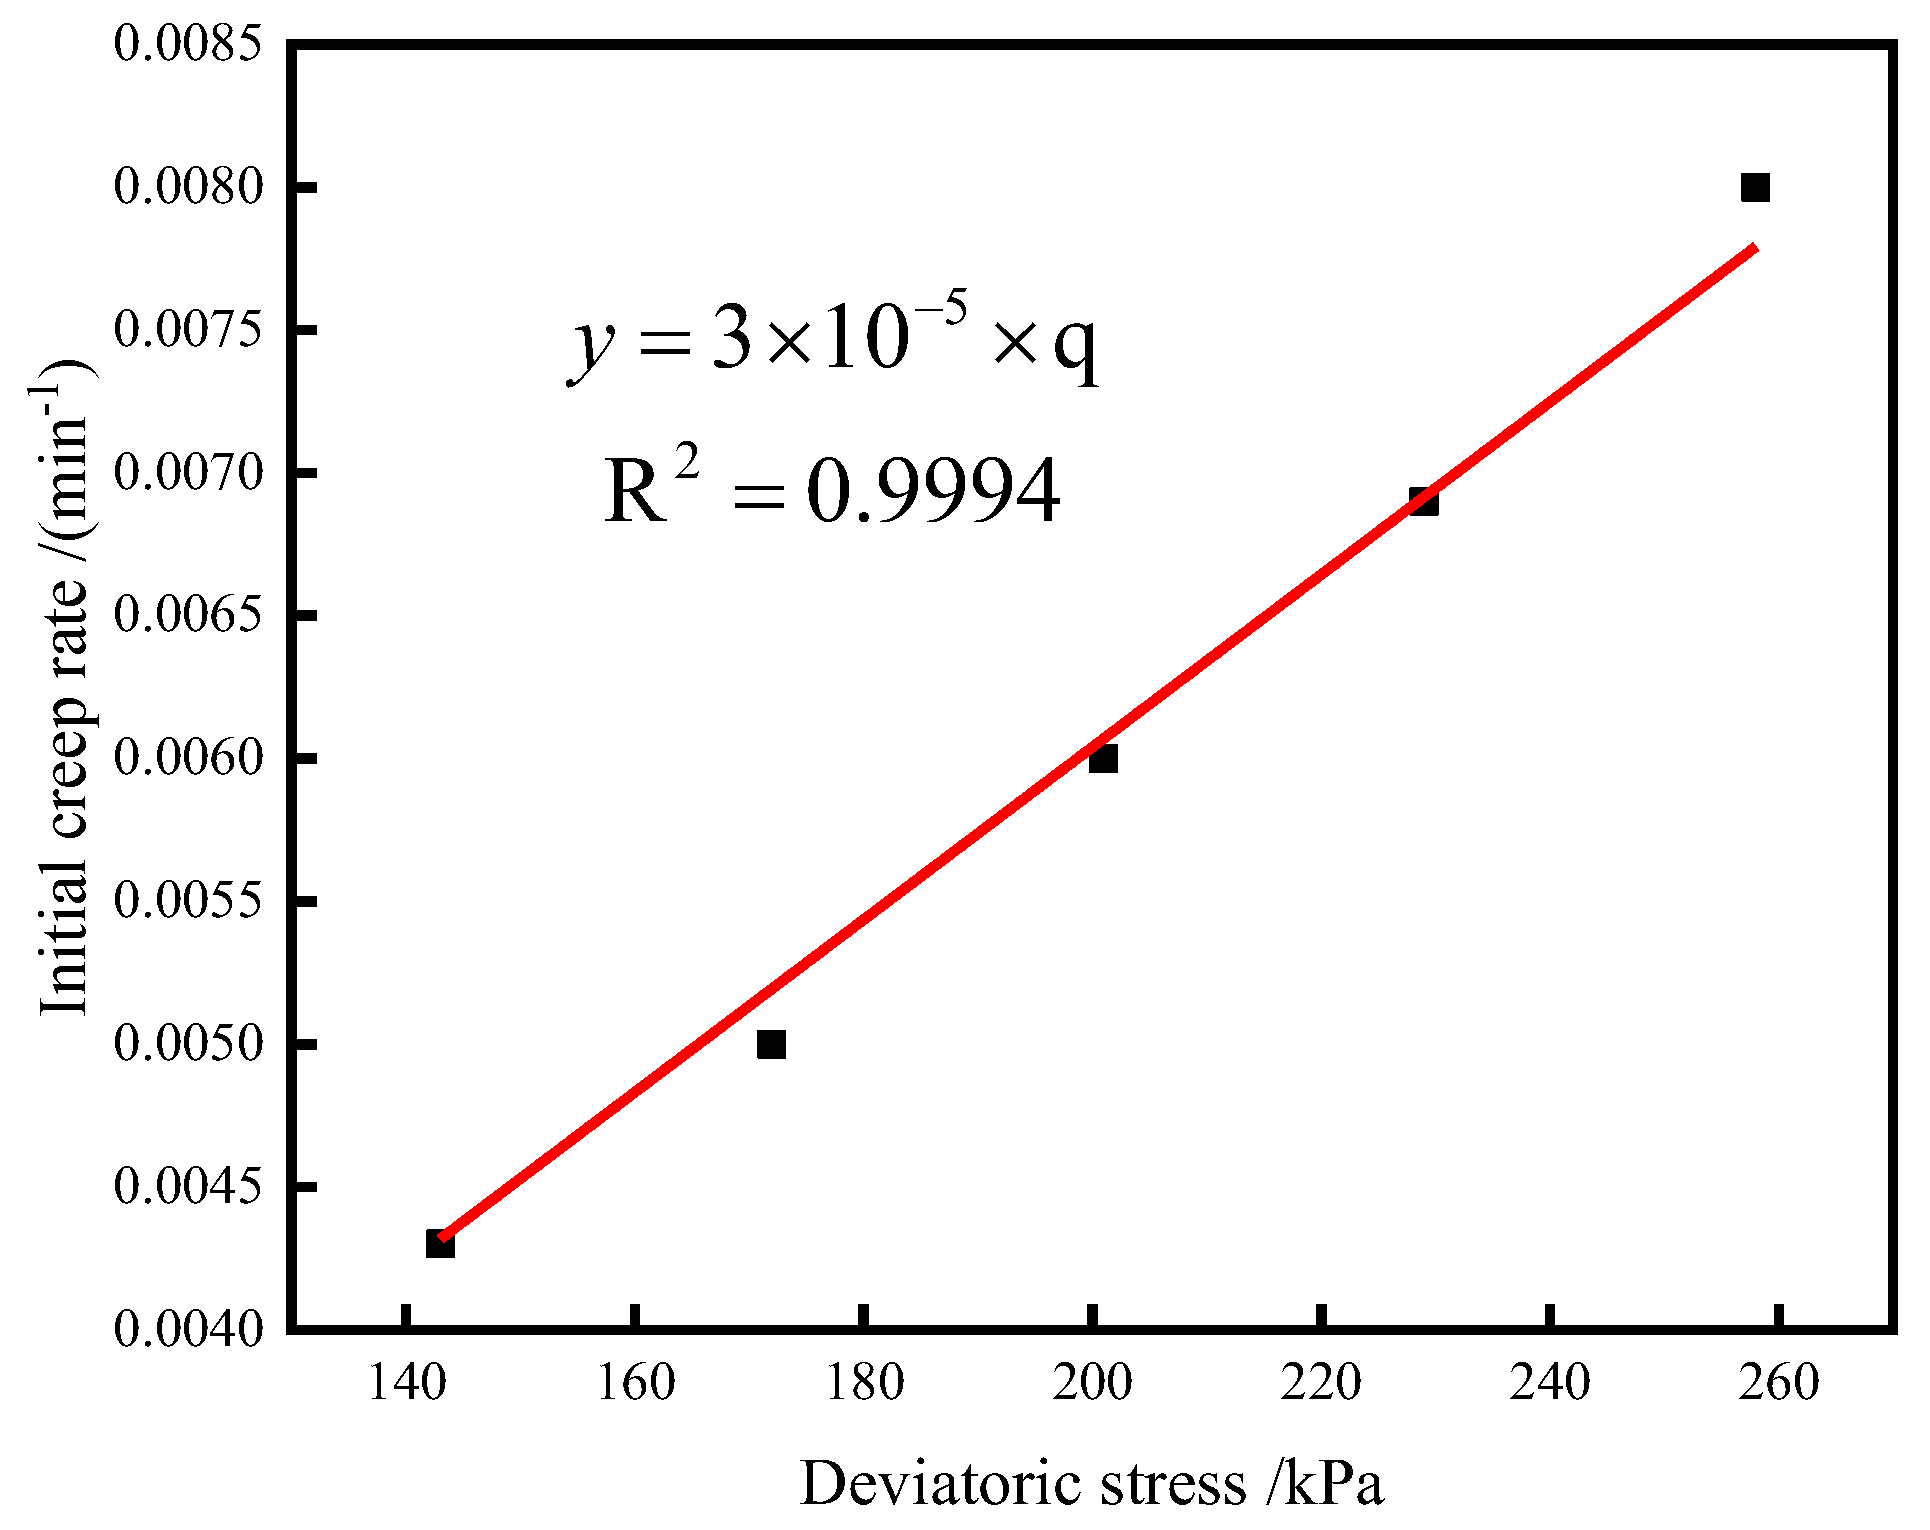
From Equations (3)–(5), it can be seen that the slope of the initial phase curve of yield creep is . The relationship between the initial creep rate (as shown in Table 6) and the deviator stress is shown in Figure 12, and the relationship between them is linear. By fitting it with a linear function, it can be seen that the slope of the linear function is .
Table 6.
Initial creep rate under various deviatoric stresses.
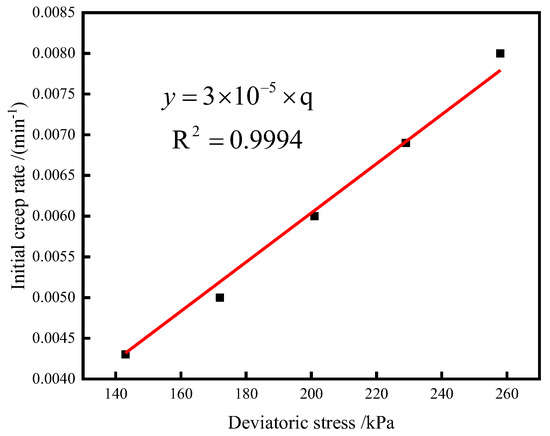
Figure 12.
Relationship between initial creep rate and deviatoric stress q.
After analysing the creep curves of red clay at other confining pressures using the method described above, the relationship between the Burgers model parameters , , , and and the deviatoric stress q at different confining pressures can be established. The obtained Burgers model parameters are shown in Table 7.
Table 7.
Parameters of the Burgers model under different cell pressures.
3.3. Model Validation
The parameters calculated using different cell pressures can be substituted into the Burgers model to obtain the fitting curve. A comparison of the test curve and the theoretical calculation of the curve is shown in Figure 13, respectively. The correlation coefficient of the two curves under all levels of deviatoric stress is calculated, as shown in Table 8. It can be seen that the correlation coefficient of the theoretical calculation curve and the test curve under each level of deviatoric stress is greater than 0.9, which suggests that the Burgers model can accurately describe the creep properties of red clay.
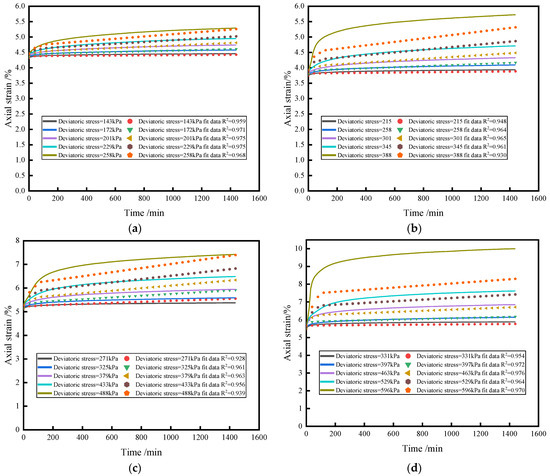
Figure 13.
Comparison between Burgers model curve and test curve under different cell pressures. (a) Cell pressure of 100 kPa. (b) Cell pressure of 200 kPa. (c) Cell pressure of 300 kPa. (d) Cell pressure of 400 kPa.
Table 8.
Correlation coefficients of curves under different cell pressures and deviatoric stresses.
As can be seen from Figure 13, when the applied deviatoric stress is 50~70% of the failure deviatoric stress, the fitted value is in good agreement with the experimental value. When the applied deviatoric stress is 80~90% of the failure deviatoric stress, the axial strain of the sample is obviously increased, which shows the phenomenon of delayed strain growth. The experimental curve and the fitted curve have an obvious growth trend, and the final axial strain value is close. The difference between the experimental curves and the fitted curves at 80–90% of the destructive deviatoric stress may be due to the strain generated with the Kelvin model when calculating the modulus of elasticity and the viscous kettle coefficient as well as the time required to enter the steady state creep phase being too small. In addition, the model has the characteristics of fewer model parameters and is easy to obtain, which makes it easier to use in engineering practice. It also provides a reference for the analysis of post-construction settlement control.
4. Conclusions
In this paper, triaxial shear and triaxial creep tests were carried out on red clay in the Guilin area under different cell pressures, and the internal friction angle, cohesion, and creep curves under different cell pressures and deviatoric stress levels were obtained. The Burgers’ model was used to analyse the creep characteristics of red clay, and the main conclusions are as follows:
- (1)
- The cohesion and angle of internal friction of red clay in Guilin were 57.20 kPa and 22.47°, respectively, as obtained from a triaxial shear test under different cell pressures. The graded loading scheme of the triaxial creep test was designed according to the destructive deviatoric stress of the sample, and the creep curves of red clay under different cell pressures were obtained.
- (2)
- Using “Chen’s loading method” to process the creep curves of the whole process, the triaxial creep curves of red clay were obtained separately. Based on the physical significance of the parameters in the Burgers model, a set of inversion methods for the model parameters was proposed, and the Burgers model parameters were obtained under different cell pressures and deviatoric stresses.
- (3)
- The curves calculated using the Burgers model were compared with the test curves, and the correlation coefficients were all greater than 0.9. The Burgers model has a good fitting effect and can accurately describe the creep characteristics of red clay in Guilin.
Author Contributions
This paper was written by H.W. in collaboration with all co-authors. Data were collected by H.W., Y.W. and Y.S. The first and final drafts were written by Z.G. and H.W. The results were analysed by Z.G. and H.W. The research and key elements of the models were reviewed by Z.L. The writing work for corresponding parts and the major revisions of this paper were completed by Z.G. and Z.L. All authors have read and agreed to the published version of this manuscript.
Funding
This research was funded by the Key R&D and Promotion Projects in Henan Province (tackling key problems in science and technology) (Grant No. 232102321010) and the Foundation of Technical Innovation Center of Mine Geological Environmental Restoration Engineering in Southern Area (Grant No. CXZX2020002).
Institutional Review Board Statement
Not applicable.
Informed Consent Statement
Not applicable.
Data Availability Statement
The research data in the paper can be obtained from Zhanfei Gu by email.
Conflicts of Interest
The authors declare no conflict of interest.
References
- Gu, Z.; Zhao, X.; Zhang, M. Experimental study on strength characteristics and microstructure of fiber-reinforced red clay. J. North China Univ. Water Resour. Electr. Power (Nat. Sci. Ed.) 2023, 1–8. Available online: http://kns.cnki.net/kcms/detail/41.1432.tv.20230313.1521.002.html (accessed on 24 September 2023).
- Gu, Z.; Wei, H.; Liu, Z.; Zhang, M. Dynamic response mechanism of silt ground under vibration load. Sustainability 2022, 14, 10335. [Google Scholar] [CrossRef]
- Yuan, J.; Wang, Y.; Wang, X.; Chen, Y.; Gong, X.; Chen, T. Research on Creep Properties Experiment and Numerical Simulation of Soda Residue Soil. China Civ. Eng. J. 2023, 1–10. [Google Scholar] [CrossRef]
- Chang, L.; Wang, H.; Wang, Y.; Cao, J. Influence of sand content on one-dimensional creep behavior of sand-fine mixtures. Rock Soil Mech. 2023, 44, 1–14. [Google Scholar] [CrossRef]
- Ruan, Y.; Zhu, S.; Zhu, Q.; Wu, L.; Ding, H. Study on creep characteristics and model of plateau lacustrine peat soil. Chin. J. Undergr. Space Eng. 2022, 18, 779–787. [Google Scholar]
- Zhou, J.; Zhao, F.; Yuan, X.; Zhu, Y.; Song, F. Creep process and the microstructural evolution of sliding-zone soil. Hydrogeol. Eng. Geol. 2020, 47, 115–121. [Google Scholar] [CrossRef]
- Yang, A.; Yang, S.; Liang, C.; Feng, A. Research on creep and long-term strength characteristics of solidified dredger mud. J. Nat. Disasters 2020, 29, 28–35. [Google Scholar] [CrossRef]
- Li, J.; Kong, L. Creep properties of expansive soil under unloading stress and its nonlinear constitutive model. Rock Soil Mech. 2019, 40, 3465–3473. [Google Scholar] [CrossRef]
- Li, D.; Yang, X.; Chen, J. A study of Triaxial creep test and yield criterion of artificial frozen soil under unloading stress paths. Cold Reg. Sci. Technol. 2017, 141, 163–170. [Google Scholar] [CrossRef]
- Cong, S.; Nie, Z.; Li, X.; Tang, L.; Ling, X.; Hu, Q.; Li, G. Prediction of compressive creep behaviors of expansive soil exposed to freeze-thaw cycle using a disturbed state concept-based model. Cold Reg. Sci. Technol. 2022, 204, 103664. [Google Scholar] [CrossRef]
- Guan, S.; Wang, L.; Sun, C. Study on fractional damage creep constitutive model of slip zone soil. J. Liaoning Tech. Univ. Nat. Sci. 2019, 38, 52–57. [Google Scholar] [CrossRef]
- Xue, K.; Wang, S.; Hu, Y.; Li, M. Creep Behavior of Red-Clay Under Triaxial Compression Condition. Front. Earth Sci. 2020, 7, 345. [Google Scholar] [CrossRef]
- Luchao, G.; Guoliang, D.; Zhihui, W.; Mingxing, Z.; Wenbo, Z. Prediction of triaxial drained creep behaviors of interactive marine-terrestrial deposit soils by fractal derivative. Eur. J. Environ. Civ. Eng. 2022, 26, 3065–3078. [Google Scholar] [CrossRef]
- Zhang, X.; Hu, X.; Liu, Z.; Liu, C.; Wu, S. Creep properties and stability of sliding zone soil in Gapa landslide. Bull. Geol. Sci. Technol. 2020, 39, 145–153. [Google Scholar] [CrossRef]
- Shahbodagh, B.; Mac, T.N.; Esgandani, G.A.; Khalili, N. A Bounding Surface Viscoplasticity Model for Time-Dependent Behavior of Soils Including Primary and Tertiary Creep. Int. J. Geomech. 2020, 20, 04020143. [Google Scholar] [CrossRef]
- Xiang, G.; Yin, D.; Cao, C.; Gao, Y. Creep modelling of soft soil based on the fractional flow rule: Simulation and parameter study. Appl. Math. Comput. 2021, 403, 126190. [Google Scholar] [CrossRef]
- Li, N.; Chen, C.; Zhu, S.; Mao, F. Research on creep characteristics and creep model of red clay considering effect of dry density. J. Cent. South Univ. (Sci. Technol.) 2020, 51, 2174–2182. [Google Scholar] [CrossRef]
- Pingping, S.; Maosheng, Z.; Tianfeng, G.; Mengmeng, L.; Xinyue, D.; Yunfeng, Z. Creeping characteristics of northern red clay under controlled matric suctions. J. Eng. Geol. 2020, 28, 500–509. [Google Scholar] [CrossRef]
- Yang, A.; Yang, S.; Wang, Z.; Zhang, X.; Wang, Y. Long-Term Mechanical Properties of Solidified Municipal Sludge Under Freeze-Thaw Cycles. J. Basic Sci. Eng. 2023, 31, 65–80. [Google Scholar] [CrossRef]
- Wang, X.; Liu, K.; Wang, Y.; Wang, P.; Shi, W.; Luo, L. An experimental study of the creep characteristics of loess landslide sliding zone soil with different water content. Hydrogeol. Eng. Geol. 2022, 49, 137–143. [Google Scholar] [CrossRef]
- Wang, Q.; Kang, J.; Zhang, B.; Wei, X.; Xiao, N.; Xiang, Y. Experimental study on creep and particle breakage characteristics of railway coarse-grained soil filler. Railw. Stand. Des. 2023, 68, 1–9. [Google Scholar] [CrossRef]
- Zeng, Z.T.; Pan, B.; Wu, Y.D.; Zhang, B.H.; Liang, Z. Influence Mechanism of Bound Water on Shear Strength Characteristics of Lateritic Clay. Chin. J. Undergr. Space Eng. 2022, 18, 1565–1572+1579. [Google Scholar]
- Li, S.; Riad, B.; Zhang, X.; Liu, Z. Characterization and constitutive modeling of red clay contaminated with ammonium carbonate. Int. J. Numer. Anal. Methods Geomech. 2020, 44, 2329–2357. [Google Scholar] [CrossRef]
- Xu, X.; Zhang, F.; Hou, J.; Zhang, M.; Yang, H.; Dong, C. Study on creep characteristics and the fractional creep constitutive model of loess in ning-meng reach. J. North China Univ. Water Resour. Electr. Power Nat. Sci. Ed. 2023, 1–8. Available online: https://kns.cnki.net/kcms/detail/41.1432.TV.20230322.1059.004.html (accessed on 27 August 2023).
- Changfu, C.; Shimin, Z.; Fengshan, M.; Genbao, Z. Characterization and modelling of coupled consolidation-creep behavior of red clay. J. Eng. Geol. 2019, 27, 723–728. [Google Scholar] [CrossRef]
- Qin, P.; Zheng, W.; Xue, Z.; Wang, L.; Lv, X. Study on creep characteristics of straw reinforced loess and Modified Burgers model. Adv. Eng. Sci. 2023, 1–11. [Google Scholar] [CrossRef]
Disclaimer/Publisher’s Note: The statements, opinions and data contained in all publications are solely those of the individual author(s) and contributor(s) and not of MDPI and/or the editor(s). MDPI and/or the editor(s) disclaim responsibility for any injury to people or property resulting from any ideas, methods, instructions or products referred to in the content. |
© 2023 by the authors. Licensee MDPI, Basel, Switzerland. This article is an open access article distributed under the terms and conditions of the Creative Commons Attribution (CC BY) license (https://creativecommons.org/licenses/by/4.0/).