Abstract
Many variables in the production of direct 3D-printed orthodontic aligners are currently tested to obtain an efficient and safe workflow. The aim of the present study was to investigate the effect of different curing times on the final thickness of the produced aligners. In total, 35 copies of the same aligner with a set thickness of 0.5 mm were directly 3D printed using the instructions provided by the manufacturer. Seven groups (five aligners each) were created. Six groups were post-cured with a nitrogen generator for, respectively, 15 min, 20 min, 25 min, 30 min, 40 min, and 50 min. The last group was cured for 30 min without the nitrogen generator. All aligners were scanned with a micro-CT scanner. To assess local aligner thickness values, a total of 20 reference points were utilised. The comparisons among groups and locations were performed using ANOVA or the Kruskal–Wallis test. Significant differences in thickness were found at various reference points. No impact on curing time was found. No direct association was found between curing time and thicknesses, nor between nitrogen generator usage and thickness. At a 60° printing inclination and following the prescribed centrifugation process, a local thickness increase on the front teeth was observed.
1. Introduction
A novel resin material for direct 3D printing of clear aligners has been recently introduced [1] and tested for cytotoxicity and estrogenicity [2,3]. Recently, it received approval for biocompatibility from the Korean and United States Food and Drug Administration [4].
Tera Harz TC-85 (Graphy Inc., Seoul, Republic of Korea) exhibited the capability of delivering light forces, with a reduced force decay induced by repeated insertion of the clear aligners and geometric stability at high temperatures [5].
In order to maintain biocompatibility and to obtain an effective appliance, the production process needs to carefully follow the processing protocol indicated by the manufacturing company, which disciplines not only the printing stage, but also the resin excess removal, the support removal, and the post-curing phase; each of these passages can have an impact on the surface characteristics and on the final mechanical properties of the product.
Since a standardised production workflow can avoid errors and lead to an efficient and time-saving in-office aligner production, several studies have been conducted to test the effect of different variables on the final product.
Zinelis et al. compared the mechanical properties of orthodontic aligners among different commercially available 3D printing devices and reported that the mechanical properties of 3D-printed orthodontic aligners were dependent on the 3D printer used [6].
Boyer et al. concluded that the print orientation affected the dimensional accuracy of directly 3D-printed orthodontic aligners. Particularly, they recommended the three-dimensional printing of orthodontic aligners at a 90° angle owing to an improved dimensional accuracy of the intaglio surface, and also because a maximum number of aligners could be printed per job [7]. However, it has to be noted that this recommendation is not in line with the manufacturer’s recommendations.
Another study took into consideration the fidelity of 3D printing technology and concluded that direct 3D printing was associated with an increased wall thickness of approximately 0.2 mm [8].
Cole et al. report that the dimensional accuracy of thermoformed and 3D-printed aligners ranged from 0.1 to 0.3 mm and from 0.1 to 0.4 mm, respectively [9]. Mc Carty and colleagues reported that 40 vs. 20 min of curing time had no impact on the dimensional accuracy of direct-printed passive clear aligners, as revealed by comparing surface distances among optical scans of the printed ones and the digital master [10].
However, difficulties were encountered in all studies involving optical scanning and superimposition techniques, because a spray application is required to collect the image of the transparent and reflective aligner surface, potentially leading to errors in the accuracy evaluation. On the other hand, a non-demolishing and precise method to assess thickness is available by means of micro-computed tomography, which has already been used to assess the aligner’s geometrical characteristics [11,12,13,14]. To the best of our knowledge, no study has already used it to assess the impact of curing conditions on the final thickness of 3D-direct-printed aligners.
The aim of the present study was to investigate the effect of different curing times on the final thickness of direct 3D-printed aligners via micro-CT scanning. The null hypothesis was that different curing times have no impact on the final thicknesses of direct 3D-printed aligners. As secondary outcomes, the effect of nitrogen usage and variations in thicknesses among different tooth types and locations were evaluated.
2. Materials and Methods
This study included in-office produced 3D-printed aligners of the upper jaw, and the printing and post-processing were performed by the same operator. No ethical approval was required for this in vitro experiment.
2.1. Virtual Setup
For the in-office aligners set up, the Aligner module from the OnyxCeph® (Onyxceph, Chemnitz, Germany) software (https://onyxceph.eu/en/) was utilised. Starting from the 3D T0 digital model of a mild orthodontic case, the position of teeth was planned following aesthetic and functional principles. Aligning and levelling of dental arches were performed following orthodontic biomechanical principles. Every single aligner had a planned movement of 0.2 mm linear displacement, 2° long-axis rotation, and facial-lingual inclination of 2.5°. Then, a single step of the planned treatment was randomly selected and the same one was used for printing in all groups. In particular, neither cut outs for auxiliaries, such as elastics, temporary anchorage devices, or sectional vestibular appliances, nor attachments, power ridges, and bite ramps were included.
2.2. Aligner Production
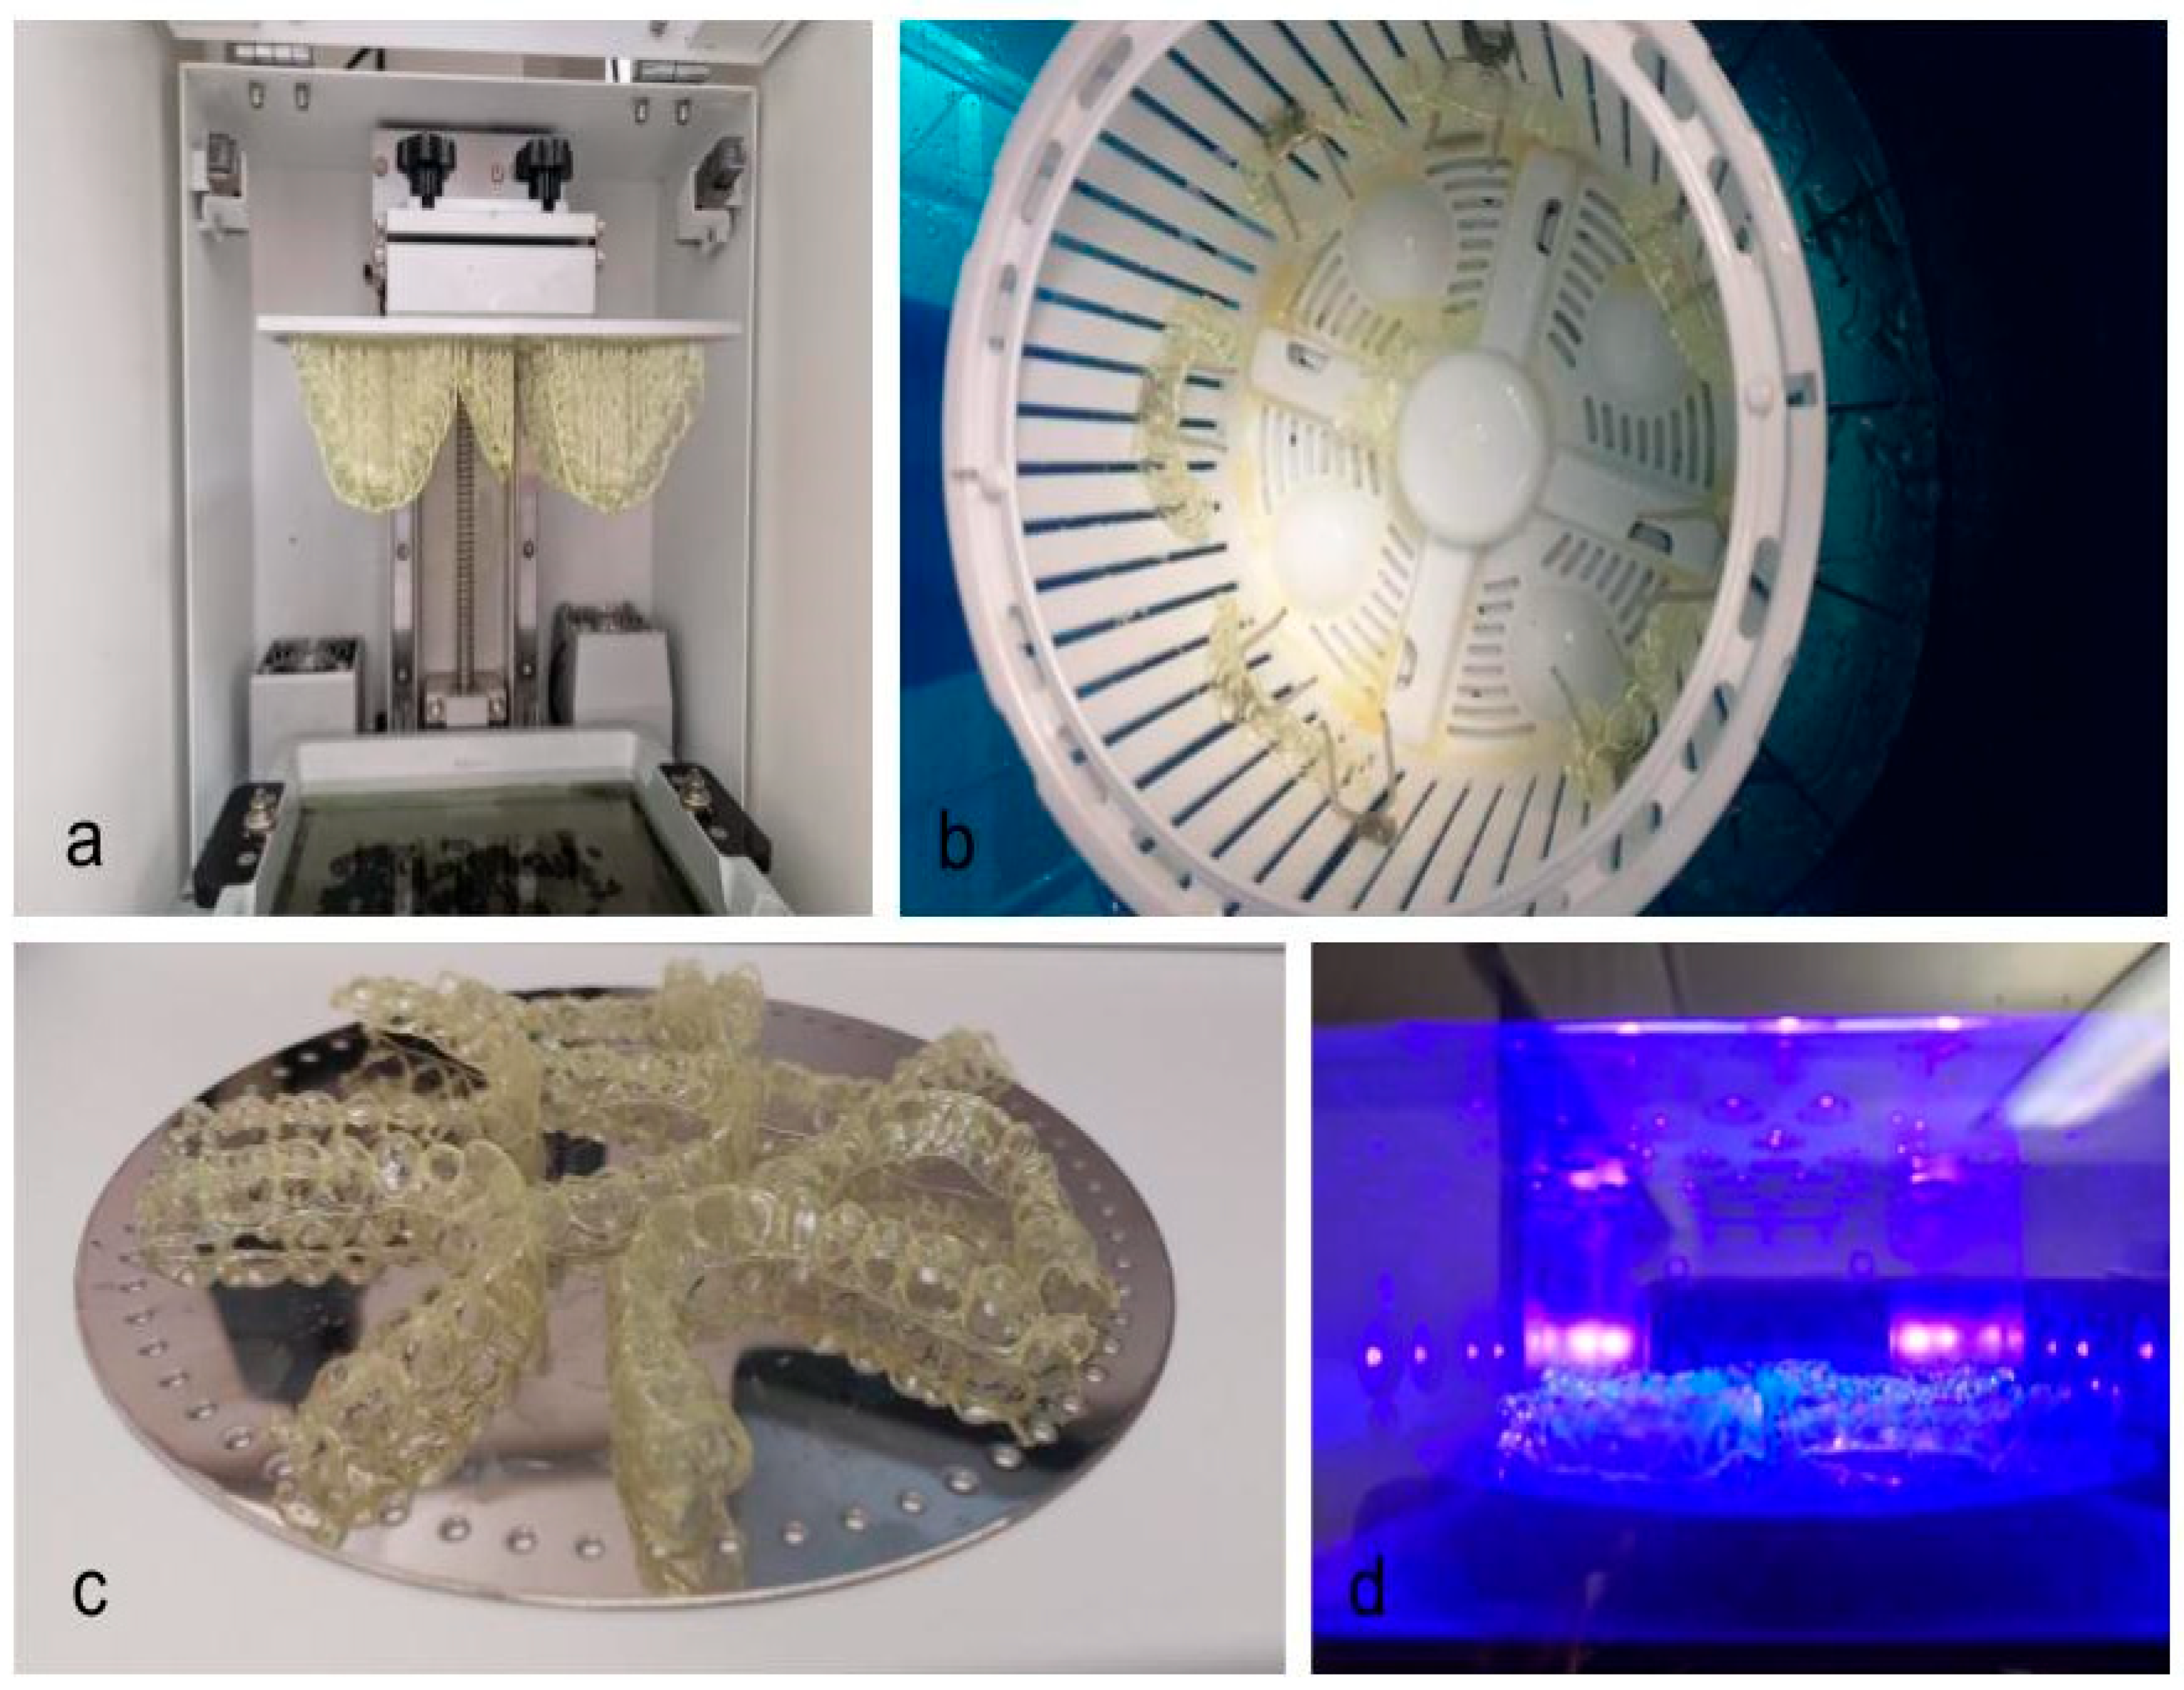
The Tera Harz TC-85 (Graphy Inc., Seoul, Republic of Korea) was used for aligner production and aligners were directly 3D printed using the instructions provided by the manufacturer. Hereby, the Phrozen Sonic XL 4k 2022 printer (Phrozen Technology, Hsinchu, Taiwan) was employed for the printing. The aligners were designed with the thickness recommended by the producer (0.5 mm), and an offset of 0.05 mm was set between the aligner and the model. Printing was conducted in successive layers of 100 µm, with a down speed of 200 and a delay of 1000 ms. The first 6 layers were cured for 30 s. The height was 8 mm and the up speed was 100. The following layers were cured for 4 s with a 7 mm height and an up speed of 100. Supports were designed and planned using the Uniz software, Version 2.6.1.11 (Uniz, San Diego, CA, USA) to ensure the correct position with an angulation of 60° on the printer plate (Figure 1). When the printing process was terminated, aligners were removed from the plate and then the supports were manually removed.
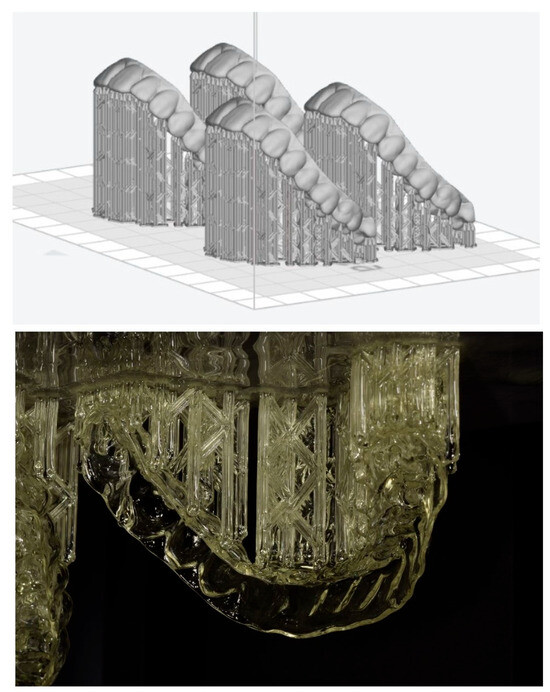
Figure 1.
Support design and printed samples.
The resin excesses were accurately removed from the intaglio surface using a centrifuge spinning at 1000× g revolutions per minute, which was used for 5 min two times. Thereafter, aligners were divided into 7 groups (Table 1). Each group consisted of 5 aligners and were post-cured (Figure 2) according to a different curing time in a post-curing unit (Cure M, Graphy, Seoul, Republic of Korea). In total, 6 groups out of 7 were post-cured with a nitrogen generator, the 7th one was cured without a nitrogen generator. Curing times were the following: 15 min, 20 min, 25 min, 30 min, 40 min, and 50 min. The group without the nitrogen generator was cured for 30 min. After curing, aligners were put in boiling water at 100 °C for 2 min.

Table 1.
Group production characteristics and composition.

Figure 2.
3D printing process. (a) printed aligners; (b) aligners in the spinner basket; (c) aligners before curing; (d) aligners in the curing unit.
2.3. Micro-Computed Tomography and Image Processing
Aligners underwent scanning using a micro-CT scanner (VivaCT 80, Scanco Medical AG, Wangen-Brüttisellen, Switzerland) at 45 kVp, 88 μA, with an integration time of 254 ms. The resultant scans were reconstructed to attain a nominal isotropic voxel size of 31.2 μm. Image processing was performed with an in-house developed script using the Image Processing Language (IPL) from Scanco Medical AG. This script executed a series of sequential steps.
Initially, a cylindrical volume of interest (VOI) was defined at the outer margin of the field of view. Thereafter, image filtering was accomplished through the application of a Gaussian filter with a sigma of 0.8 voxel and a support of 1 voxel. Subsequently, segmentation of the aligners was carried out utilising a threshold set at 4.2% of the maximum grey value. Aligner thickness was then calculated using the 3D Chamfer distance transform approach [15]. This approach calculates the outer contours of a segmented material and assigns the approximated Euclidean distance to its closest contour point as a grey value to every point within the segmented structure. Finally, for visualization purposes, the calculated aligner thickness values were displayed using a 3D rendering program (uct_3d, Scanco Medical AG, Wangen-Brüttisellen, Switzerland).
2.4. Thickness Measurements
To assess local aligner thickness values, a total of n = 20 reference points were defined (Table 2). At each reference point, the respective local thickness was recorded.
Table 2.
Reference points for assessment of local aligner material thickness values.
2.5. Statistical Analysis
To verify the normality of data, the Shapiro–Wilk test was used. Continuous variables are reported as means ± standard deviations (SD) or medians with interquartile range [IR] (whenever not normally distributed). Categorical variables are reported as a number and/or percentage. Additionally, when the data results were normally distributed, Levene’s test for homogeneity of variances and the normality of residuals were validated.
The Spearman’s rank correlation test was used to test for the association between the mean aligner thickness values and the respective curing time.
For each reference point, a comparison of local thickness values among groups (curing times: 15 min, 20 min, 25 min, 30 min, 40 min, and 50 min) was performed by ANOVA (if all assumptions could be validated) or the Kruskall–Wallis test, followed by the Mann–Whitney U-test with Bonferroni’s correction for multiple comparisons when appropriate.
For the 30 min curing groups, comparisons between groups with and without nitrogen generator usage were carried out for each reference point using the Student’s t-test (in case of normal distribution), or the Mann–Whitney U-test (if normality failed), adjusted by using Bonferroni’s method.
The Kruskall–Wallis test was utilised to compare the standard deviations of aligner thicknesses (representing aligner thickness heterogeneity) among groups.
Comparison among tooth types and sites was performed using the Kruskall–Wallis test followed by the Mann–Whitney U-test with Bonferroni’s correction for multiple comparisons.
Differences with a p-value <0.05 were selected as significant. Data were acquired and analysed in the R v4.2.2 software environment [16].
3. Results
3.1. Impact of Curing Time
The thickness values of 35 aligners (5 per curing time or conditions) at 40 different reference points entered the analysis. The maximal recorded thickness was 0.89 mm, and the minimal was 0.51 mm.
According to Spearman’s rank correlation test, no significant association was found between thickness values and curing time (p = 0.0617). Despite this, when repeating the test for the individual reference points, at some locations there was a trend for reduced thickness at higher curing times, i.e., at 1.5 B (ρ = 0.466, p = 0.009), 1.5 p (ρ = −0.451, p = 0.013), and 1.6 MP (ρ = 0.386, p = 0.039).
When comparing the local thickness values at reference points among curing time groups, significant differences were found at 1.6 MP, 1.6 DB, 1.5 B, 1.5 P. 1.5 FIS, 1.4 FIS, 1.2 I, 1.2 V, 1.1 V, 2.6 MB, 2.6 DP, 2.6 V, 2.5 P, 2.4 B, 2.3 I, 2.2 I, 2.1 I, and 2.1 V (see Table 3 for details and p-values). The post hoc tests failed to reveal significant pairwise differences. However, it has to be noted that interquartile ranges varied across groups and locations, whereas within groups and locations, very small ranges were observed (the respective plots are provided in the Supplemental Materials).
Table 3.
Overall local thickness values at reference points and for the different curing time groups. Results are expressed in mm as Mean ± Standard Deviation or Median [Interquartile Range]. p-value: ANOVA or Kruskall–Wallis test p-value; MB: mesiobuccal cusp tip; MP: mesiopalatal cusp tip; DB: distobuccal cusp tip; DP: disto-palatal cusp tip; FIS: mesiodistal centre of the central fissure; V: central point of the facial surface; B: buccal cusp tip; P: palatal cusp tip; I: most coronal, central point of the incisal edge.
3.2. Impact of Nitrogen Generator
A significant difference between the group with a 30 min curing time with a nitrogen generator and the same curing time group without a nitrogen generator was found (median value 0.66 mm IR [0.42, 0.94] and 0.61 mm IR [0.47, 0.89], respectively, Mann–Whitney U-test p-value = 0.004). Particularly, significant differences were found at the following reference points: 1.6 MP, 1.5 FIS, 1.3 I, 1.2 V, 1.2 I, 2.6 MB, 2.6 MP, 2.6 DB, 2.3 I, 2.2 I, and 2.1 I (see Table 4).
Table 4.
Local thickness values at reference points for the different curing conditions (30 min curing time with and without nitrogen generator). Results are expressed in mm as Mean ± Standard Deviation or Median [Interquartile Range]. p-value: Student’s t-test, or Mann–Whitney U test, p-value; MB: mesiobuccal cusp tip; MP: mesiopalatal cusp tip; DB: distobuccal cusp tip; DP: disto-palatal cusp tip; FIS: mesiodistal centre of the central fissure; V: central point of the facial surface; B: buccal cusp tip; P: palatal cusp tip; I: most coronal, central point of the incisal edge.
3.3. Impact of Tooth Type and Site
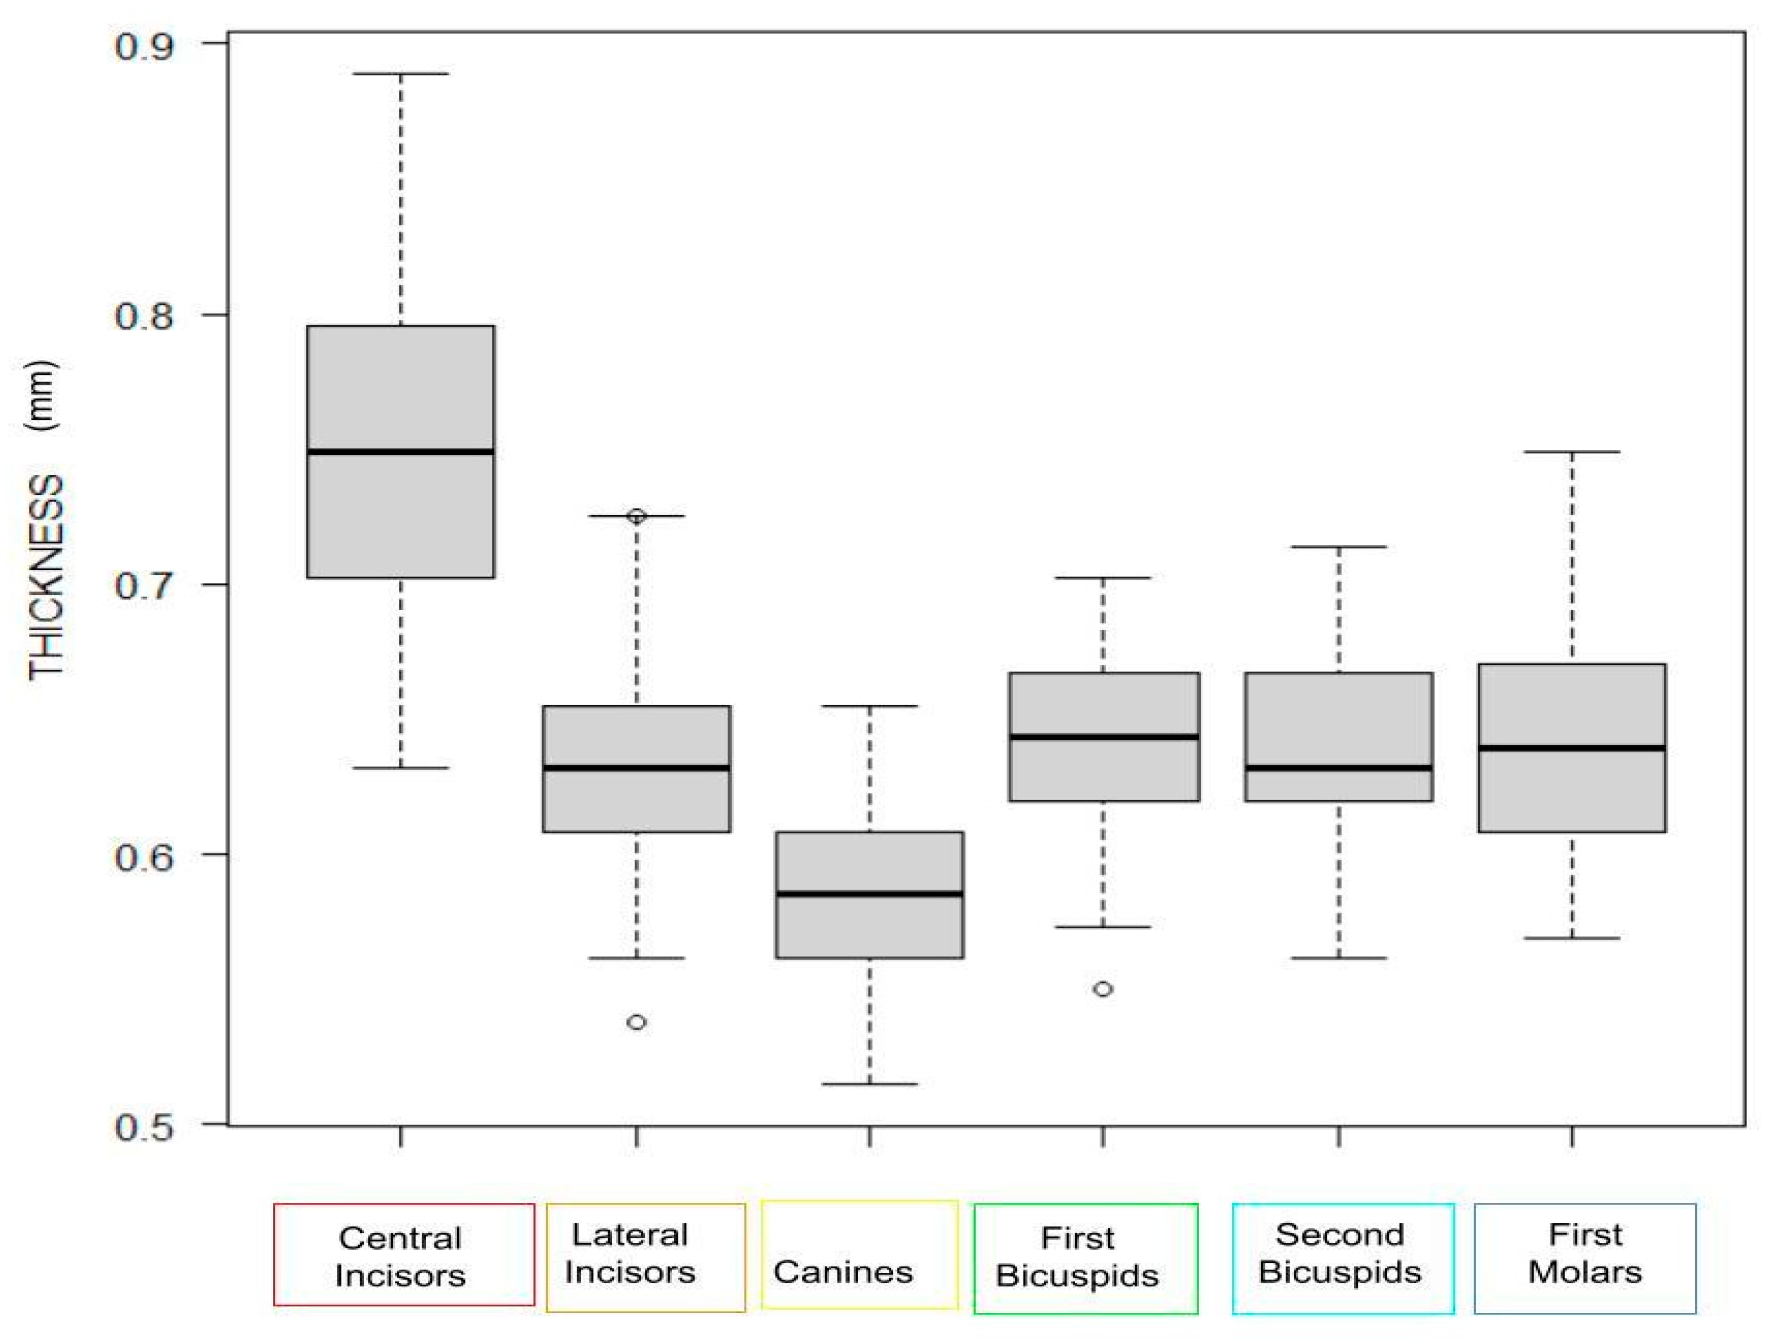
When considering the different tooth types, the Kruskal–Wallis test revealed significance (p < 0.001), and the post hoc test confirmed significant differences among the majority of teeth (Table 5). When grouping the tooth types, significantly higher thickness values at the central incisors were noted (p < 0.001, Figure 3).
Table 5.
Comparison of local thickness values (mm) aggregated for tooth type. p-value: Kruskall–Wallis test p-value. Pairwise comparisons were achieved using the Mann–Whitney U-test with Bonferroni’s method for p-value adjustment. Ce: Centrals; L: Laterals; Ca: Canines; 1P: First Premolars; 2P: Second Premolars; M: Molars.

Figure 3.
Boxplot showing the local thickness values at reference points. The thickness values at the reference points were aggregated by tooth type.
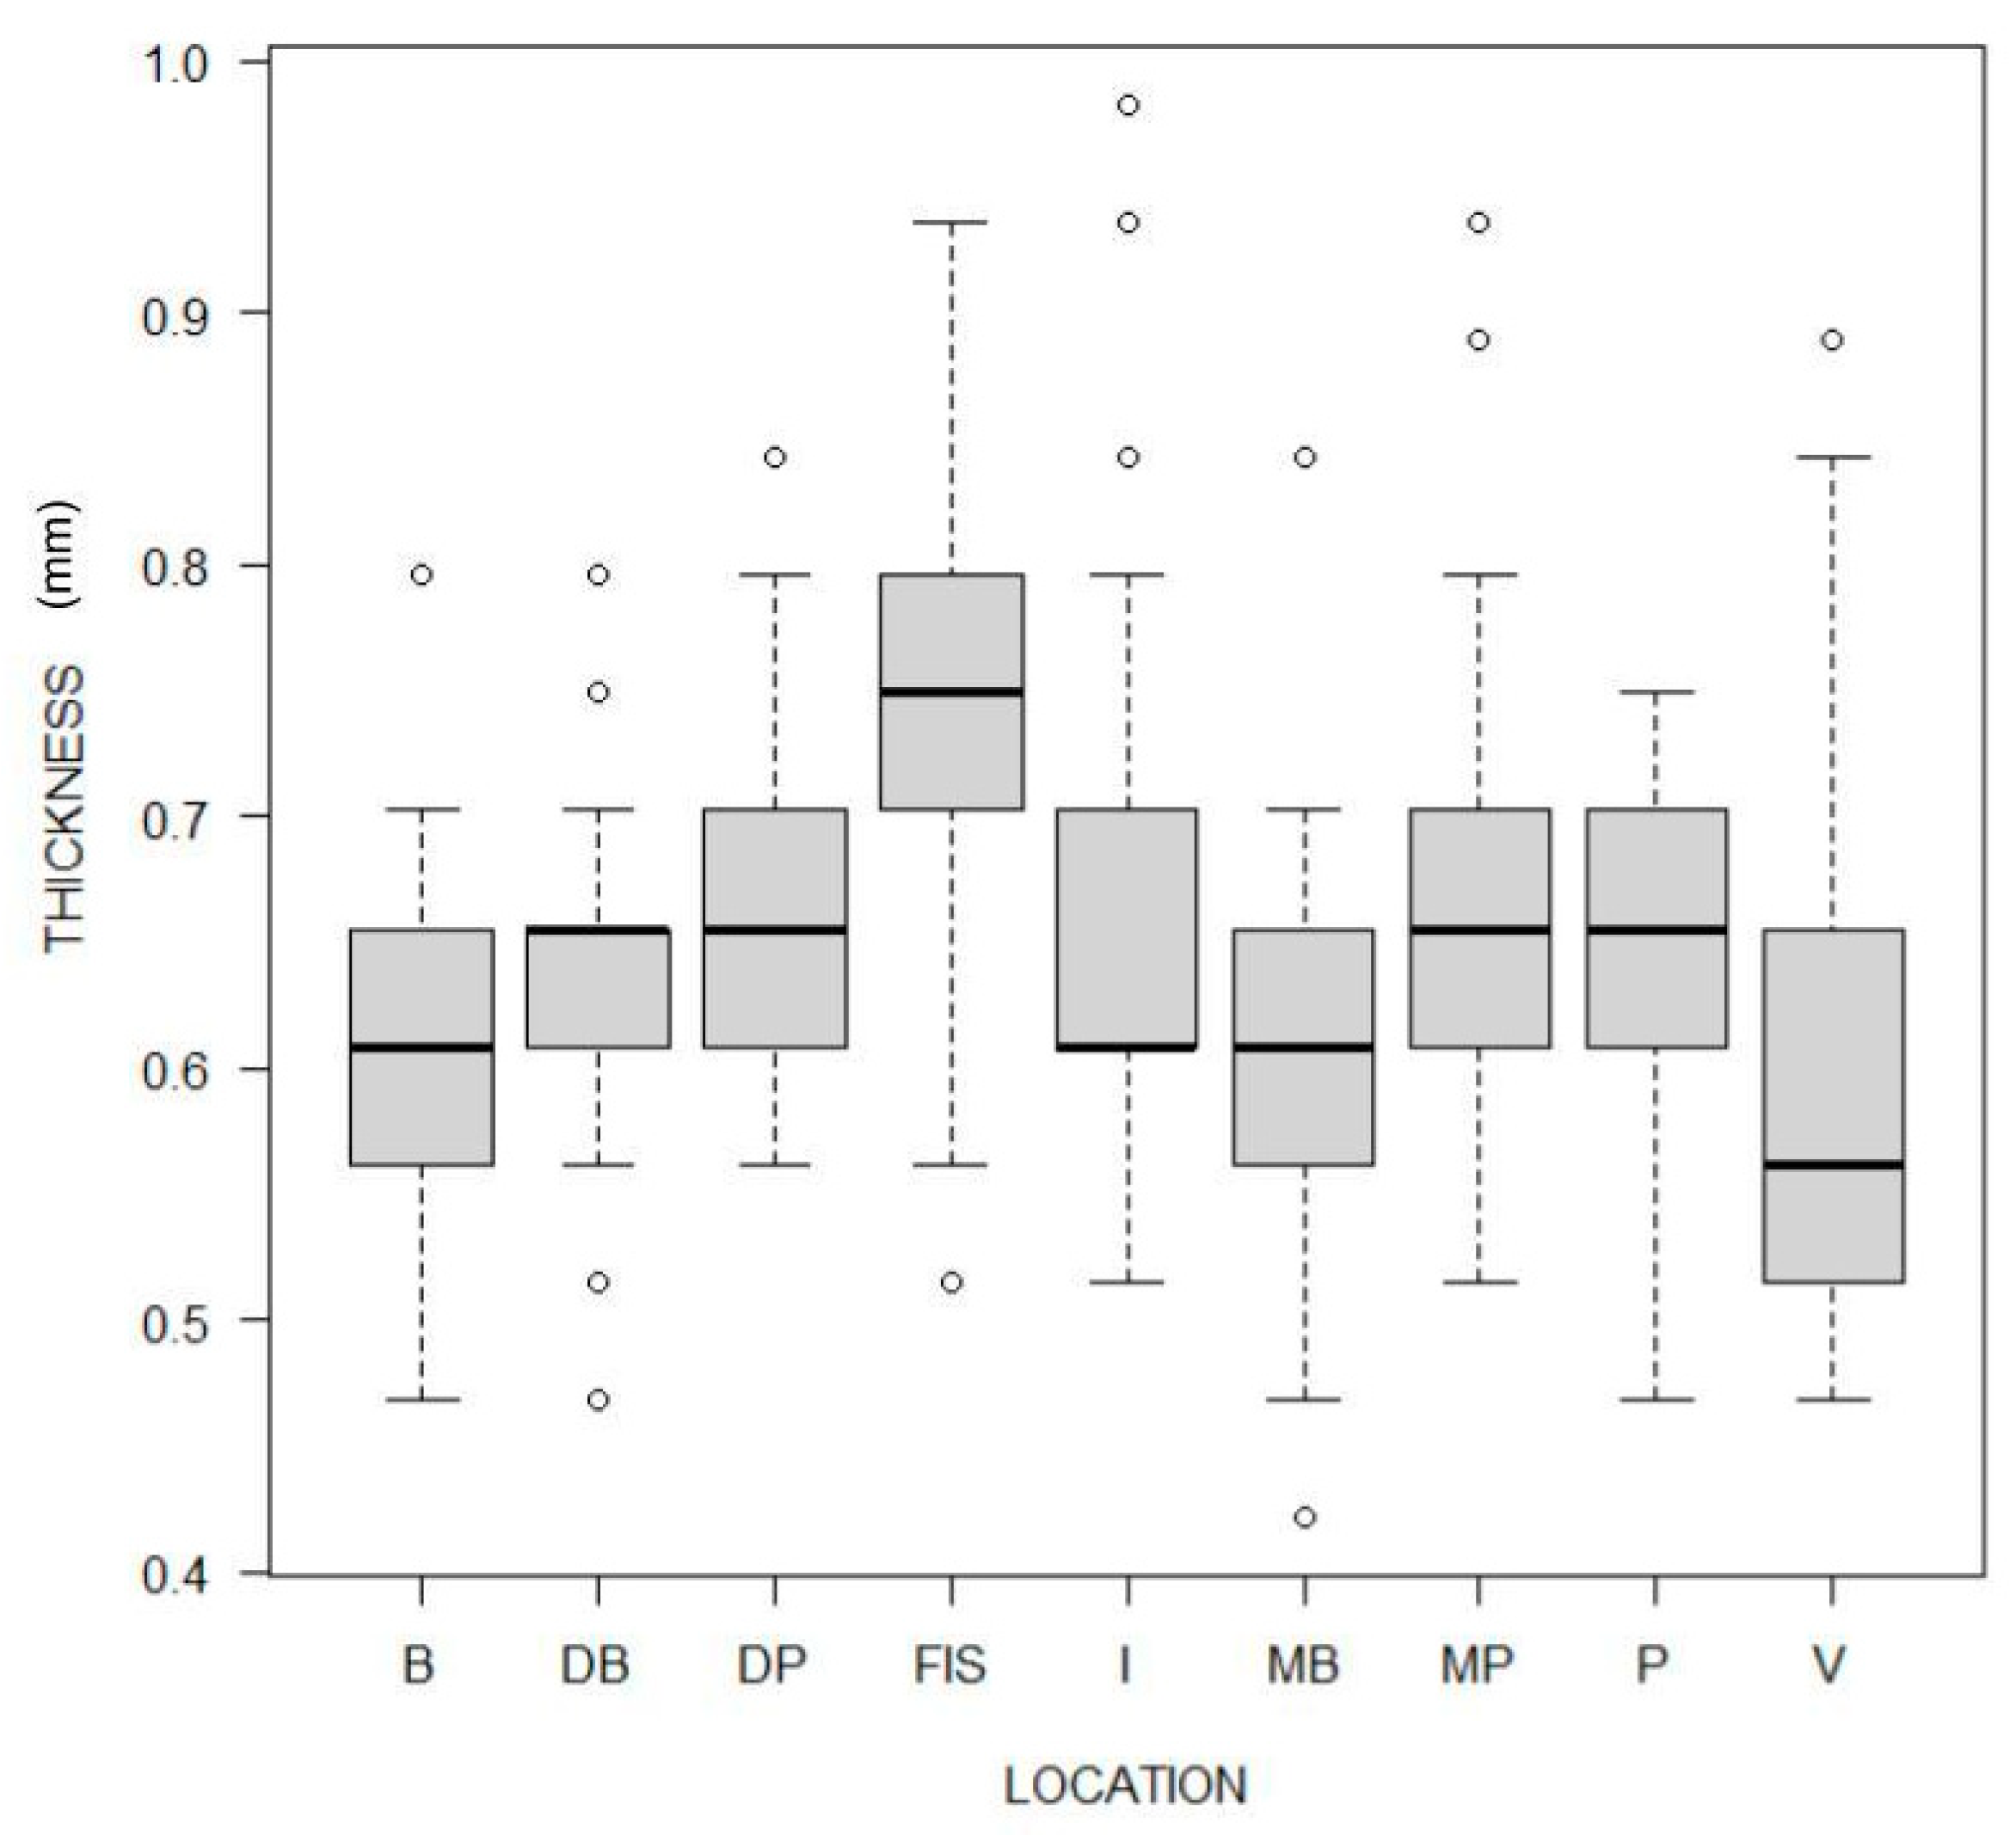
When grouping data for the type of reference point, significant differences in thickness values were also detected (p < 0.001). Particularly, at the mesiodistal centre of the central fissure (FIS), the thickness values were significantly higher than in all the other locations, whereas at the central point of the facial surface (V) thickness values were significantly lower than in all the other locations except the mesiobuccal cusp tip (MB) (Figure 4 and Table 6).
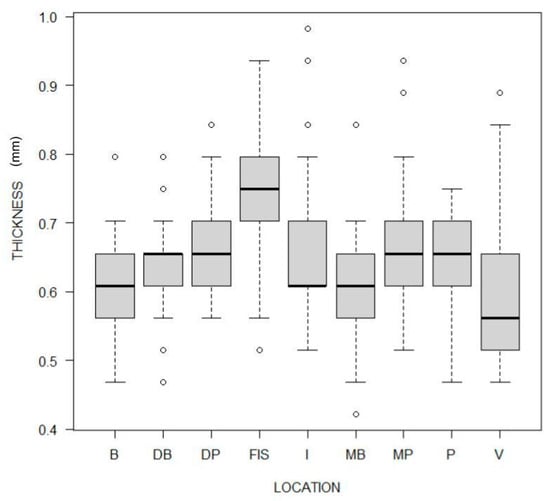
Figure 4.
Boxplot showing the local thickness values at reference points. The thickness values at the reference points were aggregated by location.
Table 6.
Comparison of local thickness values (mm) aggregated for measurement location. p-value: Kruskall–Wallis test p-value. Pairwise comparisons were achieved using the Mann–Whitney U-test with Bonferroni’s method for p-value adjustment. MB: mesiobuccal cusp tip; MP: mesiopalatal cusp tip; DB: distobuccal cusp tip; DP: distopalatal cusp tip; FIS: mesiodistal center of the central fissure; V: central point of the facial surface; B: buccal cusp tip; P: palatal cusp tip; I: most coronal, central point of the incisal edge.
3.4. Heterogeneity
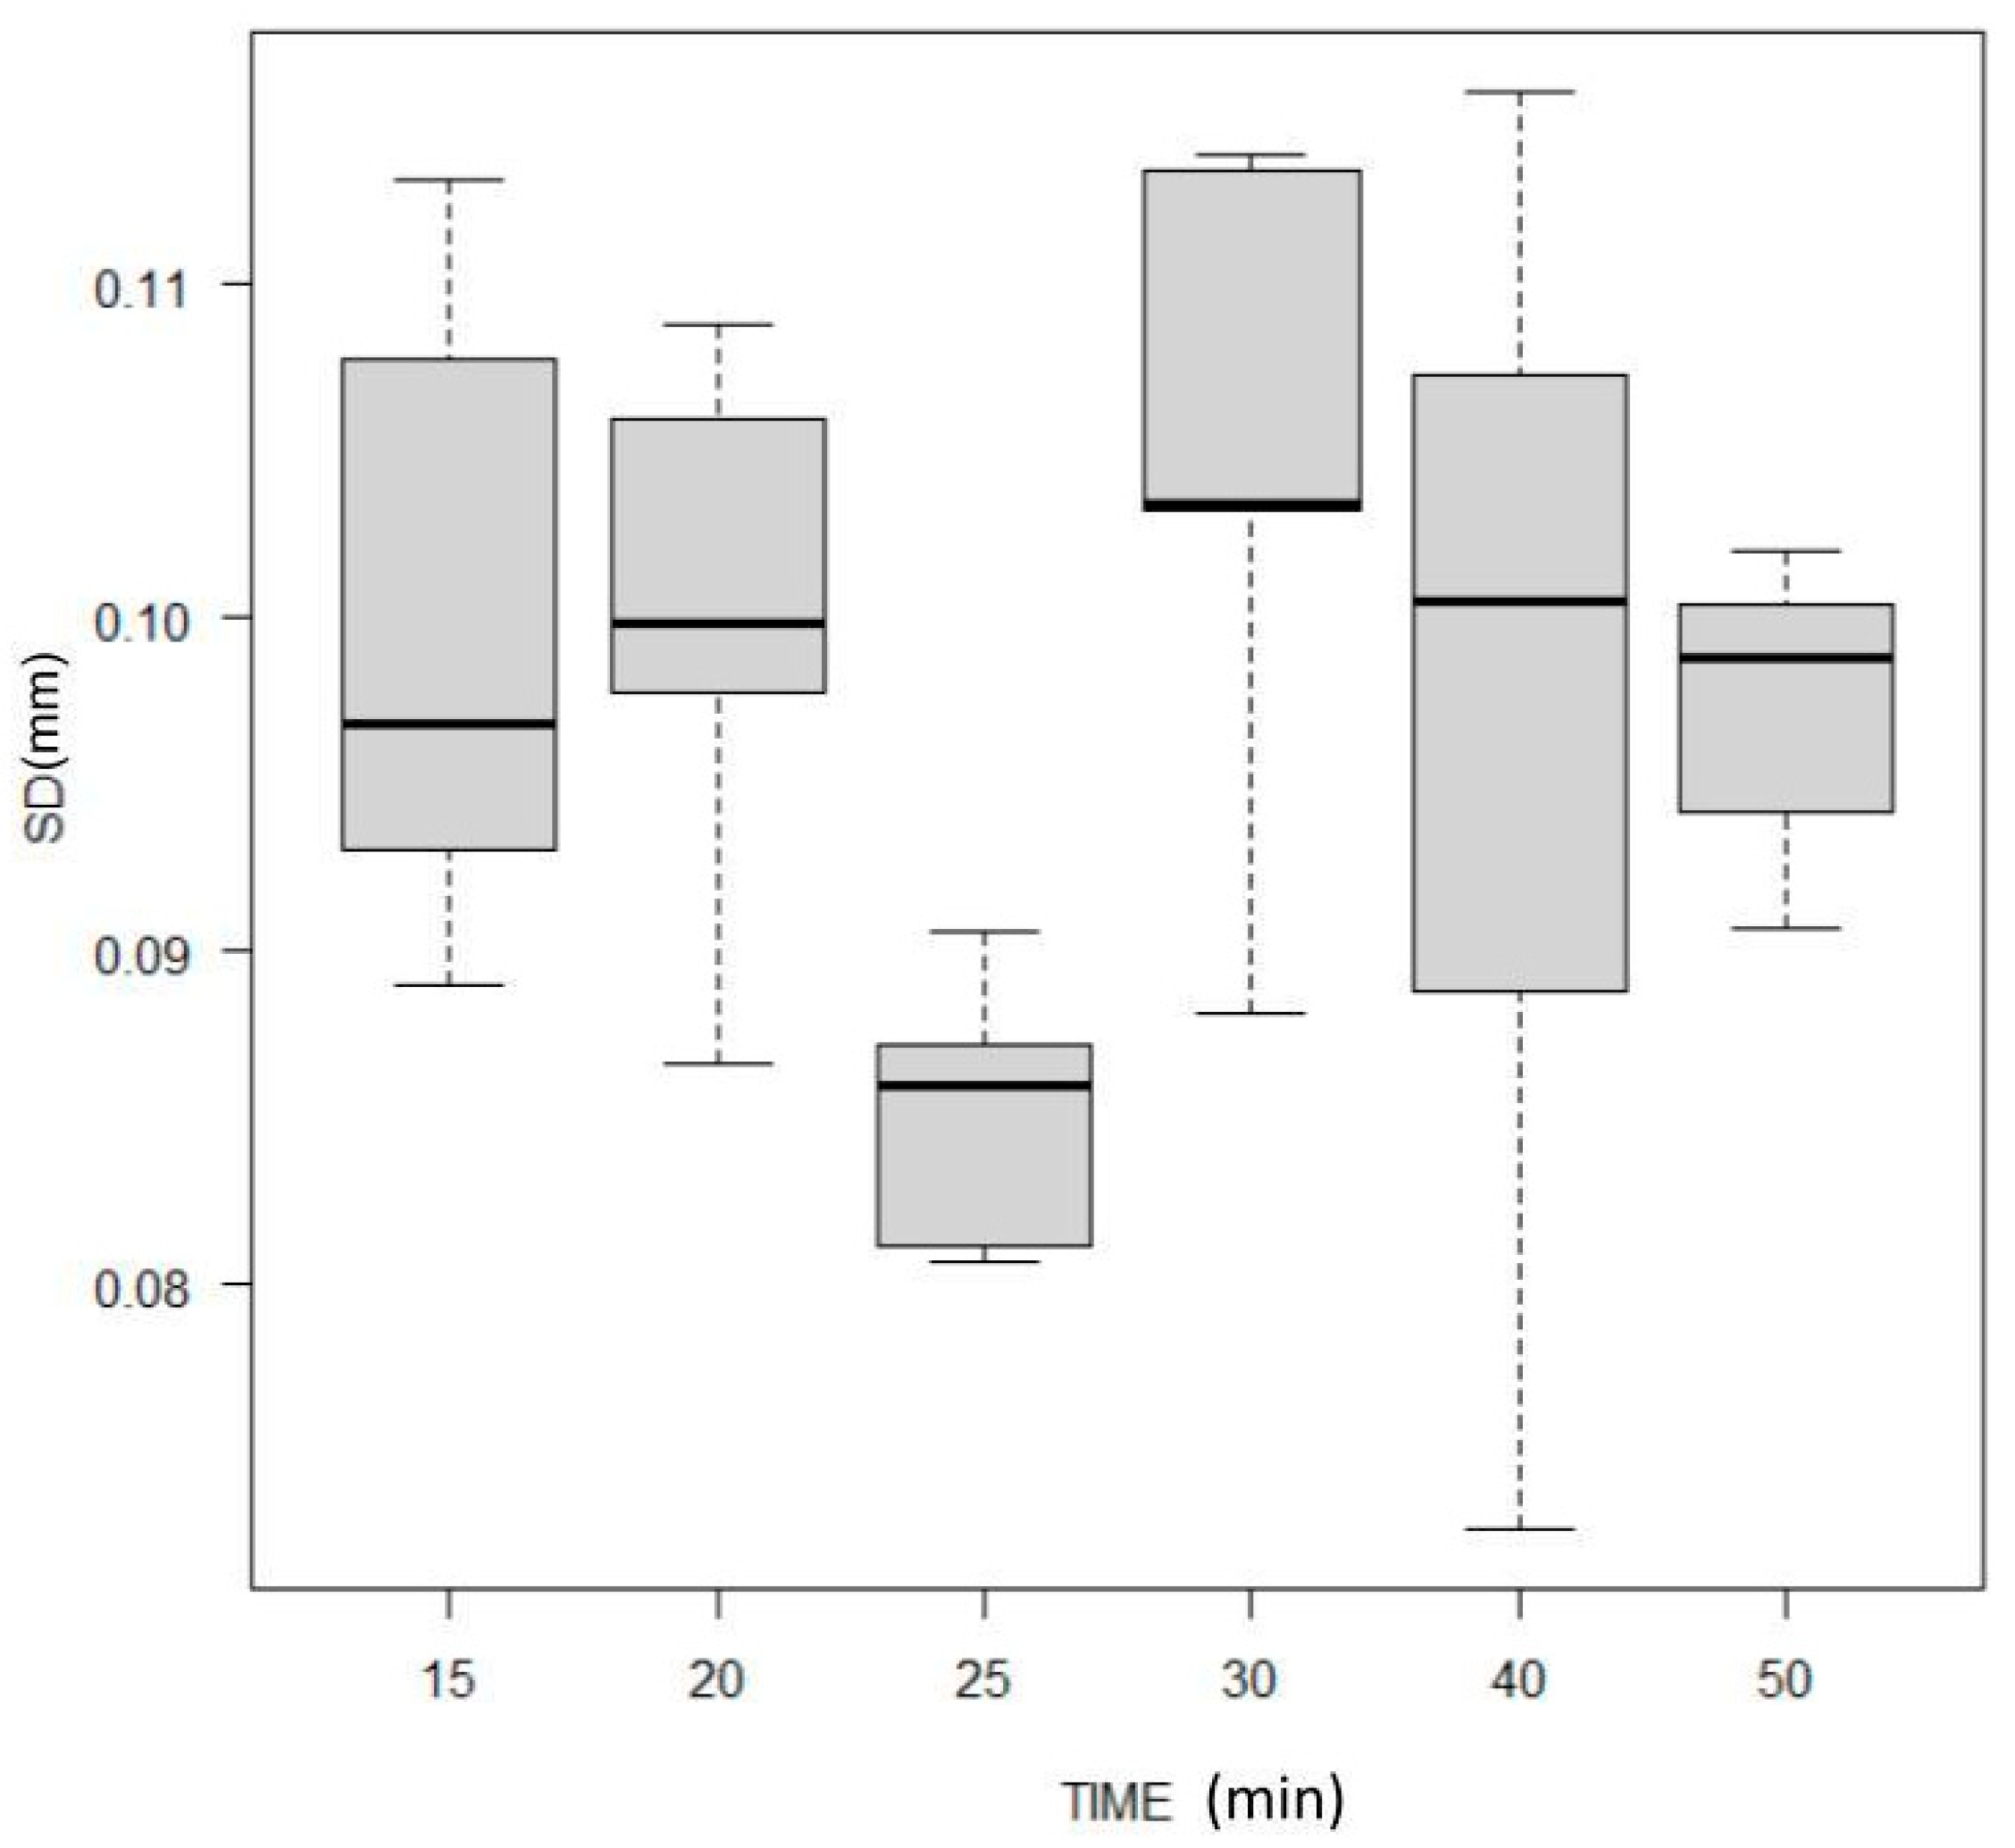
When comparing the standard deviation of aligner thicknesses, which corresponds to within-aligner heterogeneity, the Kruskal–Wallis test returned no significant differences among the groups (p = 0.0802, Figure 5), thus revealing that material heterogeneity was comparable among groups.
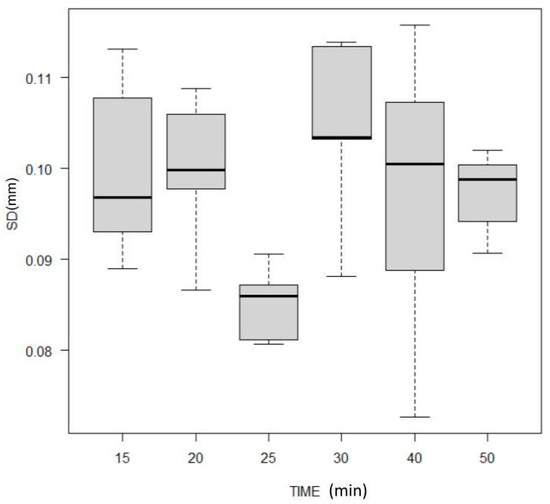
Figure 5.
Boxplot showing the standard deviation of the respective thickness values representing the material homogeneity.
3.5. 3D Images
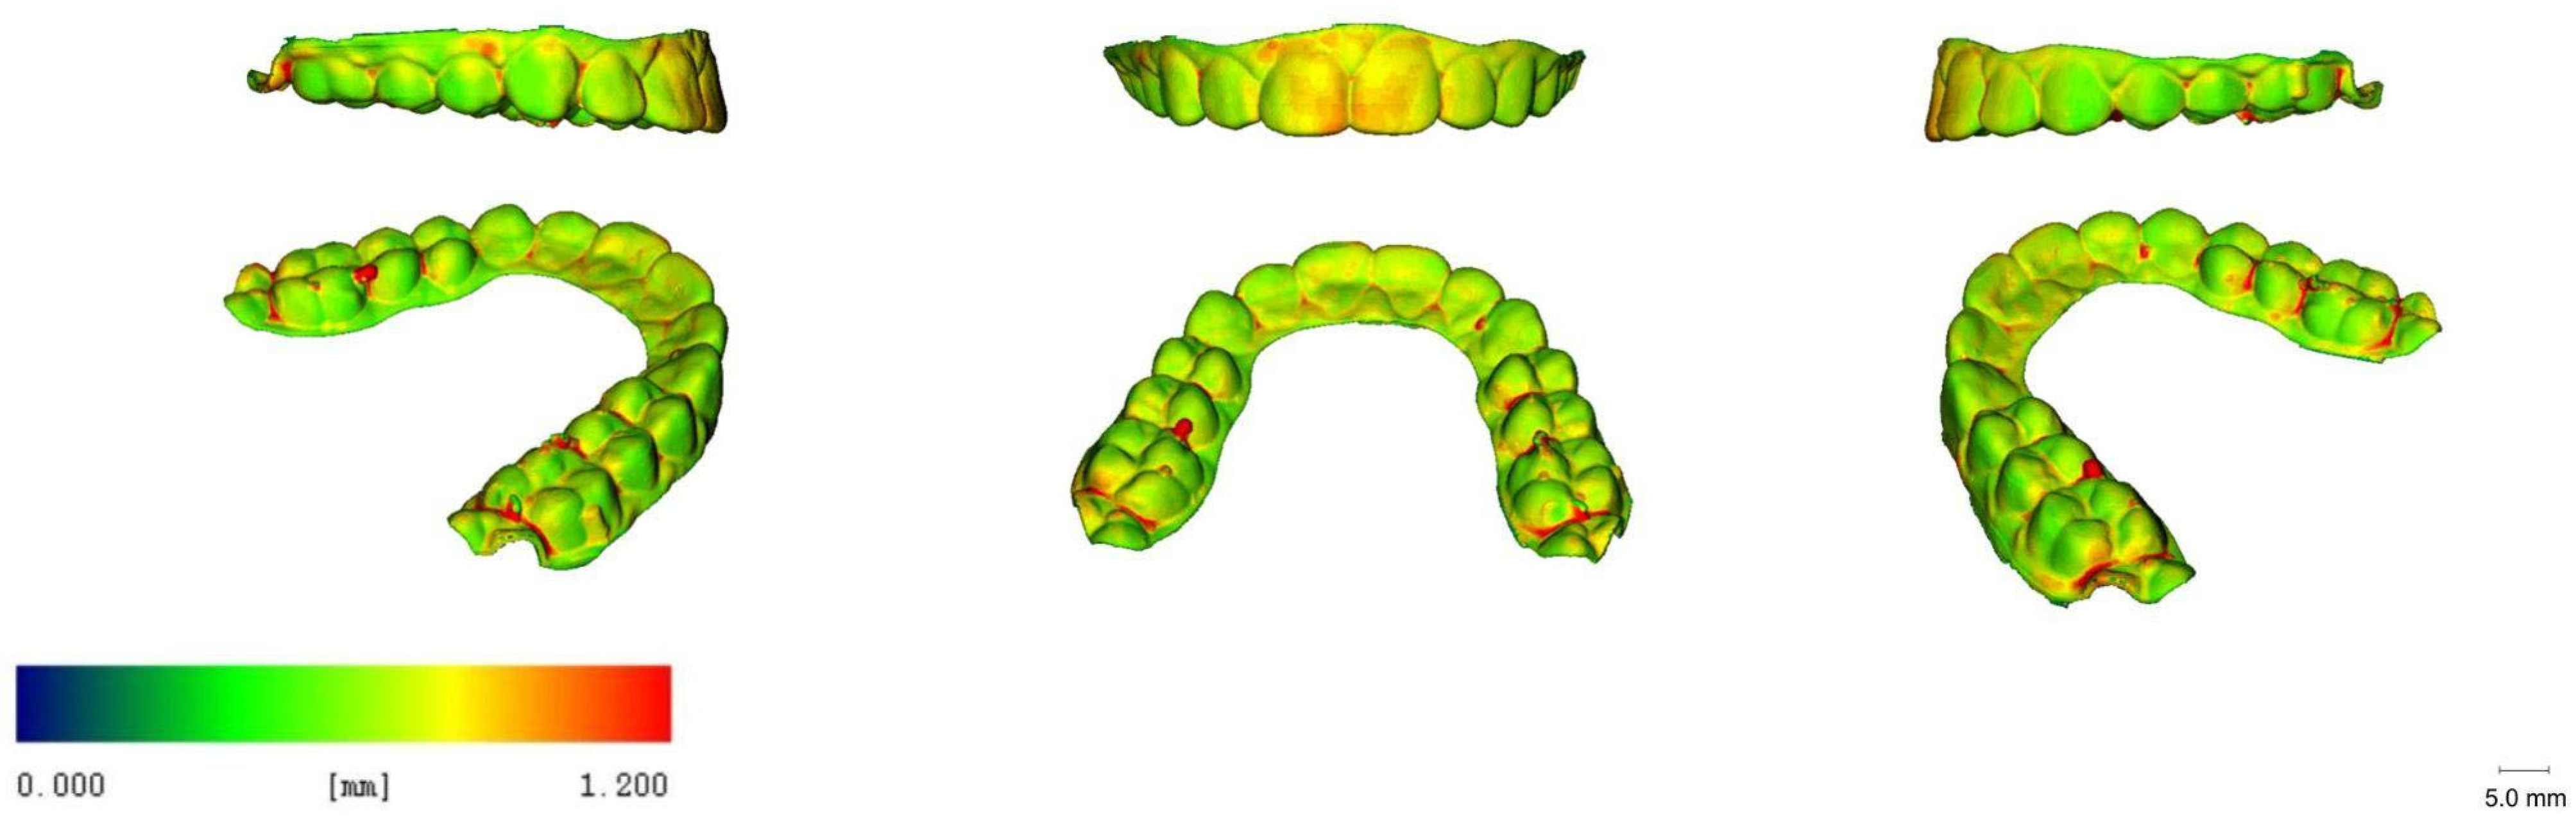
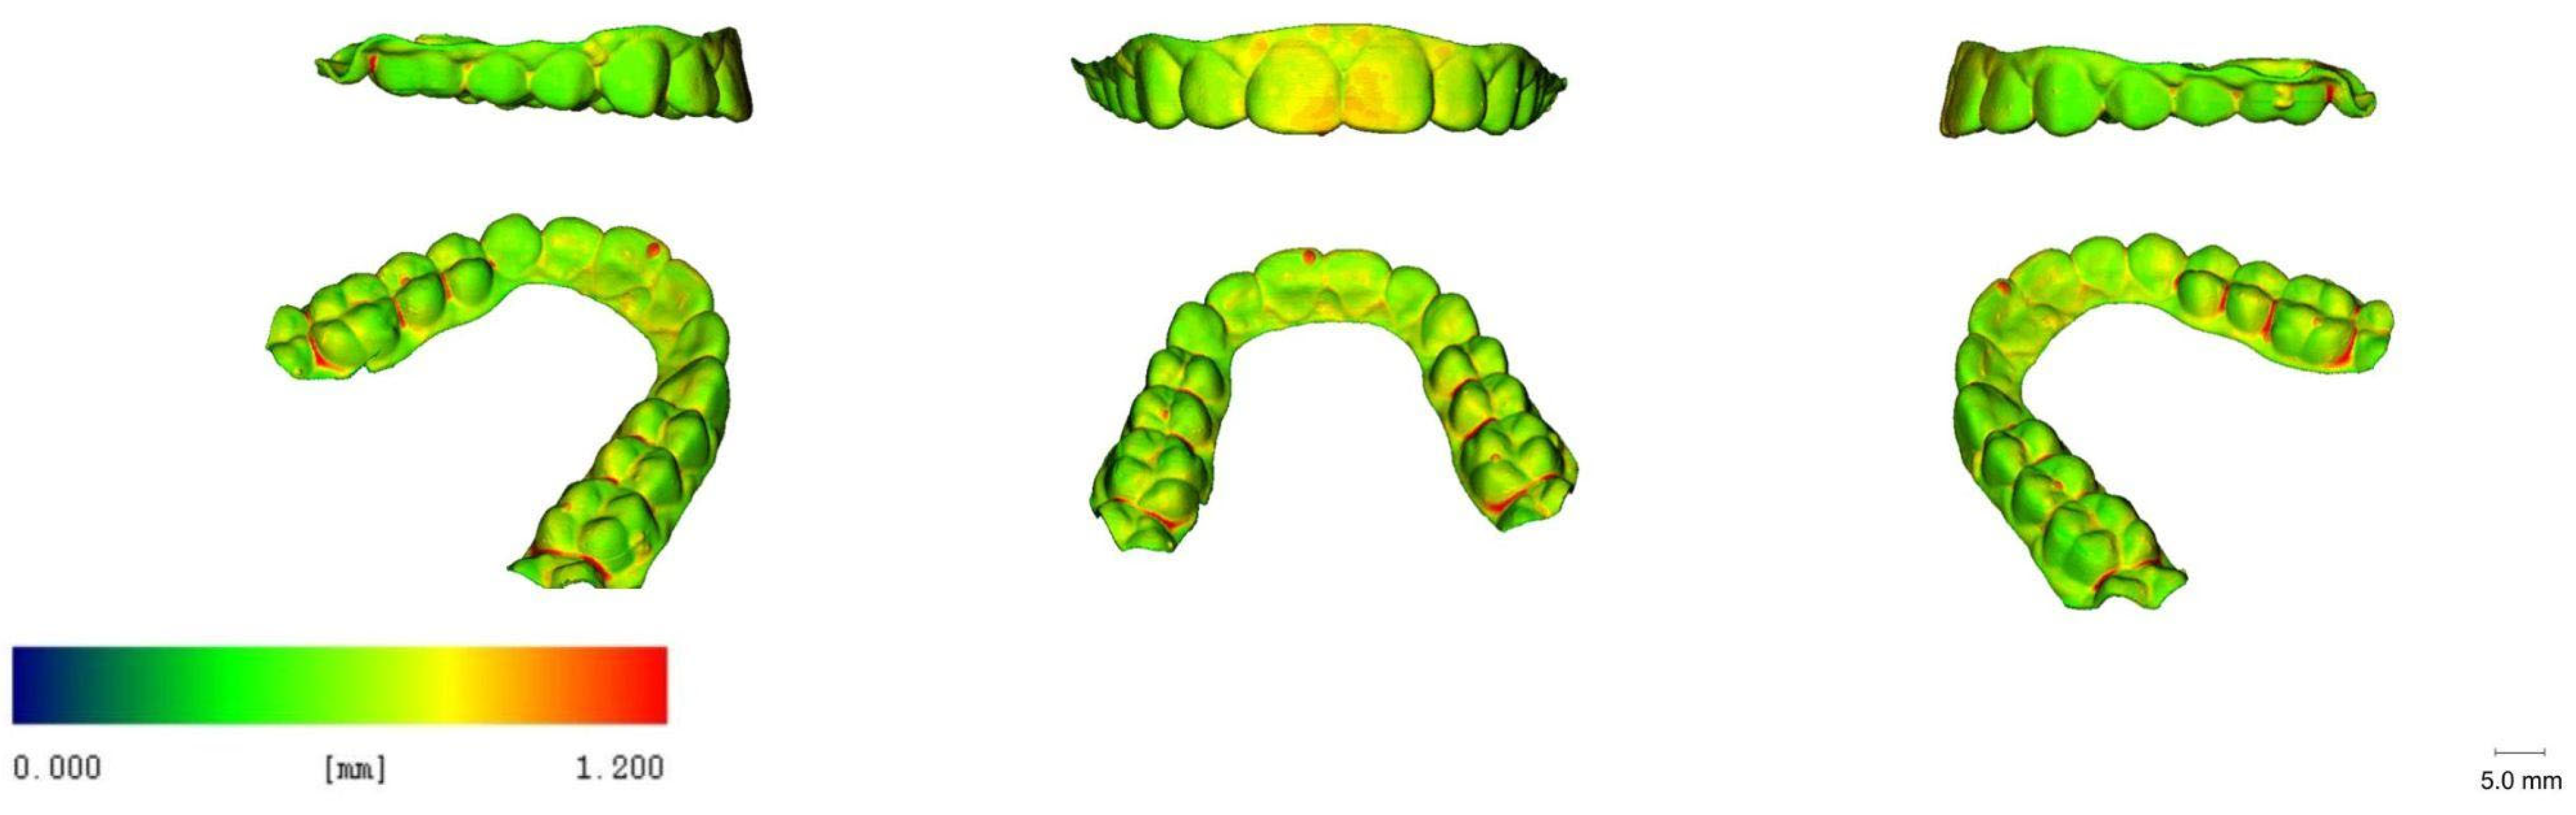
For descriptive analyses, 3D-rendered images were generated using the uct_3d software. They provide a visualisation of 3D deviations in the thickness of the aligners within different groups and locations (Figure 6, Figure 7, Figure 8, Figure 9, Figure 10 and Figure 11). The results show a similar colour distribution and generally yield positive deviations in the areas of central and lateral incisors, in the posterior interproximal septa, and in some isolated punctiform sites located on the cusps. Also, increased thickness values at the facial surfaces of incisors were noted in all groups.
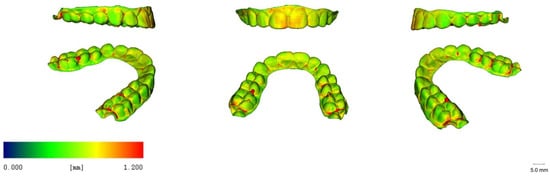
Figure 6.
Representative renderings visualising the local material thickness of micro-CT scanned direct-printed aligners with a 15 min curing time (blue: 0.00 mm, red: 1.20 mm).
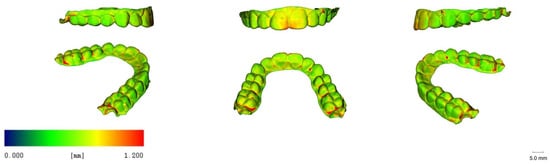
Figure 7.
Representative renderings visualising the local material thickness of micro-CT scanned direct-printed aligners with a 20 min curing time (blue: 0.00 mm, red: 1.20 mm).
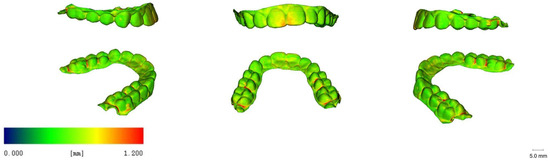
Figure 8.
Representative renderings visualising the local material thickness of micro-CT scanned direct-printed aligners with a 25 min curing time (blue: 0.00 mm, red: 1.20 mm).
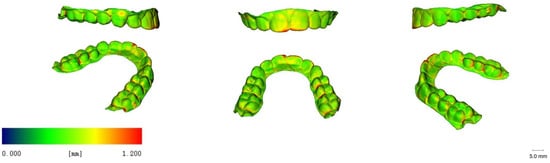
Figure 9.
Representative renderings visualising the local material thickness of micro-CT scanned direct-printed aligners with a 30 min curing time (blue: 0.00 mm, red: 1.20 mm).
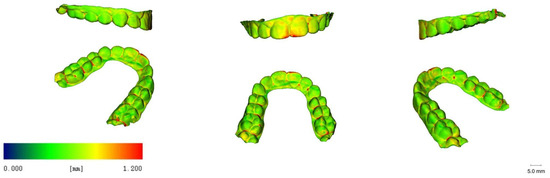
Figure 10.
Representative renderings visualising the local material thickness of micro-CT scanned direct-printed aligners with a 40 min curing time (blue: 0.00 mm, red: 1.20 mm).

Figure 11.
Representative renderings visualising the local material thickness of micro-CT scanned direct-printed aligners with a 50 min curing time (blue: 0.00 mm, red: 1.20 mm).
4. Discussion
Previous studies on conventional aligners have shown that the final thickness of the device may depend on the thermoforming process and might be related to the geometry of the 3D-printed dental cast used for the production, which can vary according to different clinical conditions such as tooth shape and size, arch length, palatal vault depth, and alveolar bone height. Particularly, it was emphasised that within a single thermoformed aligner, different regions of the arch may present different thicknesses [17].
In the present study, no significant association was found between thickness values and curing time/conditions. Moreover, no differences in material heterogeneity were noticed among the groups. Despite this, and in line with previous studies, significantly higher thickness values were found at specific locations, i.e., central incisors and the mesiodistal centre of the central fissure. These observations confirm that direct 3D-printed aligners achieve a quite homogeneous output of the set initial thickness whereby they might present isolated locations of increased thicknesses.
Grassia et al. assessed the accuracy (trueness and precision) of orthodontic models and used four different 3D printers obtained from crowded and spaced dentition for the thermoforming of clear aligners. They concluded that accuracy was affected by the 3D printer employed as well as by the anatomical characteristics of the dental arches [18]. Interestingly, also in the present study, constant variation in thickness values was noted. Hence, also in the direct printing case, different thicknesses were found within single aligners, and further observations are needed to understand to what extent the thickness patterns remain the same for more irregular dentitions.
According to another study based on micro-CT scanning, aligners thermoformed over a higher model exhibited lower material thickness values, especially at facial and palatal surfaces [19]. In the cited study, differences in thicknesses between teeth ranged from 0.001 to 0.011 mm, whereas differences between locations ranged from 0.005 to 0.184 mm. In the present study, inter-reference point differences showed higher values, with a maximum of 0.27 mm (estimated difference between the central incisor and the canine). However, when related to the mean aligner thickness, in the worst case this difference shows a smaller weight than in the case of the thermoformed aligners (32.8% of the mean thickness rather than 57.5%), which were overall chosen to be much thinner.
Importantly, the aligner thickness can affect not only optical and aesthetical properties, but also the forces and moments expressed by the device, and exert an important influence on the orthodontic force applied to the teeth [12]. Particularly, the lack of homogeneity in thickness at different locations of the arch may lead to a reduced predictability of tooth movements. On the other hand, the homogeneity of thicknesses of 3D-direct-printed aligners has not yet been investigated and, in the present study, no biomechanical testing was performed to assess the clinical impact. Additionally, the intra-aligner heterogeneity may be less pronounced compared to the thermoformed ones, and with adequate 3D planning, it would be possible to modify the local thickness at specific sites for treatment purposes.
Coloured dimensional deviation maps (Figure 6, Figure 7, Figure 8, Figure 9, Figure 10 and Figure 11) were generated in the present study to visualise positive and negative deviations from the planned thickness. The colours on the deviation maps resulted to be quite uniformly distributed among the different groups, with no differences regarding curing time. Therefore, the curing time did not seem to affect dimensional deviation, so we may infer that differences in resin shrinkage, according to the curing time, would not be observed over the minimal curing time suggested by the manufacturer, according to the first released protocol (15 min). The deviation maps provide instead a quick interface for recognising specific locations at which deviations were observed: these were particularly evident at the front teeth, at the interproximal level of posterior teeth, and at some isolated punctiform sites located on the cusps. We suppose that the positive deviation at the front teeth location was due to residual resin that, because of the 60° printing inclination and in spite of the centrifugation process, may have been incorporated into the area before post-curing, contributing to the local thickness increase. On the other hand, the joining of different surfaces may produce the thickness augmentation at the interproximal level of posterior teeth, while the different punctiform accumulation points correspond to some support insertion point.
According to Lee et al., the average thickness of the TC-85 specimens manufactured by 3D printing and photocured twice for 25 min under N2 was 0.56 mm, which was 12% higher than the set thickness of 0.5 mm (5). In the present study, the median vestibular thickness in the 25 min cured group was equal to the same value (0.56 mm), confirming the repeatability of the average thickness when the same printing and post-printing procedures are applied.
A very recent work took into account the thicknesses of thermoformed and 3D-printed clear aligners using micro-CT and reported that the median thicknesses of direct-printed aligners with a set-up thickness of 0.5 mm were 614.24 μm and 687.53 μm, respectively, according to the used cleaning procedure [14]. In fact, in the cited study, the first group was cleaned for 1 min with 99.5% IPA, the second one for 6 min and at 500 rpm using a centrifuge. Particularly, when considering buccal locations, the reported median [IR] thickness values are 579.34 μm, IR = [538.33–629.07] and 645.65 μm, IR = [614.24–676.19], which appear in the same range of our most similar subgroup: 560 μm IR = [510, 750], for the 25 min cured group which was, however, centrifuged twice for 5 min. Other differences with the cited study are that aligners were positioned at 30° as a print angulation with minimum supports, and a different 3D printer was used with a layer thickness of 50 μm.
However, in both our study and the cited one, a thicker output was observed in the anterior teeth compartment compared to the posterior teeth. We agree with the colleagues in suggesting that the augmented thickness of the anterior teeth in the 3D-printed aligners might have resulted from the fact that it is more difficult to remove any uncured resin remaining on the inner surface of anterior teeth. Future studies are required to assess if specific resin from this site may be associated with increased cytotoxicity or allergenic risks, as reported recently for direct 3D-printed aligners [2].
5. Conclusions
In the present study on six groups of 3D-direct-printed aligners post-cured with a nitrogen generator for, respectively, 15 min, 20 min, 25 min, 30 min, 40 min, and 50 min, and one group cured for 30 min without the nitrogen generator, and taking into consideration 20 reference points, the local aligner thickness was assessed with a micro-CT scanner. No direct association was found between curing time and thicknesses. Nitrogen generator usage showed a significant effect on thickness. With a 60° printing inclination, and following the prescribed centrifugation process, a local thickness increase at the front teeth (with a median value of +0.15 mm at the central point of the incisal edge of +0.25 mm at the central point of the facial surface) was observed. Limitations of the present study include the following: First, the nitrogen effect was not investigated for all curing times as it was not our primary goal; in order to consider this factor, a much larger sample size would be required (two groups per curing time). Secondly, no biomechanical analysis was taken into account, and the impact of increased thickness in the front still needs to be studied. Eventually, the study was limited to a single printer/resin combination and future studies are needed to validate if the same patterns will be observed.
Supplementary Materials
The following supporting information can be downloaded at: https://www.mdpi.com/article/10.3390/app132111952/s1, File S1: Plots: boxplots showing the local thickness values at various reference points for the different curing times and graphs of the correlation analysis between thickness and time; File S2: AlignerItaly_Results.xlsx.
Author Contributions
Conceptualization, M.M. and S.D.; methodology, K.B.; software, R.K.; validation, M.M. and A.L.; formal analysis, S.D.; investigation, R.K.; resources, K.B.; data curation, S.D.; writing—original draft preparation, S.D., A.C. and G.B.; writing—review and editing, M.M., A.C., D.D. and K.B.; visualization, R.K.; supervision, D.D. and K.B.; project administration, M.M. All authors have read and agreed to the published version of the manuscript.
Funding
This research received no external funding.
Institutional Review Board Statement
Not applicable.
Informed Consent Statement
Informed consent was obtained from all subjects involved in the study.
Data Availability Statement
Publicly available datasets were analyzed in this study. This data can be found here: File S2: AlignerItaly_Results.xlsx.
Acknowledgments
The authors wish to thank Sara Castagneto for her valuable assistance in producing the aligners used in the present study.
Conflicts of Interest
M.M. has a contract with Yen co. for giving lectures and teaching doctors how to use resin TERA HARZ TC 85-DAC. Yen co. is a distributor of Graphy products.
References
- Nakano, H.; Kato, R.; Kakami, C.; Okamoto, H.; Mamada, K.; Maki, K. Development of biocompatible resins for 3D printing of direct aligners. J. Photopolym. Sci. Technol. 2019, 32, 209–216. [Google Scholar] [CrossRef]
- Pratsinis, H.; Papageorgiou, S.N.; Panayi, N.; Iliadi, A.; Eliades, T.; Kletsas, D. Cytotoxicity and estrogenicity of a novel 3-dimensional printed orthodontic aligner. Am. J. Orthod. Dentofac. Orthop. 2022, 162, e116–e122. [Google Scholar] [CrossRef] [PubMed]
- Campobasso, A.; Ariano, A.; Battista, G.; Posa, F.; Migliorati, M.; Drago, S.; Lo Muzio, E.; Mori, G. Comparison of the cytotoxicity of 3D-printed aligners using different post-curing procedures: An in vitro study. Austral. Orthod. J. 2023, 39, 49–56. [Google Scholar]
- Rajasekaran, A.; Chaudhari, P.K. Integrated manufacturing of direct 3D-printed clear aligners. Front. Dental Med. 2023, 3, 1089627. [Google Scholar] [CrossRef]
- Lee, S.Y.; Kim, H.; Kim, H.J.; Chung, C.J.; Choi, Y.J.; Kim, S.J.; Cha, J.Y. Termo-mechanical properties of 3D printed photocurable shape memory resin for clear aligners. Sci. Rep. 2022, 12, 6246. [Google Scholar] [CrossRef] [PubMed]
- Zinelis, S.; Panayi, N.; Polychronis, G.; Papageorgiou, S.N.; Eliades, T. Comparative analysis of mechanical properties of orthodontic aligners produced by different contemporary 3D printers. Orthod. Craniofac. Res. 2022, 25, 336–341. [Google Scholar] [CrossRef] [PubMed]
- Boyer, R.A.; Kasper, F.K.; English, J.D.; Jacob, H.B. Effect of print orientation on the dimensional accuracy of orthodontic aligners printed 3-dimensionally. Am. J. Orthod. Dentofac. Orthop. 2021, 160, 732–742.e1. [Google Scholar] [CrossRef] [PubMed]
- Edelmann, A.; English, J.D.; Chen, S.J.; Kasper, F.K. Analysis of the thickness of 3-dimensional-printed orthodontic aligners. Am. J. Orthod. Dentofac. Orthop. 2020, 158, e91–e98. [Google Scholar] [CrossRef] [PubMed]
- Cole, D.; Bencharit, S.; Carrico, C.K.; Arias, A.; Tufekci, E. Evaluation of fit for 3D-printed retainers compared with thermoform retainers. Am. J. Orthod. Dentofac. Orthop. 2019, 155, 592–599. [Google Scholar] [CrossRef] [PubMed]
- McCarty, M.C.; Chen, S.J.; English, J.D.; Kasper, F. Effect of print orientation and duration of ultraviolet curing on the dimensional accuracy of a 3-dimensionally printed orthodontic clear aligner design. Am. J. Orthod. Dentofac. Orthop. 2020, 158, 889–897. [Google Scholar] [CrossRef] [PubMed]
- Mantovani, E.; Parrini, S.; Coda, E.; Cugliari, G.; Scotti, N.; Pasqualini, D.; Deregibus, A.; Castroflorio, T. Micro computed tomography evaluation of Invisalign aligner thickness homogeneity. Angle Orthod. 2021, 91, 343–348. [Google Scholar] [CrossRef] [PubMed]
- Lombardo, L.; Palone, M.; Longo, M.; Arveda, N.; Nacucchi, M.; De Pascalis, F.; Spedicato, G.A.; Siciliani, G. MicroCT X-ray comparison of aligner gap and thickness of six brands of aligners: An in-vitro study. Prog. Orthod. 2020, 21, 12. [Google Scholar] [CrossRef] [PubMed]
- Palone, M.; Longo, M.; Arveda, N.; Nacucchi, M.; De Pascalis, F.; Spedicato, G.A.; Siciliani, G.; Lombardo, L. Micro-computed tomography evaluation of general trends in aligner thickness and gap width after thermoforming procedures in-volving six commercial clear aligners: An in vitro study. Korean J. Orthod. 2021, 51, 135–141. [Google Scholar] [CrossRef] [PubMed]
- Park, S.Y.; Choi, S.H.; Yu, H.S.; Kim, S.J.; Kim, H.; Kim, K.B.; Cha, J.Y. Comparison of translucency, thickness, and gap width of thermoformed and 3D-printed clear aligners using micro-CT and spectrophotometer. Sci. Rep. 2023, 13, 10921. [Google Scholar] [CrossRef]
- Hildebrand, T.; Rüegsegger, P. A new method for the model-independent assessment of thickness in three-dimensional images. J. Microsc. 1997, 185, 67–75. [Google Scholar] [CrossRef]
- R Core Team. R: A Language and Environment for Statistical Computing. R Foundation for Statistical Computing, Vienna, Austria. 2013. Available online: http://www.R-project.org/ (accessed on 19 August 2023).
- Ammann, R.; Tanner, C.; Schulz, G.; Osmani, B.; Nalabothu, P.; Töpper, T.; Müller, B. Three-dimensional analysis of aligner gaps and thickness distributions, using hard x-ray tomography with micrometer resolution. J. Med. Imaging 2022, 9, 031509. [Google Scholar] [CrossRef] [PubMed]
- Grassia, V.; Ronsivalle, V.; Isola, G.; Nucci, L.; Leonardi, R.; Lo Giudice, A. Accuracy (trueness and precision) of 3D printed orthodontic models finalized to clear aligners production, testing crowded and spaced dentition. BMC Oral Health. 2023, 23, 352. [Google Scholar] [CrossRef] [PubMed]
- Ihssen, B.A.; Kerberger, R.; Rauch, N.; Drescher, D.; Becker, K. Impact of Dental Model Height on Thermoformed PET-G Aligner Thickness—An In Vitro Micro-CT Study. Appl. Sci. 2021, 11, 6674. [Google Scholar] [CrossRef]


Disclaimer/Publisher’s Note: The statements, opinions and data contained in all publications are solely those of the individual author(s) and contributor(s) and not of MDPI and/or the editor(s). MDPI and/or the editor(s) disclaim responsibility for any injury to people or property resulting from any ideas, methods, instructions or products referred to in the content. |
© 2023 by the authors. Licensee MDPI, Basel, Switzerland. This article is an open access article distributed under the terms and conditions of the Creative Commons Attribution (CC BY) license (https://creativecommons.org/licenses/by/4.0/).