Article

Fractal Behavior of Size Distribution and Specific Surface Area of Blasting Fragments

1
Zhejiang Huadong Engineering Construction Management Co., Ltd., Hangzhou 310014, China
2
Key Laboratory of Geotechnical Mechanics and Engineering of the Ministry of Water Resources, Yangtze River Scientific Research Institute, Wuhan 430010, China
3
Zhejiang Engineering Research Center of Green Mine Technology and Intelligent Equipment, Hangzhou 310014, China
4
State Key Laboratory of Water Resources Engineering and Management, Wuhan University, Wuhan 430072, China
*
Authors to whom correspondence should be addressed.
Appl. Sci. 2023, 13(21), 11832; https://doi.org/10.3390/app132111832
Submission received: 28 September 2023 / Revised: 24 October 2023 / Accepted: 27 October 2023 / Published: 29 October 2023
(This article belongs to the Section Civil Engineering)

Abstract

:
The shape characteristics of blasting fragments are important for analyzing the blasting fragmentation mechanism and evaluating the fragmentation energy efficiency. In this study, through field blasting experiments and morphological parameter measurements, fractal theory was employed to reveal the fractal characteristics of rock blasting fragmentation. Using the fragmentation fractal dimension, the probability of rock blasting fragmentation was analyzed, and a predictive formula for the specific surface area (SSA) of blasting fragments was established. For fragments, the fractal dimensions of the particle size distribution calculated using different characteristic sizes were less than 2.0. When the fragment size distribution had dual fractal characteristics, significant differences were observed in the scale-free interval and fragmentation fractal dimension. Within the large scale-free interval, the fragmentation fractal dimension was mostly greater than 2.3, whereas within the small scale-free interval, it tended to be less than 2.0. The rock fragmentation process typically consisted of two or three breakage levels, with a similarity ratio of 0.5 and an average fragmentation probability ranging from 0.44 to 0.71. The predicted SSA of the blasting fragments closely matched the measured values. The findings provide valuable insights into the mechanism of rock blasting fragmentation and the calculation of fragmentation energy consumption.

1. Introduction

Drilling and blasting are the initial processes of the mine-to-milling sequence, and the properties of blasting fragments significantly affect the overall production costs of mine-to-milling processes [1,2,3]. Studies have indicated that the particle size distribution, shape, and specific surface area (SSA) are fundamental attributes of blasting fragments, which affect the energy utilization efficiency of downstream crushing equipment [4,5,6]. Therefore, investigating the fundamental attributes of blasting fragments has theoretical significance for clarifying the mechanism of rock blasting fragmentation and optimizing the energy efficiency throughout the mine-to-milling process.
Blasting fragments are typical irregular particles with fragments ranging in size from the order of microns to meters. Therefore, evaluating their basic attributes is difficult [3,7]. Currently, particle size measurement techniques are well-established, leading to various research outcomes regarding particle size distribution measurement and fragment size distribution characteristics. The sieve test is the simplest method of measuring particle size distributions [8] but involves substantial work and high testing costs [9]. Thus, various approaches, such as distribution function methods, artificial intelligence algorithms, and digital image processing techniques, are utilized to obtain fragment size distribution curves rapidly. The models most often used in distribution function methods are the Kuz–Ram model, Kuznetsov–Cunningham–Ouchterlony model, xP-frag model, and fragmentation–energy fan model [7]. However, owing to the variable nature of rock mass, the parameter selection for distribution models varies among researchers, leading to significant discrepancies in the calculation results among different models. With the development of new technologies such as machine learning and big data, scholars have used various intelligent algorithms, e.g., particle swarm optimization and bacterial foraging optimization, to establish multiple fragment size distribution prediction models by training and optimizing data from blasting experiments [10,11]. However, this approach requires a large amount of data and strong programming skills. Since the 1980s, image processing techniques have been used for blasting fragmentation distribution measurement. With advancements in stereophotography, machine vision, and three-dimensional (3D) laser scanning technologies, image processing has become the preferred tool for measuring fragment size distribution in most engineering blasting scenarios. Software programs such as WipFrag, Split, and Gold Size are examples of image processing tools that are widely used for analyzing fragment size distributions [12]. Onederra et al. [13], Chen et al. [14], and Campbell et al. [15] employed 3D laser scanning and image processing techniques to obtain the in situ block size distribution of rock mass.
Early methods of studying particle shape characteristics involved indirect tests that quantified particle shape through physical and mechanical parameters such as porosity [16]. However, indirect experimental results represent overall particle shape characteristics and cannot describe the shape features of individual particles [17,18]. Presently, visualization, manual caliper measurement, and digital image processing are commonly used to assess particle shape characteristics [19]. Visualization and caliper measurement are simple and inexpensive methods of evaluating the form and angularity of a large quantity of particles or particles with large diameters [20]; however, the results are subjective. Therefore, digital image processing methods are more widely used. For instance, Blott et al. [21] and Tunwal et al. [22] employed digital image processing techniques to study the surface texture of sediment particles, such as roundness and angularity. Zhu et al. [23] utilized charge-coupled device cameras and 3D laser scanners to study the angularity of coarse aggregates. As mentioned previously, the existing methods can only characterize the shape features of particles within a certain particle size range [24], whereas the particle size and shape of blasting fragments vary widely [3,7], posing challenges to the characterization of their shape properties [25,26].
Fractals allow the quantification of seemingly chaotic and randomly distributed phenomena and behaviors [27]. Research indicates that the defects, shapes, strength, deformation, and energy consumption of rock and soil materials all exhibit statistical self-similarity at certain scales, i.e., fractal characteristics [28]. Fractals have become important tools in rock mechanics research. The fractal dimension is the primary parameter for describing fractals [28] and has been widely used in various applications, such as mineral particle morphology analysis [29,30], rock damage assessment [31], and fragmentation evaluation [32]. During the process of rock fragmentation, the fractal dimension can continuously change at different resolutions (different lengths of the measuring stick), allowing the target object to exhibit dual or multifractal characteristics [27]. Extensive studies on fragmentation phenomena have indicated that the fractal dimension of rock fragmentation typically falls between 2.0 and 3.0 [28]. In previous research, the fractal dimension was often fitted according to the fragment size distribution to assess the fragmentation quantitatively [33,34].
In summary, as blasting fragments are typical irregular particles, most previous studies focused on characterizing the shape features of rock particles within a small particle size range. Limited research exists on the shape and fractal characteristics of blasting fragments across the entire particle size range. Furthermore, SSA is a useful indicator for calculating rock fragmentation energy, as it comprehensively reflects particle size and shape characteristics [3]. Neglecting the shape properties of blasting fragments would inevitably reduce the accuracy of SSA calculations along with the accuracy of evaluating the explosive energy utilization efficiency [35,36,37]. Thus, fractal theory must be used to study the shape characteristics of blasting fragments across the entire particle size range.
In this study, seventeen field blasting tests at four quarries and indoor measurements of shape parameters of randomly collected blasting fragments were performed. Image processing techniques were employed to obtain blasting fragmentation distribution for each test. Using fractal theory, the fractal dimensions of the particle size distribution and fragmentation were calculated, revealing the multifractal characteristics of rock blasting fragmentation and clarifying the probability of rock blasting fragmentation. Moreover, a predictive formula for the SSAs of blasting fragments was established using the fragmentation fractal dimension.

2. Material and Methods

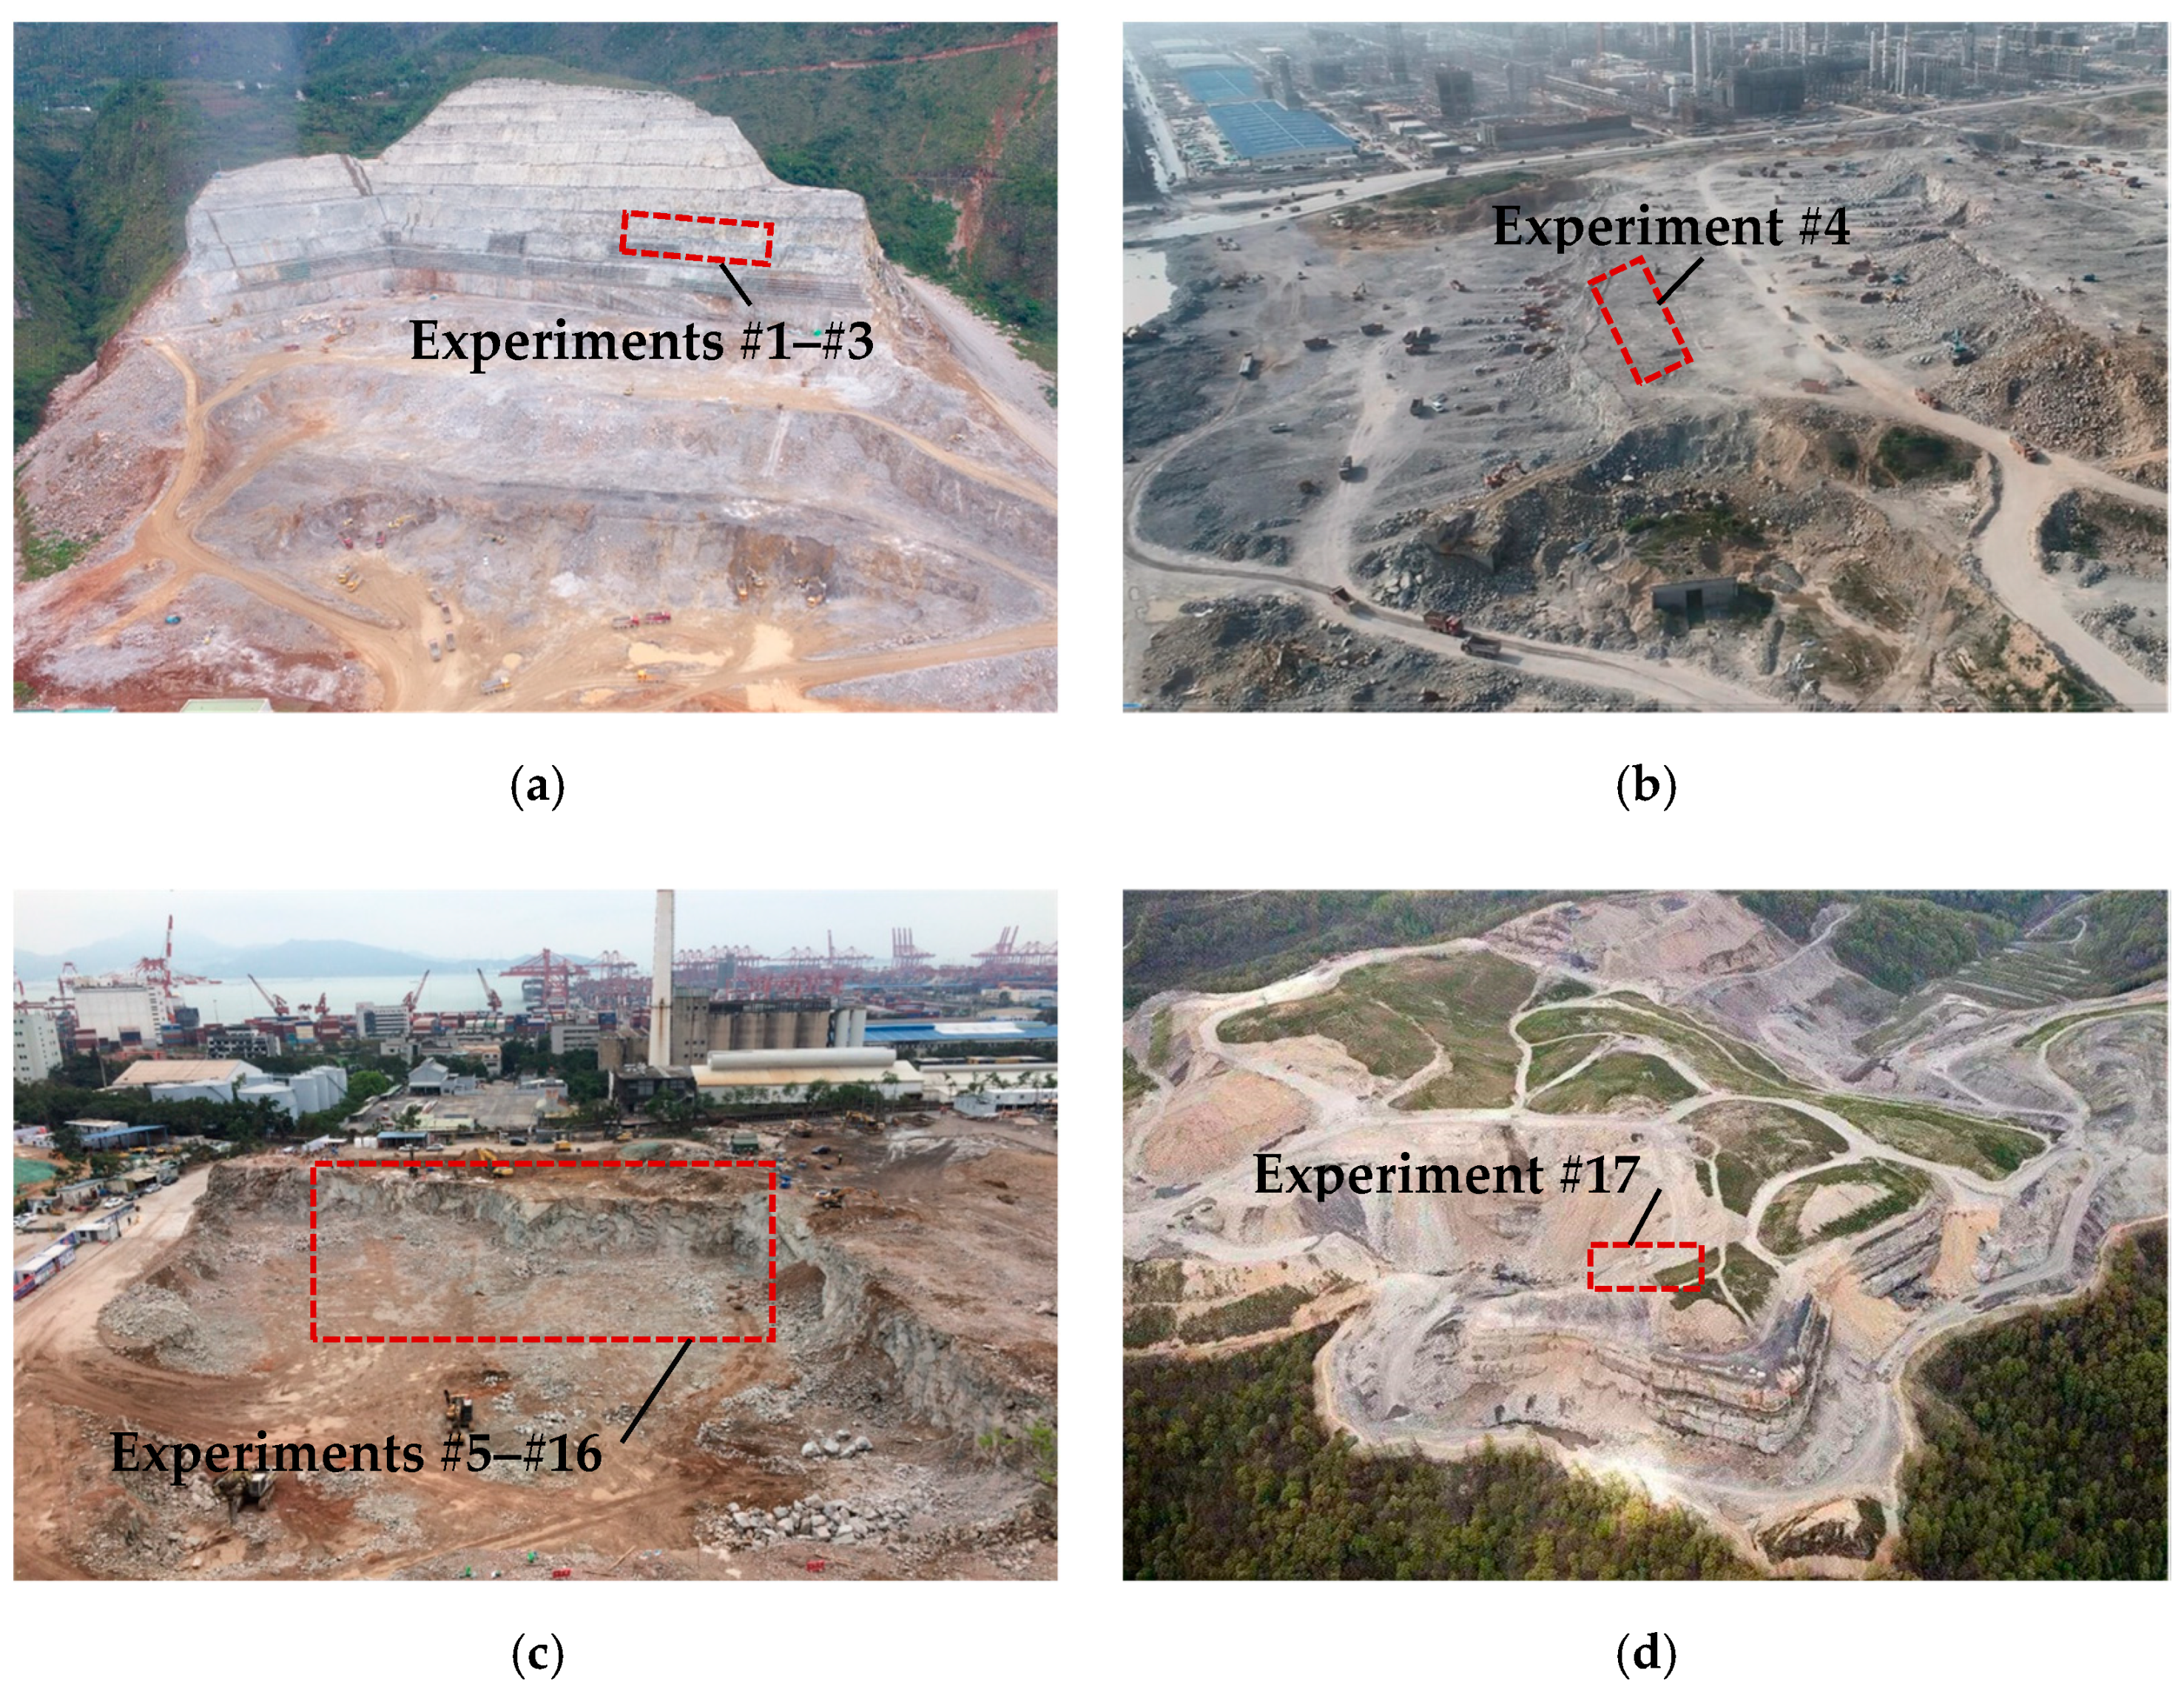
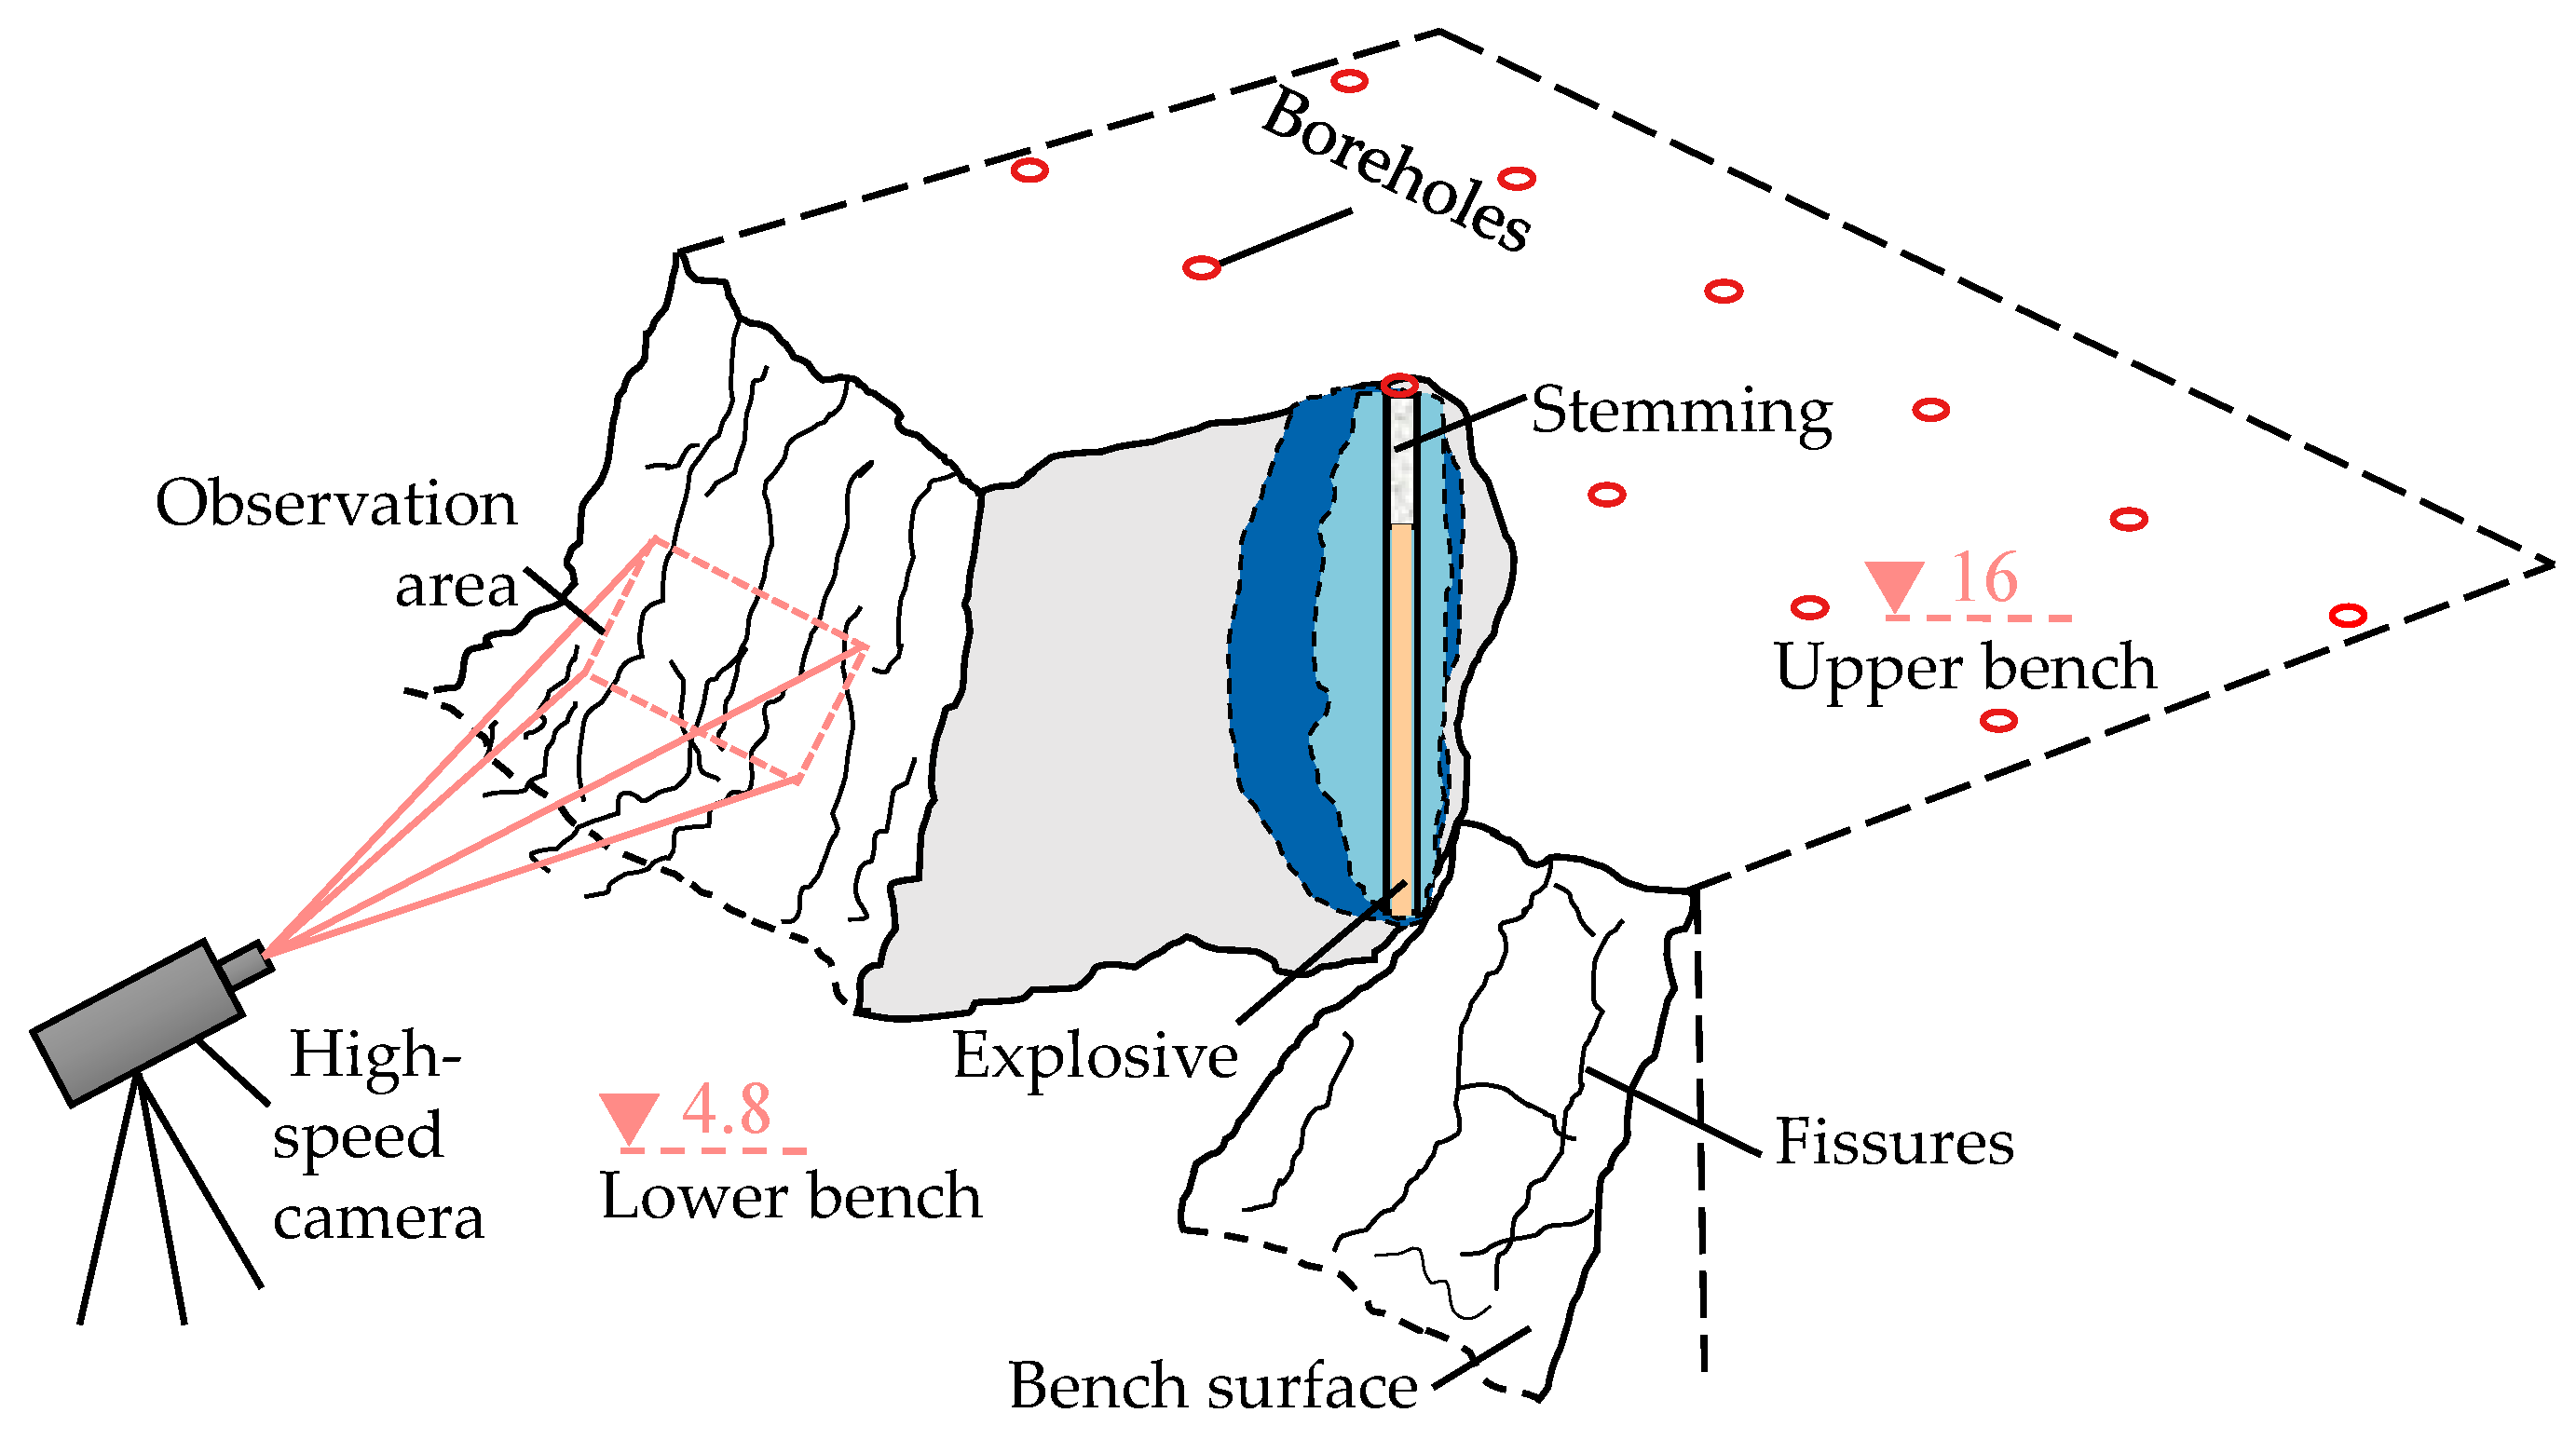
2.1. Field Blasting Experiments

To investigate the fractal characteristics of blasting fragments, a total of seventeen deep-hole bench blasting experiments were conducted at four quarries. The test locations in each quarry are depicted in Figure 1, and the blasting parameters for each experiment are presented in Table 1. The primary physical and mechanical parameters of the rock mass within the experiment areas are presented in Table 2.
Among the twelve blasting experiments conducted in quarry Q3, experiments #12–#16 involved conventional bench blasting experiments, experiments #5–#10 involved blasting with shock-reflection devices, and experiment #11 involved water-decked blasting. The typical charging construction for blasting with shock-reflection devices and water-decked blasting experiments is illustrated in Figure 2. Experiment #17 employed a mixture of porous granular ammonium nitrate explosive and featured a continuous charging construction.

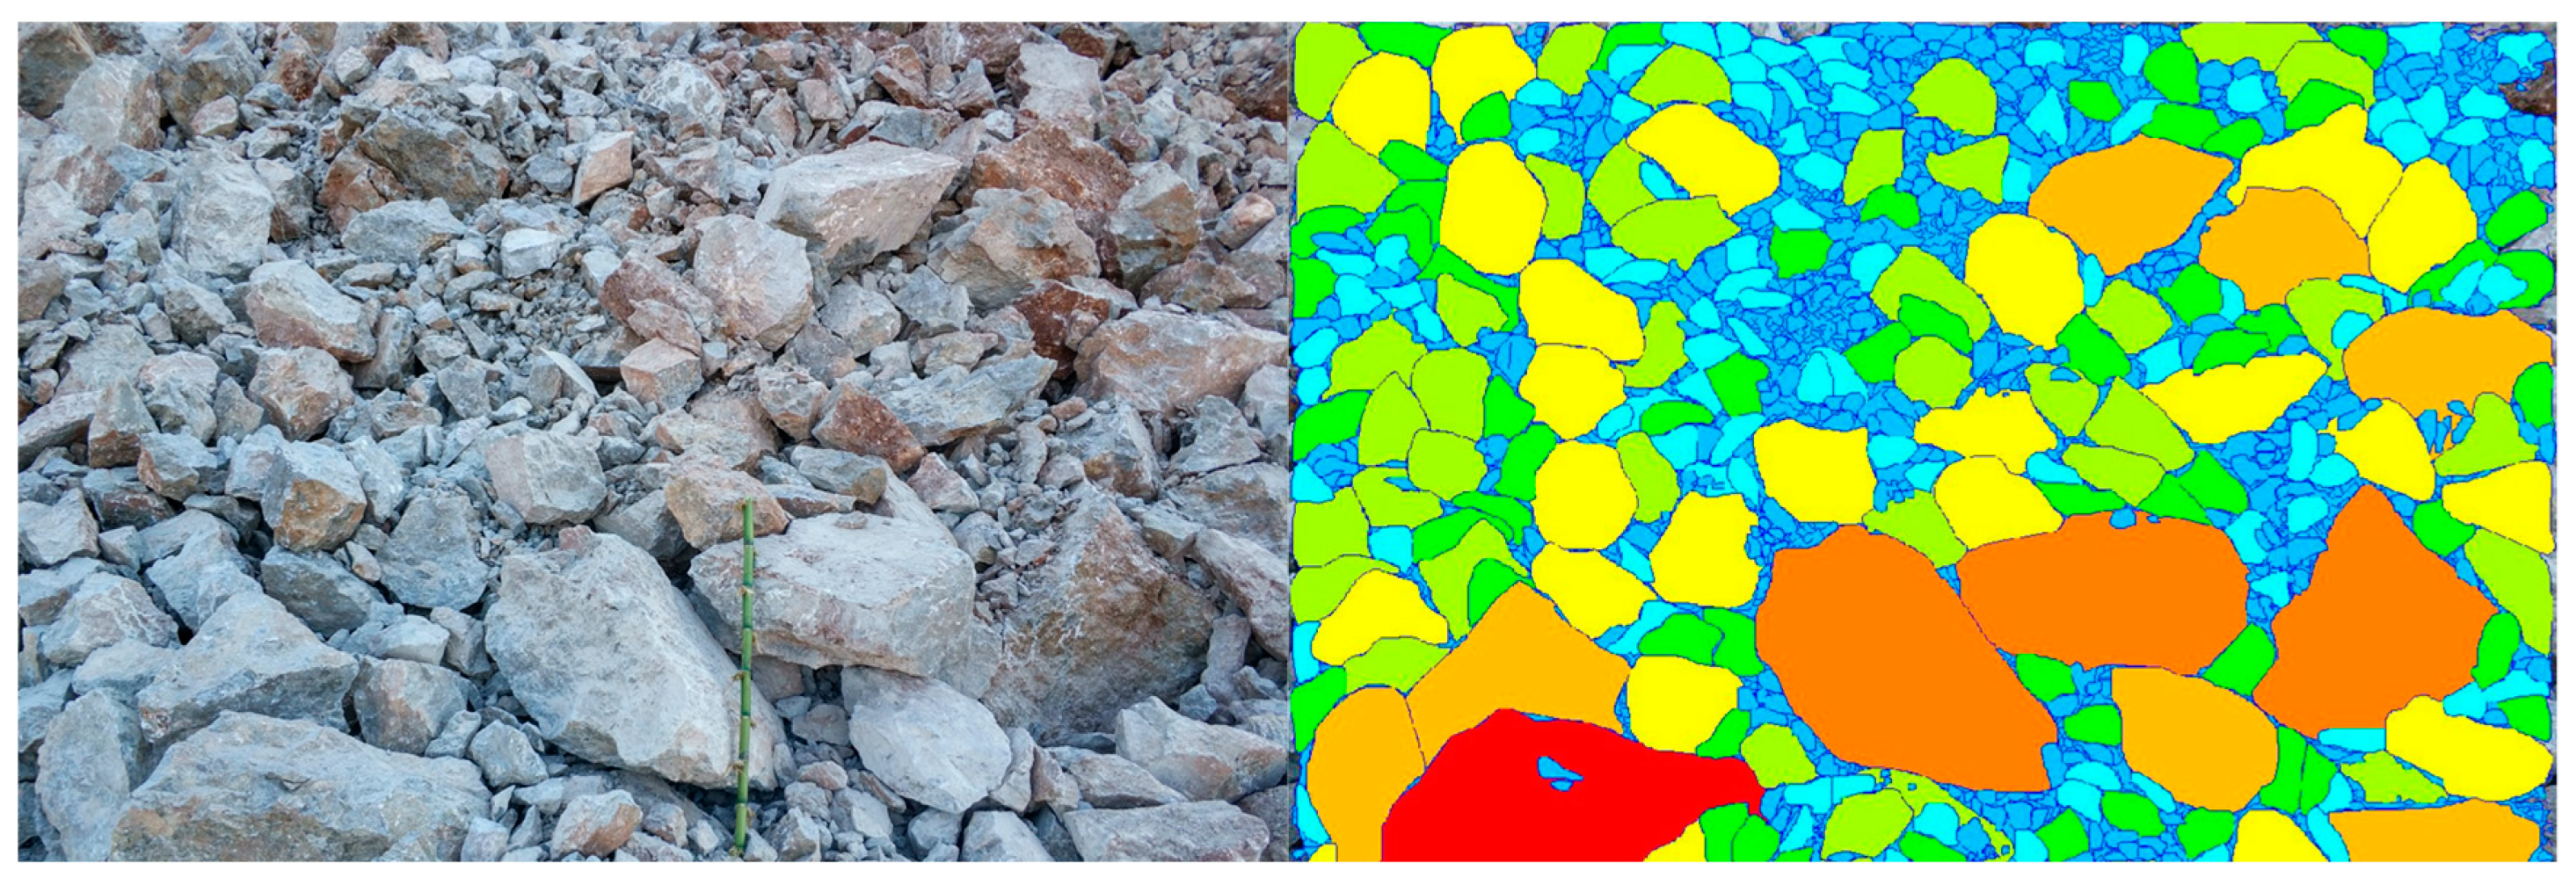
2.2. Blasting Fragmentation Distribution Curve Detection Experiments

During open-pit mining, the muck pile volume typically reaches thousands of cubic meters, with the maximum particle size exceeding 1000 mm [7]. In this context, conducting sieve tests for measuring blasting fragmentation distribution curves is expensive and requires substantial sampling effort and long test durations; additionally, it may interfere with other production processes [9,38]. Therefore, in this study, image processing techniques were employed to measure the blasting fragmentation distribution curves for each experiment.
To ensure accuracy, eighteen to twenty-five images of the blasting fragments were collected from cross-sections formed on the surface of the muck pile or during the shoveling and loading processes [39]. The static image capture method was utilized during the experiments, and ten to twenty representative images were selected for processing. It was ensured that each image contained at least four hundred blasting fragments. Representative images with their image processing outcomes are shown in Figure 3, and the blasting fragmentation distribution curves for each experiment are presented in Figure 4.

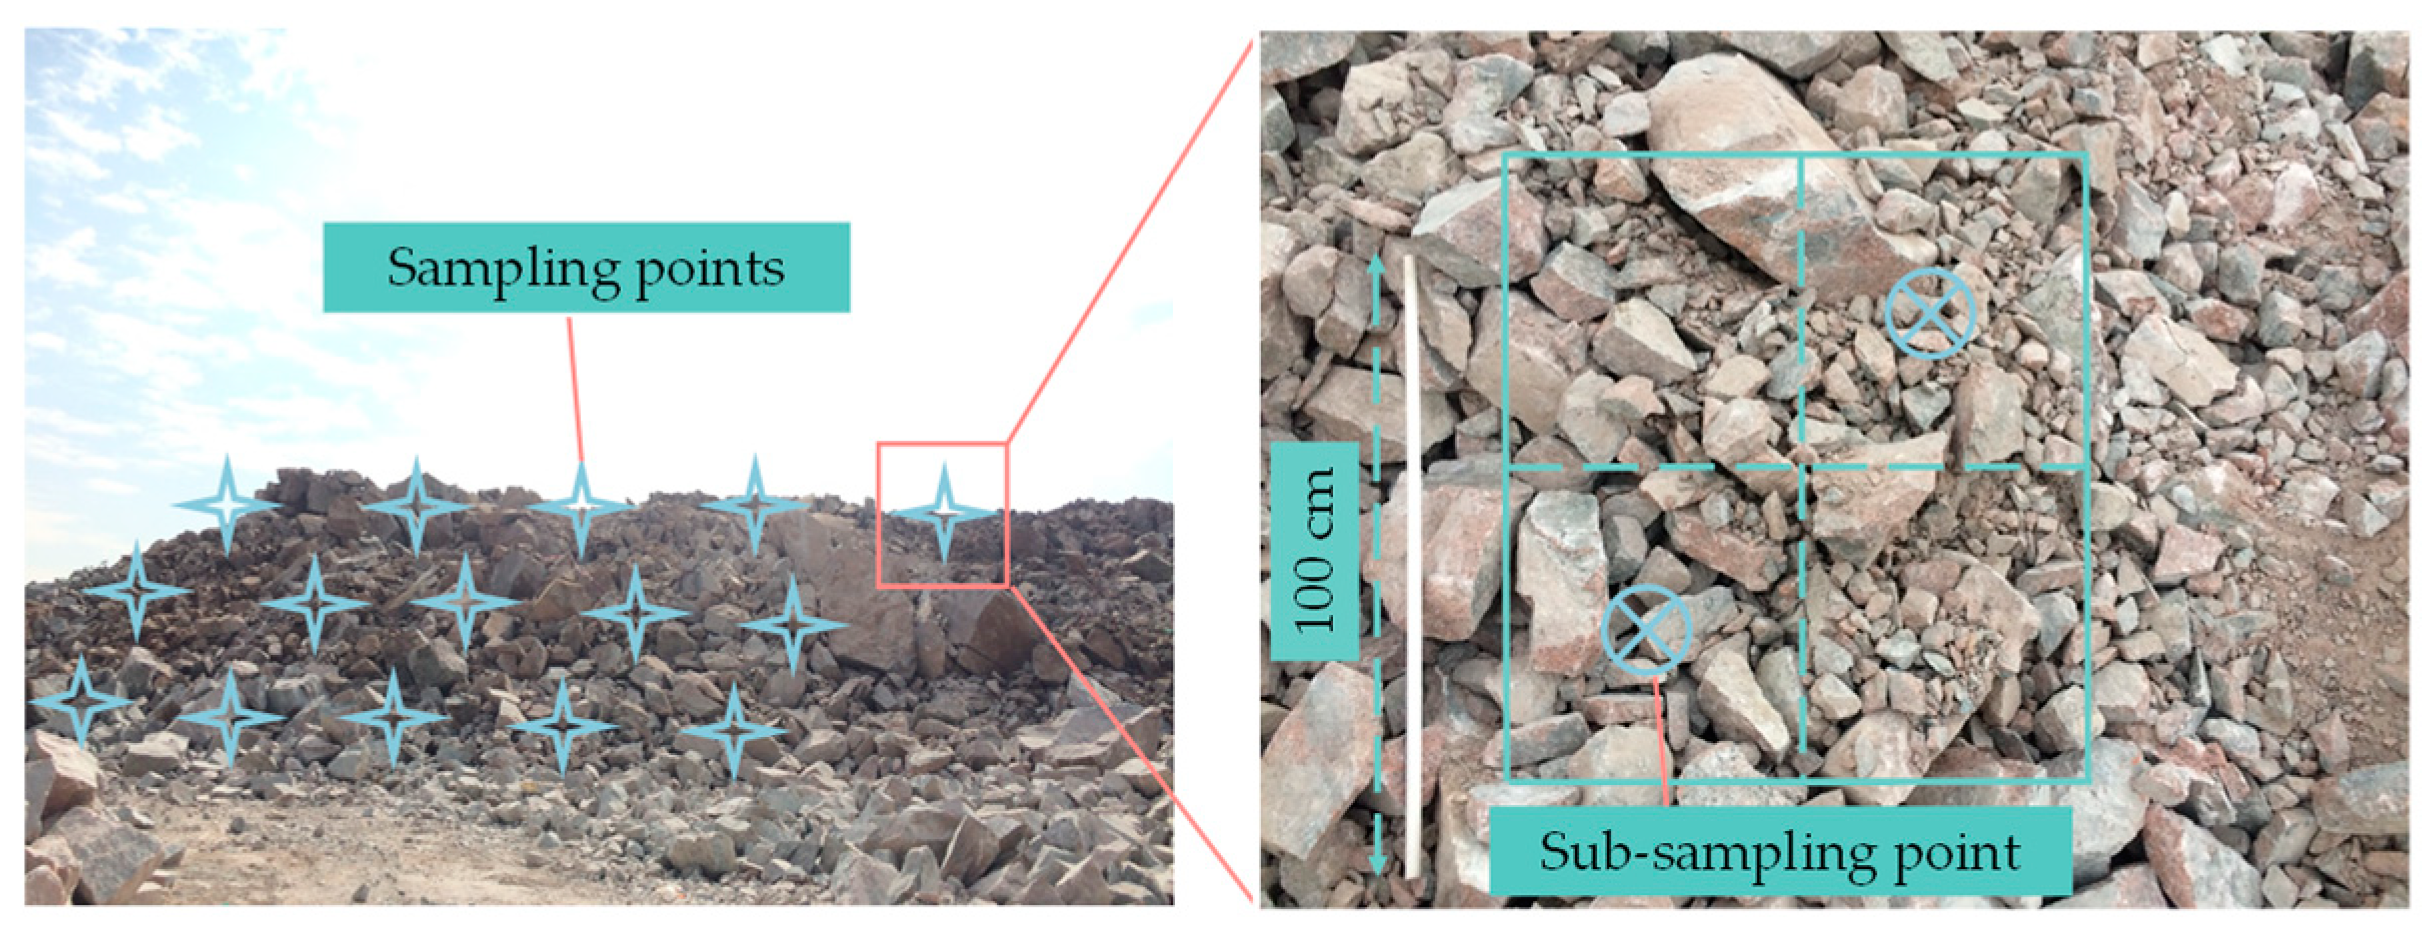
2.3. Shape Characteristics and SSA Measurement Experiments

After the blasting experiments, a certain number of blasting fragments were randomly collected from muck piles for indoor shape parameter measurement experiments. The top, middle, and bottom of the muck piles each had five uniformly distributed sampling points. Approximately equal quantities of fifteen fragment samples were extracted from each subsampling point, forming a bulk sample group. The distribution of sampling points in the upper, middle, and lower layers of the muck pile, as well as the subsampling points within the sampling points, are illustrated in Figure 5.
In this study, 322, 209, 1878, and 285 blasting fragments were randomly collected from quarries Q1, Q2, Q3, and Q4, respectively. Subsequently, image processing techniques were employed to calculate the particle size and shape parameters of each blasting fragment. The SSA was computed using an equivalent ellipsoid model, and the calculation process and results can be found in previous works [3,40]. The calculation formula was as follows:
SSA = S ρ V = α 1 4 π r 1 2 ρ 4 3 π r 1 3 = 3 α 1 ρ r 1 ,
where α1 is the equivalent ellipsoid correction coefficient, and r1 represents the equivalent radius of the ellipsoid (cm), which is given as
r 1 = ( a 2 c ) 1 3 .
Here, a and c represent the long and short axes, respectively, of the equivalent ellipsoid. Assuming that the proportions of blasted fragments with a > c and a < c were equal, α1 was calculated with a weight of 0.5.
For a > c, α1 was calculated as follows:
α 1 = 2 π a + 2 π a c 2 a 2 c 2 ln ( a + a 2 c 2 c ) 4 π a 2 c 3 r 1 3 .
For a < c, α1 was calculated as follows:
α 1 = 2 π a c 2 1 c 2 a 2 arcsin c 2 a 2 c + 2 π a 2 4 π a 2 c 3 r 1 3 .

3. Theory and Calculation Results

3.1. Theory for Fractal Dimensions of Particle Size Distribution

The fractal features of rock particles are predominantly quantified using two methods: particle size–frequency and mass–frequency [28].
Considering particle size–frequency,
N = N 0 ( d i / d max ) D ,
where N represents the number of rock particles with characteristic sizes greater than or equal to di, N0 represents the number of rock particles with the largest characteristic size dmax, and D represents the fractal dimension of the particle size distribution.
When calculating the fractal dimensions of the particle size distribution using Equation (5), a uniform particle shape and density must be assumed. These assumptions often lead to significant errors. Tyler et al. postulated a constant density for particles of varying sizes and, by employing strict self-similarity, derived a 3D model for the fractal distribution of rock particles based on the size–cumulative mass relationship [41].
Under a constant density, the mass of rock particles with diameters exceeding a characteristic diameter di is expressed as
M ( d > d i ) = ρ C V [ 1 ( d i λ V ) 3 D F ] ,
where DF represents the fractal dimension of rock fragmentation; CV and λV are constants related to the rock particle size and shape, respectively; and ρ represents the density of rock particles.
When di is set to zero, the total mass of rock particles in the muck pile, as calculated using Equation (6), is
M T = ρ C V .
Rock particles with diameters exceeding the maximum diameter dmax in the muck pile have zero mass. Substituting this into Equation (6) yields
λ V = d max .
According to Equations (5)–(8), it follows that
M ( d < d i ) M T = 1 M ( d > d i ) M T = ( d i d max ) 3 D F .
Taking the logarithm of both sides of Equation (9) yields
log [ M ( d < d i ) M T ] = ( 3 D F ) log ( d i d max ) .

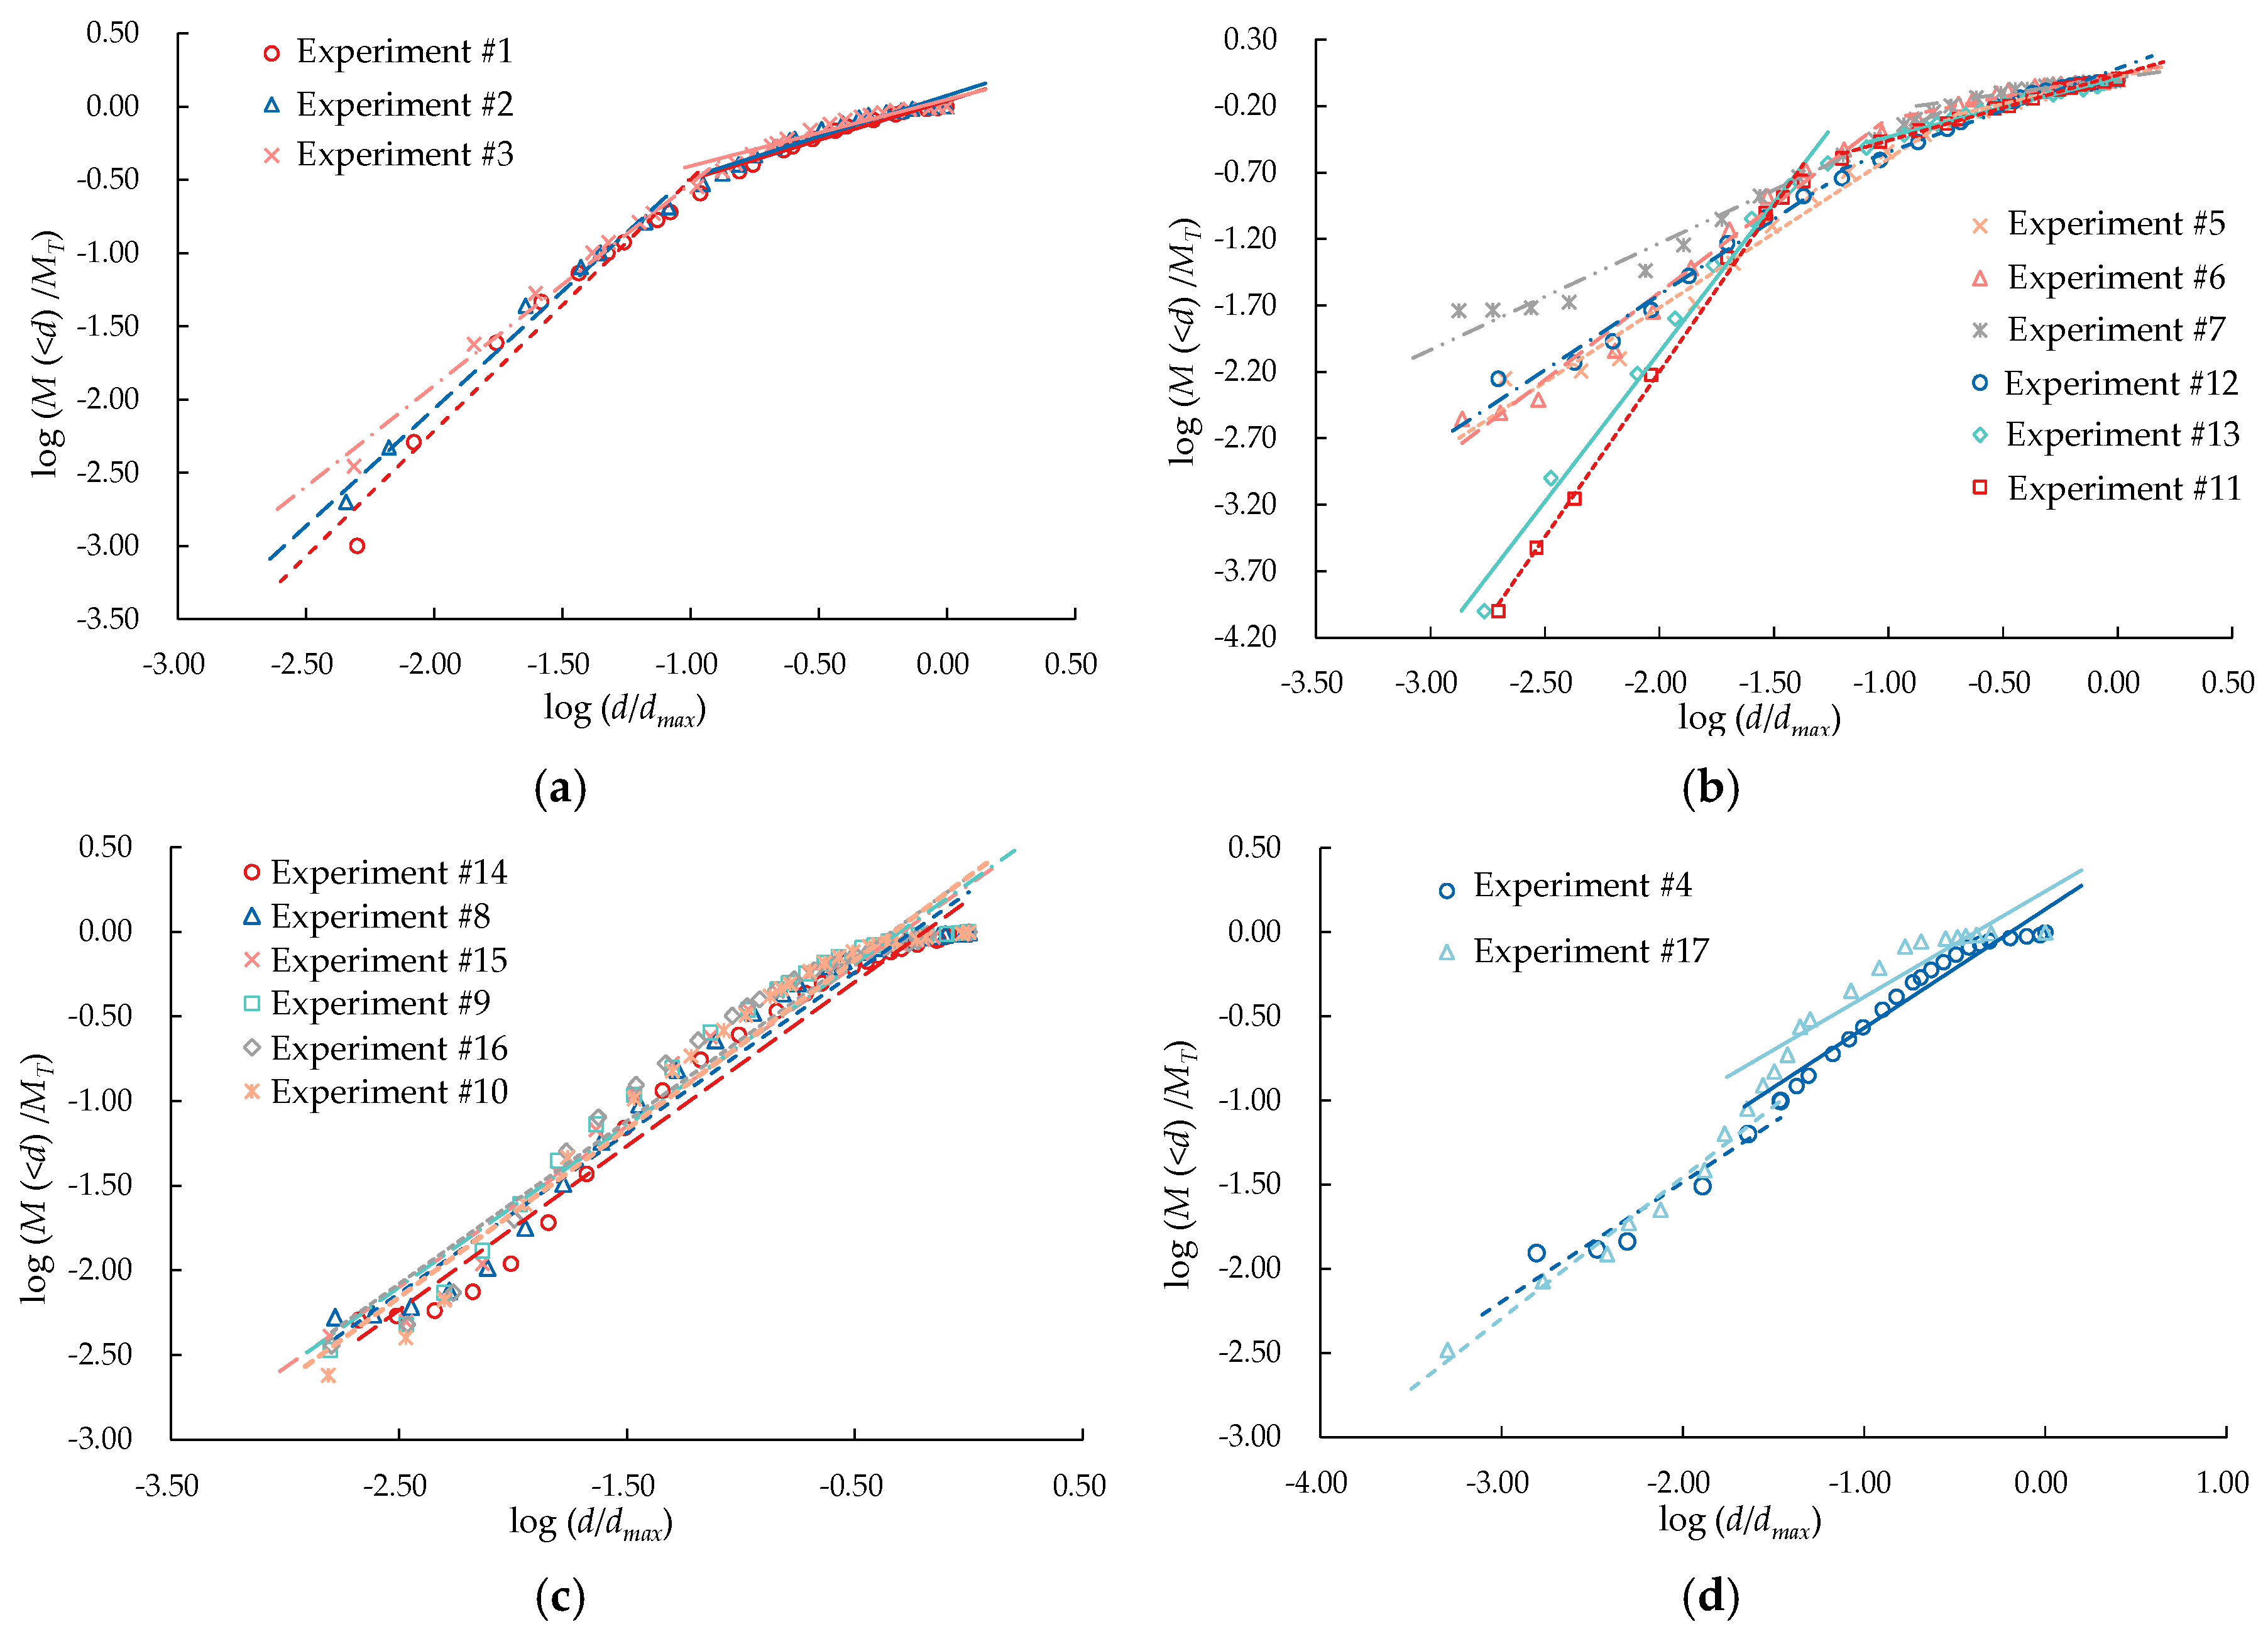
3.2. Calculation of Fractal Dimensions of Particle Size Distribution

According to the image processing results for the shape parameters presented in Section 2.3, the power-law fractal distribution curves of the minimum enclosing cubic dimensions (L, I, S) of the blasting fragments were obtained for each experiment, as shown in Figure 6.
For small particles, size measurement through image processing is relatively inaccurate, and the number of large particles in the muck piles is limited. Consequently, data deviations are observed at both ends in Figure 6, which can adversely affect the fitting of the power-law fractal distribution curve. Therefore, data with particle sizes greater than 5 mm but less than 900 mm were employed for fitting in this study. The results are presented in Table 3.
As shown in Figure 6 and Table 3, the coefficient of determination (R2) for fitting the power-law fractal distribution of blasting fragments via the particle size–frequency method for all four quarries was greater than 0.94, indicating a good fitting effect. The fractal dimensions of the particle size distribution obtained through three characteristic dimensions for each of the four quarries were all less than 2. Additionally, significant differences existed in the fractal dimensions of the particle size distribution obtained using different characteristic dimensions, indicating that the characteristic dimensions significantly affected the fractal dimensions of the particle size distribution. This result is consistent with the findings of Li et al. [42] concerning the fractal characteristics of granite rock fragments resulting from blasting experiments. Furthermore, quarry Q4 exhibited a significantly larger fractal dimension of the size distribution for limestone blasting fragments. We attribute this to the use of mixed-porous granular ammonium nitrate explosives in test #17. In this case, the coupled explosive charging construction enhanced the fragmentation under the influence of blast loads.

3.3. Calculation of Fractal Dimensions of Blasting Fragmentation

The size–cumulative mass fractal distribution curves for each experiment were obtained using Equation (10), as shown in Figure 7. The fractal dimensions of fragmentation and the statistical scale-free intervals are presented in Table 4 and Table 5, respectively.
As shown in Table 4 and Table 5, R2 for the particle size–cumulative mass was greater than 0.88 for all the blasting experiments conducted at the four quarries. In general, a coefficient of determination (R2) above 0.8 indicates a good fitting effect. In most cases, the coefficient of determination (R2) of the particle size fractal curve was always greater than 0.839 [43]. This indicates that the blasting fragmentation distribution had distinct fractal characteristics. Comparative fitting was performed, and the blasting fragmentation distribution fractal curves of experiments #1–#7, #11–#13, and #17 could be linearly fitted with two line segments in the bilogarithmic plane, i.e., the blasting fragments obtained from experiments #1–#7, #11–#13, and #17 exhibited two scale-free intervals. Thus, the blasting fragments obtained from these experiments exhibited self-similarity within two scale-free intervals, indicating dual fractal characteristics.
On the basis of Figure 7 and Table 4 and Table 5, the fractal dimensions of blasting fragmentation (DF) for each experiment are presented in Figure 8. As indicated by Table 4 and Table 5 and Figure 8, influenced by factors such as physical and mechanical properties of the rock mass, joint distribution, excavation method, and blasting parameters, the scale-free intervals and DF values differed significantly among the experiments, revealing multiple fractal characteristics. As shown in Figure 8a, the DF differences were substantial between the two scale-free intervals, with DF values mostly exceeding 2.3 in the large scale-free interval and remaining below 2.3—mostly below 2.0—in the small scale-free interval. This variation pattern is consistent with the multifractal characteristics variation observed by Sammis et al. [44] in the fault-gouge fragmentation process.
The lithology of both quarries Q1 and Q4 is limestone. However, quarry Q4 had a lower rock compressive strength, and experiment #17 employed a coupled explosive charging structure using mixed-porous granular ammonium nitrate. Under the action of blast loads, quarry Q4 consumed more explosive energy near the boreholes, resulting in more pronounced fragmentation, which caused the small scale-free interval in experiment #17 to be narrower than those in experiments #1–#3. However, within the small scale-free interval, the DF value in experiment #17 exceeded those in experiments #1–#3, indicating a higher level of fragmentation. Moreover, as shown in Figure 8a, despite significant differences in the large scale-free intervals between the two quarries, the variation in DF remained minor.
The lithology of quarry Q3 is granite. When the bench height was 12 m (experiments #5–#7 and #11–#13), the rock fragmentation exhibited multifractal characteristics. However, when the bench height was 8 m (experiments #8–#10 and #14–#16), multifractal characteristics were not observed during the fragmentation process. When the bench height was 12 m, experiments #5–#7 and #11 employed blasting techniques involving shock-reflection devices and water-decked devices, respectively. These two excavation methods increased the transmission and reflection of stress waves within the rock, enhancing the fragmentation in the small scale-free interval and resulting in higher fragmentation levels and larger DF values within the small scale-free interval than within the large interval. In addition, Figure 8b shows that when the bench height was 8 m, the blasting with shock-reflection devices (experiments #8–#10) and the conventional bench blasting technique (experiments #14–#16) yielded similar DF values. However, the granite in this area had significant weathering; thus, further research into the effects of excavation methods on rock fragmentation characteristics is needed.

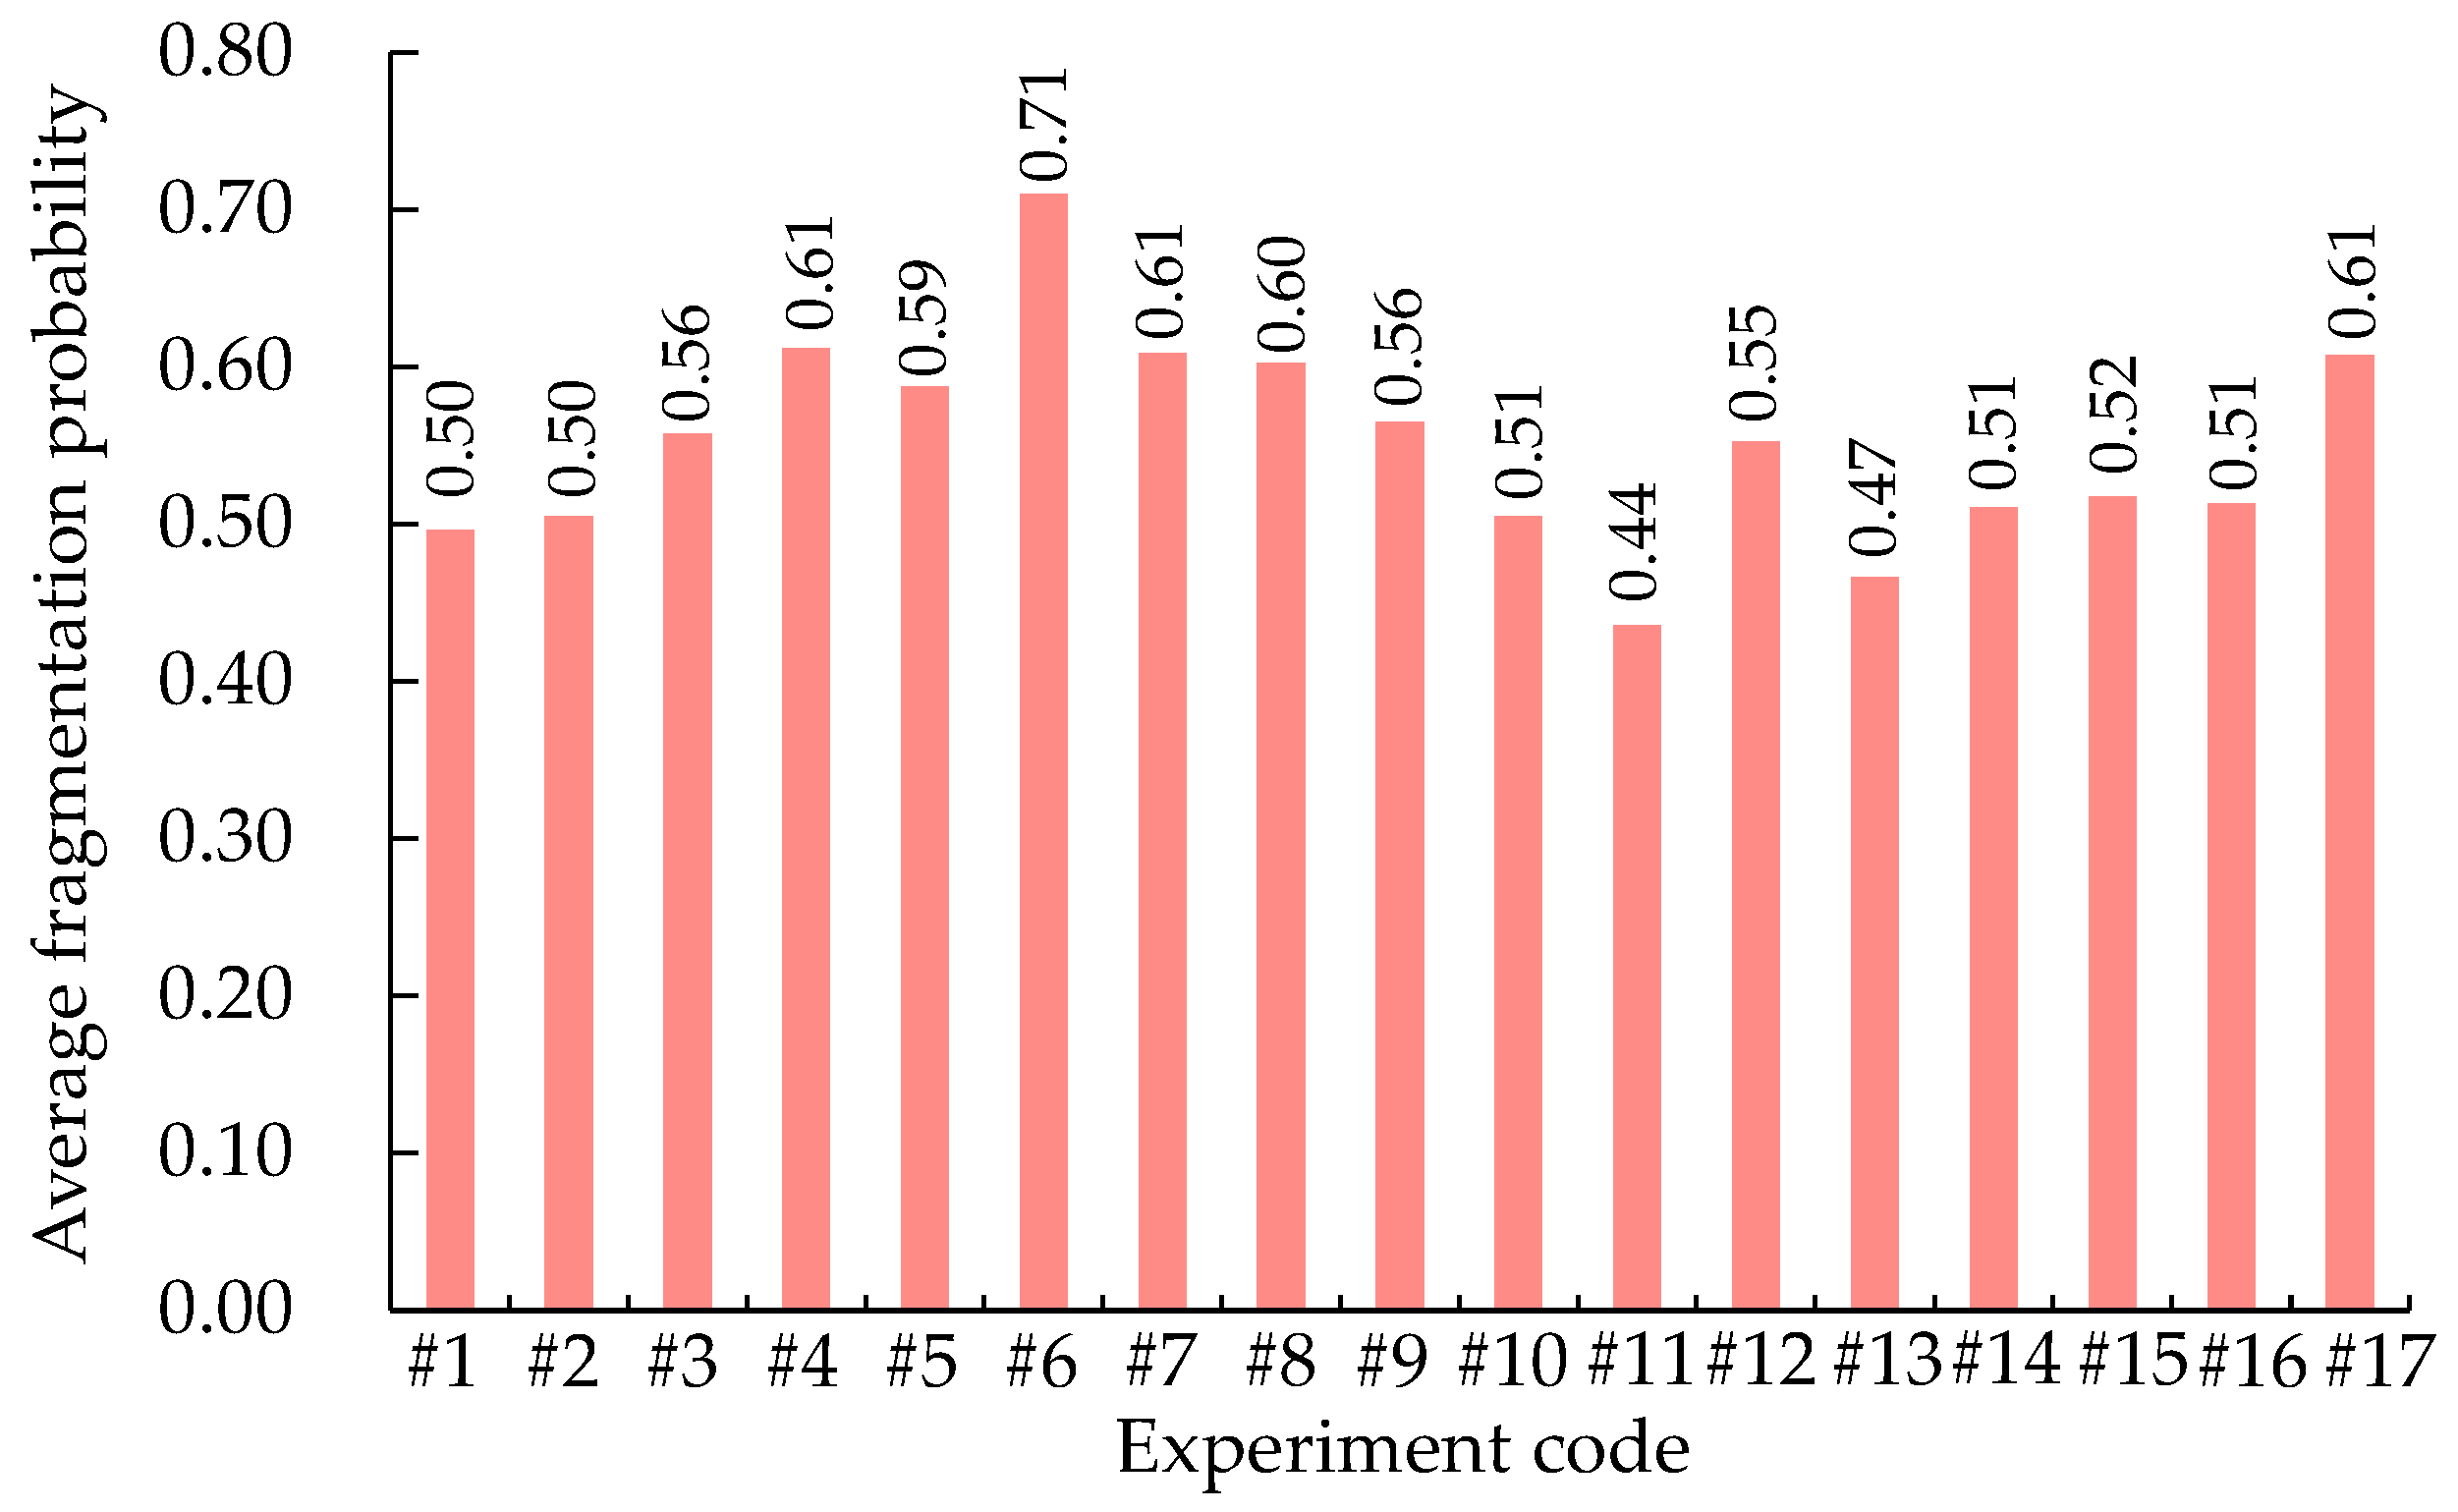
3.4. Calculation of Probability of Blasting Fragmentation

The fragmentation fractal dimension is a crucial parameter for studying the degree of rock fragmentation and fracture patterns. Because rock fragmentation exhibits self-similarity, Xie et al. [28] proposed the following formula for calculating the probability of rock fragmentation:
D F = log ( n P c ) log ( 1 r ) ,
where Pc represents the probability of further rock fragmentation, r represents the fragmentation similarity ratio, and n represents the number of secondary fragmentation units.
At quarry Q3, high-speed photography using the Phantom Veo710l camera was employed to monitor the granite-rock-blasting fragmentation process multiple times. The setup of the high-speed camera is illustrated in Figure 9. Through a comparative analysis of high-speed images of the bench surface before and after blasting, the macroscopic crack distribution on the bench surface was determined, as shown in Figure 10.
As shown in Figure 10, under the action of explosive energy, the rock of the bench surface underwent multistage fragmentation, with each stage resulting in smaller fragments of similar shape. According to fractal models such as the Sierpinski carpet, it can be learned from the macrocrack distribution in Figure 10 that the blasting fragmentation process of granite rock underwent two or three stages of fragmentation, with each stage involving a division into smaller fragments with similar shapes and a division factor of 2. This finding implies a fragmentation similarity ratio of 0.5, and the number of secondary fragmentation units was 8. Accordingly, the average blasting fragmentation probability for each experiment was calculated using Equation (11), and the results are shown in Figure 11.
As shown in Figure 11, the average blasting fragmentation probabilities for the four quarries ranged from 0.44 to 0.71. Quarry Q3, which consisted of granite, was excavated using three different methods (experiments #5–#16), resulting in a wide fluctuation range of fragmentation probabilities. When the bench height was the same, employing shock-reflection devices (experiments #5–#10) increased the blasting fragmentation probability. Therefore, adding a shock-reflection device at the bottom of the boreholes enhances the stress wave transmission and reflection, improving the blasting fragmentation effects.

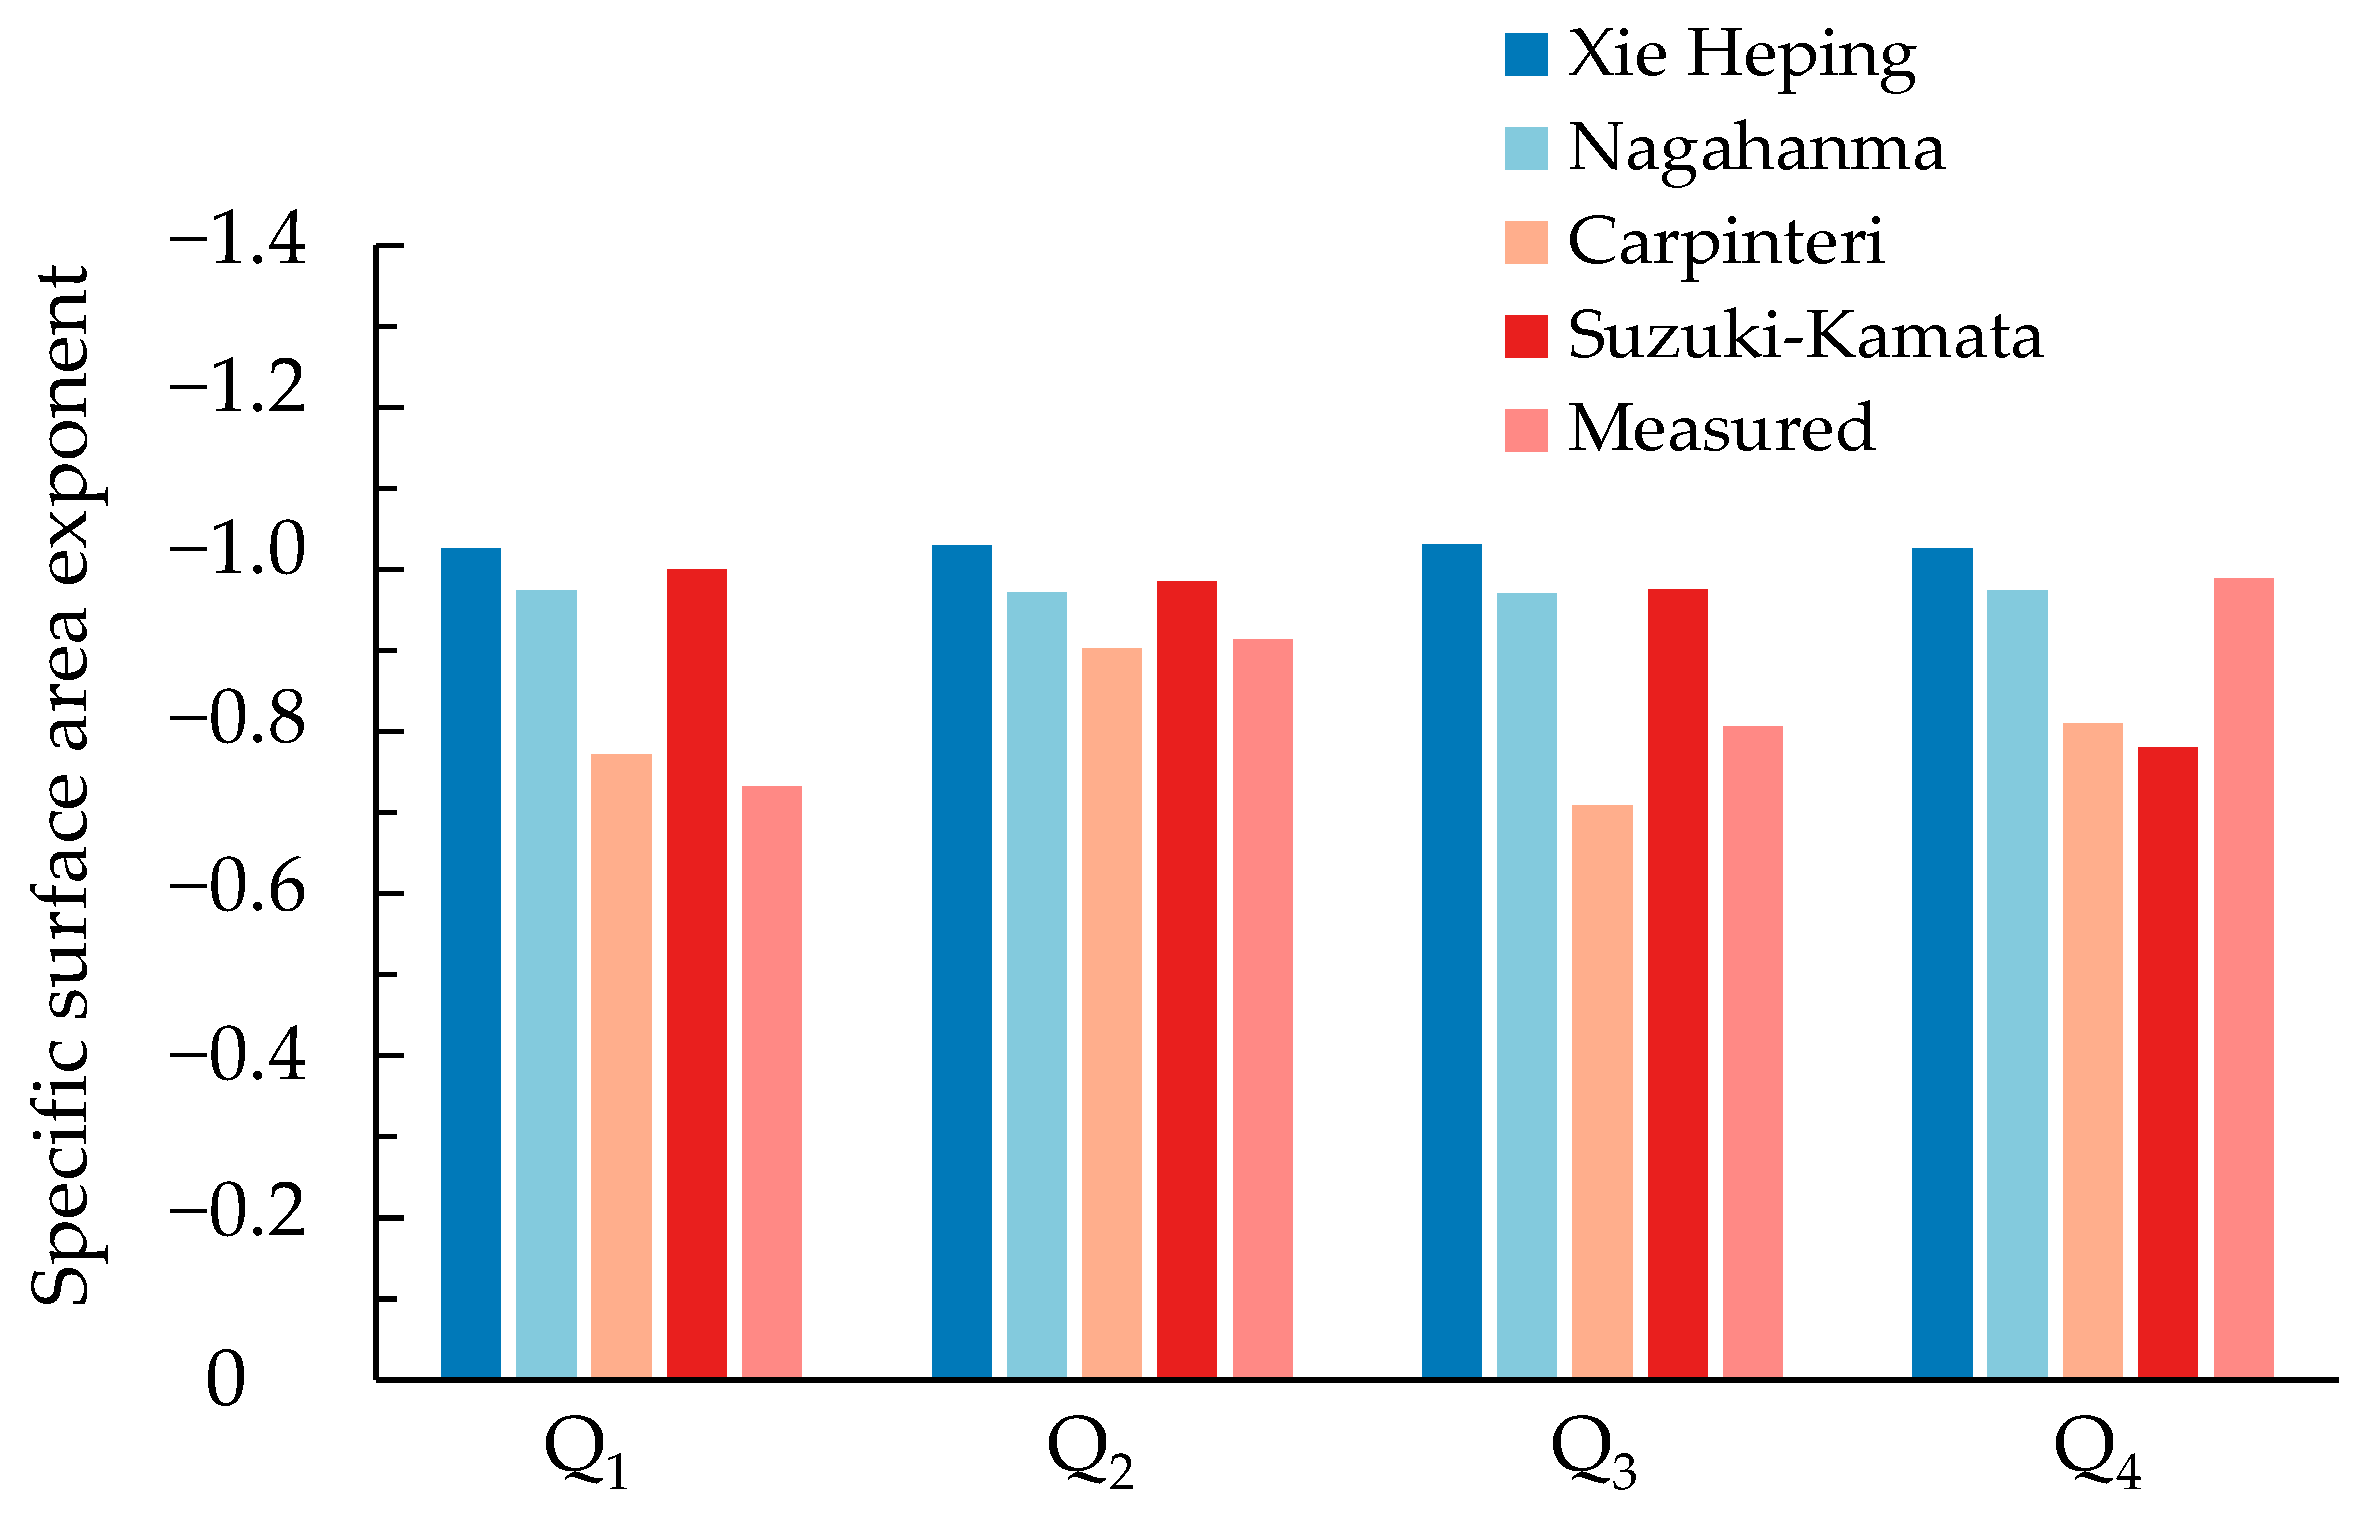
4. SSA and Fractal Dimensions

Studies indicated that the fracture surfaces of rock particles also exhibit fractal structures [28]. For rock particles, the surface area SF is related to the particle size d and the surface fractal dimension Ds as follows:
S F d D s .
By applying the Griffith energy balance criterion, Nagahama [45] analyzed the variations in the potential energy release rate and fracture-specific energy during the rock-particle fragmentation process, proposing a relationship between the SSA of rock particles and their surface fractal dimension:
SSA d D s 3 .
Drawing on the research of Nagahama [45], Suzuki-Kamata et al. [46] used the Walker–Lewis energy equation to derive the relationship between the surface fractal dimension Ds and the fractal dimension of the particle size distribution D:
D s = D + 3 2 .
Substituting Equation (14) into Equation (13) yields
SSA d D 3 2 .
Carpinteri et al. [47] presented the relationship between the SSA of the fragmented material and the fragmentation fractal dimension DF:
SSA d D F 3 .
Using a cubic model, Xie [28] established the relationship between the SSA of rock particles and the particle size:
SSA d D 3 .
The exponents in Equations (13) and (15)–(17) can be regarded as the SSA exponents of rock particles. Detailed measurements and values of Ds and SSA for the blasting fragments randomly collected from the four quarries are presented in references [3,40]. Using the mean particle size distribution fractal dimension D and fragmentation fractal dimension DF reported in Section 3.1 and Section 3.2, the SSA exponents of blasting fragments randomly collected from the four quarries were computed using Equations (13) and (15)–(17). The results are shown in Figure 12.
As shown in Figure 12, the SSA exponents calculated using the surface fractal dimension Ds, fragmentation fractal dimension DF, and particle size distribution fractal dimension D differed from the measured values. The errors are presented in Figure 13.
As shown in Figure 13, the SSA exponents calculated using Equation (16) and the fragmentation fractal dimension DF exhibited the smallest differences from the measured values. Additionally, the findings presented in Section 3.3 indicate that the fragmentation fractal dimension is closely related to the probability of blasting fragmentation, which is associated with the newly generated surface area during the fragmentation process. Hence, the SSA, fragmentation energy, and energy utilization efficiency calculated according to the fragmentation fractal dimension align more closely with practical observations.
According to the above analysis and the SSA presented in references [3,40], a predictive formula for calculating the SSA of blasting fragments using the fragmentation fractal dimension DF and median particle size I is as follows:
SSA = λ 1 I D F 3 + λ 2 ,
where λ1 and λ2 are constants related to the lithology, rock fragmentation process, etc.
The SSAs of blasting fragments in the four quarries are presented in Figure 14. The figure indicates that both the fragmentation fractal dimension DF and median particle size I yield R2 values greater than 0.85 for the SSA, suggesting that the utilization of the fragmentation fractal dimension DF and median particle size I provides accurate predictions of the SSA of blasting fragments. In subsequent research, the volumes and surface areas of blasting fragments with large particle sizes can be easily determined using 3D laser scanning technology, and λ1 and λ2 can be determined through fitting. Then, the SSAs of blasting fragments with a wide grading range can be calculated.
Because the fragmentation fractal dimension DF is less than 3.0 and the SSA exponent is always less than 0, with a larger particle size, the SSA of blasting fragments is closer to the origin. Therefore, as shown in Figure 14, the difference in SSA of blasting fragments with differences in lithology increases as the particle size decreases. According to the calculation results, the average DF values of blasting fragments in the four quarries decrease in the order of Q3, Q1, Q4, and Q2. According to Figure 14, with a larger average DF, the SSA increases faster with a reduction in particle size; thus, a larger DF corresponds to a higher blasting fragmentation probability, more rock fragmentation, and a larger proportion of fragmentation energy in rock blasting. Moreover, all four quarries provide raw materials for downstream crushing processing. The further rock fragmentation due to blasting significantly reduces the energy consumption of downstream mechanical crushing.
Therefore, in the subsequent quarry blasting, the influence of the fragmentation fractal dimension DF on the energy consumption of the mine-to-milling process can be further studied, and the blasting design can be optimized by establishing mathematical models to optimize the energy consumption of the whole process.

5. Conclusions

Through multiple field blasting experiments and indoor measurements of shape parameters of selected blasting fragments, the fractal characteristics of rock blasting fragments were investigated. The probability of rock blasting fragmentation was determined using the fragmentation fractal dimension, and a predictive formula for the SSA of blasting fragments was established. The following conclusions were drawn:
(1)
According to the particle size–frequency relationship, the fractal dimensions of the particle size distribution calculated using different characteristic sizes were all less than 2, and the characteristic size significantly affected the computed fractal dimensions of the particle size distribution.
(2)
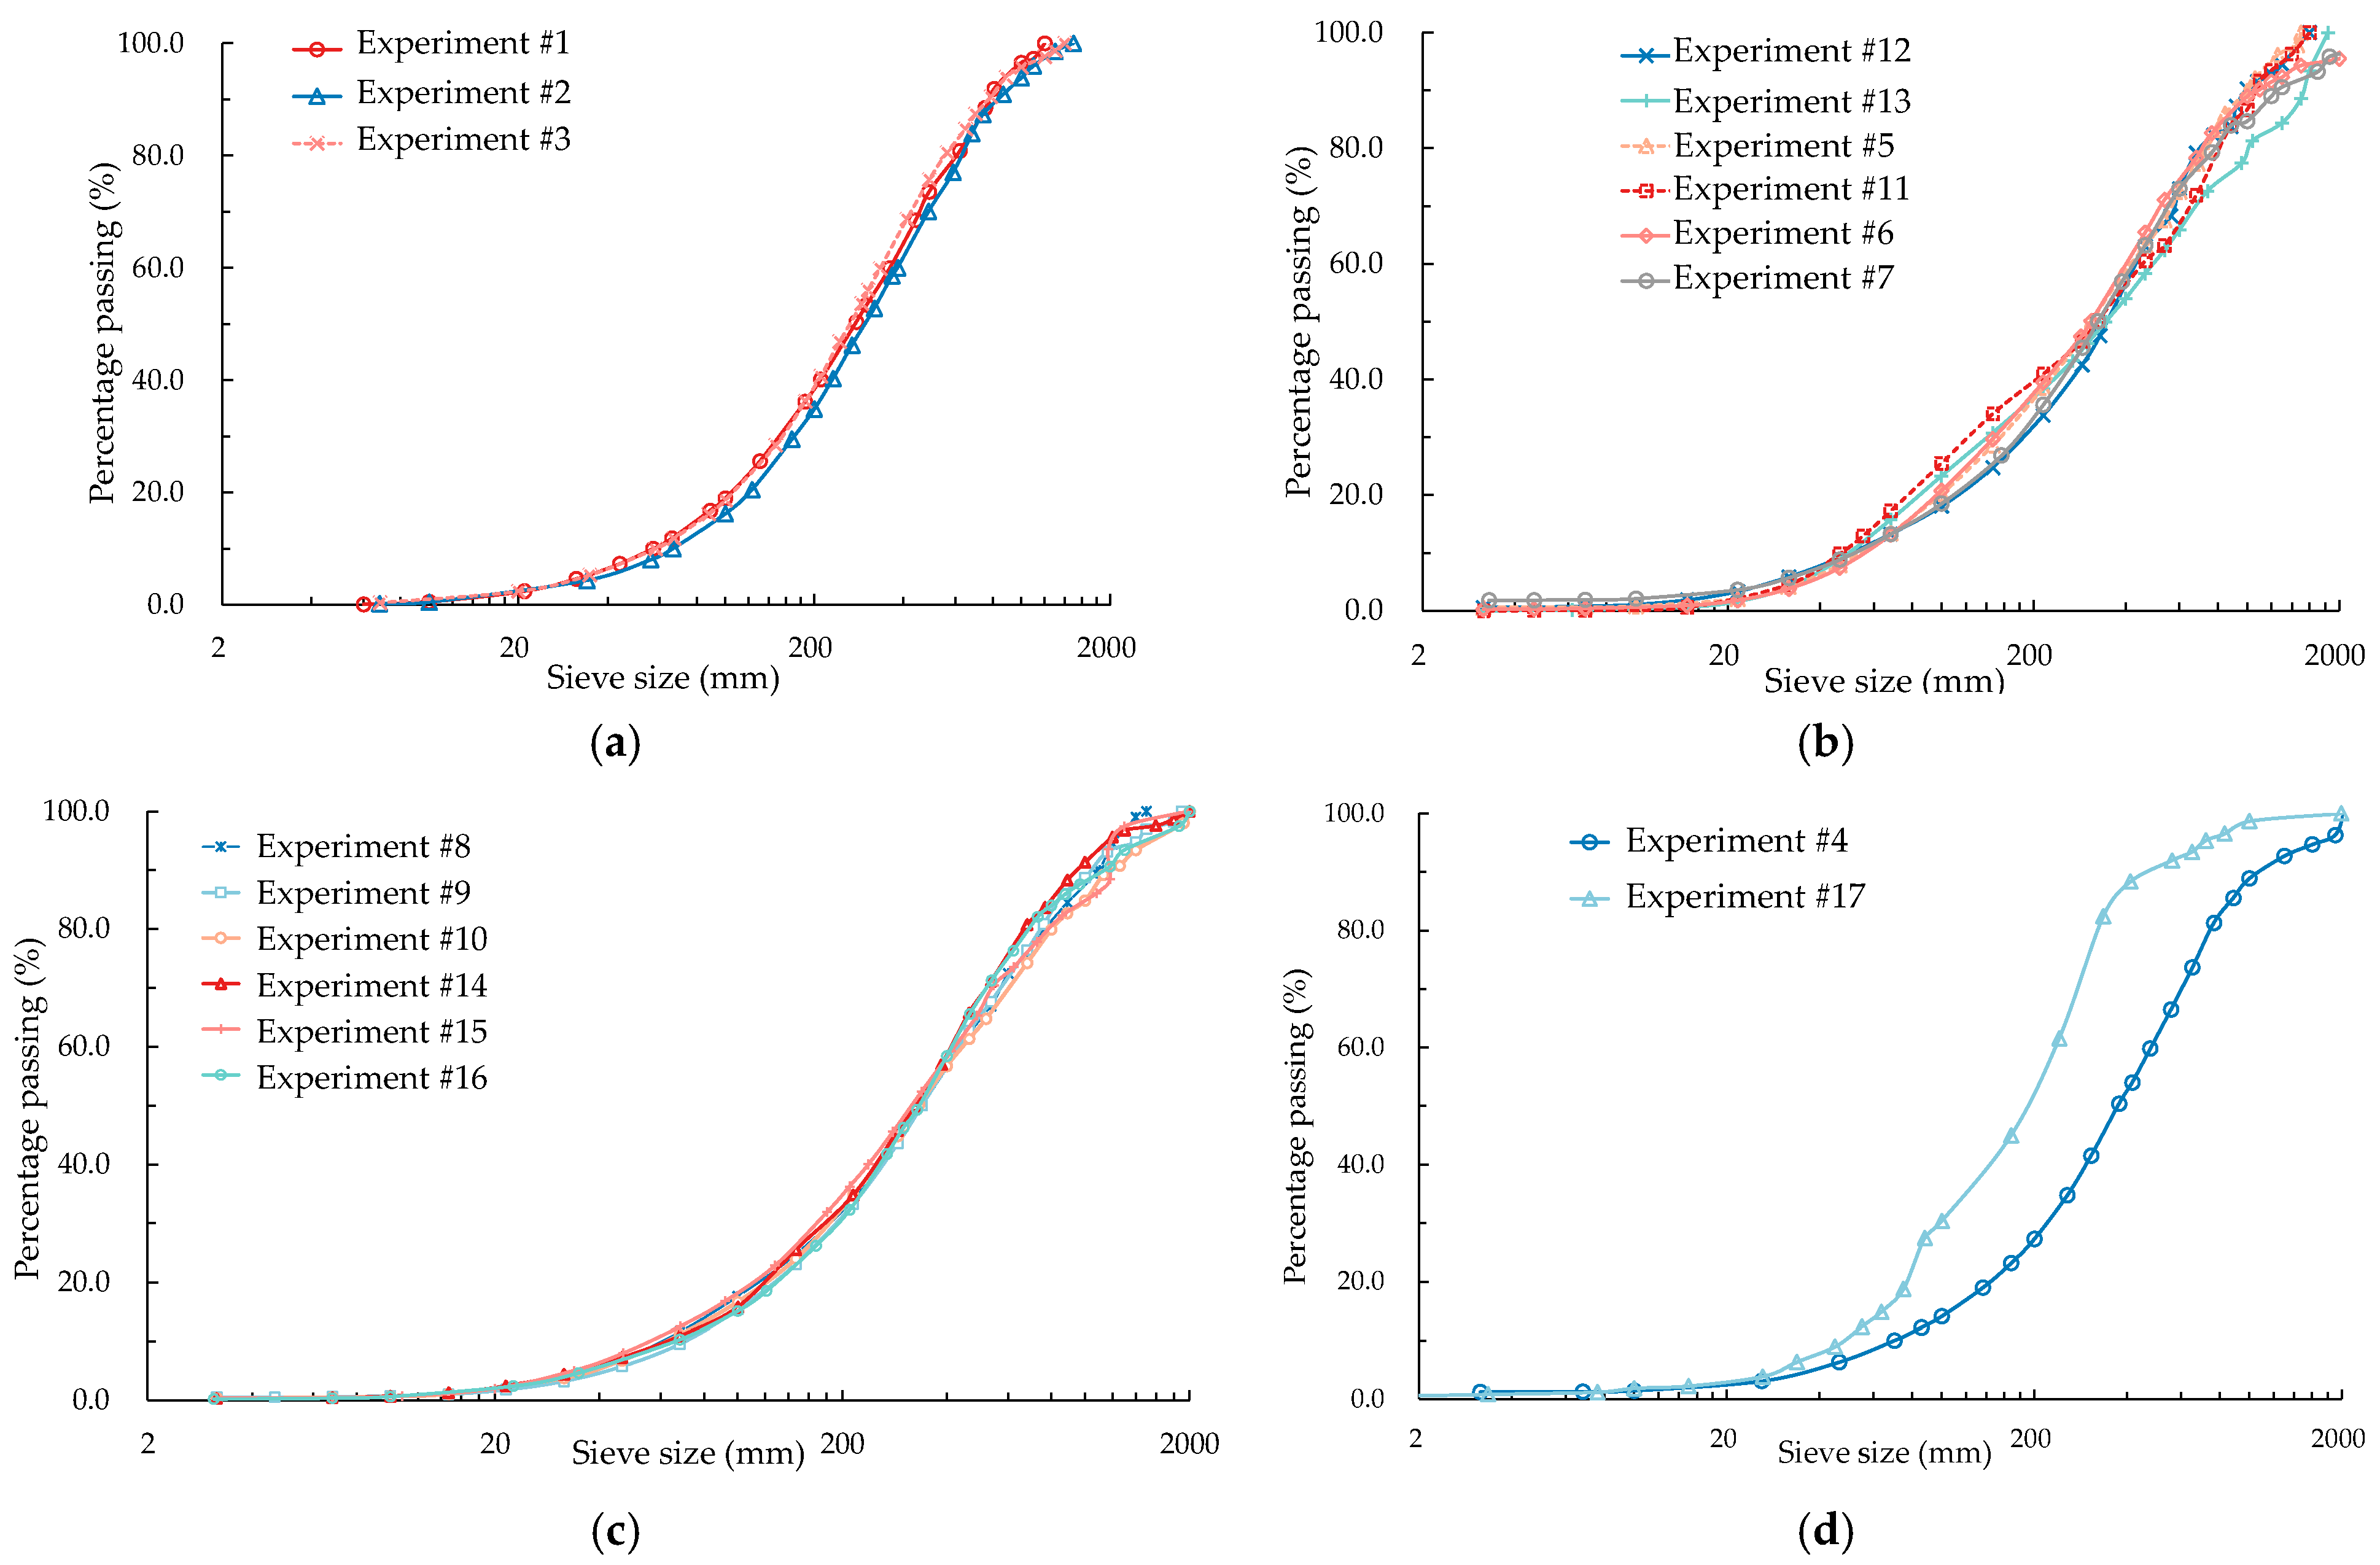
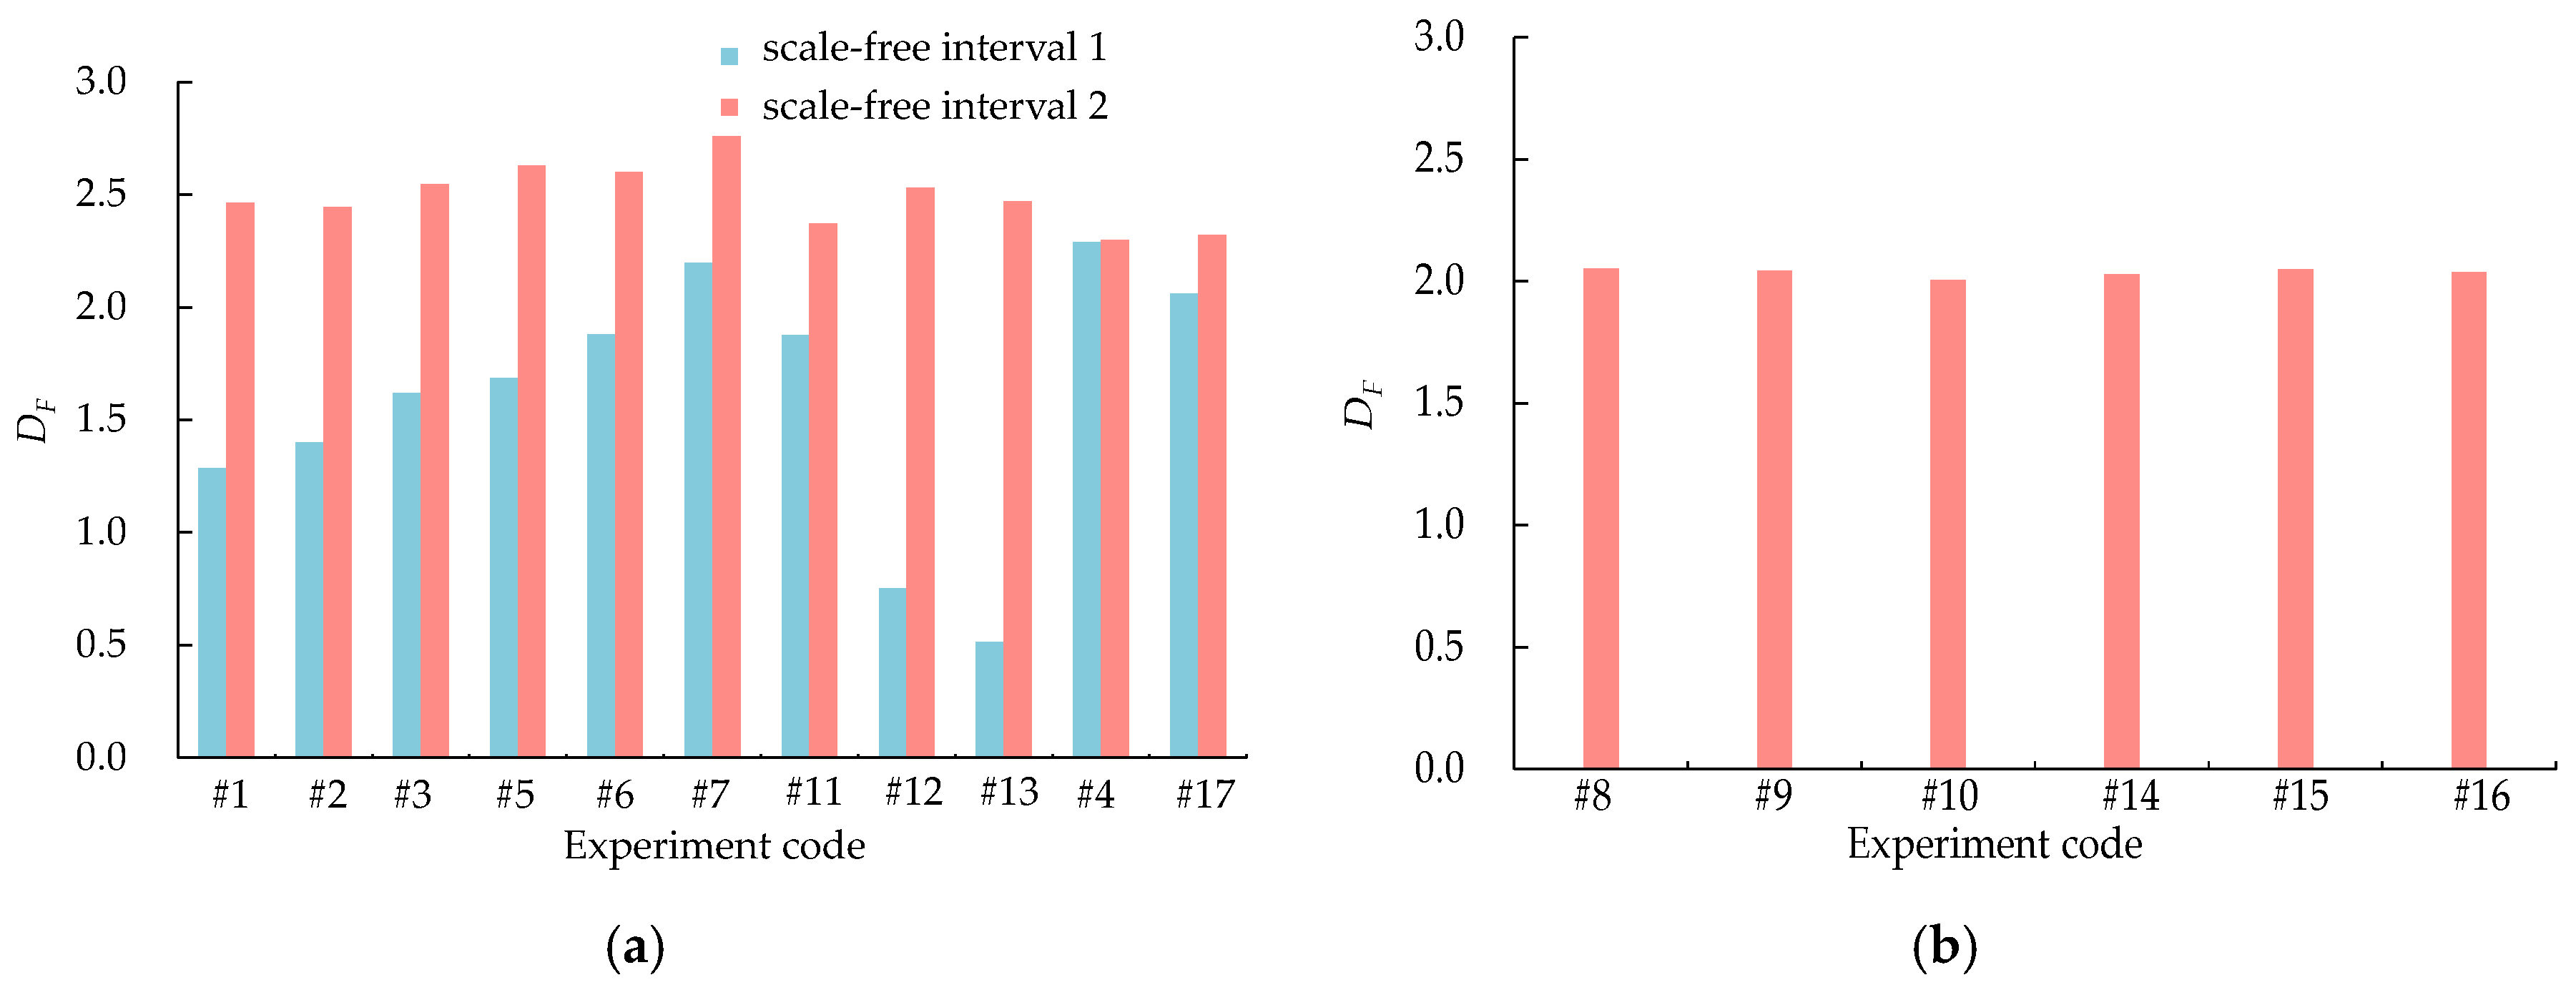
Depending on the excavation methods, blasting parameters, and other factors, blasting experiments with multifractal characteristics exhibited significant variations in the scale-free intervals and fragmentation fractal dimensions. In the larger scale-free interval, the fragmentation fractal dimensions were mostly greater than 2.3, whereas in the smaller scale-free interval, they were often less than 2.0.
(3)
Rock blasting fragmentation mainly involved two or three stages of fragmentation, with a similarity ratio of 0.5. The calculated average fragmentation probabilities of rock blasting ranged from 0.44 to 0.71. At the same bench height, blasting fragmentation with shock-reflection devices strengthened the transmission and reflective effects of stress waves, increasing the fragmentation probability and fragmentation efficiency of the rock mass.
(4)
The SSA of blasting fragments was closely related to the fragmentation fractal dimension and median particle size. By determining the SSA of blasting fragments with large particle sizes using 3D laser scanning technology in advance, the SSA of blasting fragments with a wide grading range can be easily calculated via the SSA predictive formula.

Author Contributions

Conceptualization, R.L., S.L. and W.L.; methodology, R.L., Y.L. and P.Z.; software, C.D.; validation, S.L., Y.L. and W.L.; formal analysis, C.D.; investigation, P.Z., C.D. and Y.L.; resources, S.L., P.Z. and W.L.; data curation, C.D. and Y.L.; writing—original draft preparation, R.L. and P.Z.; writing—review and editing, R.L., Y.L. and P.Z.; visualization, C.D. and Y.L.; supervision, S.L., Y.L. and W.L.; project administration, P.Z. and S.L.; funding acquisition, R.L. All authors have read and agreed to the published version of the manuscript.

Funding

This research was funded by the Open Research Fund Project of Key Laboratory of Geotechnical Mechanics and Engineering of the Ministry of Water Resources, Yangtze River Scientific Research Institute (Grant No. CKWV20221012/KY), and the Major Science and Technology Program (201 Program) of PowerChina Huadong Engineering Corporation Limited (Grant No. KY2021-ZD-01).

Institutional Review Board Statement

Not applicable.

Informed Consent Statement

Not applicable.

Data Availability Statement

The data that support the findings of this study are available from the corresponding author upon reasonable request.

Acknowledgments

This work was completed with the contributions of many researchers and their achievements, to whom the authors express gratitude. To avoid omissions, we express thanks to all contributors.

Conflicts of Interest

Authors Ruize Li, Peng Zhu, Cong Ding and Yijia Liu were employed by the company Zhejiang Huadong Engineering Construction Management Company. The remaining authors declare that the research was conducted in the absence of any commercial or financial relationships that could be construed as a potential conflict of interest.

References

  1. Shim, H.J.; Ryu, D.W.; Chung, S.K.; Syn, J.H.; Song, J.J. Optimized blasting design for large-scale quarrying based on a 3-D spatial distribution of rock factor. Int. J. Rock Mech. Min. Sci. 2009, 46, 326–332. [Google Scholar] [CrossRef]
  2. Faramarzi, F.; Mansouri, H.; Farsangi, M.A.E. A rock engineering systems based model to predict rock fragmentation by blasting. Int. J. Rock Mech. Min. Sci. 2013, 60, 82–94. [Google Scholar] [CrossRef]
  3. Li, R.Z.; Lu, W.B.; Chen, M.; Wang, G.H.; Xia, W.J.; Yan, P. Quantitative analysis of shapes and specific surface area of blasted fragments using image analysis and three-dimensional laser scanning. Int. J. Rock Mech. Min. Sci. 2021, 141, 104710. [Google Scholar] [CrossRef]
  4. Ouchterlony, F. Influence of Blasting on the Size Distribution and Properties of Muckpile Fragments, a State-of-the Art Review: MinFo Project P2000-10: Energy Optimisation during Comminution; Swedish Mineral Research Organisation: Stockholm, Sweden, 2003. [Google Scholar]
  5. De Cola, F. Mechanical Characterisation and Modelling of Statistically Representative Granular Materials Subjected to Impact Loading. Ph.D. Thesis, University of Oxford, Oxford, UK, 2017. [Google Scholar]
  6. Taylor, M.A. Quantitative measures for shape and size of particles. Powder Technol. 2002, 124, 94–100. [Google Scholar] [CrossRef]
  7. Ouchterlony, F.; Sanchidrián, J.A. A review of development of better prediction equations for blast fragmentation. J. Rock Mech. Geotech. Eng. 2019, 11, 1094–1109. [Google Scholar] [CrossRef]
  8. Wills, B.A.; Finch, J.A. Wills’ Mineral Processing Technology, 8th ed.; Butterworth-Heinemann: Oxford, UK, 2015. [Google Scholar]
  9. Snowsill, W.L. Particle sizing. In Instrumentation Reference Book, 4th ed.; Boyes, W., Ed.; Butterworth-Heinemann: Oxford, UK, 2003; pp. 175–189. [Google Scholar]
  10. Asl, P.F.; Monjezi, M.; Hamidi, J.K.; Armaghani, D.J. Optimization of flyrock and rock fragmentation in the Tajareh limestone mine using metaheuristics method of firefly algorithm. Eng. Comput. 2018, 34, 241–251. [Google Scholar] [CrossRef]
  11. Dimitraki, L.; Christaras, B.; Marinos, V.; Vlahavas, I.; Arampelos, N. Predicting the average size of blasted rocks in aggregate quarries using artificial neural networks. Bull. Eng. Geol. Environ. 2019, 78, 2717–2729. [Google Scholar] [CrossRef]
  12. Babaeian, M.; Ataei, M.; Sereshki, F.; Sotoudeh, F.; Mohammadi, S. A new framework for evaluation of rock fragmentation in open pit mines. J. Rock Mech. Geotech. Eng. 2019, 11, 325–336. [Google Scholar] [CrossRef]
  13. Onederra, I.; Thurley, M.J.; Catalan, A. Measuring blast fragmentation at Esperanza mine using high-resolution 3D laser scanning. Min. Technol. 2015, 124, 34–36. [Google Scholar] [CrossRef]
  14. Chen, N.; Kemeny, J.; Jiang, Q.H.; Pan, Z.W. Automatic extraction of blocks from 3D point clouds of fractured rock. Comput. Geosci. 2017, 109, 149–161. [Google Scholar] [CrossRef]
  15. Campbell, A.D.; Thurley, M.J. Application of laser scanning to measure fragmentation in underground mines. Min. Technol. 2017, 126, 240–247. [Google Scholar] [CrossRef]
  16. Masad, E.; Saadeh, S.; Al-Rousan, T.; Garboczi, E.; Little, D. Computations of particle surface characteristics using optical and X-ray CT images. Comput. Mater. Sci. 2005, 34, 406–424. [Google Scholar] [CrossRef]
  17. Al Rousan, T.M. Characterization of Aggregate Shape Properties Using a Computer Automated System. Doctoral Dissertation, Texas A&M University, College Station, TX, USA, 2005. [Google Scholar]
  18. Masad, E.; Button, J.W. Unified imaging approach for measuring aggregate angularity and texture. Comput.-Aided Civ. Infrastruct. Eng. 2000, 15, 273–280. [Google Scholar] [CrossRef]
  19. Liu, Y.F.; Sun, W.J.; Nair, H.; Lane, D.S.; Wang, L.B. Quantification of aggregate morphologic characteristics with the correlation to uncompacted void content of coarse aggregates in Virginia. Constr. Build. Mater. 2016, 124, 645–655. [Google Scholar] [CrossRef]
  20. Hryciw, R.D.; Zheng, J.; Shetler, K. Particle roundness and sphericity from images of assemblies by chart estimates and computer methods. J. Geotech. Geoenviron. Eng. 2016, 142, 04016038. [Google Scholar] [CrossRef]
  21. Blott, S.J.; Pye, K. Particle shape: A review and new methods of characterization and classification. Sedimentology 2008, 55, 31–63. [Google Scholar] [CrossRef]
  22. Tunwal, M.; Mulchrone, K.F.; Meere, P.A. Quantitative characterization of grain shape: Implications for textural maturity analysis and discrimination between depositional environments. Sedimentology 2018, 65, 1761–1776. [Google Scholar] [CrossRef]
  23. Zhu, H.J.; Fang, H.Y.; Cai, Y.Y.; Lv, N. Development of a rapid measurement system for coarse aggregate morphological parameters. Particuology 2020, 50, 181–188. [Google Scholar] [CrossRef]
  24. Barrett, P.J. The shape of rock particles, a critical review. Sedimentology 1980, 27, 291–303. [Google Scholar] [CrossRef]
  25. Tromans, D.; Meech, J.A. Fracture toughness and surface energies of minerals: Theoretical estimates for oxides, sulphides, silicates and halides. Miner. Eng. 2002, 15, 1027–1041. [Google Scholar] [CrossRef]
  26. Ouhbi, N.; Voivret, C.; Perrin, G.; Roux, J.-N. 3D particle shape modelling and optimization through proper orthogonal decomposition. Granul. Matter 2017, 19, 86. [Google Scholar] [CrossRef]
  27. Hyslip, J.P.; Vallejo, L.E. Fractal analysis of the roughness and size distribution of granular materials. Eng. Geol. 1997, 48, 231–244. [Google Scholar] [CrossRef]
  28. Xie, H.P. Introduction to Fractals and Rock Mechanics; China Science Publishing & Media Ltd. (CPSM): Beijing, China, 1996. [Google Scholar]
  29. Su, D.; Wang, X.; Yang, H.W.; Hong, C.Y. Roughness analysis of general-shape particles, from 2D closed outlines to 3D closed surfaces. Powder Technol. 2019, 356, 423–438. [Google Scholar] [CrossRef]
  30. Guo, Y.L.; Markine, V.; Zhang, X.H.; Qiang, W.L.; Jing, G.Q. Image analysis for morphology, rheology and degradation study of railway ballast: A review. Transp. Geotech. 2019, 18, 173–211. [Google Scholar] [CrossRef]
  31. Li, J.; Liu, C.; Liu, H.M.; Wang, J.D.; Zeng, Z.P.; Xie, Y.T. Study on meso-damage damage mechanism of shale reservoir rock based on digital core. Chin. J. Rock Mech. Eng. 2022, 41, 1103–1113. [Google Scholar]
  32. Wang, L.; Yuan, Q.P.; Xie, G.X.; Gu, S.H.; Jiao, Z.H.; Liu, H.Q.; Chen, L.P. Length-diameter ratio effect of energy dissipation and fractals of coal samples under impact loading. J. China Coal Soc. 2022, 47, 1534–1546. [Google Scholar]
  33. Luo, H.H.; Yang, R.S.; Ma, X.M.; Yang, G.L.; Zhu, P.X.; Feng, W.Y. Study on distribution characteristics of deep hole in the fan-shaped hole of Shilu Iron Mine. J. Min. Saf. Eng. 2023, 40, 371–378. [Google Scholar]
  34. Sun, Q.; Duan, F.B.; Xie, H.P. Study on fractal dimension evaluation measurement of coal rock blasting. Chin. J. Rock Mech. Eng. 2000, 19, 505–508. [Google Scholar]
  35. Ouchterlony, F.; Nyberg, U.; Olsson, M.; Bergqvist, I.; Granlund, L.; Grind, H. Where does the explosive energy in rock blasting rounds go? Sci. Technol. Energetic Mater. 2004, 65, 54–63. [Google Scholar]
  36. Hamdi, E.; Romdhane, N.B.; du Mouza, J.; Le Cleac’h, J.M. Fragmentation energy in rock blasting. Geotech. Geol. Eng. 2008, 26, 133–146. [Google Scholar] [CrossRef]
  37. Jiang, S.; Shen, L.M.; Guillard, F.; Einav, I. Energy dissipation from two-glass-bead chains under impact. Int. J. Impact Eng. 2018, 114, 160–168. [Google Scholar] [CrossRef]
  38. Merkus, H.G. Sieves and sieving. In Particle Size Measurements; Particle Technology Series; Springer: Dordrecht, The Netherlands, 2009; Volume 17, pp. 219–240. [Google Scholar]
  39. Singh, P.K.; Roy, M.P.; Paswan, R.K.; Sarim, M.; Kumar, S.; Jha, R.R. Rock fragmentation control in opencast blasting. J. Rock Mech. Geotech. Eng. 2016, 8, 225–237. [Google Scholar] [CrossRef]
  40. Li, R.Z.; Lu, W.B.; Yin, Y.J.; Yu, Y.J.; Chen, M.; Xia, W.J.; Yan, P. Study on the shape and specific surface area characteristics of blasting gravel particles of limestone in Hangudi quarry of Baihetan. Chin. J. Rock Mech. Eng. 2019, 38, 1344–1354. [Google Scholar]
  41. Wu, Y.; Ma, G.; Zhou, W.; Yang, L.F. Optimization of gradation of rockfill materials based on the fractal theory. Rock Soil Mech. 2016, 37, 1977–1985. [Google Scholar]
  42. Li, D.J.; Jia, X.N.; Miao, J.L.; He, M.C.; Li, D.D. Analysis of fractal characteristics of fragment from rockburst test of granite. Chin. J. Rock Mech. Eng. 2010, 29, 3280–3289. [Google Scholar]
  43. Tyler, S.W.; Wheatcraft, S.W. Fractal scaling of soil particle-size distributions: Analysis and limitations. Soil Sci. Soc. Am. J. 1992, 56, 362–369. [Google Scholar] [CrossRef]
  44. Sammis, C.G.; Biegel, R.L. Fractals, fault-gouge, and friction. Pure Appl. Geophys. 1989, 131, 255–271. [Google Scholar] [CrossRef]
  45. Nagahama, H. Fractal scalings of rock fragmentation. Earth Sci. Front. 2000, 7, 169–177. [Google Scholar]
  46. Suzuki-Kamata, K.; Kusano, T.; Yamasaki, K. Fractal analysis of the fracture strength of lava dome material based on the grain size distribution of block-and-ash flow deposits at Unzen Volcano, Japan. Sediment. Geol. 2009, 220, 162–168. [Google Scholar] [CrossRef]
  47. Carpinteri, A.; Lacidogna, G.; Pugno, N. Scaling of energy dissipation in crushing and fragmentation: A fractal and statistical analysis based on particle size distribution. Int. J. Fract. 2004, 129, 131–139. [Google Scholar] [CrossRef]
Figure 1. Locations of the bench blasting experiments: (a) quarry Q1; (b) quarry Q2; (c) quarry Q3; (d) quarry Q4.
Applsci 13 11832 g001
Figure 2. Typical charging construction for the field blasting experiments: (a) blasting with shock-reflection devices; (b) water-decked blasting.
Applsci 13 11832 g002
Figure 3. Typical blasting fragments and their segmented outlines in quarry Q1.
Applsci 13 11832 g003
Figure 4. Blasting fragmentation distribution curves for each experiment: (a) experiments #1–#3; (b) experiments #5–#7 and #11–#13; (c) experiments #8–#10 and #14–#16; (d) experiments #4 and #17.
Applsci 13 11832 g004
Figure 5. Arrangement of blasting fragment sampling points and subsampling points in quarry Q3.
Applsci 13 11832 g005
Figure 6. Power-law fractal distributions of blasting fragments obtained via the particle size–frequency method: (a) quarry Q1; (b) quarry Q2; (c) quarry Q3; (d) quarry Q4.
Applsci 13 11832 g006
Figure 7. Relationship between the particle size and cumulative mass of blasting fragments in different quarries: (a) quarry Q1 (experiments #1–#3); (b) quarry Q3 (experiments #5–#7 and #11–#13); (c) quarry Q3 (experiments #8–#10 and #14–#16); (d) quarries Q2 (experiment #4) and Q4 (experiment #17).
Applsci 13 11832 g007
Figure 8. Fractal dimensions of blasting fragmentation in each experiment: (a) fractal dimensions of blasting experiments with dual fractal characteristics; (b) fractal dimensions of blasting experiments with single fractal characteristics.
Applsci 13 11832 g008
Figure 9. Schematic of high-speed photography monitoring of the rock fragmentation process in deep-hole bench blasting.
Applsci 13 11832 g009
Figure 10. High-speed photography images of the crack distribution of the bench surface during the blasting fragmentation of granite in quarry Q3: (a) experiment #5; (b) experiment #11.
Applsci 13 11832 g010
Figure 11. Average blasting fragmentation probability in each blasting experiment.
Applsci 13 11832 g011
Figure 12. Comparison of SSA exponents.
Applsci 13 11832 g012
Figure 13. Comparison of the calculation errors for the SSA exponents.
Applsci 13 11832 g013
Figure 14. Predictive formulas for the SSAs of blasting fragments based on the fragmentation fractal dimension.
Applsci 13 11832 g014
Table 1. Blasting experiment parameters for each quarry.
Quarry CodeCodeBench Height (m)Hole Diameter (mm)Explosive Diameter (mm)Hole Depth
(m)
Subdrill (m)Specific Charge
(kg/m3)
Hole Spacing
(m)
Row Spacing
(m)
Stemming Length
(m)
Q1#1151157014.8–17.01.00.386.04.04.5
#2151157016.2–18.01.00.355.04.04.5
#3151157015.5–18.41.00.356.04.05.0
Q2#41211590/7013.0–15.01.00.324.54.54.5–5.0
Q3#5121159010.6–13.40.8–1.00.354.03.53.5–4.0
#6121159010.6–13.40.8–1.00.354.03.53.5–4.0
#7121159010.6–13.40.8–1.00.354.04.03.5–4.0
#88115608.0–9.40.4–0.60.362.32.02.0–2.5
#98115605.9–8.00.4–0.60.362.02.01.0–2.5
#108115608.0–9.40.4–0.60.362.01.82.0–2.5
#11121159011.0–13.40.8–1.00.354.03.53.5–4.0
#12121159010.6–13.40.8–1.00.354.04.03.5–4.0
#13121159010.6–13.40.8–1.00.354.04.03.5–4.0
#148115608.0–9.40.4–0.60.362.32.02.0–2.5
#158115608.0–9.40.4–0.60.362.02.01.0–2.5
#168115608.0–9.40.4–0.60.362.01.82.0–2.5
Q4#171516016016.51.50.367.55.03.5
Table 2. Key physical and mechanical properties of the rock mass in the experimental area.
Experiment AreaRock TypeNatural Density (g/cm3)Young’s Modulus (GPa)Poisson’s RatioUnconfined Uniaxial Compressive Strength (MPa)
Quarry Q1Mildly weathered limestone2.69–2.7145–550.23113–140
Quarry Q2Mildly weathered tuff2.60800.21140–190
Quarry Q3Mild to moderately weathered granite2.61500.2245–75
Quarry Q4Mildly weathered limestone2.68–2.70160.2231.4–94.6
Table 3. Fitting results for the power-law fractal distribution of blasting fragments based on the particle size–frequency method.
Quarry LocationLIS
DN0R2DN0R2DN0R2
Q11.039176.30.991.004074.20.990.741340.50.98
Q21.126296.70.911.033252.40.910.831142.30.94
Q31.0941,8660.981.0525,6380.981.9913,1120.99
Q41.2335,8190.971.4416,5570.971.397470.30.97
Table 4. Fractal dimensions of blasting fragments with dual fractal characteristics.
Quarry LocationLithologyExperiment CodeScale-Free Interval (mm)SlopeR2DF
Q1Limestone#16–1311.720.971.28
131–11000.540.972.46
#26.8–1231.600.991.40
123–14000.560.942.44
#36.8–1861.380.991.62
186–14000.450.942.55
Q2Tuff#43.2–70.10.710.942.19
70.1–20300.710.912.30
Q3Granite#53.2–2151.310.981.69
215–24000.370.942.63
#63.3–3890.800.982.20
389–24800.240.922.76
#73.2–3101.120.981.88
310–15000.400.972.60
#113.2–682.490.990.51
68–16000.530.982.47
#123.2–681.120.971.88
68–16000.630.962.37
#133.2–1002.250.980.75
100–18400.470.982.53
Q4Limestone#173.35–55.20.940.972.06
55.2–19880.680.882.32
Table 5. Fractal dimensions of blasting fragments with single fractal characteristics.
Quarry LocationLithologyExperiment CodeScale-Free Interval (mm)SlopeR2DF
Q3Granite#83.2–19000.950.972.05
#96.8–20300.960.962.04
#103.1–20801.000.952.00
#143.2–15000.970.972.03
#153.5–20000.950.962.05
#166.8–19700.960.962.04
Disclaimer/Publisher’s Note: The statements, opinions and data contained in all publications are solely those of the individual author(s) and contributor(s) and not of MDPI and/or the editor(s). MDPI and/or the editor(s) disclaim responsibility for any injury to people or property resulting from any ideas, methods, instructions or products referred to in the content.

