Abstract
Radio astronomical observations at millimeter and submillimeter wavelengths are a very important tool for astrophysical research. However, there is a huge area in northeastern Eurasia, including the whole Russian territory, which lacks sufficiently large radio telescopes effectively operating at these wavelengths. In this review, we describe our long-term efforts to find suitable sites for such radio telescopes in this area, that is, sites with good atmospheric transparency at millimeter and submillimeter waves. We describe methods and instruments used for measurements and evaluations of the atmospheric opacity. They include special radiometric systems, which are used for estimations of the atmospheric opacity in the transparency windows from the sky brightness measurements. Evaluation of the precipitable water vapor from such measurements by the artificial neural network is discussed. Other approaches use water vapor radiometers, global atmospheric models and signals of the Global Navigation Satellite Systems. To date, long-term radiometric monitoring has been performed at several candidate sites, and atmospheric conditions for many sites have been evaluated using global atmospheric models. Several sites with the best atmospheric transparency at millimeter and submillimeter wavelengths have been selected. They can be effectively used for astronomical observations, at least in the major atmospheric transparency windows at 1.3 mm and 0.85 mm. In general, the results show that northeastern Eurasia is a promising area for submillimeter astronomy. These results can also be used for space communications and radar systems.
1. Introduction
Radio astronomical observations at millimeter and submillimeter wavelengths are a very important tool for astrophysical research (e.g., [1]). They provide a unique opportunity for detailed investigations of the interiors of the cold dense interstellar clouds of gas and dust, which represent cradles of new stars. The emission peak of these clouds lies in this band. Millimeter and submillimeter waves are very rich in the spectral lines of various molecules, atoms and ions, which can serve as diagnostic tools of physical conditions and chemical content. At these wavelengths, the highest angular resolution can be achieved, which is very important for studies of compact objects, in particular active galactic nuclei. These studies are facilitated by a lower interstellar scattering in comparison with longer radio wavelengths. Bright examples of such a study are recent images of the “shadows” of supermassive black holes in the centers of M87 and our Milky Way galaxies [2,3]. These results were obtained with the Event Horizon Telescope (EHT), which is a global VLBI network of sufficiently large millimeter-wave observatories operating at the 1.3 mm wavelength. Nowadays, there are about 10 such observatories in the world. The success of the EHT stimulates the project of its extension, known as the next-generation EHT (ngEHT) [4]. The concept of ngEHT includes observations at 3 and 0.8 mm wavelengths, in addition to the 1.3 mm band. This emphasizes the importance of all these bands for astronomy. Many locations in the world are considered as candidate sites for new EHT telescopes (e.g., [5]). There is a huge area in northeastern Eurasia, including the whole Russian territory, which lacks such facilities, although many years ago construction of a 70 m radio telescope intended for operation at short millimeter wavelengths started on the Suffa plateau in Uzbekistan [6,7] (it was frozen after the USSR collapse), and now there are new relevant projects and proposals [8,9,10,11].
The main obstacle to ground-based radio astronomy observations at short millimeter and submillimeter wavelengths, in addition to technical challenges, is the atmospheric opacity, caused primarily by water and molecular oxygen. The observations are possible only in the so-called “atmospheric transparency windows”—the bands of relatively high transparency between the strong spectral lines of these molecules. The main windows discussed here are those centered at ∼90 GHz, ∼140 GHz, ∼225 GHz and ∼350 GHz. They are usually referred to as the 3 mm, 2 mm, 1.3 mm and 0.8 mm windows, respectively. However, even in these windows, the opacity can be quite high. Radio astronomical observations at the sea level are possible only in the 3 mm and 2 mm windows. At higher frequencies, high-altitude locations should be used.
While the oxygen absorption is stable and can be rather easily evaluated, the water content is highly variable. Water in the atmosphere is present in two forms—water vapor and liquid water (the latter one mainly in clouds). The amount of water vapor is usually characterized by the PWV (Precipitable Water Vapor) parameter, which is the vertically integrated amount of water vapor in the atmosphere. It is usually measured in millimeters. The amount of liquid water is parameterized by the Liquid Water Path (LWP), measured in g m or in m (e.g., [5]). The zenith opacity (optical depth) of the atmosphere in dependence on frequency () is related to these parameters by the following expression:
where is the molecular oxygen contribution to this opacity, is the specific absorption coefficient per PWV unit and is the specific absorption coefficient per LWP unit. The suitability of a site for radio astronomy observations is primarily characterized by the opacity statistics in atmospheric windows or by the PWV statistics, which are related to each other under clear sky conditions, although the LWP statistics are also important.
Both and are determined by the vertical distributions of the atmosphere physical parameters (pressure and temperature), molecular oxygen and water vapor. They can be derived empirically for a certain site or calculated using the existing models of the atmosphere in conjunction with spectroscopic databases (e.g., [12,13]). Then, nowadays, global dynamic models of the atmosphere with a high spatial and temporal resolution are available (see below). The dependencies of microwave absorption by molecular oxygen and water vapor on physical parameters and altitude in the atmosphere were analyzed many years ago [14]. In the paper in [15], the dependencies of and on altitude for the 1.3 mm window were calculated. The dependence of the molecular oxygen optical depth on altitude (h) is well described by the exponential function:
where is the O optical depth at the sea level and is the characteristic height, usually adopted to be 5.3 km [16], although it can be somewhat different in different seasons [14].
Atmospheric transparency research is important not only for radio astronomy but also for telecommunications and radars. Millimeter-wave communication channels can provide the highest throughput (e.g., [17,18,19,20,21,22,23]) but are strongly affected by the atmosphere. Millimeter-wave radars are promising facilities for monitoring space debris and dangerous asteroids (e.g., [24,25,26]).
2. Instruments and Methods
2.1. Methods for Measuring Atmospheric Opacity
The optical depth of the atmosphere in zenith can be measured by several methods. Direct measurements of the opacity in a plane-parallel atmosphere are based on Bouguer’s law:
where is the intensity of cosmic source emission within the antenna beam, as it would be measured without atmosphere, is the measured intensity of this emission and is the zenith angle. By measurements of at different zenith angles, the optical depth in zenith can be retrieved. This method requires a long time for a substantial change in zenith angle, stable atmospheric conditions during this time and negligible or well-known dependence of the antenna response on the zenith angle. The validity of the plane-parallel model has been analyzed in several works. According to [16,27], it can be used at , and according to [28] at . Our calculations show that under typical atmospheric conditions, the error in the optical depth for the plane-parallel model is ≲5% at and grows rather rapidly at larger zenith angles.
In practice, the value of the zenith opacity (optical depth) at millimeter wavelengths is usually derived from measurements of the atmosphere emission [16]. The sky brightness temperature in a plane-parallel atmosphere, neglecting the cosmic microwave background, equals
where is the mean temperature of the atmosphere:
where is the air temperature along the line of sight and is the total air absorption coefficient, and h is the height. The value of the mean temperature of the atmosphere is discussed in [29]. At a relatively low opacity , where is the ambient temperature. At a higher opacity, the mean temperature increases, as expected, to . Therefore, depends on the zenith angle.
In principle, the zenith optical depth can be derived using Equation (4) from the absolute measurements of the sky brightness temperature. However, this method requires a precise absolute calibration of the brightness measurements, which can be challenging. A typical widely used approach, known as a “sky dip” (described below), is based on relative measurements of the sky brightness at several (minimum two) zenith angles.
2.2. Measurements of the Atmosphere Optical Depth by the “Sky Dip” Method
2.2.1. Basics of the “Sky Dip” Method
From the measurements at two zenith angles ( and ), the optical depth of the atmosphere in zenith in the first approximation can be obtained as [16]
Here, and are the receiver responses at the zenith angles and , respectively, while is the response for the input emission with the brightness temperature . Most frequently, a reference angle near the horizon, where the optical depth should be high, is used for this purpose. Some variants of this method, which use measurements at 3 zenith angles and a reference area near the horizon, are considered in [30]. From measurements of the sky brightness in a range of zenith angles, the optical depth can be derived by fitting the measurement results with a function corresponding to Equation (4) (which can be also expressed in the logarithmic form), assuming a constant mean atmosphere temperature. In this case, a reference signal is needed anyway. Some examples of such devices are the 225 GHz tipping radiometers at the site of the 30 m IRAM radio telescope (D.L. John, private communication) and at the Large Millimeter Telescope (LMT) site [31].
2.2.2. A Dual-Band Radiometer for Measuring the Atmospheric Opacity Developed at the Institute of Applied Physics RAS
About 10 years ago, a dual-band radiometer MIAP-2 for measuring the atmospheric opacity was developed and manufactured at the Institute of Applied Physics of the Russian Academy of Sciences and GYCOM company [32]. The radiometer operates in the 3 mm and 2 mm atmospheric windows.
At the front-end of the 3 mm channel, a broad-band millimeter-wave amplifier is used with the specified frequency range 84–99 GHz. In fact, it has no rejection of lower frequencies, which leads to contamination of the measurements by the strong contribution of the molecular oxygen absorption band near 60 GHz. The problem was partly fixed by the installation of a waveguide filter with the cross-section of mm, which has a cutoff frequency of ∼75 GHz [33]. Nevertheless, the contribution of the low frequencies remains significant, and its consequences are discussed below.
The front-end of the 2 mm channel includes the local oscillator on a Gunn diode with a built-in frequency doubler, a balanced mixer on Schottky-barrier diodes (SBDs), an intermediate-frequency amplifier (IFA) and a detector for the range of 4–8 GHz. The local oscillator frequency is 140 GHz. The channel detects the emissions in both lower and upper sidebands, which are 132–136 GHz and 144–148 GHz, respectively.
At the front-ends of both channels, the modulator–calibrator is used. This device is described in detail in [34]. It is based on chains of series–parallel-connected SBDs, placed into the standard cross-section waveguide. It can serve as a modulator of the input signal or as a source of a calibration signal. Depending on the current, it can be in 3 states: (1) open (transmitting the input signal with low losses), (2) locked with the equivalent brightness temperature of 155–180 K (“cold” calibration level) and (3) locked with the equivalent brightness temperature of ∼300 K (“warm” calibration level). These features enable both sky dip measurements and absolute measurements of the sky brightness temperature.
Both channels are equipped with the lens antennas, which are misphased conically shaped feed horns with a bent fracture and lenses. The half-power beam width of the antennas (with lenses) in both bands is about 2.5. The elevation scan is provided by the rotating common mirror in front of both horns, oriented at the angle of 45, and a mirror drive system, which is based on a stepper motor. The zenith angle range is from 0 to 90, and the step is 0.7.
Three measurement modes are possible. In the first one, the measurements are performed at two zenith angles and at the angle near the horizon as a reference (see Section 2.2.1). In the second mode, the data at 5 zenith angles are acquired. The angle near the horizon is not mandatory. Last, the absolute measurements of the sky brightness are possible.
As mentioned above, the frequency responses of the channels, especially in the 3 mm band, are not well-defined. This can create problems with the interpretation of the measurement results. In [35], an attempt is made to determine the effective frequencies of the channels by a comparison of the experimental values of the coefficients in Equation (1) with the values obtained from the model calculations for a range of frequencies. The experimental values were obtained using independent measurements of the PWV amount. As a result, it was found that the effective frequencies of the 3 mm and 2 mm channels are 79.7 and 134 GHz, respectively. The effective frequency of the 3 mm channel is lower than the specified frequency range of the 3 mm amplifier. It shows that the contribution of the molecular oxygen absorption band near 60 GHz is significant in this channel and should be taken into account.
Two pieces of such a radiometer have been manufactured; however, the second one lacks the 2 mm channel. At the same time it has a better constrained frequency response of the 3 mm channel.
2.3. Measurements of the Precipitable Water Vapor (PWV) by Water Vapor Radiometers
In some cases, the information on the PWV value and its fast variations are of primary interest. They lead to phase shifts and fluctuations, which should be taken into account in radio interferometry. Although such information can be retrieved from the measurements of the opacity in the atmospheric windows described above, a more effective approach is to perform such measurements at frequencies near the HO transitions. Usually, for this purpose, the transitions at ∼22 GHz and ∼183 GHz are used. For example, all 12 m ALMA antennas are equipped with the 183 GHz water vapor radiometers [36]. At the Institute of Applied Astronomy of the Russian Academy of Sciences, a dual-band water vapor radiometer operating at ∼21 GHz and ∼31 GHz was developed [37]. It is actively used for atmospheric measurements (e.g., [38,39]).
2.4. Evaluation of the Atmospheric Opacity from Global Atmospheric Models
Atmospheric transparency can be estimated on the basis of the approach used for modeling path delay in the neutral atmosphere [40]. The publicly available data provided by the NASA Global Modeling and Assimilation Office model GEOS-FPIT (http://gmao.gsfc.nasa.gov, accessed on 1 September 2023) are used [9]. They evaluate atmosphere parameters (in particular, air temperature, total atmospheric pressure, and partial pressure of water vapor) using various ground, air-born and space-born measurements that are assimilated into a dynamic model. The current models have 72 levels in altitude, spatial grid and 3 h resolution in time. Atmospheric absorption at any frequency can be calculated for any selected location by using standard spectroscopic parameters, as described in [9]. The values of the zenith opacity obtained in this way are in good agreement with the results of sky dip measurements at the LMT and other sites, including measurements with the MIAP-2 radiometer at 2 mm on the Suffa plateau [41].
Similar data are provided by the Modern-Era Retrospective Analysis for Research and Applications, Version 2 (MERRA-2) [42,43] and the European Center for Medium-Range Weather Forecast ReAnalysis (ERA5) [44].
2.5. Evaluation of the Precipitable Water Vapor (PWV) from the Global Navigation Satellite System (GNSS) Data
The development of the Global Navigation Satellite Systems (GNSS) provides an opportunity for estimations of PWV from measurements of delays of the navigation signals [45,46,47]. Taking into account the surface temperature and pressure, the PWV values can be estimated from these delays with a low uncertainty. Nowadays, this method is widely used for this purpose, including evaluation of results obtained from the global atmospheric models mentioned above (e.g., [48,49,50,51,52,53,54,55,56,57,58,59]).
2.6. Evaluation of the Precipitable Water Vapor (PWV) from the Sky Dip Data by the Artificial Neural Network
The direct comparison of the results obtained by the different methods may be problematic. The low PWV values in dry atmosphere are barely detectable by humidity sensors in aerosonde. Wet conditions and high opacity lead to small variations in brightness temperature on different angles, leading to higher errors in and PWV estimations. The spatial–temporal resolution of the dynamic atmospheric models is limited: it is lower than typical sizes of the topographic features such as mountains and typical times of the variations in PWV values. As a result, different methods should be cross-validated and extrapolated to the same scale.
Recently, we proposed a statistical approach for the determination of the PWV values based on machine learning algorithms and MIAP-2 data [60]. The idea was to use nonlinear regression to calculate PWV values from the MIAP data using the receiver responses on different angles in the 2 mm and 3 mm bands as the input data, without addressing the physical model. The training set was based on a one-year monitoring session near the Badary observatory (2016–2017). The observatory was equipped with the water vapor radiometer (WVR) and GNSS receivers capable of tropospheric delay estimations. We found that the GNSS and WVR data were consistent. We used the GNSS data as the target values for the statistical model fitting and the k-nearest neighbors (kNN) [61] and artificial neural network (ANN) as the regression models. We utilized the individual component analysis to speed up the learning process. As a result, the regression model encapsulates the instrumental transfer function and the PWV fraction in the microwave absorption (Equation (1)). The bias introduced by the plane-parallel atmospheric model was also excluded. The coefficient of determination on the validation part of the dataset was 0.8 for kNN and 0.86 for ANN, with symmetrical deviations from the trend line [60]. The result of this findings is that the PWV may be consistently determinated from the sky dip data using the statistical approach.
In our study, we also employ an approach based on building statistical models, but we utilize a more complex neural network topology by incorporating an LSTM layer. The input data consist of MIAP-2 measurements 2 × 6 × 3 vector (bands, angles, , 243 measurements of MIAP per MERRA-2 timestamp). The MIAP-2 datasets for the Badary (2016–2017) and Svalbard (2018–2019) territories comprise 53,449 and 51,680 measurements, respectively. The target values are based on hourly PWV data from the MERRA-2 model. After aligning the MIAP-2 and MERRA-2 data to a common temporal grid, the datasets for the Badary and Svalbard territories consist of 8233 and 8345 measurements, respectively. The normalized dataset undergoes Independent Component Analysis (ICA) dimensionality reduction procedure with 10 components. Random partitioning was applied to create training and testing datasets with a ratio of 75% to 25%, respectively. The topology of the ANN consists of six layers: an input fully connected layer (Dense), a long short-term memory (LSTM) layer and four fully connected layers. The layers are composed of 350, 200, 17,500, 700, 10 and 1 neurons, respectively.
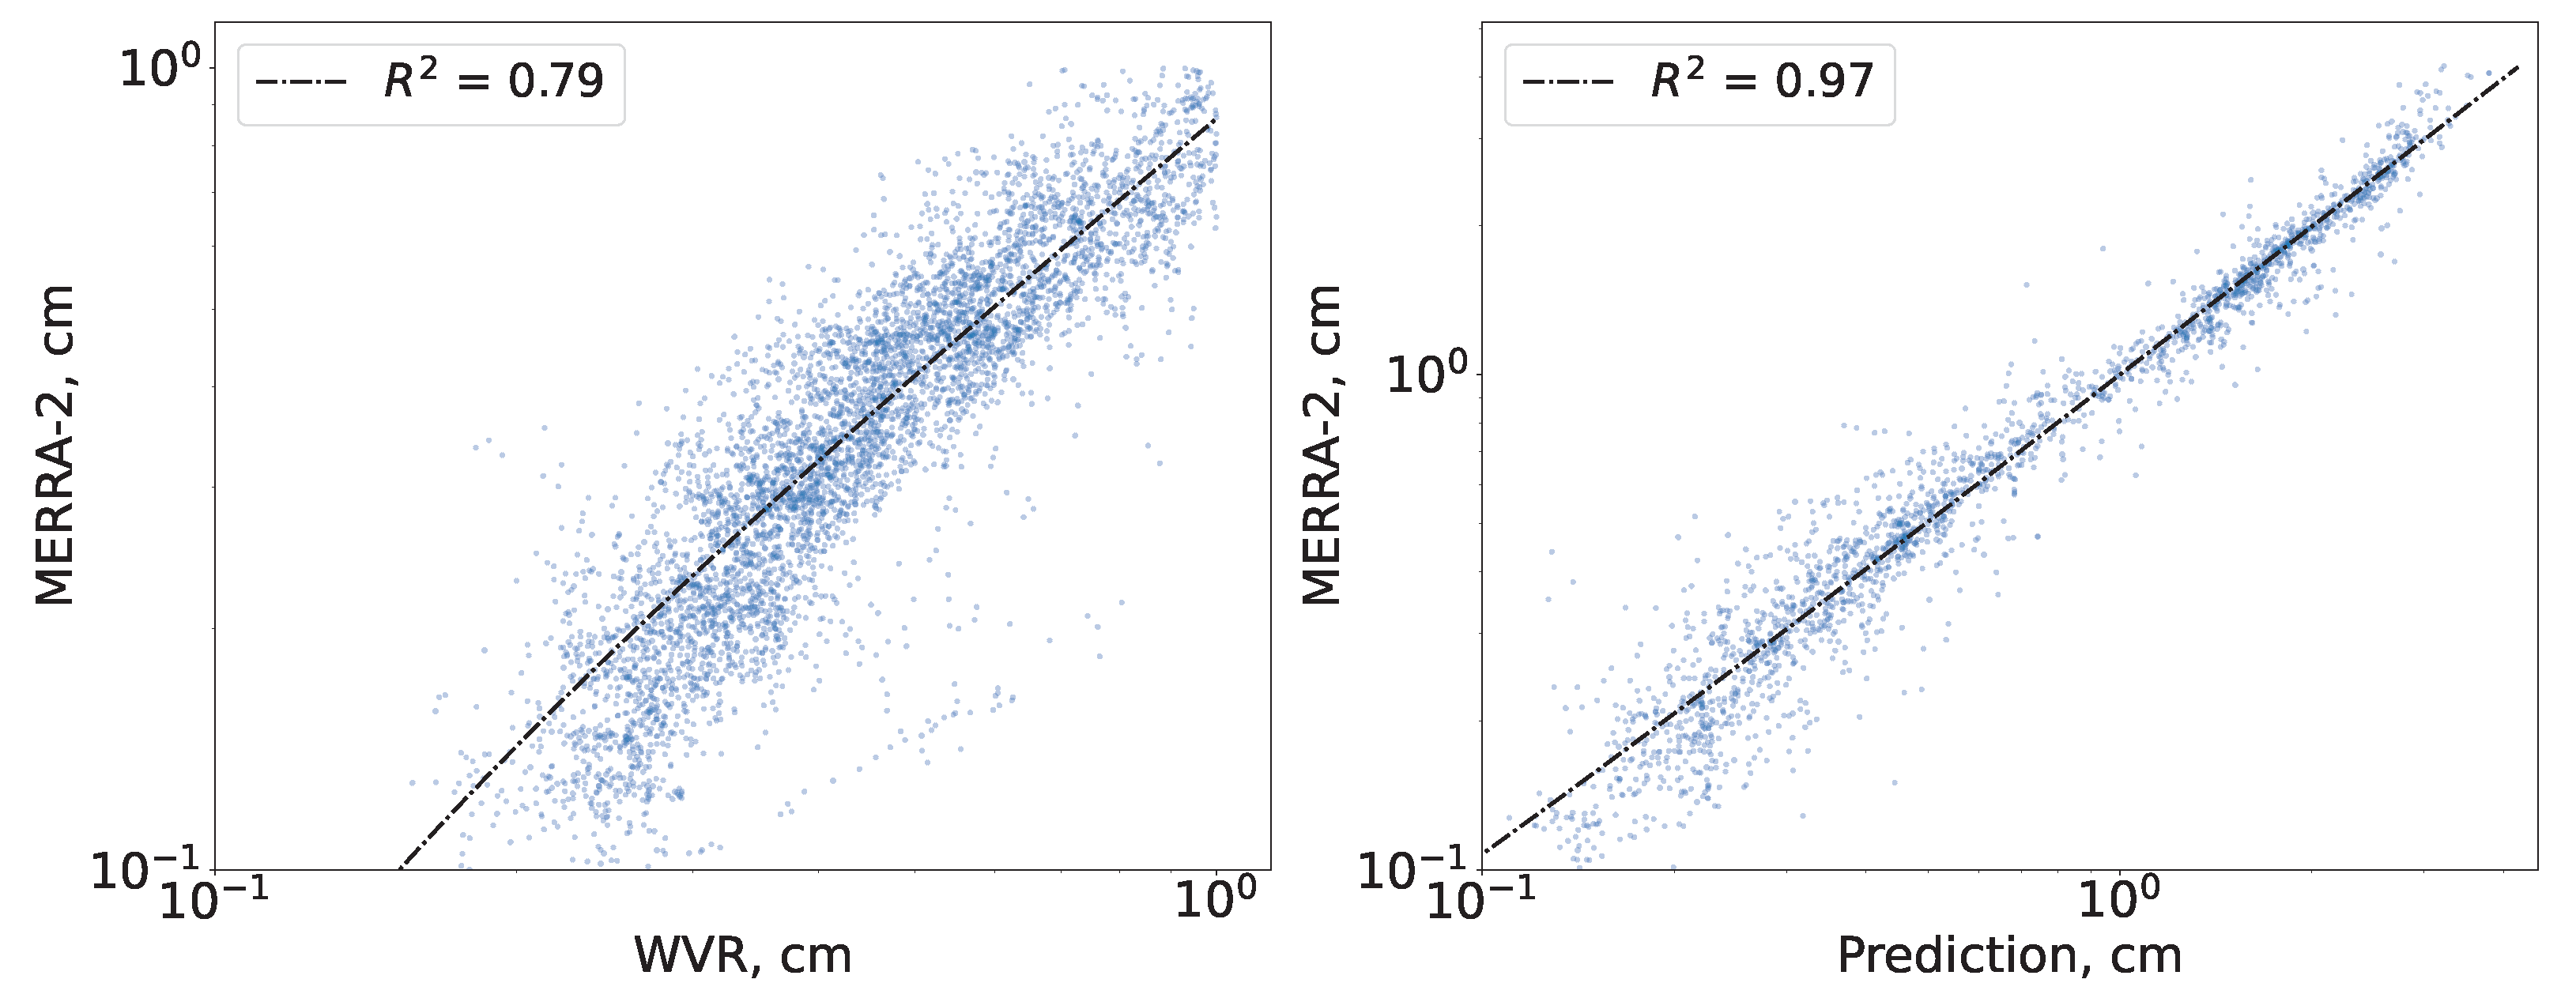
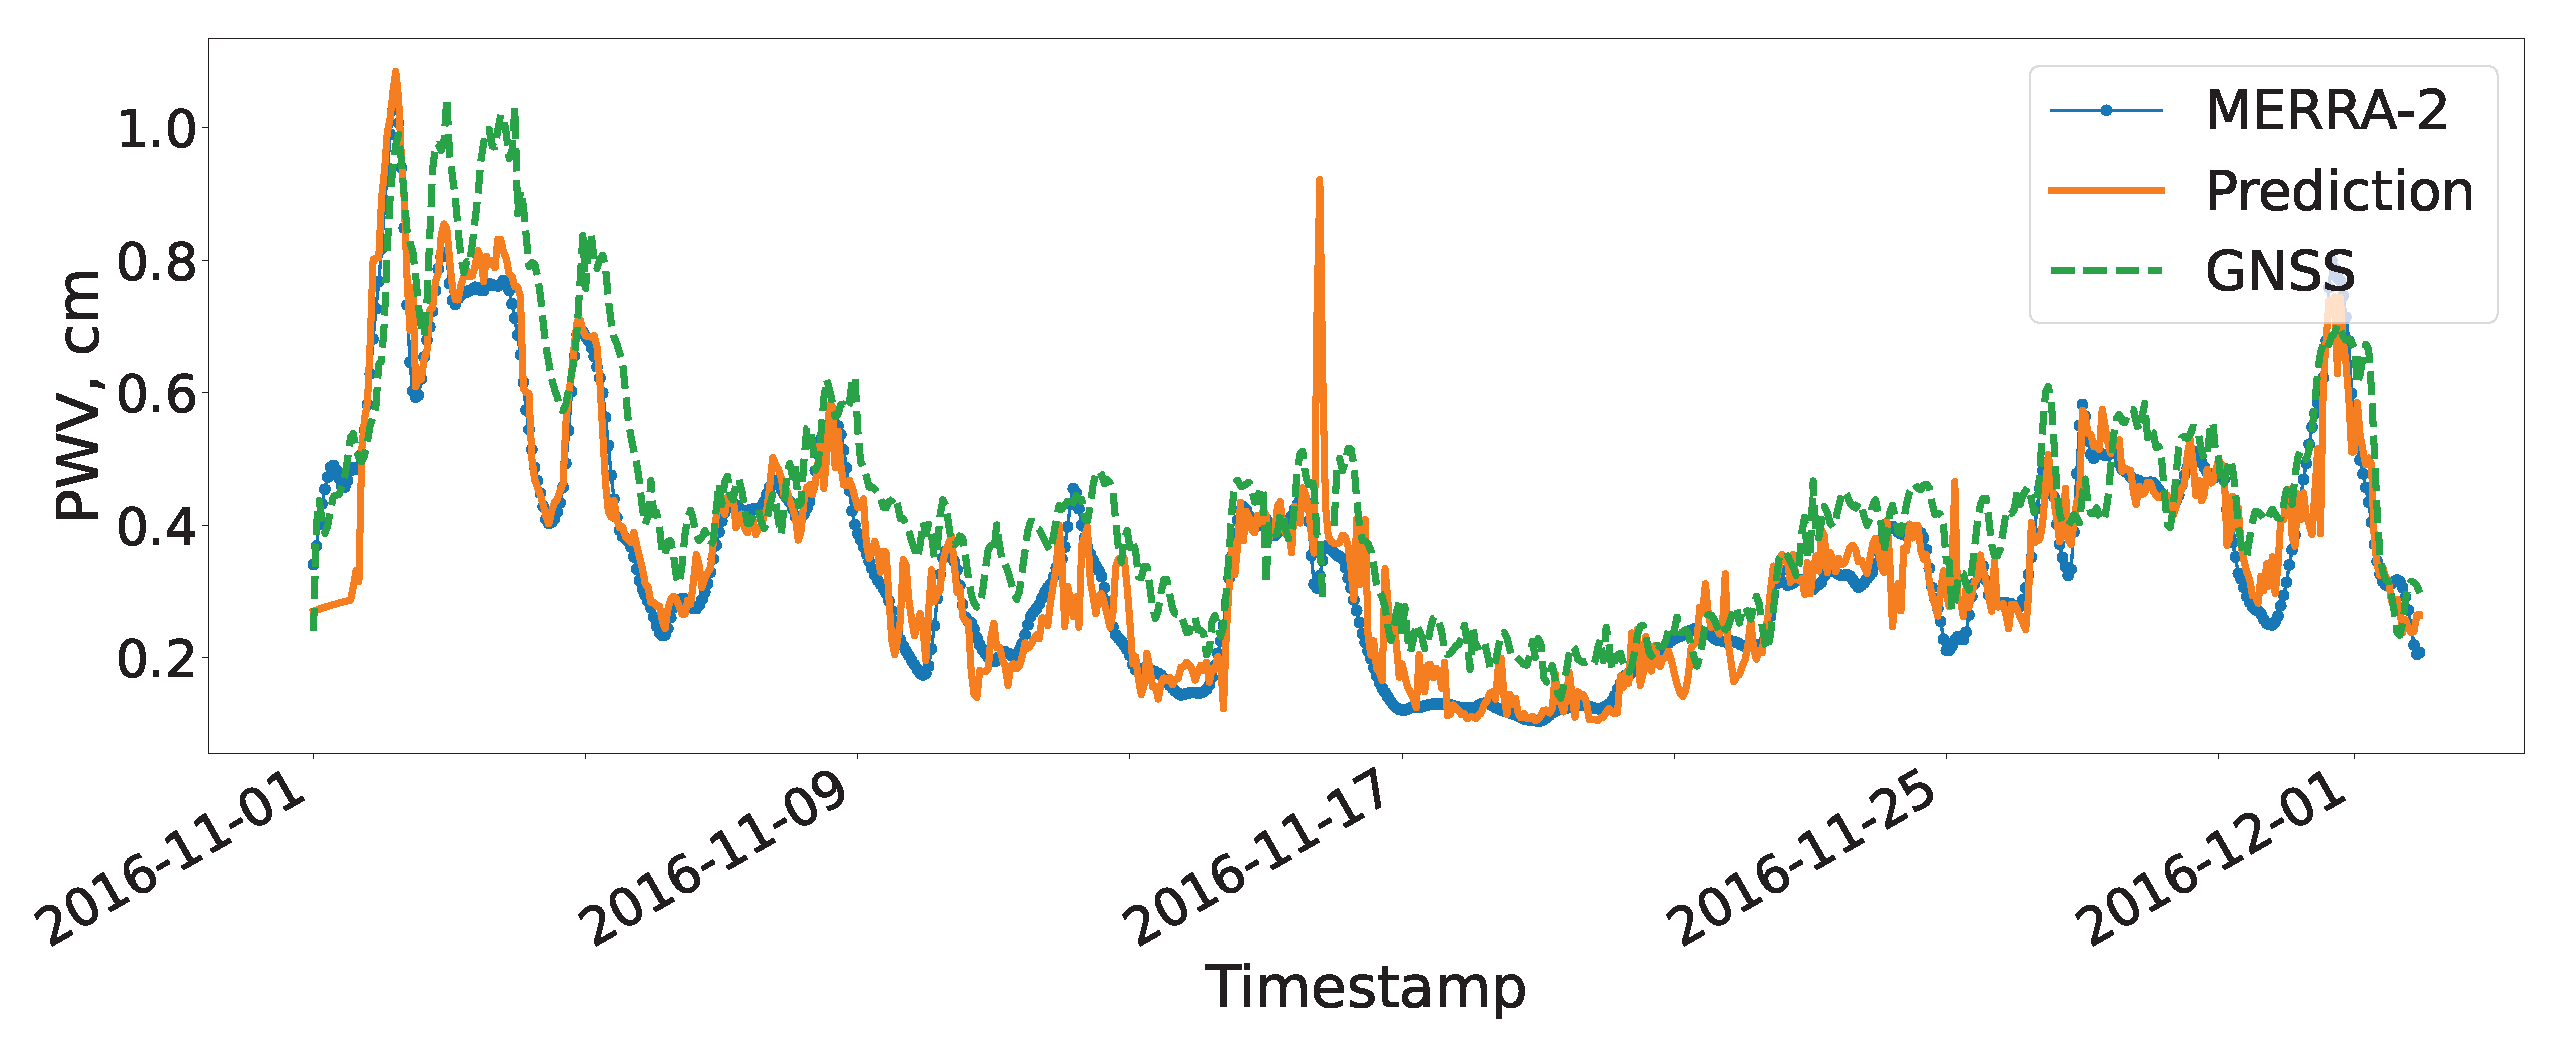
In our study, we found that PWV estimations based on WVR data are biased from MERRA-2 data in dry conditions (Figure 1). The resulting was 0.98 on the validation dataset trained on Badary data only and 0.96 for the Svalbard and Badary combined dataset. The time series and scatter plot are presented in Figure 1 and Figure 2. The results show a good agreement between the predicted and the PWV MERRA-2-based and GNSS-based values. The lower value is probably caused by the different impact of the absorption in O and LWP in different sites that cannot be represented by the single regression model. Still, the predictive ability of the model is very high at the full variety of the atmospheric conditions during the sessions.
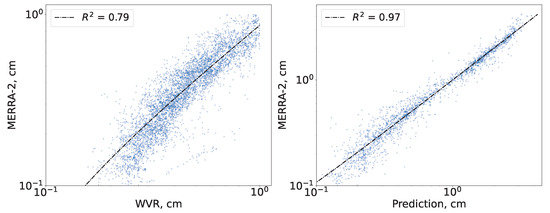
Figure 1.
(Left panel): the scatter diagram between the WVR and MERRA-2. (Right panel): correlation between the target PWV values (MERRA-2) and the predicted values on the validation dataset.
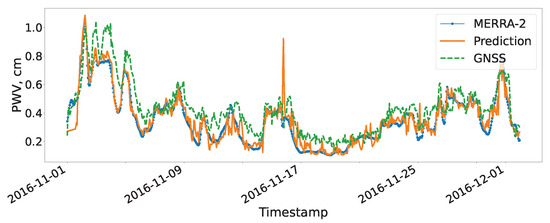
Figure 2.
Time series plot of the PWV in MERRA-2 data (target values), GNSS-based data and predicted by ANN from Badary session—one-month partial selection.
This approach can be applied to different types of the data-acquiring methods and should produce statistically coherent results. The traces the predictive ability of the statistical model and can test the validity of the different nondirect methods testing astroclimatic measurements or atmospheric model predictions in specific places. We used the MERRA-2 model as the reference, but it can also be tested by different direct PWV drone-based measurements or aerosonde, which are too rare to serve as training sets.
3. Results
3.1. Monitoring of the Millimeter-Wave Atmospheric Opacity at Selected Sites
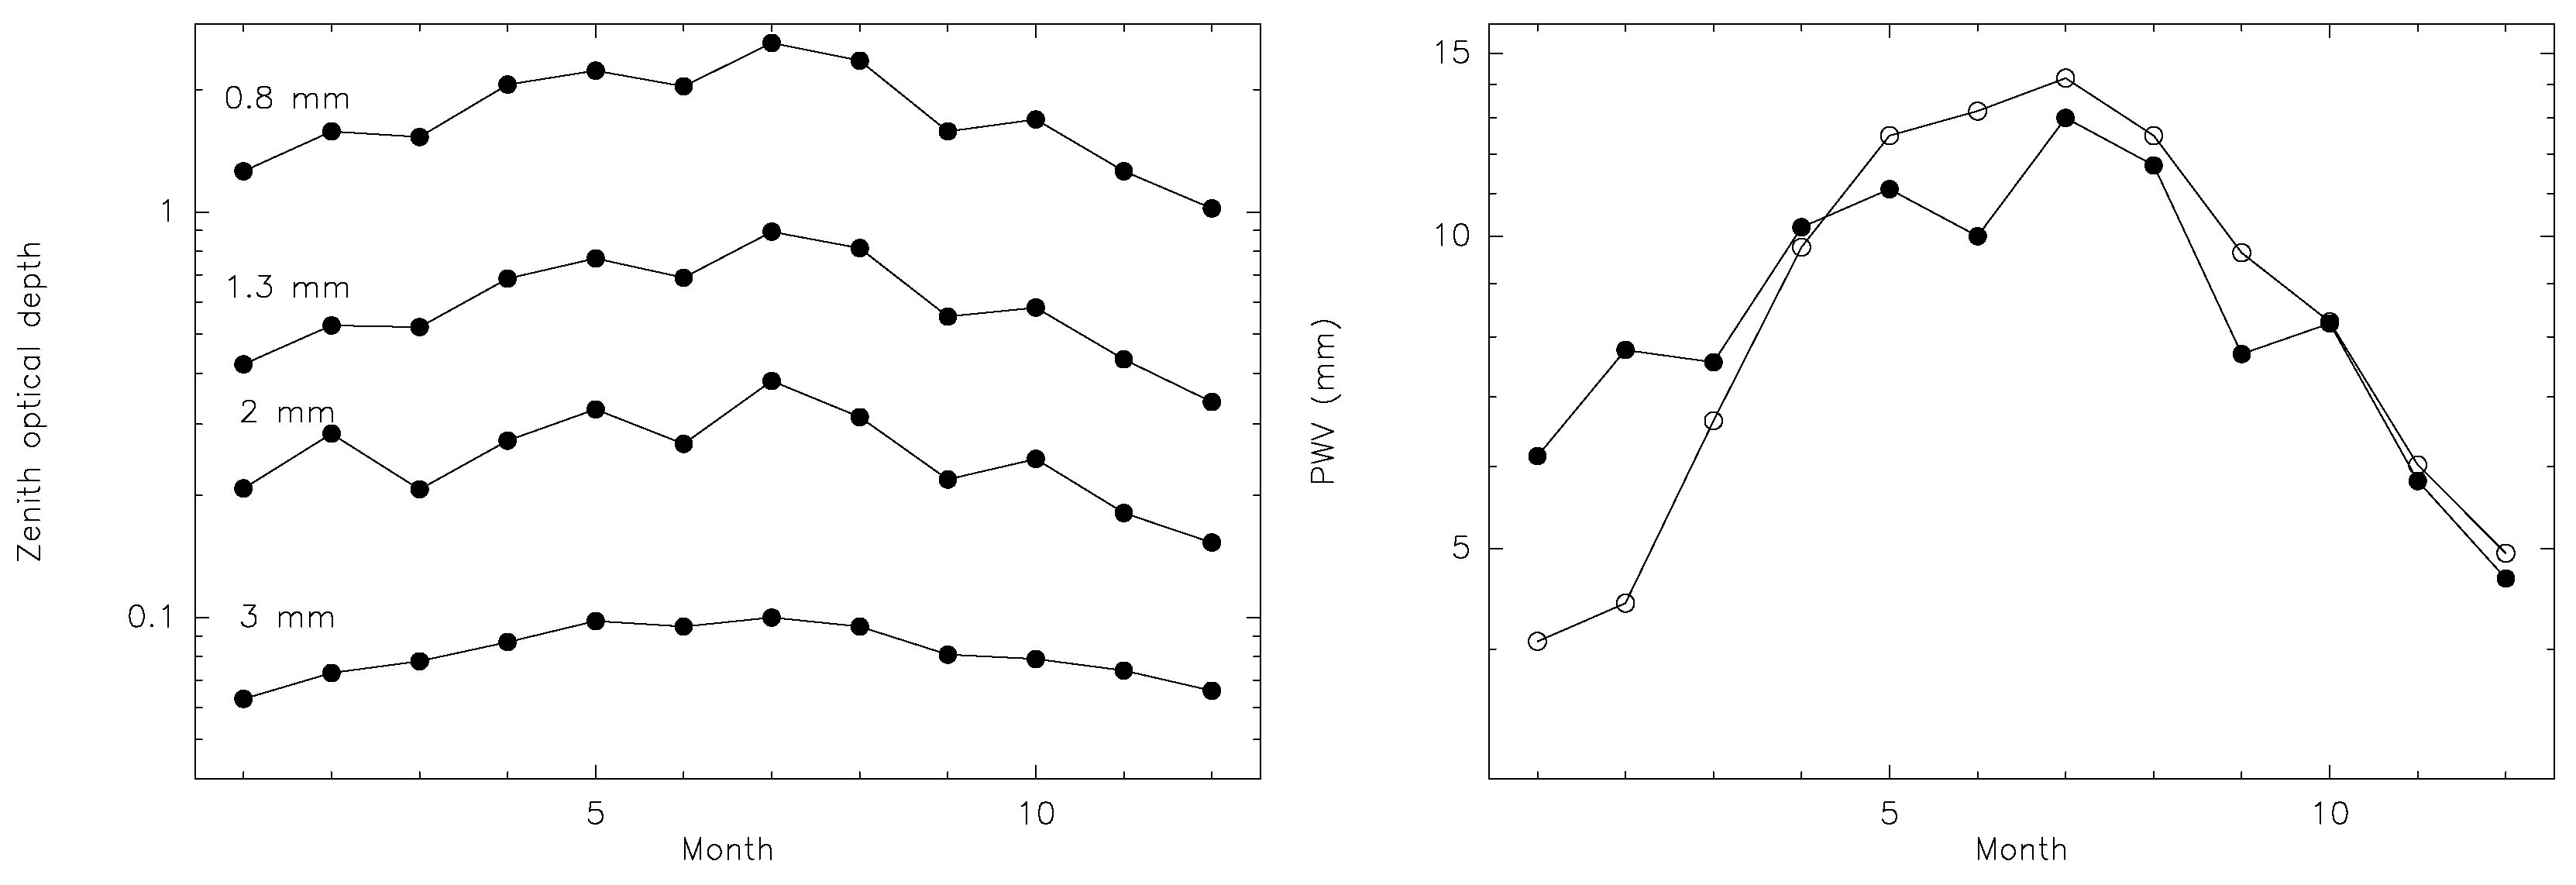
To date, atmospheric absorption studies with the MIAP-2 radiometers have been carried out at several sites in Russia and Uzbekistan [33,62,63,64,65,66,67]. However, a long-term monitoring covering all seasons is limited to the RT-70 radio telescope construction site on the Suffa plateau in Uzbekistan (altitude 2400 m), the site of the BTA telescope of the Special Astrophysical Observatory (SAO) in the North Caucasus (altitude 2040 m) and the Badary observatory in the Baikal region (altitude 813 m). Among these sites, the best atmospheric transparency has been observed on the Suffa plateau [33,62,63]. From these measurements, the PWV values were derived, which are in good agreement with the satellite and aerosonde data [33]. Then, the expected optical depth in other atmospheric transparency windows was evaluated. The expected monthly averaged values of the optical depth in zenith at 1.3 mm are ∼0.3 in winter and ∼0.8 in summer (Figure 3, left panel). The corresponding monthly averaged PWV values are ∼4 mm in winter and ∼14 mm in summer [33] (Figure 3, right panel).
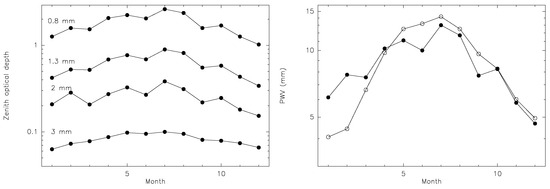
Figure 3.
(Left panel): the monthly averaged values of the optical depth at the site of RT-70 construction on the Suffa plateau in the atmospheric transparency windows at 3, 2, 1.3 and 0.8 mm. (Right panel): the monthly averaged PWV values at this site derived from the radiometer MIAP-2 measurements (filled circles) and from the aerosonde data (open circles). The plots are based on the data from [33].
In addition to long-term monitoring, short-term measurements of atmospheric absorption have been carried out in several locations: the Muus-Khaya peak in Yakutia (altitude 1950 m), the Terskol peak in Caucasus (altitude 3150 m), Svalbard (altitude 36 m), Caucasian Mountain Observatory (altitude 2112 m), Mondy, Sayans in Buryatia (altitude 2006 m) and Karadag in Crimea (altitude 105 m). Measurements have recently begun in the eastern Caucasus [67]: in Dagestan (Mount Mayak, 2700 m and Mount Shalbuzdag, 4142 m) and in North Ossetia (Stolovaya Mountain, ∼3000 m).
The Muus-Khaya peak is located in the region of the “Pole of Cold”. The measurements were taken in July and gave quite good results for this season: PWV∼5 mm [62], which is significantly better than at the RT-70 site on the Suffa plateau in summer. The expected PWV value in winter is 1–2 mm, which makes this peak a promising site for millimeter and submillimeter astronomy. The short measurement on the Terskol peak did not show good results. The one-day measurements on Elbrus in August 2021 gave rather high opacity, too. Promising preliminary data were obtained for the eastern Caucasus. In May 2023, a long (over half a year) expedition ended in the vicinity of Kurapdag (Chirag village), which basically confirmed the previously formulated hypothesis about the lower humidity of the eastern Caucasus compared with the western one. An interesting feature was observed on Karadag (located near the Black Sea shore). The millimeter-wave absorption there strongly depends on the wind direction and can drop to quite low values when dry air enters from the Steppe Crimea [30]. This effect is apparently due to the specific conditions at this site and hardly can be expected at most other locations.
All the data collected during numerous expeditions, including the semiannual expedition to Dagestan that ended in May 2023, where the results have not yet been processed or published, are posted in the open-access archive [68].
3.2. Some Results of the Opacity Evaluations from the NASA Data
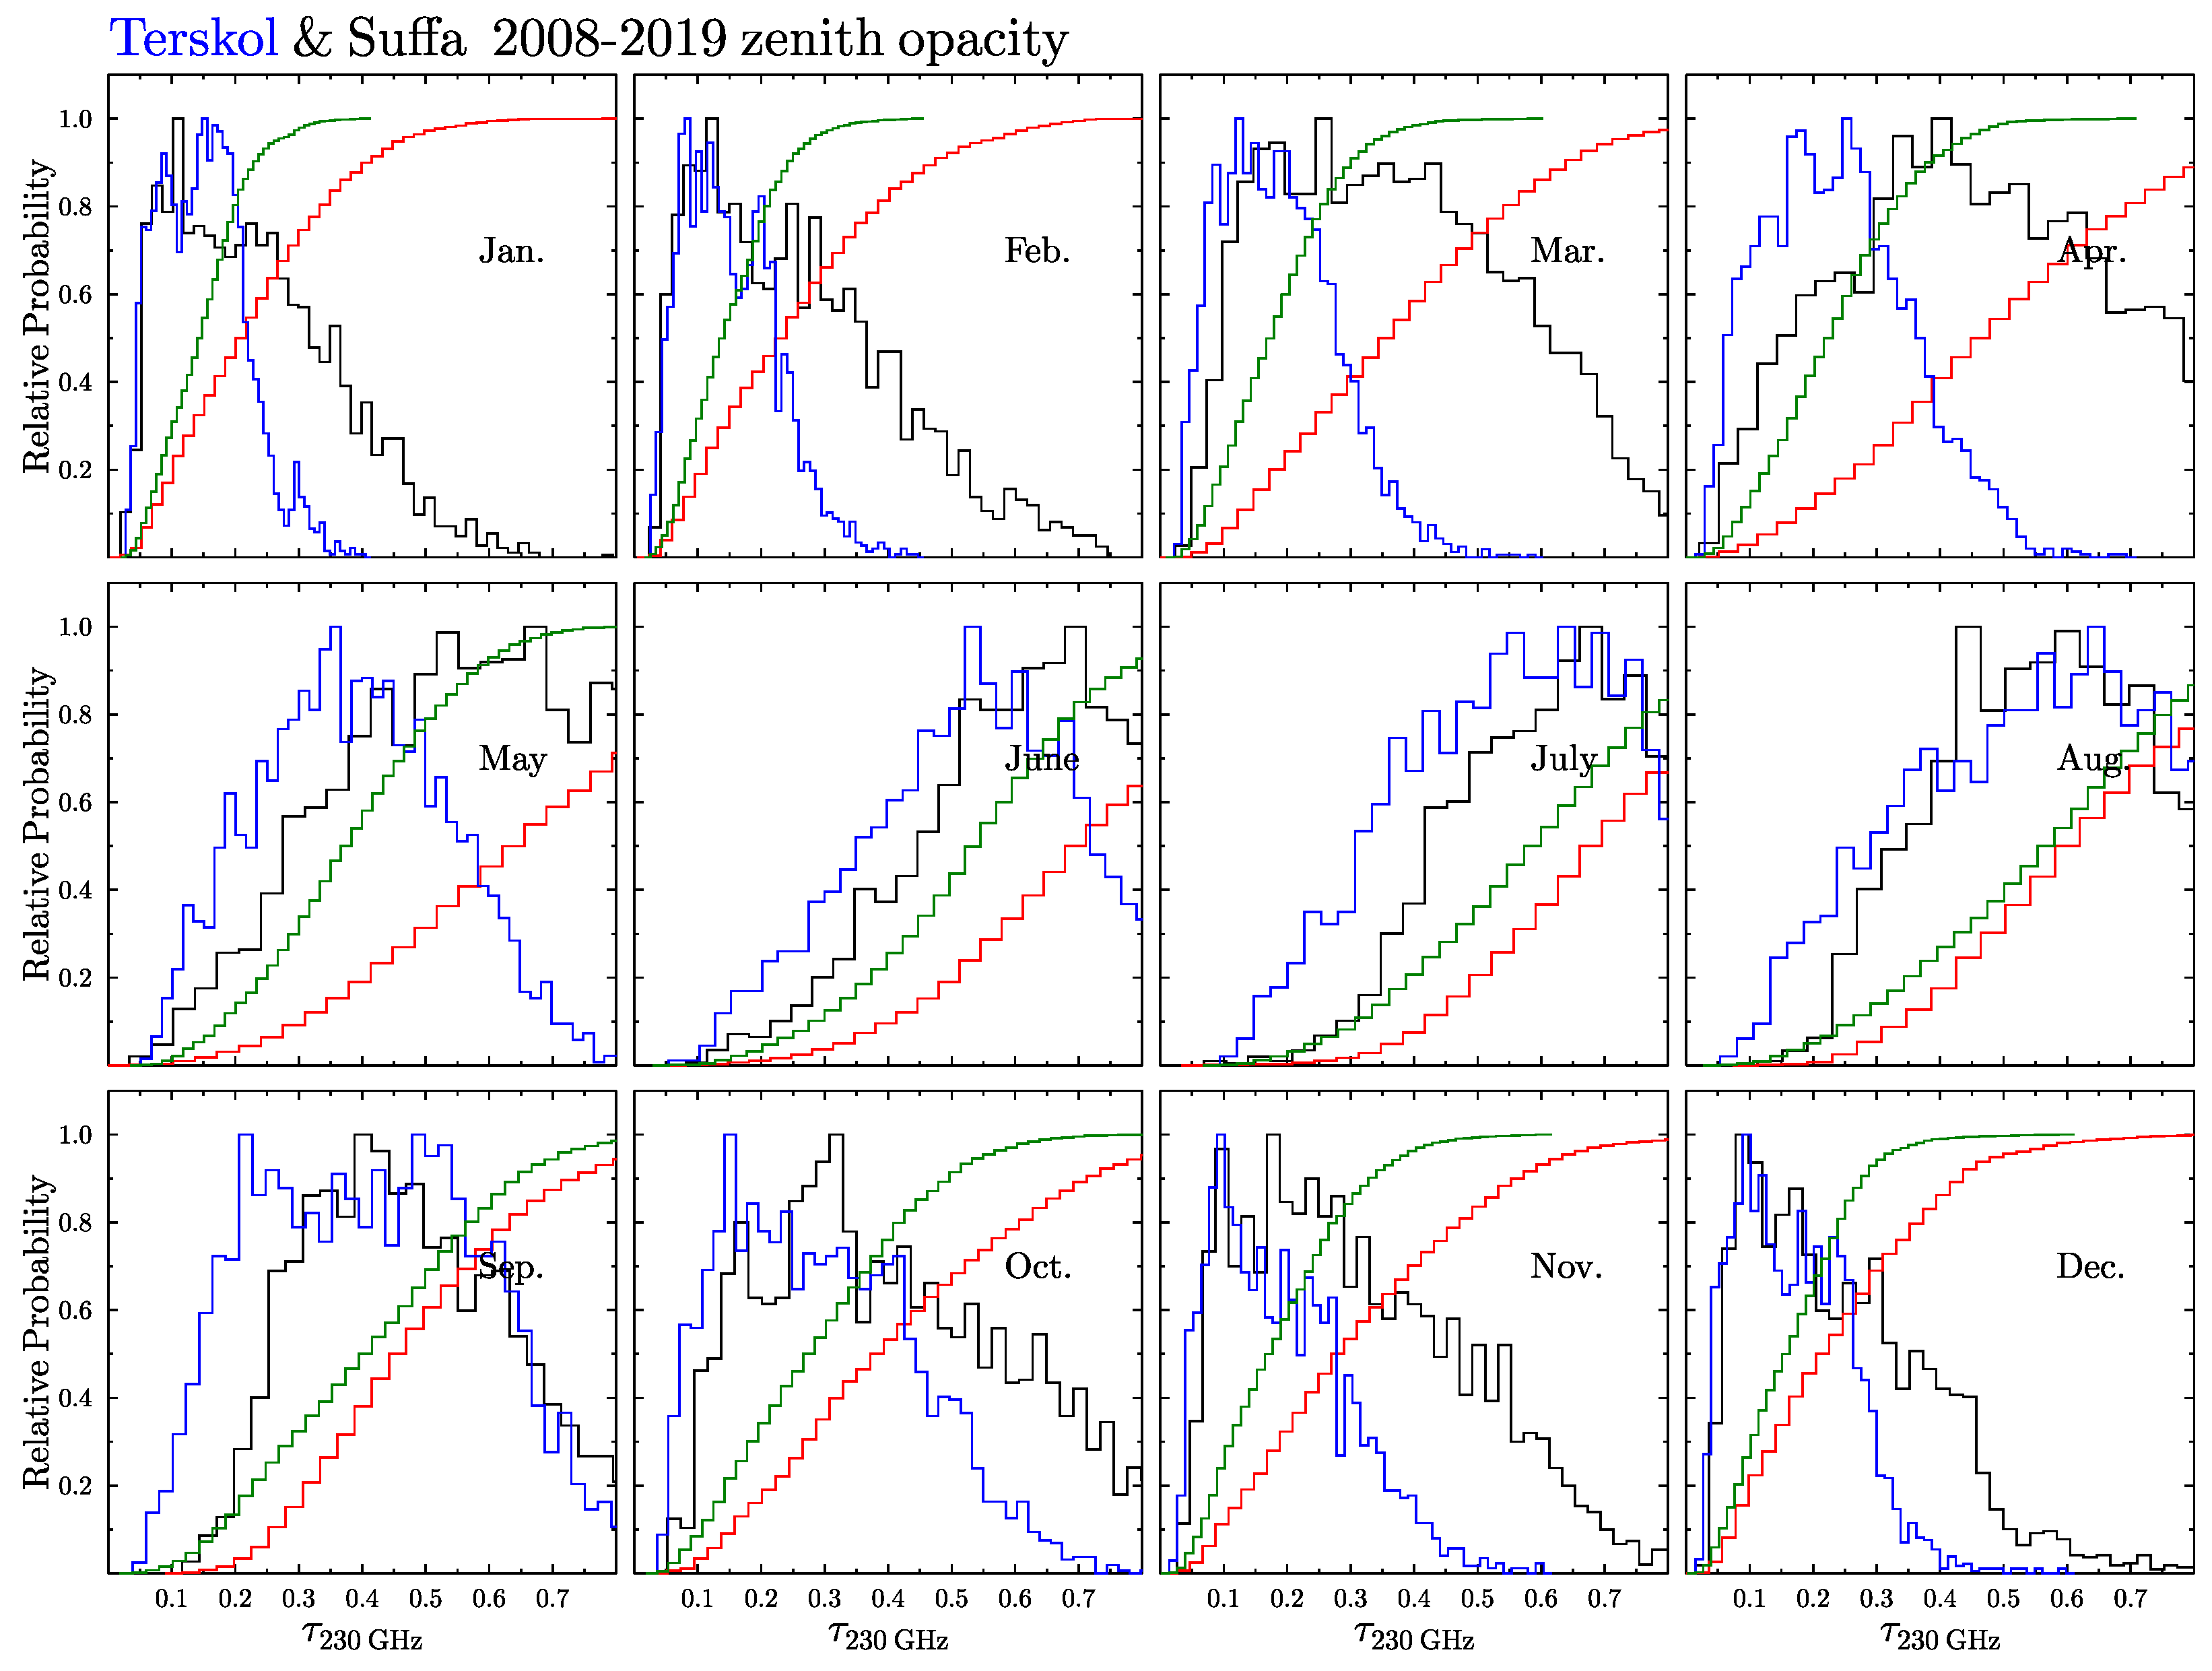
Evaluations of the atmospheric opacity from the NASA data as described in Section 2.4 have been performed for more than 40 sites around the globe [9]. They include an analysis of the seasonal variations in opacity. The main conclusion of this research is that the best place for submillimeter astronomy in the Eastern hemisphere is the high-altitude (4300–4500 m) plateau in Eastern Pamirs. The atmospheric transparency at this site is comparable with that in the Atacama desert in Chile and is much better than on the Suffa plateau in Uzbekistan, where the 70 m radio telescope is constructed. Typical PWV values in winter are as low as 0.8–0.9 mm. The extent of the plateau is rather large, and baselines up to ∼130 km are possible. Similar conditions exist in Tibet. Among the sites on the Russian territory considered in this study, the best transparency was found for the Terskol peak (3150 m), where the optical observatory is located. The comparison of the atmospheric transparency on the Suffa plateau and on the Terskol peak is presented in Figure 4.
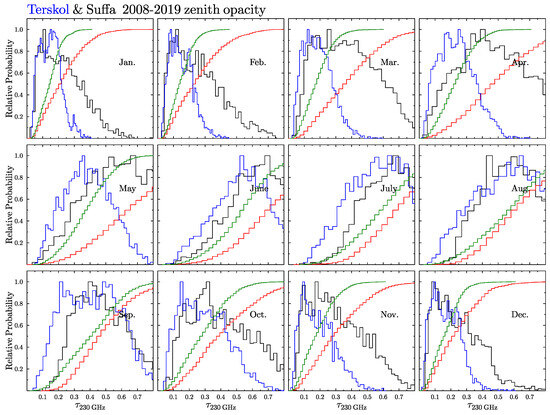
Figure 4.
Probability density and cumulative distributions of 230 GHz zenith opacity at the Terskol peak (blue and green, respectively) in comparison with the Suffa plateau (black and red) calculated from the output of NASA global numerical weather model GEOS-FPIT for 12 years (1 January 2008–31 December 2019). The plots are based on the calculations described in [9].
In general, the advantages of high-altitude locations for submillimeter astronomy are due to lower water content (including cloudiness), lower oxygen absorption and lower specific absorption coefficient per PWV unit in Equation (1). It is worth noting that in the mountains, humidity decreases with height more slowly than above the plain (e.g., [29]), and the decrease in humidity is largely due to a drop in temperature.
4. Discussion
4.1. Degradation of the Telescope Sensitivity Due to Atmospheric Opacity
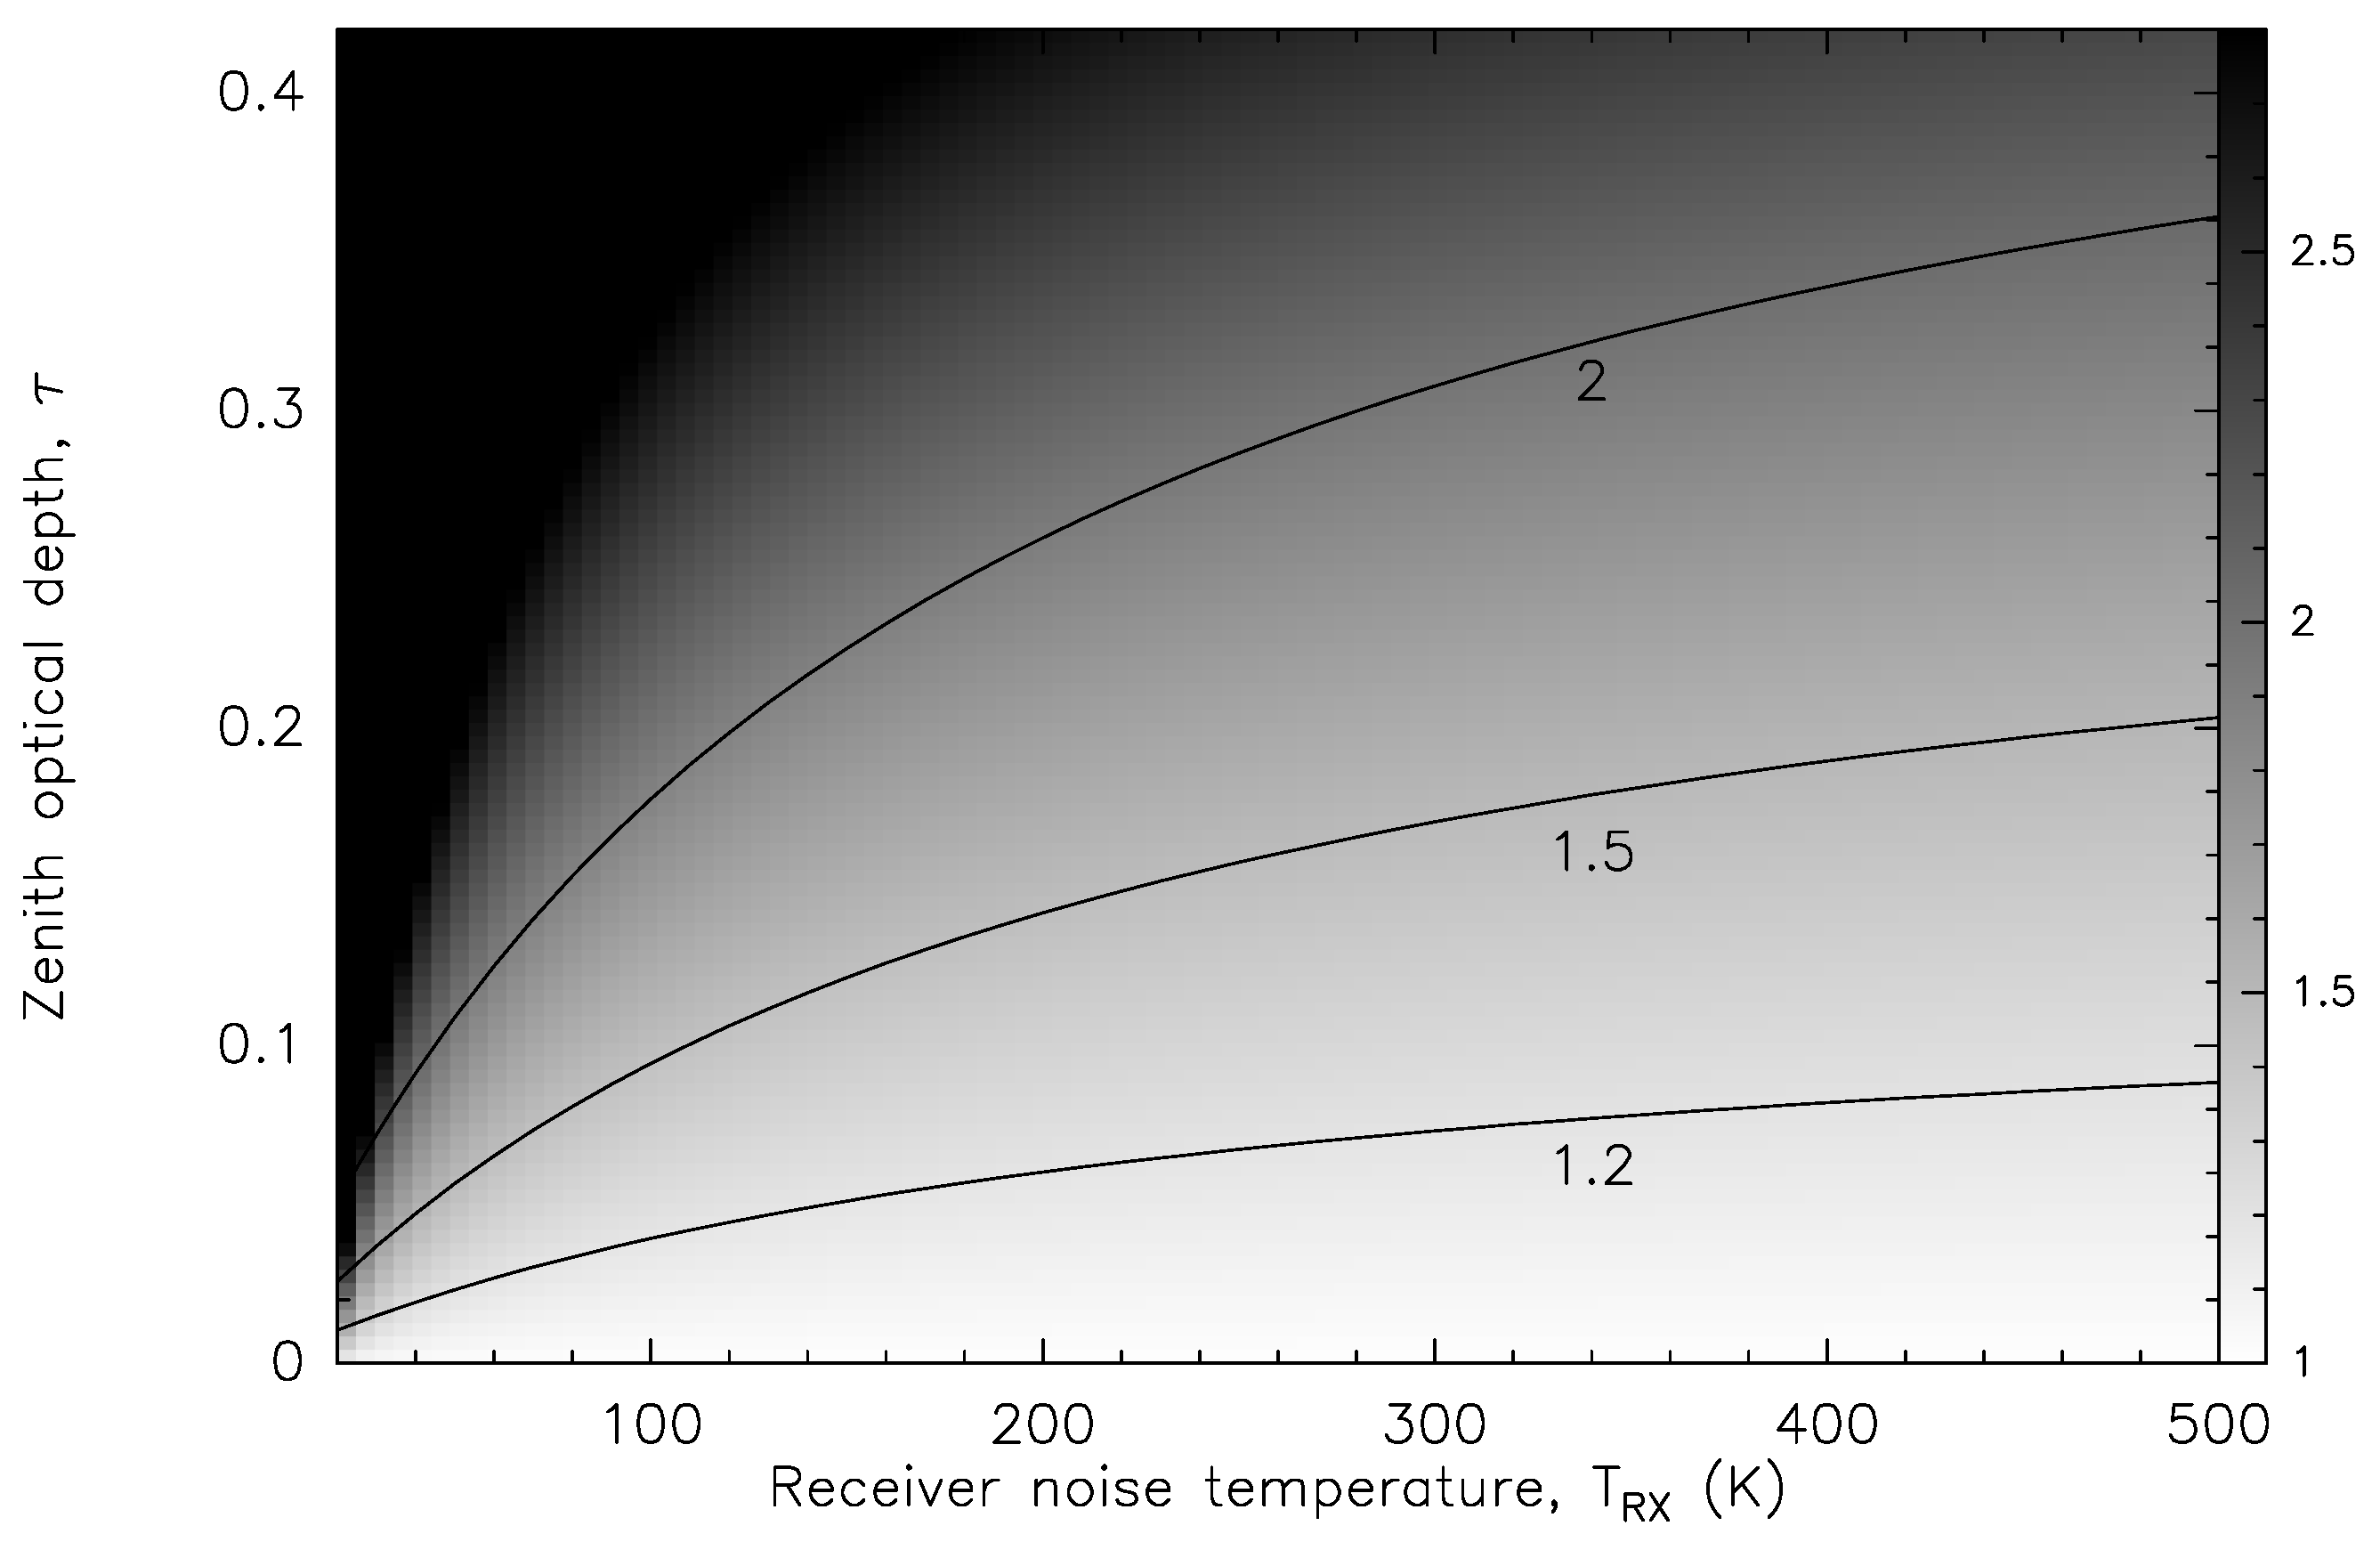
Atmospheric opacity leads to the deterioration of the telescope sensitivity in any case. However, it is worth obtaining numerical estimates of this deterioration. In particular, this can help better understand the acceptable value of opacity in various conditions. For this purpose, we estimate the quantity, which can be called a “degradation factor”:
where is the receiver noise temperature and is the system temperature “above the atmosphere”, i.e., calculated from the system temperature at the receiver front-end taking into account the attenuation in the atmosphere. Neglecting antenna losses and background emission,
In the case of no opacity, . The plot of the degradation factor in dependence on the receiver noise temperature and zenith opacity for the zenith angle , assuming K, is presented in Figure 5. For example, if the degradation factor of 1.5 is considered to be acceptable and the receiver noise temperature is K, then the required zenith opacity is . It is worth noting that the integration time required to achieve the same sensitivity varies as . In the case of , which happens at very high frequencies, the degradation factor approaches . Then, implies at .
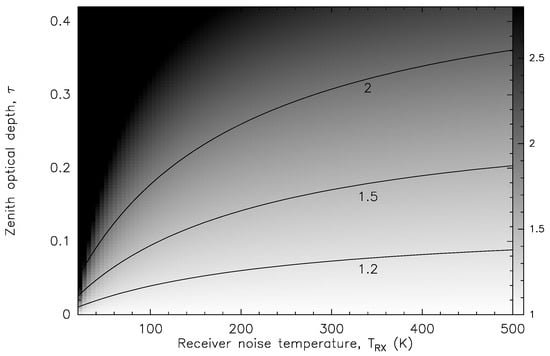
Figure 5.
The degradation factor (gray scale) in dependence on the receiver noise temperature and zenith opacity for the zenith angle , assuming K. The curves correspond to , 1.5 and 2 (from bottom to top).
4.2. The Effect of Cloudiness
The coefficient in Equation (1) is approximately and m at 230 and 345 GHz, respectively, with weak temperature dependence [69]. This means that LWP of 100 m (which is equivalent to 100 g m) contributes about 0.25 to the opacity at 230 GHz. The median values of LWP for different cloud classes are from ∼10 to ∼40 g m [70,71]. In [5], the LWP statistics are presented for the existing and candidate EHT sites. The median values are well below 100 m for most sites. Therefore, in most cases, the opacity in clouds at 1.3 mm is ≲0.1 and cannot fully prevent radio astronomical observations.
However, the problem is that clouds are usually very inhomogeneous, which leads to spatial and temporal fluctuations of opacity and sky brightness. Their influence can hardly be sufficiently suppressed, even by the usual beam-switching technique. As a result, these fluctuations make observations of weak sources practically impossible, especially in continuum. Spectral line observations are less affected because the fluctuations are synchronous in all channels and can be subtracted at the data reduction. However, a more frequent calibration is needed.
4.3. Comparison of the Candidate Sites for Millimeter-Wave Telescopes in Northeastern Eurasia
Long-term monitoring of atmospheric opacity with the MIAP-2 radiometers has been performed at several sites in Russia and Uzbekistan, as described in Section 3.1 (the RT-70 radio telescope construction site on the Suffa plateau, the site of the BTA telescope in Caucasus and the Badary observatory). Among these sites, the best conditions for millimeter-wave astronomy have been observed on the Suffa plateau. However, these conditions are far from being excellent and hardly allow for regular observations at wavelengths mm. At 1.3 mm, only episodic observations are possible in winter, when the monthly averaged value of zenith opacity at this wavelength drops to ∼0.3 (somewhat lower estimates of the opacity for this site are obtained in [5]).
Promising results have been obtained in the short summer measurements on the Muus-Khaya peak in Yakutia (Section 3.1). However, long-term monitoring at this site is needed. Short measurements on the Terskol peak are not conclusive.
Investigations with various methods (e.g., [9,41,67,72,73,74,75,76]) reveal other promising sites in Eurasia with better conditions in comparison with the Suffa plateau. In the paper in [9], based on the NASA GEOS-FPIT model, the eastern Pamirs and Tibet are shown to be the best places. According to [73], based on the ERA5 reanalysis, very good conditions exist at the Ali 1 site in Tibet (PWV ∼0.4 mm in winter) and at Muztag-Ata in the Chinese Pamirs (PWV ∼0.7 mm in winter). Comparable conditions exist in the Sayan Mountains. The Khulugaisha peak, in terms of its characteristics, is close to the sites of Tibet and Pamirs (PWV ∼0.6 mm in winter). There are promising sites in Altai and Dagestan, in particular the Khorai and Kurapdag mountains [73]. The Terskol peak is also rather good in terms of PWV [41,77] but not so good concerning cloudiness. The Aktashtau peak in Uzbekistan (3383 m) located near the RT-70 construction site has PWV statistics similar to Terskol [73]. With PWV mm, astronomical observations at least in the 1.3 mm and 0.85 mm atmospheric windows can be quite efficient. Even lower PWV values of ∼0.5 mm make observations in the higher-frequency windows possible.
It is worth noting that in rugged terrains, the spatial resolution of the global models can be insufficient to characterize atmospheric conditions on certain sites (e.g., on local peaks). This emphasizes the importance of local measurements with radiometric systems or GNSS devices. High-resolution weather prediction and recording on the cloudiness near the observation site could be promising in this respect, too.
So far, our measurements have been performed at 3 and 2 mm. Measurements in the 1.3 mm window would be very important.
In this consideration of the candidate sites for new millimeter- and sub-millimeter-wave telescopes, we have taken into account only the atmospheric opacity. However, there are other criteria which should also be considered. One of them is the stability of the atmosphere [78,79]. Enhanced instability can lead to strong phase fluctuations [80] and anomalous refraction (e.g., [81]). This factor is still poorly investigated.
A new large millimeter-wave telescope would be an efficient part of the global VLBI network (EHT). The estimates show that from this point of view, the Caucasus region is the most effective with the existing EHT configuration (Andrey Lobanov, private communication). However, the situation will change if a large millimeter-wave telescope is built in eastern Asia. In this case, places like the Pamirs and Tibet will have an advantage.
5. Conclusions
In this review, we described methods used to study atmospheric transparency at millimeter and submillimeter wavelengths and summarized the main results of such studies in northeastern Eurasia, with an emphasis on the results of our work. The main agents responsible for the absorption of millimeter and submillimeter waves in the atmosphere are water in various physical states and oxygen. Under clear sky conditions, variations in atmospheric opacity are related to variations in the amount of the precipitable water vapor (PWV). The direct determination of the atmosphere optical depth is usually based on measurements of sky brightness. It can be also evaluated from the PWV value. PWV estimates can be obtained from measurements of the atmosphere emission with water vapor radiometers. Nowadays, the delays of the GNSS (Global Navigation Satellite System) signals are frequently used for this purpose. We proposed the statistical approach for the determination of the PWV values from radiometric measurements based on machine learning algorithms, without addressing the physical model of the atmosphere. Atmospheric absorption at any frequency can be calculated for any selected location using the global atmospheric models now available. We estimate degradation of the telescope sensitivity due to atmospheric opacity.
Our studies of the atmospheric transparency at the candidate sites for millimeter and submillimeter telescopes have been ongoing for about 10 years already by various methods. The considered sites are located in Russia and in the nearby surroundings (in particular, in Uzbekistan). The atmospheric optical depth has been measured with the dual-band tipping radiometer and evaluated with global atmospheric models. Our results, as well as other investigations, show that there are several sites in this area which can be effectively used for astronomical observations in at least the major atmospheric transparency windows at 1.3 mm and 0.85 mm. In general, the results show that northeastern Eurasia is a promising area for submillimeter astronomy.
The investigations continue. More detailed studies of several recently suggested sites are planned, as well as an extension of the measurements to the 1.3 mm atmospheric window.
Author Contributions
Conceptualization, I.I.Z.; methodology, I.I.Z., A.V.L., V.F.V. and P.M.Z.; formal analysis, I.I.Z., A.V.L., V.F.V., P.M.Z. and T.A.K.; writing—original draft preparation, I.I.Z.; writing—review and editing, I.I.Z., A.V.L., V.F.V. and P.M.Z. All authors have read and agreed to the published version of the manuscript.
Funding
This research was funded by the IAP RAS state program FFUF-2021-0005.
Institutional Review Board Statement
Not applicable.
Informed Consent Statement
Not applicable.
Data Availability Statement
No new data were created or analyzed in this study. Data sharing is not applicable to this article.
Acknowledgments
We are grateful to everyone who supported these works and took part in the measurements and estimates of atmospheric opacity considered here, as well as in discussions of the results obtained.
Conflicts of Interest
The authors declare no conflict of interest. The funders had no role in the design of the study.
Abbreviations
The following abbreviations are used in this manuscript:
| MDPI | Multidisciplinary Digital Publishing Institute |
| GNSS | Global Navigation Satellite Systems |
| NASA | National Aeronautics and Space Administration |
| VLBI | Very Long Baseline Interferometry |
| EHT | Event Horizon Telescope |
| LSTM | Long Short-Term Memory |
| LWP | Liquid Water Path |
| PWV | Precipitable Water Vapor |
| WVR | Water Vapor Radiometer |
References
- Wilson, T.L.; Guilloteau, S. Millimeter Astronomy; Springer: Berlin/Heidelberg, Germany, 2018. [Google Scholar] [CrossRef]
- Event Horizon Telescope Collaboration; Akiyama, K.; Alberdi, A.; Alef, W.; Asada, K.; Azulay, R.; Baczko, A.K.; Ball, D.; Baloković, M.; Barrett, J.; et al. First M87 Event Horizon Telescope Results. I. The Shadow of the Supermassive Black Hole. Astrophys. J. Lett. 2019, 875, L1. [Google Scholar] [CrossRef]
- Event Horizon Telescope Collaboration; Akiyama, K.; Alberdi, A.; Alef, W.; Algaba, J.C.; Anantua, R.; Asada, K.; Azulay, R.; Bach, U.; Baczko, A.K.; et al. First Sagittarius A* Event Horizon Telescope Results. I. The Shadow of the Supermassive Black Hole in the Center of the Milky Way. Astrophys. J. Lett. 2022, 930, L12. [Google Scholar] [CrossRef]
- Doeleman, S.S.; Barrett, J.; Blackburn, L.; Bouman, K.; Broderick, A.E.; Chaves, R.; Fish, V.L.; Fitzpatrick, G.; Fuentes, A.; Freeman, M.; et al. Reference Array and Design Consideration for the next-generation Event Horizon Telescope. arXiv 2023, arXiv:2306.08787. [Google Scholar] [CrossRef]
- Raymond, A.W.; Palumbo, D.; Paine, S.N.; Blackburn, L.; Córdova Rosado, R.; Doeleman, S.S.; Farah, J.R.; Johnson, M.D.; Roelofs, F.; Tilanus, R.P.J.; et al. Evaluation of New Submillimeter VLBI Sites for the Event Horizon Telescope. Astrophys. J. Suppl. 2021, 253, 5. [Google Scholar] [CrossRef]
- Hojaev, A.S.; Shanin, G.I. The Future Suffa International Radio Astronomy Observatory. In Proceedings of the IAU Joint Discussion, Kyoto, Japan, 22–23 August 1997; Volume 23, p. 3. [Google Scholar]
- Hojaev, A.; Shanin, G.I.; Artyomenko, Y.N. Suffa Radio Observatory in Uzbekistan: Progress and radio-seeing research plans. IAU Spec. Sess. 2007, 5, 177–182. [Google Scholar] [CrossRef]
- Wang, N. Xinjiang Qitai 110 m radio telescope. Sci. Sin. Phys. Mech. Astron. 2014, 44, 783–794. [Google Scholar] [CrossRef]
- Lapinov, A.V.; Lapinova, S.A.; Petrov, L.Y.; Ferrusca, D. On the benefits of the Eastern Pamirs for sub-mm astronomy. In Proceedings of the Millimeter, Submillimeter, and Far-Infrared Detectors and Instrumentation for Astronomy X; Zmuidzinas, J., Gao, J.R., Eds.; Society of Photo-Optical Instrumentation Engineers (SPIE) Conference Series; SPIE: Bellingham, DC, USA, 2020; Volume 11453, p. 114532O. [Google Scholar] [CrossRef]
- Khaikin, V.; Lebedev, M.; Shmagin, V.; Zinchenko, I.; Vdovin, V.; Bubnov, G.; Edelman, V.; Yakopov, G.; Shikhovtsev, A.; Marchiori, G.; et al. On the Eurasian SubMillimeter Telescopes Project (ESMT). In Proceedings of the 2020 7th All-Russian Microwave Conference (RMC), Moscow, Russia, 25–27 November 2020; pp. 47–51. [Google Scholar] [CrossRef]
- Marchiori, G.; Rampini, F.; Tordi, M.; Spinola, M.; Bressan, R. Towards the Eurasian Submillimeter Telescope (ESMT): Telescope concept outline and first results. In Proceedings of the Ground-Based Astronomy in Russia. 21st Century; Romanyuk, I.I., Yakunin, I.A., Valeev, A.F., Kudryavtsev, D.O., Eds.; Special Astrophysical Observatory: Nizhnii Arkhyz, Russia, 2020; pp. 378–383. [Google Scholar] [CrossRef]
- Liebe, H.J. MPM—An atmospheric millimeter-wave propagation model. Int. J. Infrared Millim. Waves 1989, 10, 631–650. [Google Scholar] [CrossRef]
- Urban, J. Moliere (v5): A versatile forward- and inversion model for the millimeter and sub-millimeter wavelength range. J. Quant. Spectrosc. Radiat. Transf. 2004, 83, 529–554. [Google Scholar] [CrossRef]
- Zhevakin, S.A.; Naumov, A.P. The propagation of centimeter, millimeter, and submillimeter radio waves in the earth’s atmosphere. Radiophys. Quantum Electron. 1967, 10, 678–694. [Google Scholar] [CrossRef]
- Bubnov, G.; Vdovin, V.; Khaikin, V.; Tremblin, P.; Baron, P. Analysis of variations in factors of specific absorption of sub-terahertz waves in the earth’s atmosphere. In Proceedings of the 2020 7th All-Russian Microwave Conference (RMC), Moscow, Russia, 25–27 November 2020; pp. 229–232. [Google Scholar] [CrossRef]
- Kislyakov, A.G.; Stankevich, K.S. Investigation of the absorption of radio waves in the troposphere using radioastronomical methods. Radiophys. Quantum Electron. 1967, 10, 695–708. [Google Scholar] [CrossRef]
- Kallfass, I.; Antes, J.; Schneider, T.; Kurz, F.; Lopez-Diaz, D.; Diebold, S.; Massler, H.; Leuther, A.; Tessmann, A. All Active MMIC-Based Wireless Communication at 220 GHz. IEEE Trans. Terahertz Sci. Technol. 2011, 1, 477–487. [Google Scholar] [CrossRef]
- Hirata, A.; Kosugi, T.; Takahashi, H.; Takeuchi, J.; Togo, H.; Yaita, M.; Kukutsu, N.; Aihara, K.; Murata, K.; Sato, Y.; et al. 120-GHz-Band Wireless Link Technologies for Outdoor 10-Gbit/s Data Transmission. IEEE Trans. Microw. Theory Tech. 2012, 60, 881–895. [Google Scholar] [CrossRef]
- Wang, C.; Lin, C.; Chen, Q.; Lu, B.; Deng, X.; Zhang, J. A 10-Gbit/s Wireless Communication Link Using 16-QAM Modulation in 140-GHz Band. IEEE Trans. Microw. Theory Tech. 2013, 61, 2737–2746. [Google Scholar] [CrossRef]
- Tsvetkov, A.I.; Fokin, A.P.; Sedov, A.S. First Experiments on Data Transmission Using a Sub-THz Gyrotron. J. Infrared Millim. Terahertz Waves 2019, 40, 696–702. [Google Scholar] [CrossRef]
- O’Hara, J.F.; Ekin, S.; Choi, W.; Song, I. A Perspective on Terahertz Next-Generation Wireless Communications. Technologies 2019, 7, 43. [Google Scholar] [CrossRef]
- Rappaport, T.S.; Xing, Y.; Kanhere, O.; Ju, S.; Madanayake, A.; Mandal, S.; Alkhateeb, A.; Trichopoulos, G.C. Wireless Communications and Applications Above 100 GHz: Opportunities and Challenges for 6G and Beyond. IEEE Access 2019, 7, 78729–78757. [Google Scholar] [CrossRef]
- Jiang, W.; Zhang, Q.; He, J.; Habibi, M.A.; Melnyk, S.; El-Absi, M.; Han, B.; Renzo, M.D.; Schotten, H.D.; LUO, F.L.; et al. Terahertz Communications and Sensing for 6G and Beyond: A Comprehensive View. arXiv 2023, arXiv:2307.10321. [Google Scholar] [CrossRef]
- Tolkachev, A.; Yegorov, E.; Shishlov, A. Radar and communication systems: Some trends of development. In Quasi-Optical Control of Intense Microwave Transmission; Springer: Berlin/Heidelberg, Germany, 2005; pp. 353–370. [Google Scholar]
- Kempkes, M.A.; Hawkey, T.J.; Gaudreau, M.P.; Phillips, R.A. W-band transmitter upgrade for the haystack ultrawideband satellite imaging radar (HUSIR). In Proceedings of the 2006 IEEE International Vacuum Electronics Conference Held Jointly with 2006 IEEE International Vacuum Electron Sources, Monterey, CA, USA, 25–27 April 2006; pp. 551–552. [Google Scholar]
- Linde, G.J.; Ngo, M.T.; Danly, B.G.; Cheung, W.J.; Gregers-Hansen, V. WARLOC: A high-power coherent 94 GHz radar. IEEE Trans. Aerosp. Electron. Syst. 2008, 44, 1102–1117. [Google Scholar] [CrossRef]
- Gaikovich, K.P.; Naumov, A.P. On the influence of the earth’s sphericity and radio wave refraction on atmospheric radio emission in the microwave band. Radiotekhnika Elektron. 1979, 24, 168–171. [Google Scholar]
- Pardo, J.R.; Cernicharo, J.; Serabyn, E. Atmospheric transmission at microwaves (ATM): An improved model for millimeter/submillimeter applications. IEEE Trans. Antennas Propag. 2001, 49, 1683–1694. [Google Scholar] [CrossRef]
- Kislyakov, A.G. Effective path length and mean temperature of the atmosphere. Radiophys. Quantum Electron. 1966, 9, 282–287. [Google Scholar] [CrossRef]
- Bubukin, I.T.; Rakut’, I.V.; Agafonov, M.I.; Pankratov, A.L.; Troitskii, A.V.; Lapchenko, V.A.; Gorbunov, R.V.; Zinchenko, I.I.; Nosov, V.I.; Vdovin, V.F. Analysis of the Results of Astroclimate Research at the Kara-Dag Radioastronomical Station in Crimea and the Possibilities for Reducing the Influence of the Atmosphere on Millimeter-Band Radioastronomical Observations. Sov. J. Exp. Theor. Phys. 2019, 129, 35–45. [Google Scholar] [CrossRef]
- Ferrusca, D.; Contreras R., J. Weather monitor station and 225 GHz radiometer system installed at Sierra Negra: The Large Millimeter Telescope site. In Proceedings of the Ground-Based and Airborne Instrumentation for Astronomy V; Ramsay, S.K., McLean, I.S., Takami, H., Eds.; Society of Photo-Optical Instrumentation Engineers (SPIE) Conference Series; SPIE: Bellingham, DC, USA, 2014; Volume 9147, p. 914730. [Google Scholar] [CrossRef]
- Nosov, V.I.; Bolshakov, O.S.; Bubnov, G.M.; Vdovin, V.F.; Zinchenko, I.I.; Marukhno, A.S.; Nikiforov, P.L.; Fedoseev, L.I.; Shvetsov, A.A. A dual-wave atmosphere transparency radiometer of the millimeter wave range. Instruments Exp. Tech. 2016, 59, 374–380. [Google Scholar] [CrossRef]
- Bubnov, G.M.; Artemenko, Y.N.; Vdovin, V.F.; Danilevsky, D.B.; Zinchenko, I.I.; Nosov, V.I.; Nikiforov, P.L.; Shanin, G.I.; Raupov, D.A. The Results of Astroclimate Observations in the Short-Wave Length Interval of the Millimeter-Wave Range on the Suffa Plateau. Radiophys. Quantum Electron. 2017, 59, 763–771. [Google Scholar] [CrossRef]
- Fedoseev, L.I.; Bozhkov, V.G.; Genneberg, V.A.; Petrov, I.V.; Shkaev, A.P. Radiometer of the 3-mm wave range with a modulator-calibrator. Radiophys. Quantum Electron. 2007, 50, 858–863. [Google Scholar] [CrossRef]
- Bubnov, G.M.; Grigor’ev, V.F.; Zinchenko, I.I.; Zemlyanukha, P.M.; Il’in, G.N.; Kabanov, D.M.; Nosov, V.I.; Vdovin, V.F. Consistent Determination of the Integral Humidity and Effective Optical Depth of the Atmosphere in the Millimeter Wavelength Range Using Wideband Radiometers. Radiophys. Quantum Electron. 2020, 62, 820–829. [Google Scholar] [CrossRef]
- Nikolic, B.; Bolton, R.C.; Graves, S.F.; Hills, R.E.; Richer, J.S. Phase correction for ALMA with 183 GHz water vapour radiometers. Astron. Astrophys. 2013, 552, A104. [Google Scholar] [CrossRef]
- Arsaev, I.E.; Bykov, V.Y.; Il’in, G.N.; Yurchuk, E.F. Water Vapor Radiometer: Measuring Instrument of Atmospheric Brightness Temperature. Meas. Tech. 2017, 60, 497–504. [Google Scholar] [CrossRef]
- Dembelov, M.G.; Bashkuev, Y.B. Estimation of the Tropospheric Moisture Content Derived from GPS Observations, Radio Sounding Data, and Measurements with a Water Vapor Radiometer. Atmos. Ocean. Opt. 2022, 35, 359–365. [Google Scholar] [CrossRef]
- Dembelov, M.G.; Bashkuev, Y.B. Moisture content of the troposphere from GPS observations and water vapor radiometer measurements. In Proceedings of the 28th International Symposium on Atmospheric and Ocean Optics: Atmospheric Physics; Matvienko, G.G., Romanovskii, O.A., Eds.; Society of Photo-Optical Instrumentation Engineers (SPIE) Conference Series; SPIE: Bellingham, DC, USA, 2022; Volume 12341, p. 123415M. [Google Scholar] [CrossRef]
- Petrov, L. Modeling of path delay in the neutral atmosphere: A paradigm shift. arXiv 2015, arXiv:1502.06678. [Google Scholar] [CrossRef]
- Bubukin, I.T.; Rakut, I.V.; Agafonov, M.I.; Pankratov, A.L.; Lapinov, A.V.; Petrov, L.Y. On Atmospheric Absorption Values at Millimeter Waves on the Suffa Plateau and Karadag Landfill. Radiophys. Quantum Electron. 2023, 65, 719–727. [Google Scholar] [CrossRef]
- Global Modeling And Assimilation Office; Pawson, S. MERRA-2 Inst1 2d int Nx: 2d, 1-Hourly, Instantaneous, Single-Level, Assimilation, Vertically Integrated Diagnostics V5.12.4. 2015. Available online: https://disc.gsfc.nasa.gov/datasets/M2I1NXINT_5.12.4/summary (accessed on 1 September 2023).
- Gelaro, R.; McCarty, W.; Suárez, M.J.; Todling, R.; Molod, A.; Takacs, L.; Randles, C.A.; Darmenov, A.; Bosilovich, M.G.; Reichle, R.; et al. The Modern-Era Retrospective Analysis for Research and Applications, Version 2 (MERRA-2). J. Clim. 2017, 30, 5419–5454. [Google Scholar] [CrossRef] [PubMed]
- Hersbach, H.; Bell, B.; Berrisford, P.; Hirahara, S.; Horányi, A.; Muñoz-Sabater, J.; Nicolas, J.; Peubey, C.; Radu, R.; Schepers, D.; et al. The ERA5 global reanalysis. Q. J. R. Meteorol. Soc. 2020, 146, 1999–2049. [Google Scholar] [CrossRef]
- Bevis, M.; Businger, S.; Herring, T.A.; Rocken, C.; Anthes, R.A.; Ware, R.H. GPS Meteorology: Remote Sensing of Atmospheric Water Vapor Using the Global Positioning System. J. Geophys. Res. 1992, 97, 15787–15801. [Google Scholar] [CrossRef]
- Bevis, M.; Businger, S.; Chiswell, S.; Herring, T.A.; Anthes, R.A.; Rocken, C.; Ware, R.H. GPS Meteorology: Mapping Zenith Wet Delays onto Precipitable Water. J. Appl. Meteorol. 1994, 33, 379–386. [Google Scholar] [CrossRef]
- Duan, J.; Bevis, M.; Fang, P.; Bock, Y.; Chiswell, S.; Businger, S.; Rocken, C.; Solheim, F.; van Hove, T.; Ware, R.; et al. GPS Meteorology: Direct Estimation of the Absolute Value of Precipitable Water. J. Appl. Meteorol. 1996, 35, 830–838. [Google Scholar] [CrossRef]
- Wang, J.; Zhang, L.; Dai, A.; van Hove, T.; van Baelen, J. A near-global, 2-hourly data set of atmospheric precipitable water from ground-based GPS measurements. J. Geophys. Res. (Atmos.) 2007, 112, D11107. [Google Scholar] [CrossRef]
- Manandhar, S.; Lee, Y.H.; Meng, Y.S.; Yuan, F.; Ong, J.T. GPS-Derived PWV for Rainfall Nowcasting in Tropical Region. IEEE Trans. Geosci. Remote. Sens. 2018, 56, 4835–4844. [Google Scholar] [CrossRef]
- Zhang, W.; Zhang, H.; Liang, H.; Lou, Y.; Cai, Y.; Cao, Y.; Zhou, Y.; Liu, W. On the suitability of ERA5 in hourly GPS precipitable water vapor retrieval over China. J. Geod. 2019, 93, 1897–1909. [Google Scholar] [CrossRef]
- Jiang, J.; Zhou, T.; Zhang, W. Evaluation of Satellite and Reanalysis Precipitable Water Vapor Data Sets Against Radiosonde Observations in Central Asia. Earth Space Sci. 2019, 6, 1129–1148. [Google Scholar] [CrossRef]
- Zhao, Q.; Yao, Y.; Yao, W.; Zhang, S. GNSS-derived PWV and comparison with radiosonde and ECMWF ERA-Interim data over mainland China. J. Atmos.-Sol.-Terr. Phys. 2019, 182, 85–92. [Google Scholar] [CrossRef]
- Zhu, D.; Zhang, K.; Yang, L.; Wu, S.; Li, L. Evaluation and Calibration of MODIS Near-Infrared Precipitable Water Vapor over China Using GNSS Observations and ERA-5 Reanalysis Dataset. Remote. Sens. 2021, 13, 2761. [Google Scholar] [CrossRef]
- Wang, S.; Xu, T.; Nie, W.; Jiang, C.; Yang, Y.; Fang, Z.; Li, M.; Zhang, Z. Evaluation of Precipitable Water Vapor from Five Reanalysis Products with Ground-Based GNSS Observations. Remote. Sens. 2020, 12, 1817. [Google Scholar] [CrossRef]
- Ziskin Ziv, S.; Yair, Y.; Alpert, P.; Uzan, L.; Reuveni, Y. The diurnal variability of precipitable water vapor derived from GPS tropospheric path delays over the Eastern Mediterranean. Atmos. Res. 2021, 249, 105307. [Google Scholar] [CrossRef]
- Huang, L.; Mo, Z.; Liu, L.; Zeng, Z.; Chen, J.; Xiong, S.; He, H. Evaluation of hourly PWV products derived from ERA5 and MERRA-2 over the Tibetan Plateau using ground-based GNSS observations by two enhanced models. Earth Space Sci. 2021, 8, e2020EA001516. [Google Scholar] [CrossRef]
- Rosell, P.A.; Mackern Oberti, M.V.; Rivera, J.A.; Euillades, P.A. 10-Year assessment of GNSS integrated water vapour in the SIRGAS network. J. South Am. Earth Sci. 2023, 130, 104539. [Google Scholar] [CrossRef]
- Wu, J.; Su, M.; Shen, X.; Qiao, L.; Zheng, J. Assessment of the performance of GPS-PWV and rainfall event prediction by using precise products from different analysis centers. Earth Sci. Inform. 2023, 16, 2199–2210. [Google Scholar] [CrossRef]
- Sarkar, S.; Kuttippurath, J.; Patel, V. Long-term changes in precipitable water vapour over India derived from satellite and reanalysis data for the past four decades (1980–2020). Environ. Sci. Atmos. 2023, 3, 749–759. [Google Scholar] [CrossRef]
- Bubnov, G.; Zemlyanukha, P.; Dombek, E.; Vdovin, V. Machine learning methods for Precipitable Water Vapor estimation by radiometric data in millimetre wavelength. J. Phys. Conf. Ser. 2021, 2015, 012024. [Google Scholar] [CrossRef]
- Cover, T.; Hart, P. Nearest neighbor pattern classification. IEEE Trans. Inf. Theory 1967, 13, 21–27. [Google Scholar] [CrossRef]
- Bubnov, G.M.; Abashin, E.B.; Balega, Y.Y.; Bolshakov, O.S.; Dryagin, S.Y.; Dubrovich, V.K.; Marukhno, A.S.; Nosov, V.I.; Vdovin, V.F.; Zinchenko, I.I. Searching for New Sites for THz Observations in Eurasia. IEEE Trans. Terahertz Sci. Technol. 2015, 5, 64–72. [Google Scholar] [CrossRef]
- Bubnov, G.M.; Vdovin, V.F.; Bukov, V.Y.; Makarov, T.A.; Il’in, G.N.; Zinchenko, I.I. Millimeter-wave astroclimate investigations on badary observatory near Baikal lake. In Proceedings of the 2017 XXXIInd General Assembly and Scientific Symposium of the International Union of Radio Science (URSI GASS), Montreal, QC, Canada, 19–26 August 2017; pp. 1–4. [Google Scholar] [CrossRef]
- Bubnov, G.; Vdovin, V.F.; Zemlyanukha, P.M.; Okunev, V.S.; Grigor’yev, V.F. Svalbard astroclimate research: Expedition and first results. Eur. Phys. J. Web Conf. 2018, 195, 09002. [Google Scholar] [CrossRef]
- Agafonov, M.I.; Bubnov, G.M.; Bubukin, I.T.; Vdovin, V.F.; Gorbunov, R.V.; Zinchenko, I.I.; Lapchenko, V.A.; Nosov, V.I.; Pankratov, A.L.; Rakut, I.V. The Results of Observing the Astroclimate on the Crimean Peninsula in the Shortwave Part of the Millimeter Wavelength Range. Astrophys. Bull. 2018, 73, 387–392. [Google Scholar] [CrossRef]
- Marukhno, A.S.; Bubnov, G.M.; Vdovin, V.F.; Voziakova, O.V.; Zemlyanukha, P.M.; Zinchenko, I.I.; Mingaliev, M.G.; Shatsky, N.I. Analysis of the Millimeter-Band Astroclimate at the Caucasus Mountain Observatory. In Proceedings of the Ground-Based Astronomy in Russia. 21st Century; Romanyuk, I.I., Yakunin, I.A., Valeev, A.F., Kudryavtsev, D.O., Eds.; Special Astrophysical Observatory: Nizhnii Arkhyz, Russia, 2020; pp. 184–188. [Google Scholar] [CrossRef]
- Balega, Y.Y.; Bataev, D.K.S.; Bubnov, G.M.; Vdovin, V.F.; Zemlyanukha, P.M.; Lolaev, A.B.; Lesnov, I.V.; Marukhno, A.S.; Marukhno, N.A.; Murtazaev, A.K.; et al. Direct Measurements of Atmospheric Absorption of Subterahertz Waves in the Northern Caucasus. Dokl. Phys. 2022, 67, 1–4. [Google Scholar] [CrossRef]
- Bubnov, G. Astroclimate Measurements on Several Points over Eastern Hemisphere in 2-mm and 3-millimeter Atmospheric Transparency Windows Using Tipping Radiometer. Zenodo, 2021. Available online: https://zenodo.org/records/4973548 (accessed on 1 September 2023).
- Paine, S. The Am Atmospheric Model. Zenodo, 2019. Available online: https://zenodo.org/records/3406483 (accessed on 1 September 2023).
- Rogers, R.R.; Yau, M.K. A Short Course in Cloud Physics; Elsevier: Amsterdam, The Netherlands, 1989. [Google Scholar]
- Unglaub, C.; Block, K.; Mülmenstädt, J.; Sourdeval, O.; Quaas, J. A new classification of satellite-derived liquid water cloud regimes at cloud scale. Atmos. Chem. Phys. 2020, 20, 2407–2418. [Google Scholar] [CrossRef]
- Panchuk, V.E.; Afanas’ev, V.L. Astroclimate of Northern Caucasus—Myths and reality. Astrophys. Bull. 2011, 66, 233–254. [Google Scholar] [CrossRef]
- Khaikin, V.B.; Shikhovtsev, A.Y.; Mironov, A.P.; Qian, X. A study of the astroclimate in the Dagestan mountains Agul region and at the Ali Observatory in Tibet as possible locations for the Eurasian SubMM Telescopes (ESMT). In Proceedings of the The Multifaceted Universe: Theory and Observations—2022, Nizhny Arkhyz, Russia, 23–27 May 2022; p. 72. [Google Scholar] [CrossRef]
- Shikhovtsev, A.Y.; Khaikin, V.B.; Mironov, A.P.; Kovadlo, P.G. Statistical Analysis of the Water Vapor Content in North Caucasus and Crimea. Atmos. Ocean. Opt. 2022, 35, 168–175. [Google Scholar] [CrossRef]
- Shikhovtsev, A.Y.; Kovadlo, P.G.; Khaikin, V.B.; Kiselev, A.V. Precipitable Water Vapor and Fractional Clear Sky Statistics within the Big Telescope Alt-Azimuthal Region. Remote. Sens. 2022, 14, 6221. [Google Scholar] [CrossRef]
- Bolbasova, L.A.; Shikhovtsev, A.Y.; Ermakov, S.A. Statistics of precipitable water vapour above the sites of the 6-m Big Telescope Alt-azimuthal and new 3-m Large Solar Telescope using ERA5 data. Mon. Not. R. Astron. Soc. 2023, 520, 4336–4344. [Google Scholar] [CrossRef]
- Shikhovtsev, A.Y.; Khaikin, V.B.; Kovadlo, P.G.; Baron, P. Optical Thickness of the Atmosphere above the Terskol Peak. Atmos. Ocean. Opt. 2023, 36, 78–85. [Google Scholar] [CrossRef]
- Abahamid, A.; Vernin, J.; Benkhaldoun, Z.; Jabiri, A.; Azouit, M.; Agabi, A. Seeing, outer scale of optical turbulence, and coherence outer scale at different astronomical sites using instruments on meteorological balloons. Astron. Astrophys. 2004, 422, 1123–1127. [Google Scholar] [CrossRef]
- Shikhovtsev, A.Y.; Kovadlo, P.G.; Kopylov, E.A.; Ibrahimov, M.A.; Ehgamberdiev, S.A.; Tillayev, Y.A. Energy spectra of atmospheric turbulence for calculating C n 2 parameter. I. Maidanak and Suffa observatories in Uzbekistan. Atmosphere 2021, 12, 1614. [Google Scholar] [CrossRef]
- Thompson, A.R.; Moran, J.M.; Swenson, G.W., Jr. Interferometry and Synthesis in Radio Astronomy, 3rd ed.; Springer Nature: Berlin/Heidelberg, Germany, 2017. [Google Scholar] [CrossRef]
- Altenhoff, W.J.; Baars, J.W.M.; Wink, J.E.; Downes, D. Observations of anomalous refraction at radio wavelengths. Astron. Astrophys. 1987, 184, 381–385. [Google Scholar]
Disclaimer/Publisher’s Note: The statements, opinions and data contained in all publications are solely those of the individual author(s) and contributor(s) and not of MDPI and/or the editor(s). MDPI and/or the editor(s) disclaim responsibility for any injury to people or property resulting from any ideas, methods, instructions or products referred to in the content. |
© 2023 by the authors. Licensee MDPI, Basel, Switzerland. This article is an open access article distributed under the terms and conditions of the Creative Commons Attribution (CC BY) license (https://creativecommons.org/licenses/by/4.0/).

