Abstract
Nowadays, people like to travel to alleviate the stress and depression they experience in their busy lives, and if they can do so at a low cost, it will be even more beneficial to them. A traveler can choose to book a travel ticket themselves or to contact a travel agency, who will book a ticket for them. A lack of vehicle management can cause travel agencies to lose profit. In this article, we have provided proficient solutions for vehicle optimization to minimize travel costs. Additionally, however, arranging an appropriate tour guide is sometimes expensive for travelers. Moreover, travelers often do not know about suitable travel packages and occasionally do not know where they may want to visit. In this paper, we have discussed how we used effective methods to reduce vehicle costs for tour purposes. Furthermore, an optimal bus seat occupancy solution has been developed, incorporating the package system and including a tour guide. Our system offers a remedy by providing access to cost-effective packages. We have also added a blog portal to our web-based software for an overview all tourist places and their information. As a result, we have found optimized routes and provide low-cost, high-value tours. We have also reduced carbon footprint emissions. Our proposed optimal vehicle usage system has been developed using Hypertext Markup Language (HTML), Cascading Style Sheets (CSS), the Tailwind Framework, React, and Node.js.
1. Introduction
Recently, we have observed that tourism craziness is rising daily in Bangladesh, where tourists have been interested in visiting beautiful spots. However, they must learn the proper process and details for visiting these places. Thus, our main aim is to reduce travel and agency costs. When they first decide to travel elsewhere, travelers want to find good travel agencies and travel at a low cost. Similarly, travel agencies seek to maximize their profits. Our main focus is on how travel agencies have achieved their profit goals.
Numerous recent research papers [1,2] have utilized machine learning. During the tourist season, a multitude of visitors frequent tourist destinations. The academic literature on tourism has led to a more relaxed touring experience for visitors. In a previous research paper, we explored the utilization of various systems, such as group trip planning, package and blog systems, mobile tourist guides, and more, by many tourists.
The authors and developers of earlier research articles and systems [1,3] did not work for travel companies; they exclusively served the interests of travelers. However, tour agencies constitute a significant component of the tourism system, and, notably, previous literature has failed to fully consider these aspects.
We have engineered a superior system compared to previous implementations. Consider the scenario where destinations A and B share identical routes: 52 travelers travel to location A, whereas only 20 travel to location B. However, with each bus accommodating a maximum of 36 seats, it becomes evident that two buses are needed for location A, while a single bus suffices for location B. In this context, our attention turns to unoccupied bus seats. The elevated travel expenses incurred thus far underscore the necessity of deploying an optimized system. Our primary goal has been optimizing travel expenses for travel agencies and travelers, maximizing overall efficiency.
Our system incorporates novel features. Among these is the distinct ability of travel agencies to optimize their vehicle utilization, setting our system apart. Simultaneously, this optimization translates to reduced costs for travelers. This proposed method is named Static Group Trip Planning (SGTP).
Both travelers and travel agents will benefit from our outcomes. Because of this system, travelers can travel easily at a low cost, while travel agencies can earn more profit.
To optimize vehicle usage for tour purposes, we utilized a database table. This table contained information such as the number of passengers, the distance of the trip, the route, and the type of vehicle needed. Using this information, we determined the optimal vehicle for each tour and minimized the number of empty seats.
We have segmented our findings into blog, booking, and package segments. In the blog segment, we discuss the tourist spot. In the booking segment, we provide customers with information on how they can book tours. Finally, in the packaging segment, we offer tour packages. Here, we have provided these different types of packages, such as two days, three nights packages, one day, two nights packages, etc.
According to our research, improving vehicle use for tours can result in financial savings and higher client satisfaction. By utilizing a database table and segmenting our findings into blog, booking, and package segments, we have provided valuable insights and tools for tour agencies and customers alike.
The main contributions of this paper are as follows:
- We have developed a system that allows travel agencies to minimize vehicle usage.
- We have optimized the costs of providing low-cost, high-value services to travel agency customers.
- We have developed an optimization process, which can reduce the environmental carbon footprint.
- We have analyzed the graphical representation to understand quality attributes.
This paper has been organized as follows. Section 2 and Section 3 focus on related research. We note the proposed solution in Section 4. Section 5 describes the methodology of our proposed system. Section 6 includes the experimental analysis. Section 7 mentions the performance evaluation. Section 8 describes the limitations and future works of our proposed method. Finally, Section 9 describes the conclusion.
Problem Statement
Our work focuses on optimizing tourist transportation for a more efficient travel experience. Consider a scenario with three locations: A, B, and C. All passengers start their journey at location A. At location B, two buses with a seating capacity of 30 passengers each are present, while location C has three buses of the same capacity. B and C share a common route that starts from location A and then proceeds to either B or C. The challenge is developing an optimized strategy for allocating buses based on passenger numbers to each location. If location C’s buses carry 58 passengers and location B’s buses have 62 passengers, we encounter an issue. The system needs to be optimized, leading to additional buses at location A to accommodate for the demand. This inefficiency is evident when buses depart from location B and carry two empty seats.
2. Related Research
In Ref. [1], the authors have provided the concept of a “dynamic group.” Their main approach is to provide a dynamic group trip. As a result, they included two approaches: the Naive approach and the Fast approach. Finally, they selected the FAST approach for their experiments because it was shown to be more efficient. Extensive experiments and synthetic datasets showed that their approach is, on average, 99.74% faster and requires 94% less I/Os than the naive approach.
The author presents a web-based tour and trip management system in Ref. [3]. Here, they raised the issue that it is more difficult for travelers to look for additional packages, contact the helpdesk for information, and communicate with the helpdesk to make travel arrangements. Therefore, the author has developed a website where visitors can browse all products according to location. A traveler can also see a description of the location. Additionally, they offer a Google Map with the location’s distance, lodging, and travel choices.
The author of this paper has suggested group travel preparation (GTP) [2]. A group trip planning (GTP) search returns points of interest (POIs) for various establishments, including malls, eateries, and theaters. Occasionally, group members who live a long distance away from one another must determine the collection of POIs that minimizes the group’s total journey distance. The author creates approximate methods for GTP inquiries for road networks and Euclidean space in this article. They presented unique strategies to expand the POI search space for the GTP question based on the geometric features of ellipses, greatly lowering the overall mileage of trips.
In Ref. [4], the authors addressed the problem of routing a fleet of vehicles from a central depot to customers with known demand. Routes originate and terminate at the central depot and obey vehicle capacity restrictions. They assumed that all vehicles were identical. In their work, they relaxed the homogeneous fleet assumption. The objective was to determine the optimal fleet size and mix by minimizing a total cost function that includes fixed and variable cost components. They also described several efficient heuristic solution procedures and techniques for generating a lower bound and underestimating the optimal solution. Finally, they have presented some encouraging computational results and suggestions for further study.
The authors of [5] found that a significant issue for the shared use of autonomous vehicles is how to project serving routes efficiently. From another perspective, this issue could be understood as segmenting the maximum number of passengers into groups. Therefore, in their paper, the authors intended to investigate passengers’ similarities instead of directly matching autonomous vehicles and passengers. They aim to determine the minimum number of groups and assign each group autonomous vehicles. Thus, they proposed a cluster-based algorithm to classify passengers. The researchers conducted numerical experiments with both small and large demands to demonstrate the validity of the proposed algorithm. Furthermore, they showed that the cluster-based algorithm could minimize the number of vehicles and total travel distance. Finally, they showed that vehicle capacity had little impact when the number of seats exceeds four, and time windows could continuously influence gathering passengers using a sensitivity analysis of critical parameters.
In Ref. [6], the authors discovered that mobile tourist guides assist travelers in choosing places to visit. Thus, the attraction of mobile tourist guides was considered. In this paper, collaborative travel recommendation systems were extended by utilizing filtering techniques to save information such as the current user’s location, time, weather conditions, and places the user has already visited. They also worked on context-aware ratings from the wireless sensor network.
Tourism is a government priority because it is potentially the largest contributor to the gross domestic product, so the government’s management of the tourism sector needs improvement [7]. Travel agencies handle tour and traveler registration, booking, payment, trip packaging, cancellation, etc. This is a common issue in many processing and recording errors. Thus, in this paper, the authors want to solve this problem by using the waterfall approach to build the information system. They utilized UML for design, employed PHP as a programming language, and employed SQL to connect servers, establish databases, and store data.
In Ref. [8], the authors proposed that the internet has achieved tremendous time and financial savings through “e-commerce”, which includes travel services, among which ticket bookings and hotel reservations. The Tours and Travels System is a web-based application project that allows users to manage multiple booking types from a single application.
We have found some web-based software among GitHub projects, Facebook pages, and the Play Store [9,10,11]. The web-based software used in Ref. [9] provides tour packages, booking systems, blogs, and descriptions of many tourist places in Bangladesh and abroad. It also provides a special service for visas and passports. Furthermore, the web portal used in [10] offers information about ticket prices, available transportation, and an online booking option for all bus travelers. This facility has been introduced in Bangladesh. Online ticket booking is only one part of the web portal’s service; the front-office e-ticketing operations and the back-office accounting systems of transportation companies have also been automated. The web-based software in Ref. [11] provides bus, train, and launch tickets. Users are able to discover hundreds of operators and routes in just a few minutes, compare prices, and enjoy the best deals and safeguards.
In Refs. [12,13], the developer proposed a Facebook-page-based project. In Ref. [12], according to the page’s admin, users had different reasons for traveling, including adventure, leisure, budget, discoveries, and moving on. The page claims that “whether one needs inspiration, information, planning advice, or just plain escapism, ‘Travelers of Bangladesh’ is there to help”. The group’s main objectives are as follows: low-cost travel and profitable tours [13]. Their goal is to empower people with the courage and intelligence to travel independently, while competing with only a few groups in the market. They claim that any individual can experience the joys of travel (on the roof of a bus, on the deck of a ship, on the roof of a chariot, or sitting on the ground). Many people occasionally experience life as boring; they attempt to break this monotony by providing users with a tour, telling them something, and keeping them amused (within limits), all the while saving them money by providing inexpensive tours.
In Ref. [14], a mobile application is proposed: Bus Ticket BD, which is a free Android application. In this mobile application [14], the authors have provided several bus transport services. When someone wants to go on vacation, this one-of-a-kind application includes some of the most important features: finding terminals, online travel agencies, schedules, preferred seats, and arrival and departure locations, which can normally take time and effort. They can even contact them using their cell numbers.
Ref. [15] described a new framework for preserving user privacy in location-based services when conducting group nearest neighbor (GNN) queries. GNN queries involve finding a meeting place that minimizes the aggregate distance from a group of users. The proposed framework uses a decentralized architecture and has users provide their locations as regions instead of exact points to a location service provider (LSP) to protect their privacy. The LSP produces a set of candidate answers, which includes the genuine GNN. They also developed a private filter to ascertain the actual GNN while ensuring that user locations remain undisclosed to all parties, including the LSP. They also proposed an efficient algorithm for evaluating GNN queries involving imprecise locations. They demonstrated the effectiveness of the proposed technique through an extensive experimental study.
Ref. [16] discusses a new type of query in Spatial Databases called the Trip Planning Query (TPQ). TPQ retrieves the best trip that starts at a given starting point, passes through at least one point from each category of points of interest in space, and ends at a given destination. The paper presents fast approximation algorithms for TPQ in a metric space, addressing the difficulty of the query due to the multiple choices per category. The approximation algorithms have varying ratios that depend on the number of types, the maximum number of points per category, or both, and all of them run in polynomial time. The paper introduces efficient heuristics for managing large datasets stored in external memory, utilizing several proposed algorithms. The paper introduces efficient heuristics for managing large datasets stored in external memory, utilizing several proposed algorithms.
Ref. [17] presents a novel spatial–social optimization problem, Optimal Group Route, for multi-user itinerary planning in location-based applications. The problem formulation lets users specify individual sources, destinations, preferences on Point-of-Interest (POI) categories, and distance constraints. The goal is to find an itinerary that can be traversed by all users while maximizing the group’s preference of POI categories in the itinerary, considering the agreement and disagreement among group members. The article proposes two efficient greedy algorithms with bounded approximation ratios, an exact solution that computes the optimal itinerary by exploring a limited number of paths in the road network, and a scaled approximation algorithm to speed up the dynamic programming employed by the exact solution. The researchers assess the proposed solutions using two real-world road network/POI datasets, and the results confirm their effectiveness and efficiency. The article contributes to advancing existing group trip planning studies by maximizing the group’s social experience.
Ref. [18] proposed a new type of trip planning query, called Subgroup Trip Planning (SGTP) query, which allows a group to identify the subgroup and points of interest (POIs) from each required type (e.g., restaurant, shopping center, and movie theater) that have the minimum aggregate trip distance for any subgroup size. The authors highlighted that the computation of POI sets for all possible subgroups using group trip planning (GTP) algorithms is relatively inexpensive. Therefore, the authors proposed an algorithm to compute answers for different subgroup sizes concurrently with less query processing overhead. The authors focused on minimizing the subgroup’s total and maximum trip distance. The researchers assessed the proposed algorithms using both real and synthetic datasets, and the experiments demonstrated their efficiency.
In Ref. [19], the authors discussed the growth of location-based social networks and the emergence of a new query type called group trip planning (GTP) query. GTP query involves a group of individuals trying to minimize the total travel distance for all members when planning a trip to different locations, such as a restaurant and a movie theater. The passage also notes the development of efficient algorithms for addressing GTP queries, which the researchers tested through extensive experiments.
In Ref. [20], the authors discussed how they integrated social networks and spatial road networks to form a spatial–social network, offering potential applications such as trip recommendations. The paper focused on a new query type called group planning query over spatial–social networks (GP-SSN), which retrieves a group of friends with common interests on social networks and spatially close points of interest (POIs) on spatial road networks that match the group’s preferences and have the smallest traveling distances. The paper proposes effective pruning methods and indexing mechanisms to facilitate the GP-SSN query processing and develops efficient GP-SSN query answering algorithms. The researchers evaluated the proposed approaches through extensive experiments.
Ref. [21] introduced a new type of trip planning query called subgroup trip planning (SGTP) query, which enables a group to identify the subgroup and the points of interest (POIs) from each required type that have the minimum aggregate trip distance for any subgroup size. The paper proposes an algorithm to compute answers for different subgroup sizes concurrently, which reduces the query processing overhead. The algorithm aims to minimize the subgroup’s total and maximum trip distance. The researchers demonstrated the algorithm’s efficiency through experiments using real and synthetic datasets.
In Ref. [22], the authors discuss the importance of the tourism sector in many countries, including Bangladesh, as a vital sector contributing to the gross domestic product and employment creation. The paper observes the overall situation of strategic management of the tourism sector and its contribution to the economy. The authors suggest that by improving the efficiency and effectiveness of tourism services and providing better facilities, local and foreign tourists will be encouraged to travel for different reasons. They argue that a holistic approach, through public and private sector partnerships and strategic leadership, can create new opportunities, strengthen capacity building, and minimize weaknesses and threats. Overall, the paper emphasizes the potential for the tourism sector to contribute to the country’s gross domestic product (GDP).
To the best of our knowledge, all the mentioned studies consider as a basic assumption that there has yet to be anyone that focuses on the optimization process of vehicles for reducing costs from the perspective of travel agencies. The author of Dynamic Group Trip planning queries in spatial databases [1] mainly focused on a dynamic group trip for a group that changes dynamically over the duration of a trip, where members can leave or join the group at any point of interest. In [3], the authors worked on offering packages for different trips, descriptions of places, merging categories of places, and providing Google Maps. Finally, in Ref. [3], the difficulty of multiple choices per category of places is addressed.
Research Gap
In Table 1, we have shown all gap analyses of related research.

Table 1.
Comparative analysis of similar applications.
3. Related Works
According to Table 2, we have found that different types of websites, mobile apps, and Facebook pages offer a variety of features, including tour packages, booking systems, blogs, descriptions, solo trips, and optimal vehicle usage. Amazing Tour BD should include a tour package and blog, and we have added them to our system. The common feature is the booking system and description used in all approaches, but we have only used the booking system in ours. Furthermore, only Bangladeshi travelers are provided with the solo trip. As a final feature, we have utilized vehicles in the most efficient manner possible; this feature was missing in all other systems.
Table 2.
Comparative analysis of related works.
4. Proposed Solution
We suggested several approaches to address the issues above. Initially, we aim to tackle them by designing a web application. Through our web application, both travelers and tour agencies can effortlessly discover cost-effective yet valuable services. Subsequently, we introduced a set of algorithms designed to resolve the remaining issues in our study. We have developed a matrix that provides an optimization solution, effectively addressing this aspect.
5. Methodology
We envisioned a system designed to address the travel-related concerns of individuals. Sometimes, travelers need help identifying suitable destinations or budget-friendly tour packages, leading to financial constraints. Our system offers a remedy by providing access to cost-effective packages. Users gain insights into package particulars and booking procedures upon selecting the package option, facilitating a streamlined reservation process. Furthermore, the system offers a repository of blogs highlighting tourist attractions. Concurrently, travel agencies stand to enhance their profits by leveraging vehicle optimization. An optimization button has been integrated into our admin page to facilitate this. This button taps into our backend database, which aids in the optimization process. Thus, at the administrator’s command, the optimization button triggers the vehicle optimization process. Figure 1 Here, we design a client–server communication diagram for visualization [23].
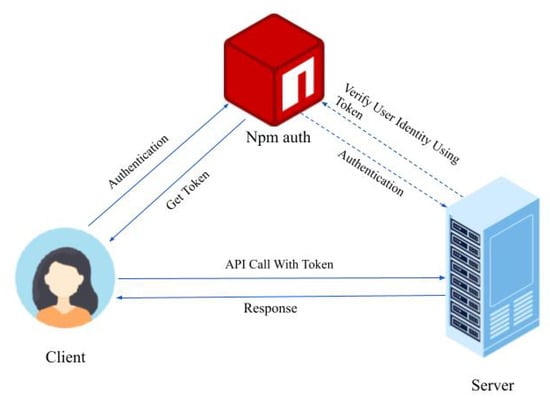
Figure 1.
Client–server communication.
5.1. Database Model
Figure 2 illustrates the backend database design in our system, highlighting the vital interaction between the K city package and the database table. When K city initiates a request, it includes crucial package details and passenger information, starting the bus allocation optimization process. The database processes this request, providing K city’s knowledge and data on two other potential packages for bus optimization. The optimization component (OP) also uses a “like search query” to find similar routes, and the database responds with matching packages. This interaction streamlines bus allocation and route optimization within our system.
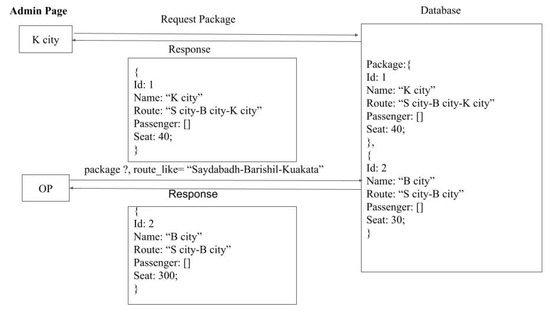
Figure 2.
Back-end database table design.
Algorithm 1 shows the pseudo-code for single package data. This code initializes two arrays: “K city” and “closeout”, which contain objects. It then filters the “closest route” array and assigns the result to a new collection called “ReleventRoute”.
| Algorithm 1 Pseudo-code for seat optimization |
| single package data |
| const K city = [ {} ] |
| const closeRoute = [ {} ] |
| const ReleventRoute = closest route.filter () |
| (ReleventRoute.Passengers.length > ReleventRoute.Seat) |
| (ReleventRoute.Passengers.map(P)= >) |
| (!P.group) |
| K.passenger.push(p)) |
| break |
The code then checks if the number of passengers in the “ReleventRoute” array exceeds the available seats. If this condition is true, it proceeds to iterate through each passenger in the “Passengers” array and checks if they belong to a group. If a passenger does not belong to a group, it adds the passenger to the “K city” array and breaks out of the loop.
In summary, this code filters a “closest route” array to find a relevant route, and then checks for enough available seats to accommodate all the passengers. If there are not enough seats, it adds individual passengers who are not part of a group to the “K city” array.
Another problem arises, i.e., the distance mapping problem. We have used Dijkstra’s and Bellman—Ford’s algorithms to solve this problem.
Dijkstra’s algorithm is commonly used to find the shortest path in a graph. In this case, we need to modify the algorithm slightly to find the closest route in the RC to route I using the distance function d(i, j) (Algorithms 2–4).
Step 1: Initialize
Create a set of unvisited nodes U and set it to contain all the routes in RC. Create a map of distances dist, where dist[i] represents the distance from route i to the starting route. Set dist[i] = infinity for all routes i, except the starting route, where dist[starting route] = 0. Create a map of previous nodes prev, where prev[i] represents the previous route on the shortest path from the starting route to route i.
Step 2: While U is not empty
Find the route u in U with the smallest distance dist[u].
Remove u from U.
Step 3: For each neighboring route vs. u
| Algorithm 2 Pseudo-code for tentative distance from the starting route to v |
| distance _ through _ u = dist[u] + d(u, v) |
| (distance _ through _ u < dist[v]) |
| Update dist[v] = distance _ through _ u |
| Update prev[v] = u |
| Return prev |
We can also use the Bellman–Ford algorithm. Below, we describe a standard implementation of the Bellman–Ford algorithm for finding the closest route in RC to route i using the distance function d(i, j).
Step 1: Initialize
Create a list of distances dist, where dist[i] represents the distance from route i to the starting route. Set dist[i] = infinity for all routes i except the starting route, where dist[starting _ route] = 0. Create a list of previous nodes prev, where prev[i] represents the previous route on the shortest path from the starting route to route i.
Step 2: Repeat the following steps for RC -1 times
For each route u in RC.
For each neighboring route vs. u.
| Algorithm 3 Pseudo-code for distance from the starting route vs. u |
| distance _ through _ u = dist[u] + d(u, v) |
| (distance _ through _ u < dist[v]) |
| Update dist[v] = distance _ through _ u |
| Update prev[v] = u |
Step 3: Check for negative-weight cycles
Repeat the following steps for each route u in RC.
For each neighboring route vs. u.
| Algorithm 4 Pseudo-code for the distance from the starting route vs. u |
| distance _ through _ u = dist[u] + d(u, v) |
| (distance _ through _ u < dist[v]) |
| Report the presence of a negative-weight cycle |
| Return prev |
5.2. Mathematical Model
We have defined several variables to represent different aspects of the transportation system (Table 3).
Table 3.
Symbol and notation.
Firstly, SK represents the total number of seats available in the city buses operating in K city. In K city, this variable enables us to determine the maximum number of passengers buses can accommodate at any given time, helping us understand their capacity. Secondly, SC represents the total number of seats available in the city buses operating in B city. Similar to SK, this variable provides us with information about the seating capacity of the buses in B city. This variable lets us determine the maximum number of passengers buses can transport in B city, helping us gauge their ability.
PC represents the passenger list for the destination in B city. This variable contains the details of the passengers who intend to travel to B city. It may include passenger names, contact details, and specific travel requirements. By referencing the passenger list, transportation authorities can efficiently manage passenger bookings and ensure a smooth travel experience for everyone.
Next, PK represents the passenger list for the destination in K city. Similar to PC, this variable comprises the details of passengers planning to travel to K city. It assists in organizing and coordinating passenger information for a seamless journey.
Then, RK represents the route list for the destination in K city. This variable encompasses the various routes available within K city, along with specific information, such as bus stops, schedules, and distances. The route list is crucial for bus operators and passengers alike, as it provides essential guidance and aids in planning the most efficient and convenient travel routes within K city.
RC represents the route list for the destination in B city. This variable contains information about the available routes within B city, including bus stops, schedules, and distances. It helps both bus operators and passengers in planning the most efficient and convenient travel routes within B city.
Lastly, d(i, j) represents the distance between route I in K city and route j in B city. This variable quantitatively measures the distance between specific routes in K and B cities. It allows transportation authorities to assess and compare the distances between different routes, aiding in decision-making processes related to route planning and optimization.
Then, the algorithm can be represented as follows:
- For each route i in :
- (a)
- Find the closest route j in to route i using .
- (b)
- If vacant seats are in K city buses, search for potential passengers in destination B city.
- (c)
- If potential passengers are found:
- Check the passenger list for the total number of passengers.
- If the total number of passengers exceeds the total number of vacant seats in K city buses, add the passengers to the K city passenger list .
- Otherwise, do nothing.
- Return the updated passenger list .
This mathematical model outlines the steps in searching for potential passengers in B city destinations to fill vacant seats in K city buses. In B city destination, we use the distance between routes to find the closest route, and we check the passenger list to ensure that the number of passengers is at most the number of vacant seats in K buses.
5.3. Matrix Representation
A matrix is a structured arrangement that consists of rows, columns, and individual elements. The size or dimensions of a matrix are determined by the number of rows and columns it possesses. We want to represent a matrix for optimization purposes [24,25]:
D is a matrix of distances between all routes in K city and B city, where D(i, j) represents the distance between route I in K and route i in B city. The size of D is RK × RC:
PC is a row vector representing the passenger list in B city destination, where PC(j) represents the number of potential passengers on route j in B. The size of the PC is 1 × RC:
PK is a row vector representing the passenger list in K city destination, where PK(i) represents the number of passengers on route I in K. The size of PK is 1 × RK:
SK is a scalar representing the number of vacant seats in K city buses.
Now, let us go through the algorithm steps using the given matrices:
Step 1: Find the closest route in B city to each route in K city using the distances in D:
For Route 1 in K city: Closest route in B city is Route 3 (D(1,:) = [10, 20, 30], closest distance is 30).
For Route 2 in K city: Closest route in B city is Route 3 (D(2,:) = [15, 25, 35], closest distance is 35).
For Route 3 in K city: Closest route in B city is Route 1 (D(3,:) = [12, 22, 32], closest distance is 12).
Thus, j* = [3, 3, 1].
Step 2: Check if there are vacant seats in K city buses (SK > 0):
Assuming SK = 4 (4 vacant seats).
Step 3: Search for potential passengers in B city destination:
For Route 1 in K city: PC(3) = 2 (potential passengers on Route 3 in B city).
For Route 2 in K city: PC(3) = 2 (potential passengers on Route 3 in B city).
For Route 3 in K city: PC(1) = 5 (potential passengers on Route 1 in B city).
Step 4: Check the passenger list PC for the total number of passengers (sum(PC) > 0):
sum(PC) = 2 + 2 + 5 = 9.
Step 5: If the total number of passengers is greater than the total number of vacant seats in K city buses, then add the passengers to the K passenger list PK:
Since sum(PC) = 9 > SK = 4, we add passengers to PK.
Step 6: Update the passenger list PK:
For Route 1 in K city: PK(1) += PC(3) = 2 + 2 = 4.
For Route 2 in K city: PK(2) += PC(3) = 1 + 2 = 3.
For Route 3 in K city: PK(3) += PC(1) = 3 + 5 = 8.
Step 7: Update the passenger list PC:
For Route 1 in K city: PC(3) −= SK = 2 − 4 = −2 (assuming negative values represent no passengers).
For Route 2 in K city: PC(3) −= SK = 2 − 4 = −2.
For Route 3 in K city: PC(1) −= SK = 5 − 4 = 1.
The updated matrices would be:
6. Experimental Analysis
We conduct the experiments and execute HTML, CSS, the Tailwind Framework, React, and Node.js in different software to successfully run our website. By using this language, we design our front-end and back-end design. This website includes package options for tourists, blogs, booking options, etc. For the purpose of our experiment, we set an optimization option on our website. Here, we show the final result of our website.
Result
In this section, we show some UI designs of our website. Here, we find both the user page and the admin page Table 4. First, we will describe the user page of the UI design in a tabular form. Then, we will show the admin page as a picture.
Table 4.
Tabular form of the user page.
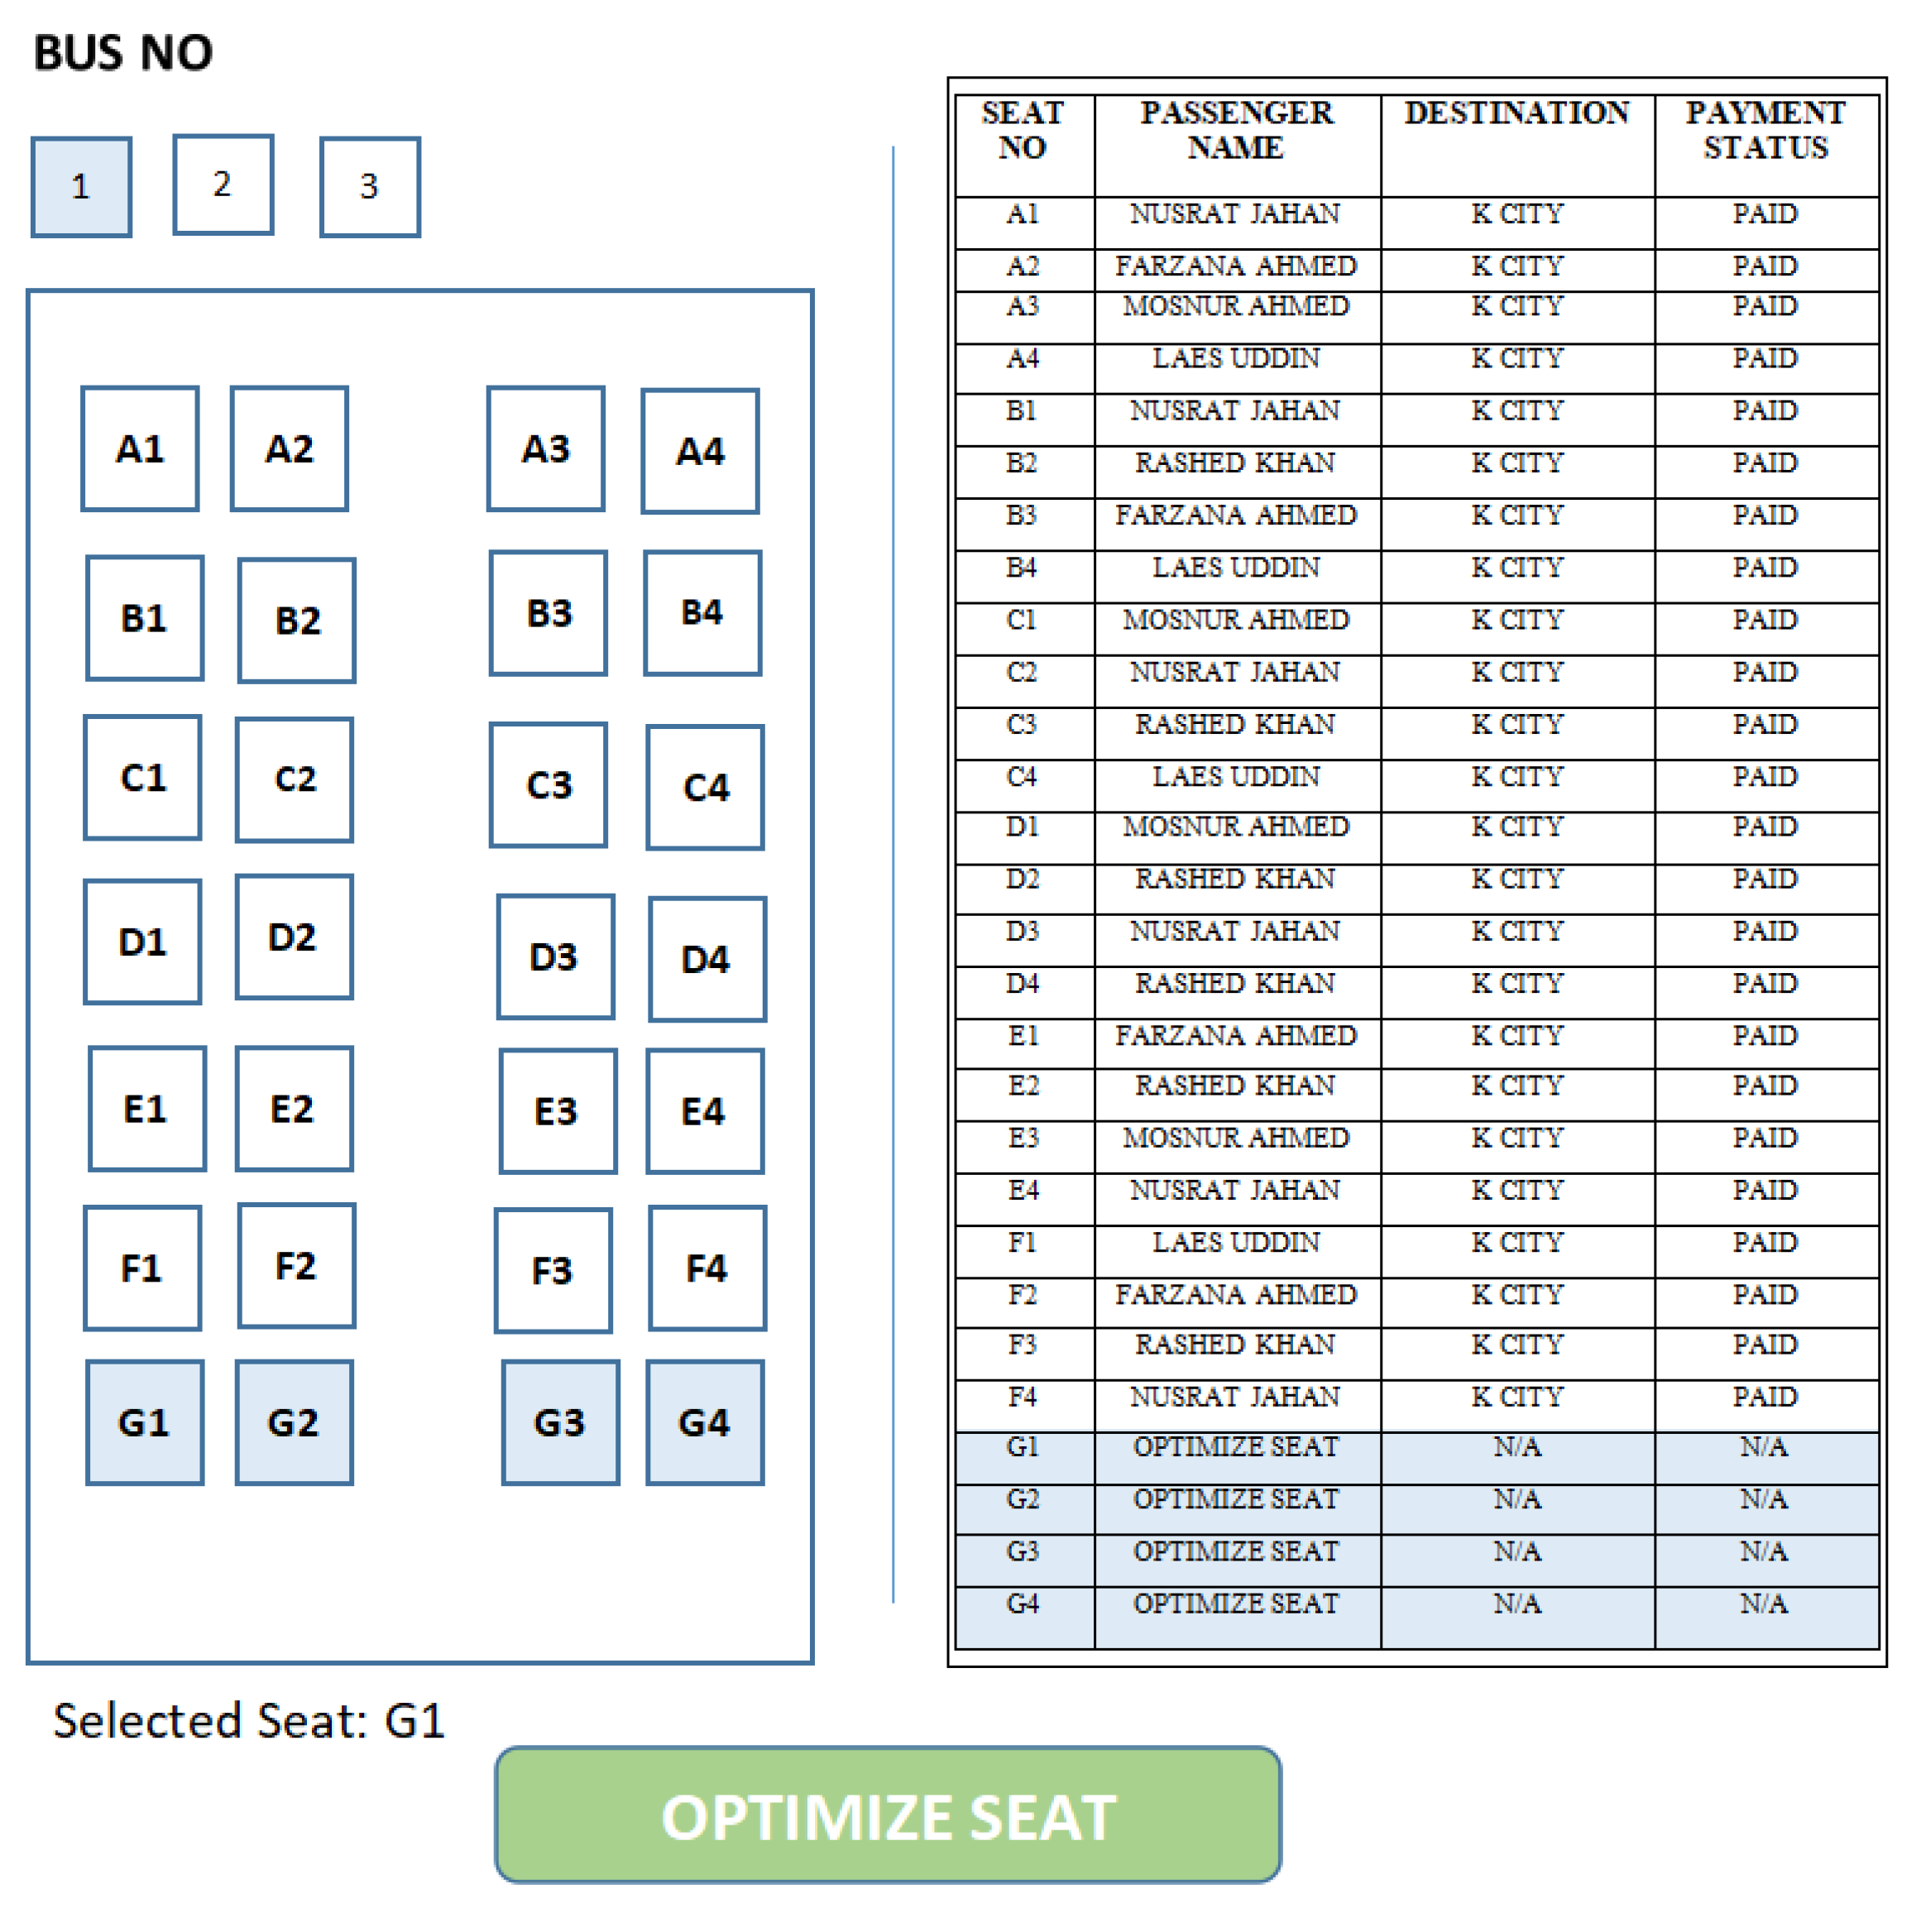
Using this interface, the admin can optimize the bus for every city. Moreover, here, we mention the seat number, tourist list with their destination, and payment status. The admin can also see the navigation bar, search option, and notification option on this page (Figure 3).
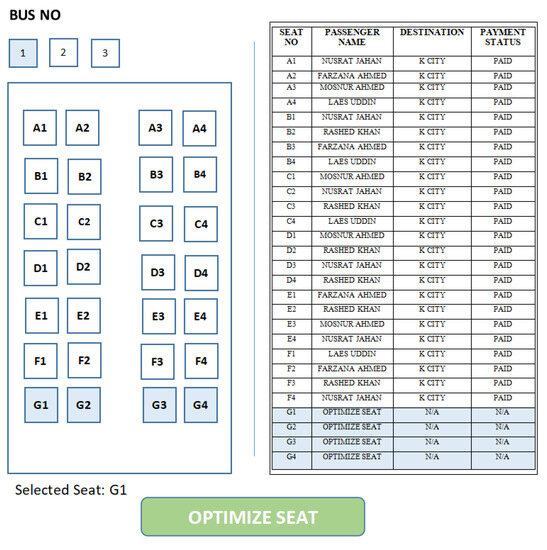
Figure 3.
Admin Page.
7. Performance Evaluation
The methodology section discusses the database and mathematical models with a matrix. We have implemented our project in these two ways, but we have decided on an efficient approach for the final work. A database model is an efficient approach from our side.
A database model is efficient for our project because it allows for the organization, storage, and retrieval of large amounts of data related to the project, which can be difficult to manage with a mathematical model alone.
A mathematical model may be useful for analyzing and optimizing specific aspects of the project, such as the routing or scheduling of vehicles. However, a mathematical model relies on limited input data, assumptions, and simplifications to make predictions and recommendations. This can make it challenging to incorporate all relevant factors and real-world complexities affecting vehicle usage for tour purposes, such as traffic patterns, weather conditions, and customer preferences.
On the other hand, a database model can store and integrate a wide range of data sources and variables related to the project, including customer profiles, vehicle capacities, and availability. This can enable a more comprehensive and accurate analysis of vehicle usage factors and generate custom reports and insights based on specific user queries. In addition, a database model can allow for greater flexibility and scalability in managing and updating project data over time. New data sources and variables can be added as needed, and data can be easily modified or deleted as circumstances change.
Overall, while a mathematical model can be useful for analyzing specific aspects of the project, a database model provides a more comprehensive and flexible approach to managing and analyzing the data needed for this project.
In this section, we write down the performance evaluation of our project in tabular format (Table 5) and also show the graphical representation of quality attributes.
Table 5.
Tabular form of the performance evaluation.
Pothik is a high-performance website optimized for fast loading times and a smooth user experience. The website uses the React and Redux frameworks and the RTK Query library to build its structure. The design minimizes server requests, ensuring a high-performance user experience. The core feature of the website is its seat optimization functionality, and the website is easy to navigate and user friendly. Overall, Pothik is a great example of a well-optimized website that provides a great user experience.
Graphical Representation of Quality Attributes
In this section, we have analyzed the quality attributes of our whole work with the help of a graphical representation. These quality attribute characteristics help decide whether the program fits the needs and requirements of the stakeholder users. The major attributes are that we have selected performance, availability, usability, maintainability, security, testability, energy efficiency, renewable, adaptability, correctness, configurability, and scalability.
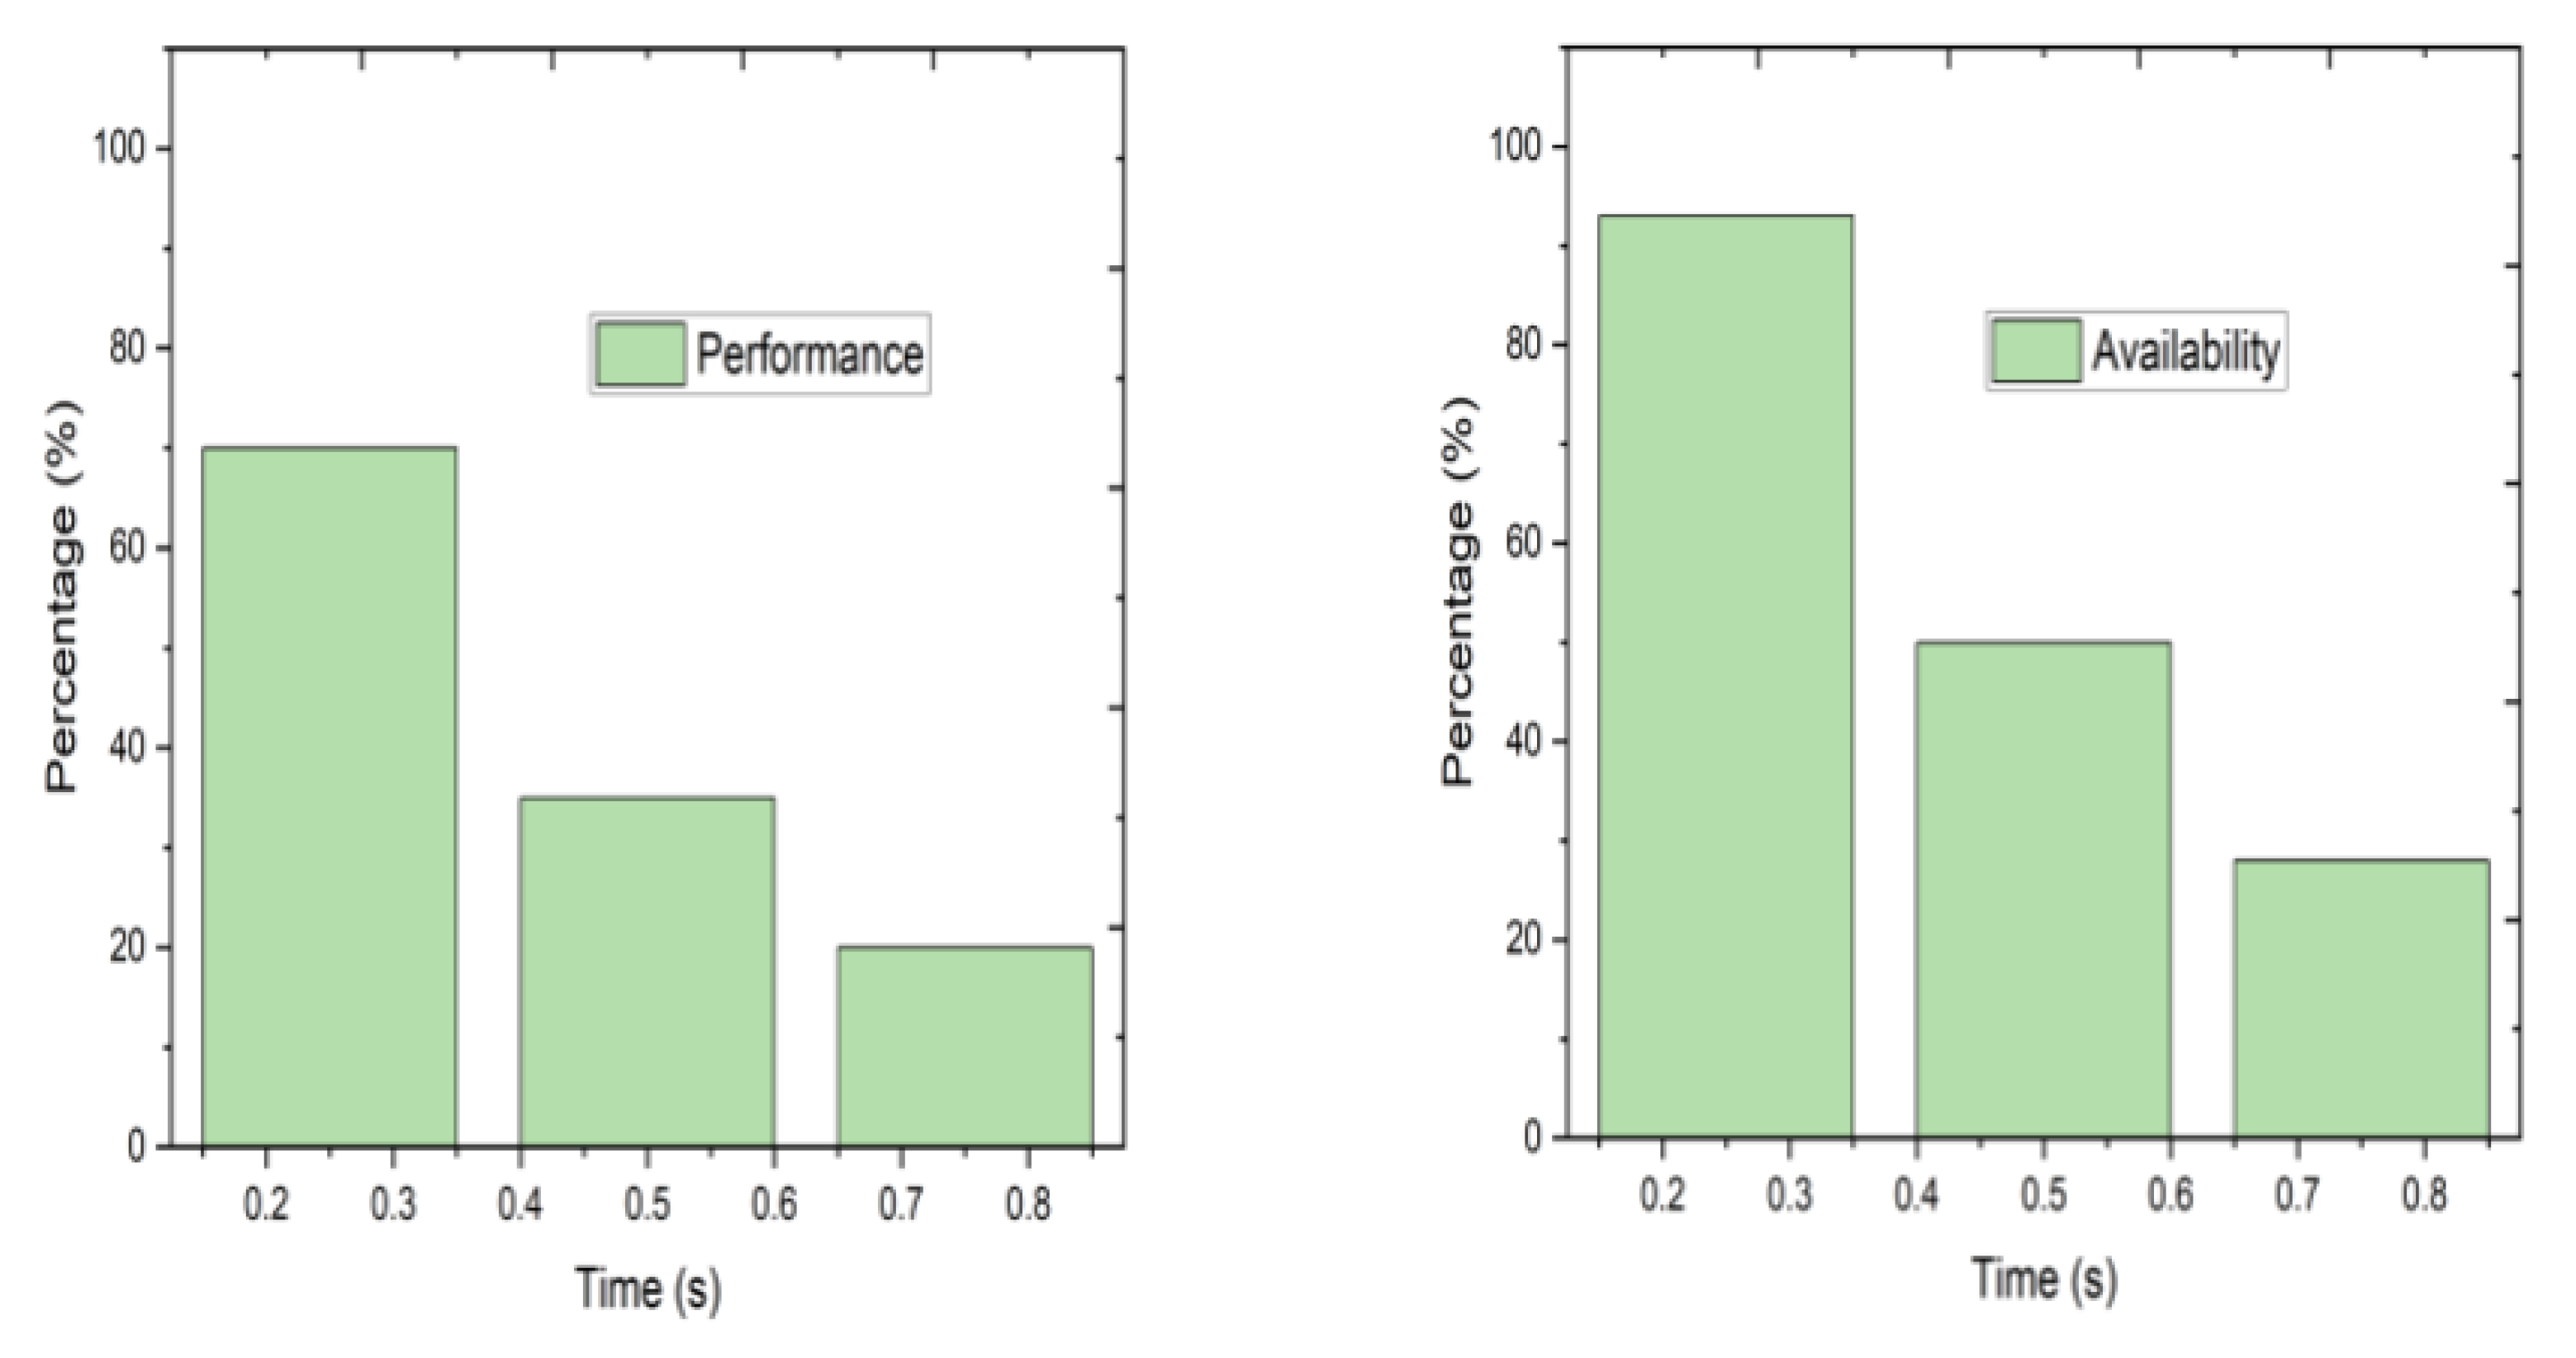
In Figure 4, performance and availability ensure that the software product performance is relative to the number of resources applied under predefined conditions, and availability refers to the degree to which a software system is accessed by the users when needed. In the following graph, we mention our system’s performance and availability. Here, we can see that the commission is 70% at 0.25 s, 35% at 0.50 s, and 20% at approximately 0.75 s. Besides, the availability is 92% at 0.25 s, 50% at 0.50 s, and 25% at around 0.75 s.

Figure 4.
Graphical representation of quality attributes between “performance” and “availability”.
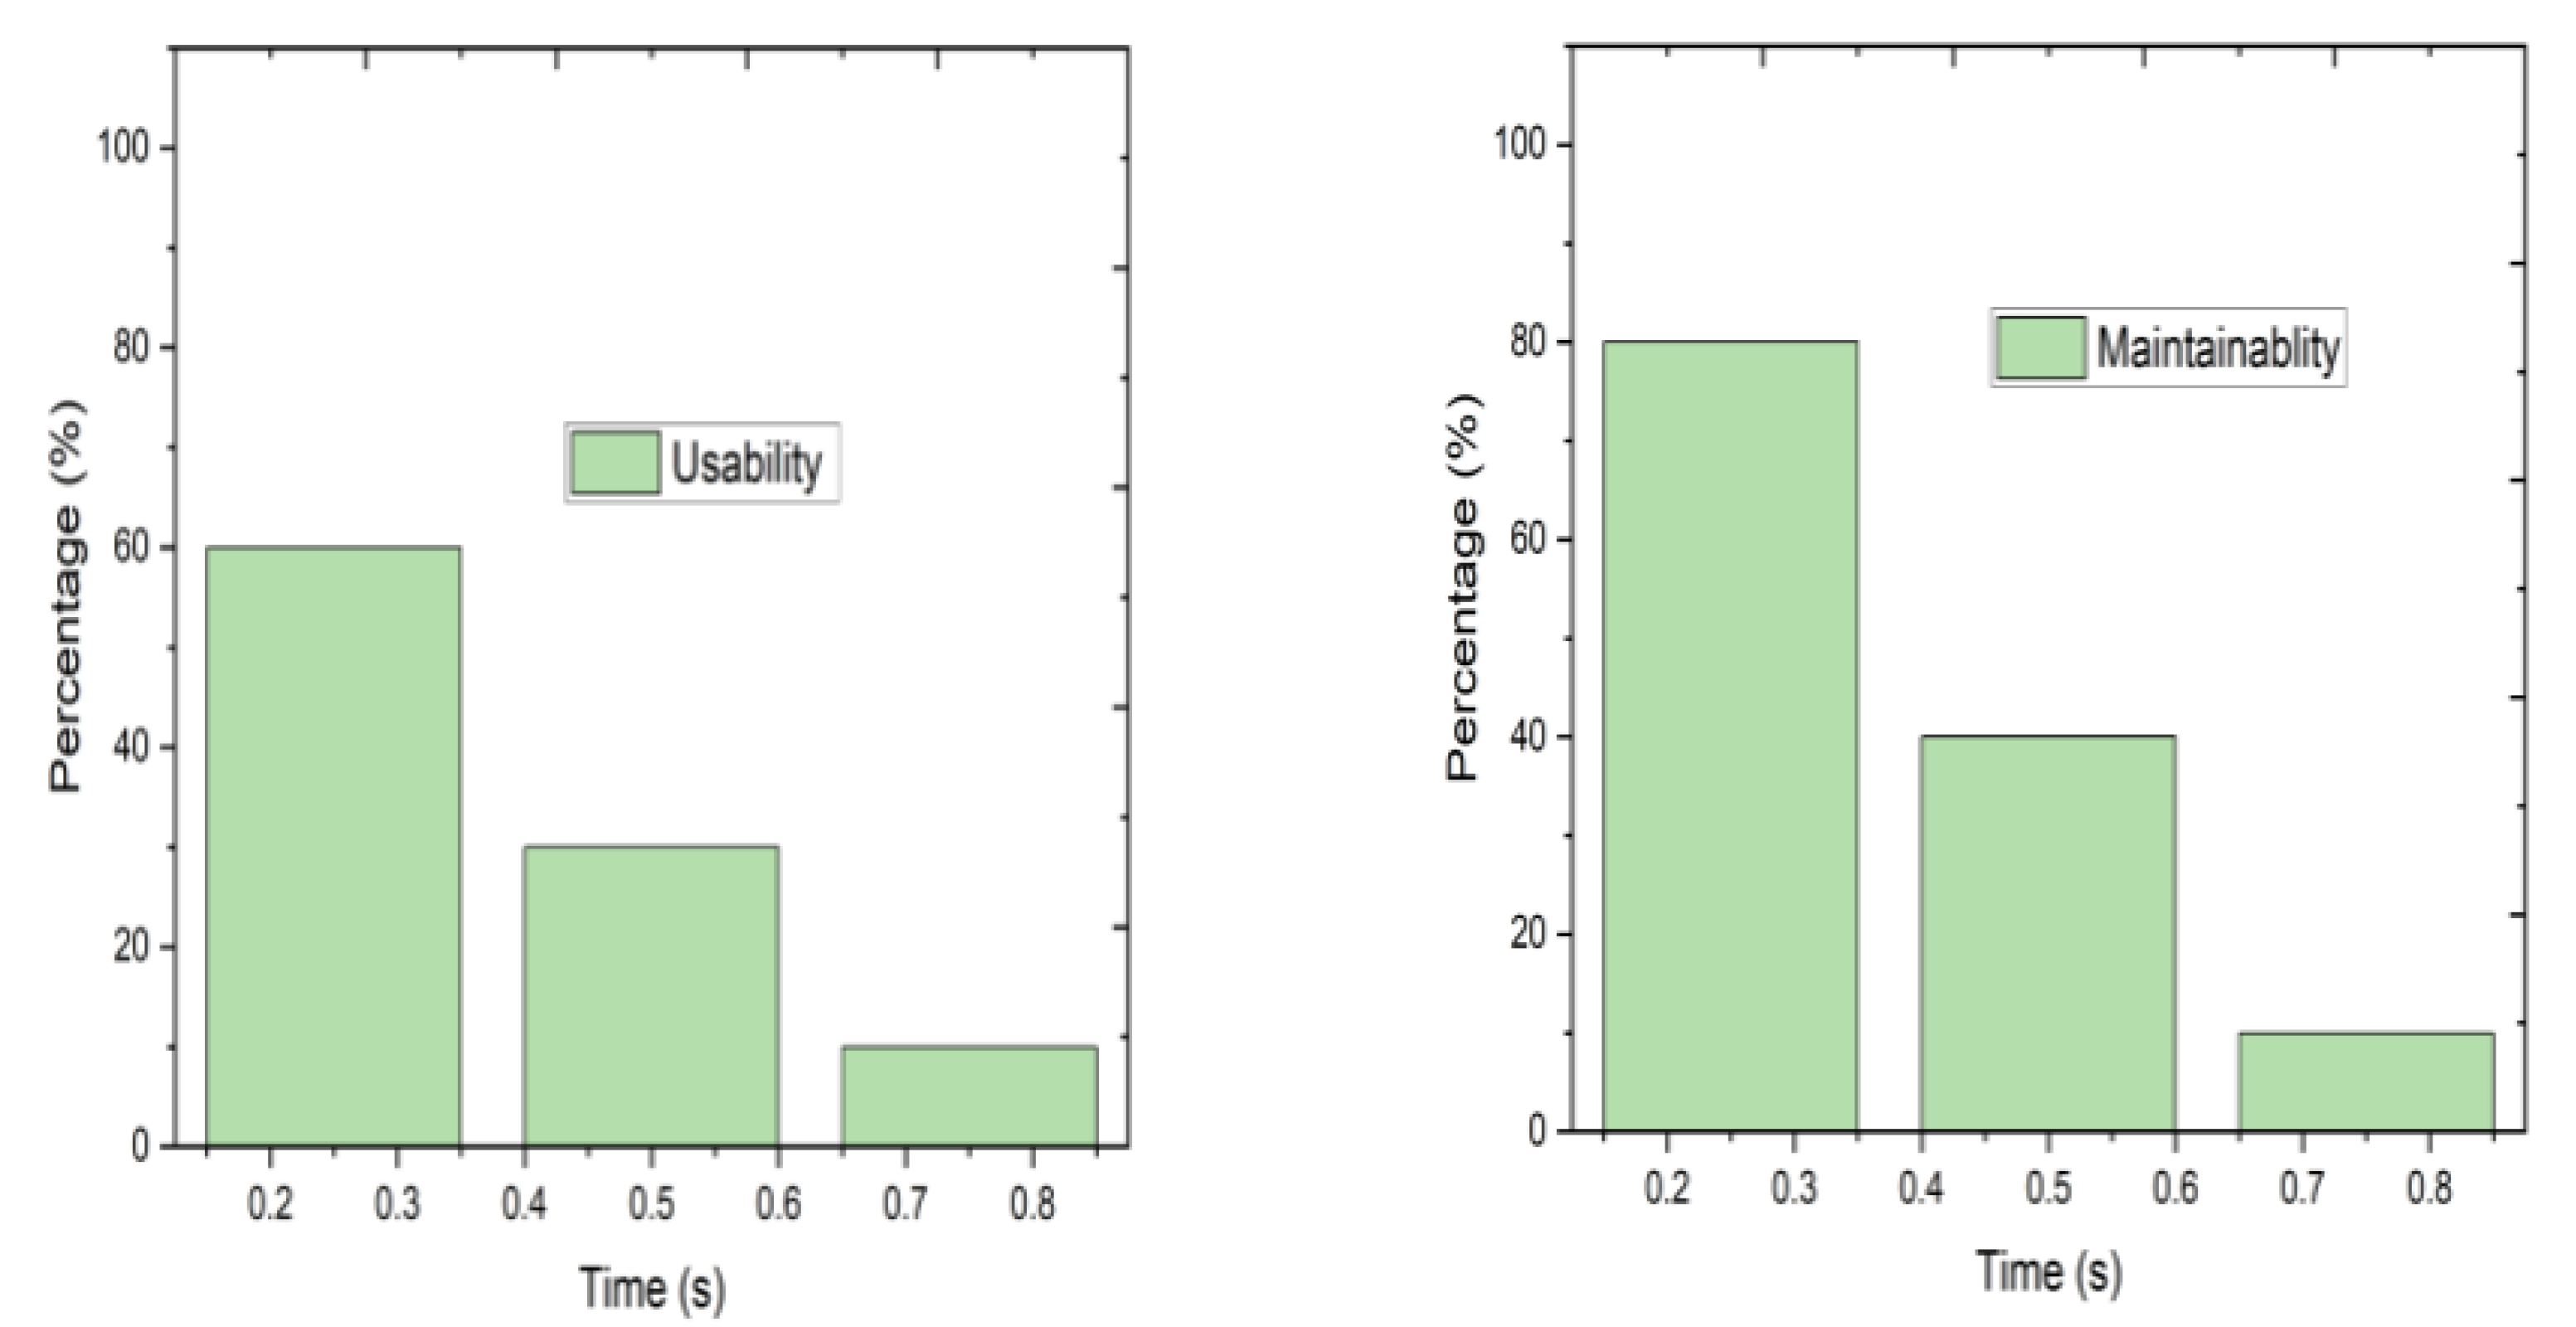
In Figure 5, Other major quality attributes are usability and maintainability, which we mention in the second graph. Usability is measured in terms of ease of use. This application is easy to learn and its maintainability helps to maintain the product easily with less time, makes products easy to develop, and allows to upgrade new features and technologies from time to time. Based on the information provided, usability appears to have a score of 60% at around 0.25 s, 30% at around 0.50 s, and 10% at around 0.75 s. Similarly, maintainability scores are 80% at around 0.25 s, 40% at around 0.50 s, and 10% at around 0.75 s.

Figure 5.
Graphical representation of quality attributes between “usability” and “maintainability”.
In Figure 6, testability and security are emphasized. We have achieved security and testability in lowest possible time. Based on the given data, testability achieved a score of 90% at approximately 0.25 s, 50% at around 0.50 s, and 30% at around 0.75 s. Additionally, the data suggest that security attained a score of 80% at about 0.25 s, 40% at about 0.50 s, and 25% at approximately 0.75 s.
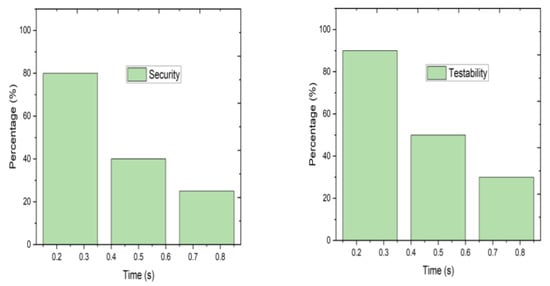
Figure 6.
Graphical representation of quality attributes between “security” and “testability”.
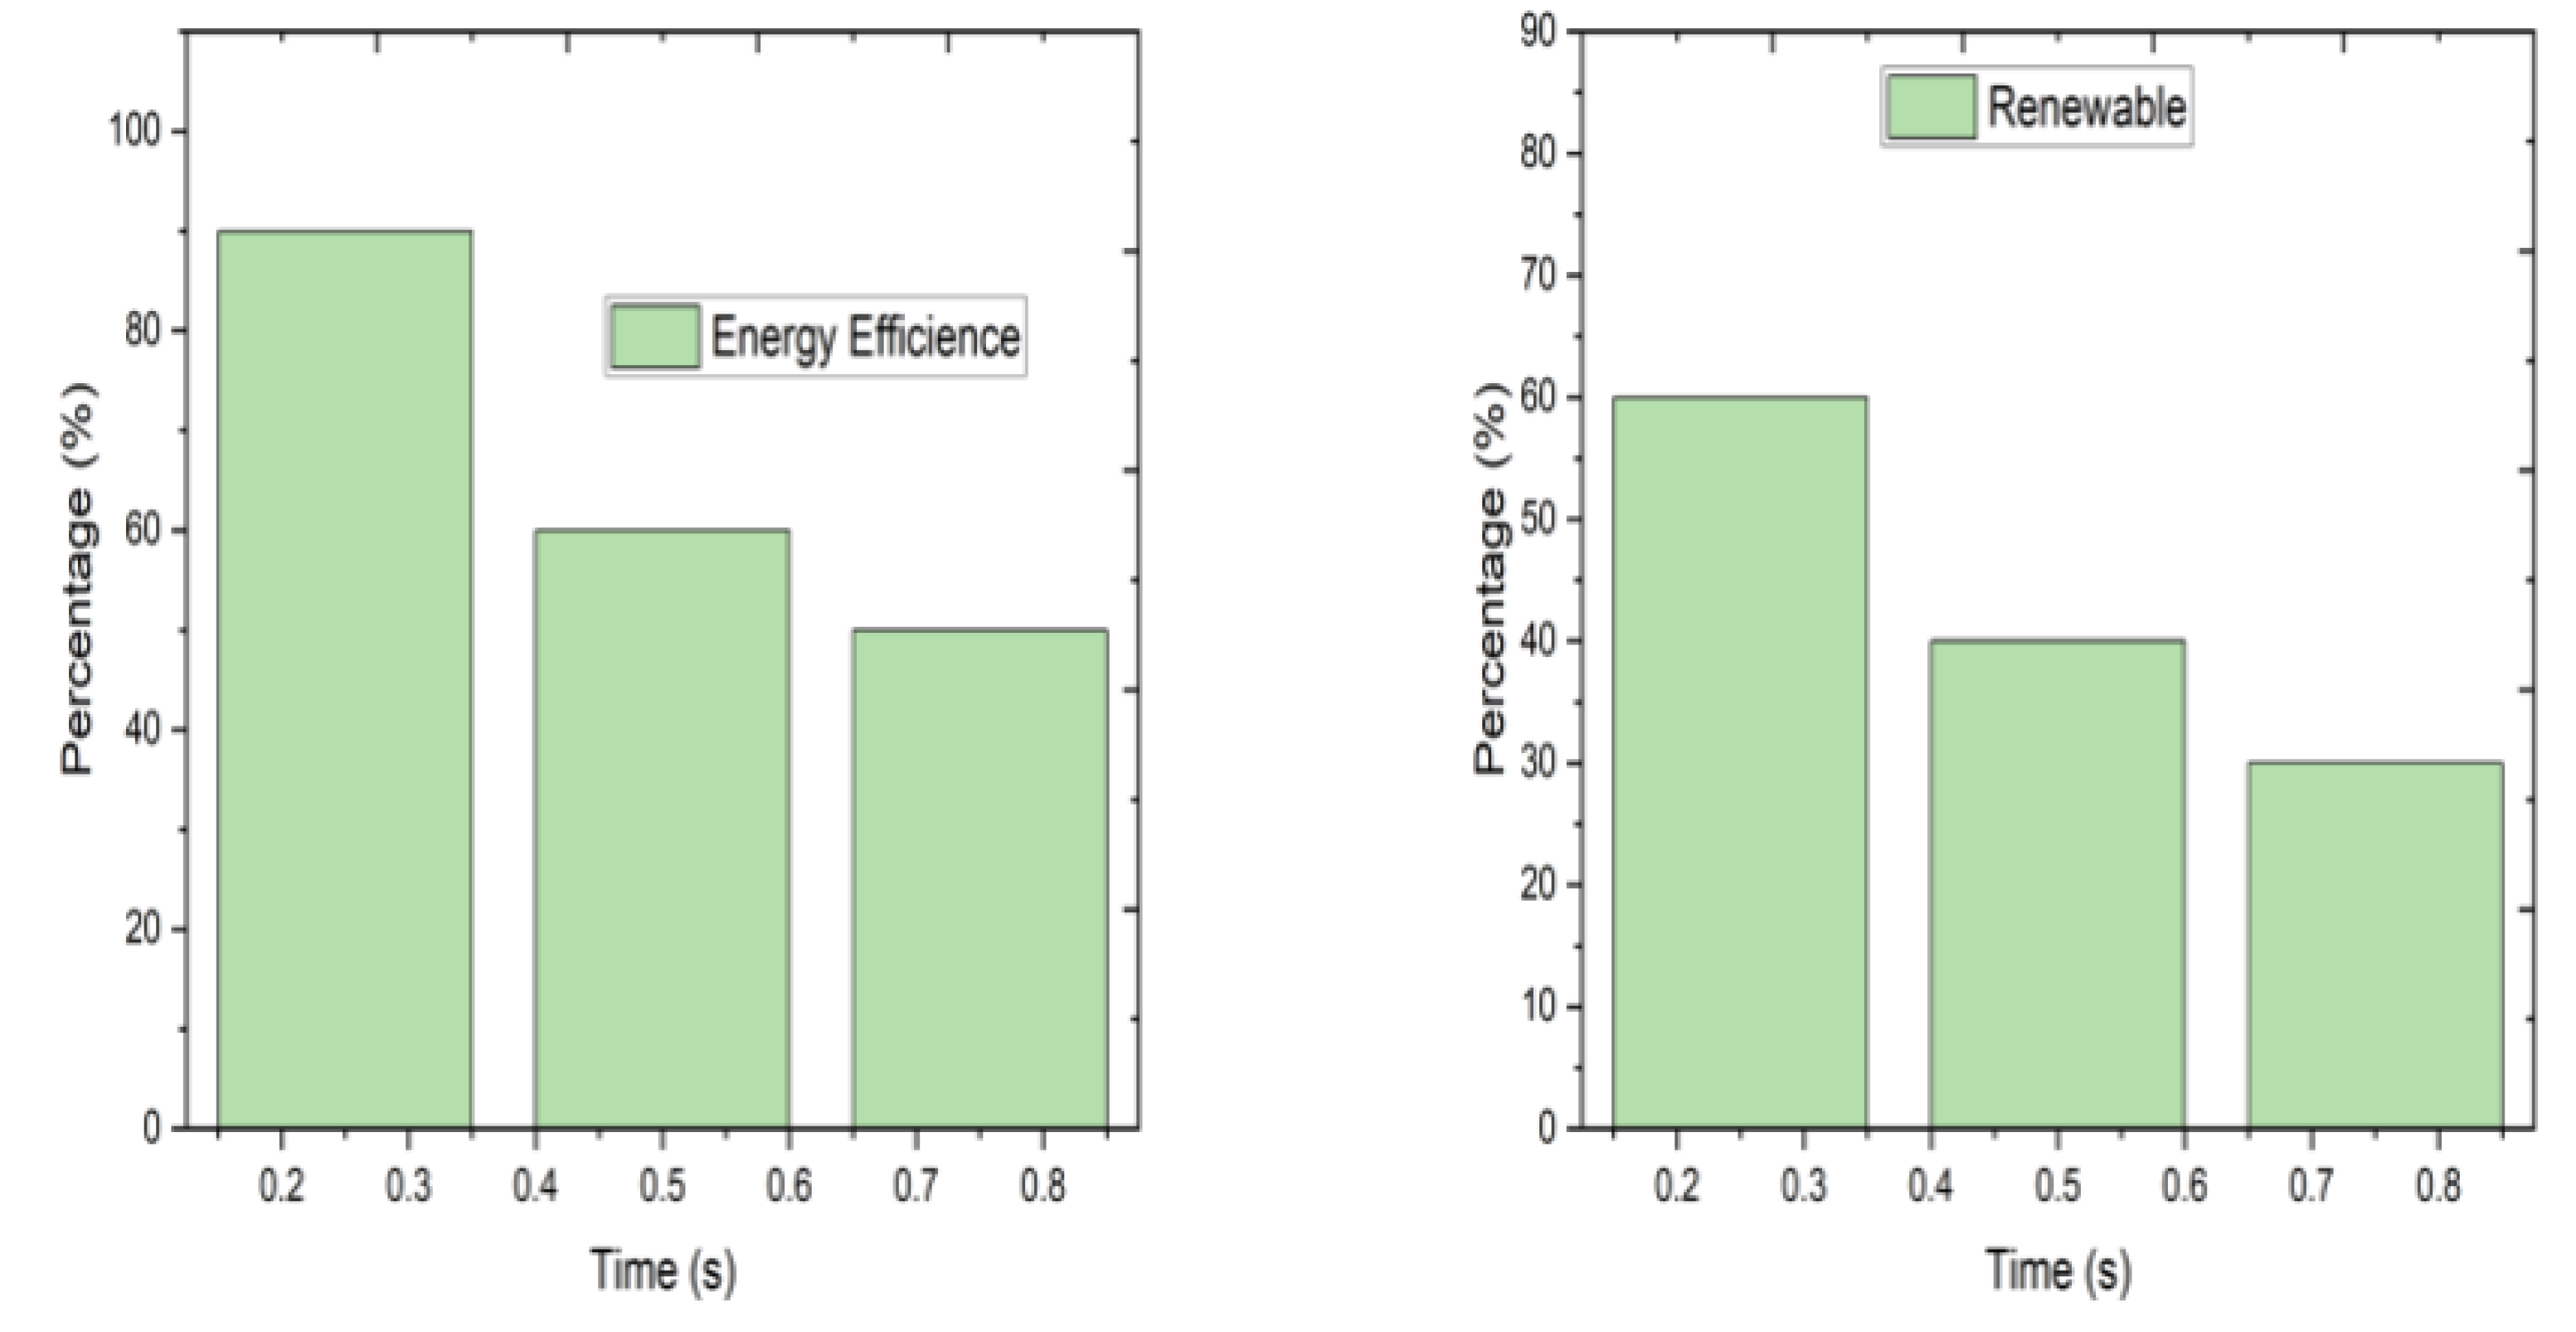
In Figure 7, we mention energy efficiency and renewable quality attributes. Energy efficiency and renewable energy are critical factors for vehicle optimization software, as they can help improve fuel efficiency and reduce emissions. These show us how much impact our project has on the environment. We also try to achieve the quality attributes very early on. Based on the provided data, the energy efficiency metric achieved a score of 90% at approximately 0.25 s, 60% at around 0.50 s, and 50% at around 0.75 s. Likewise, the data suggest that the metric of renewable energy attained a score of 60% at approximately 0.25 s, 40% at around 0.50 s, and 30% at around 0.75 s.
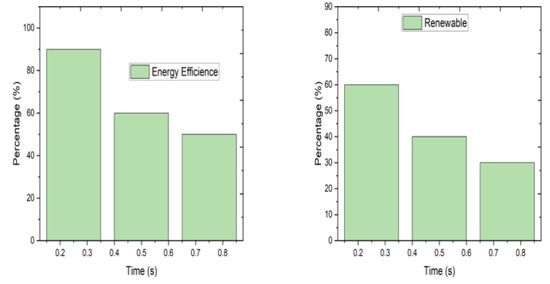
Figure 7.
Graphical representation of quality attributes between “Energy Efficiency” and “Renewable”.
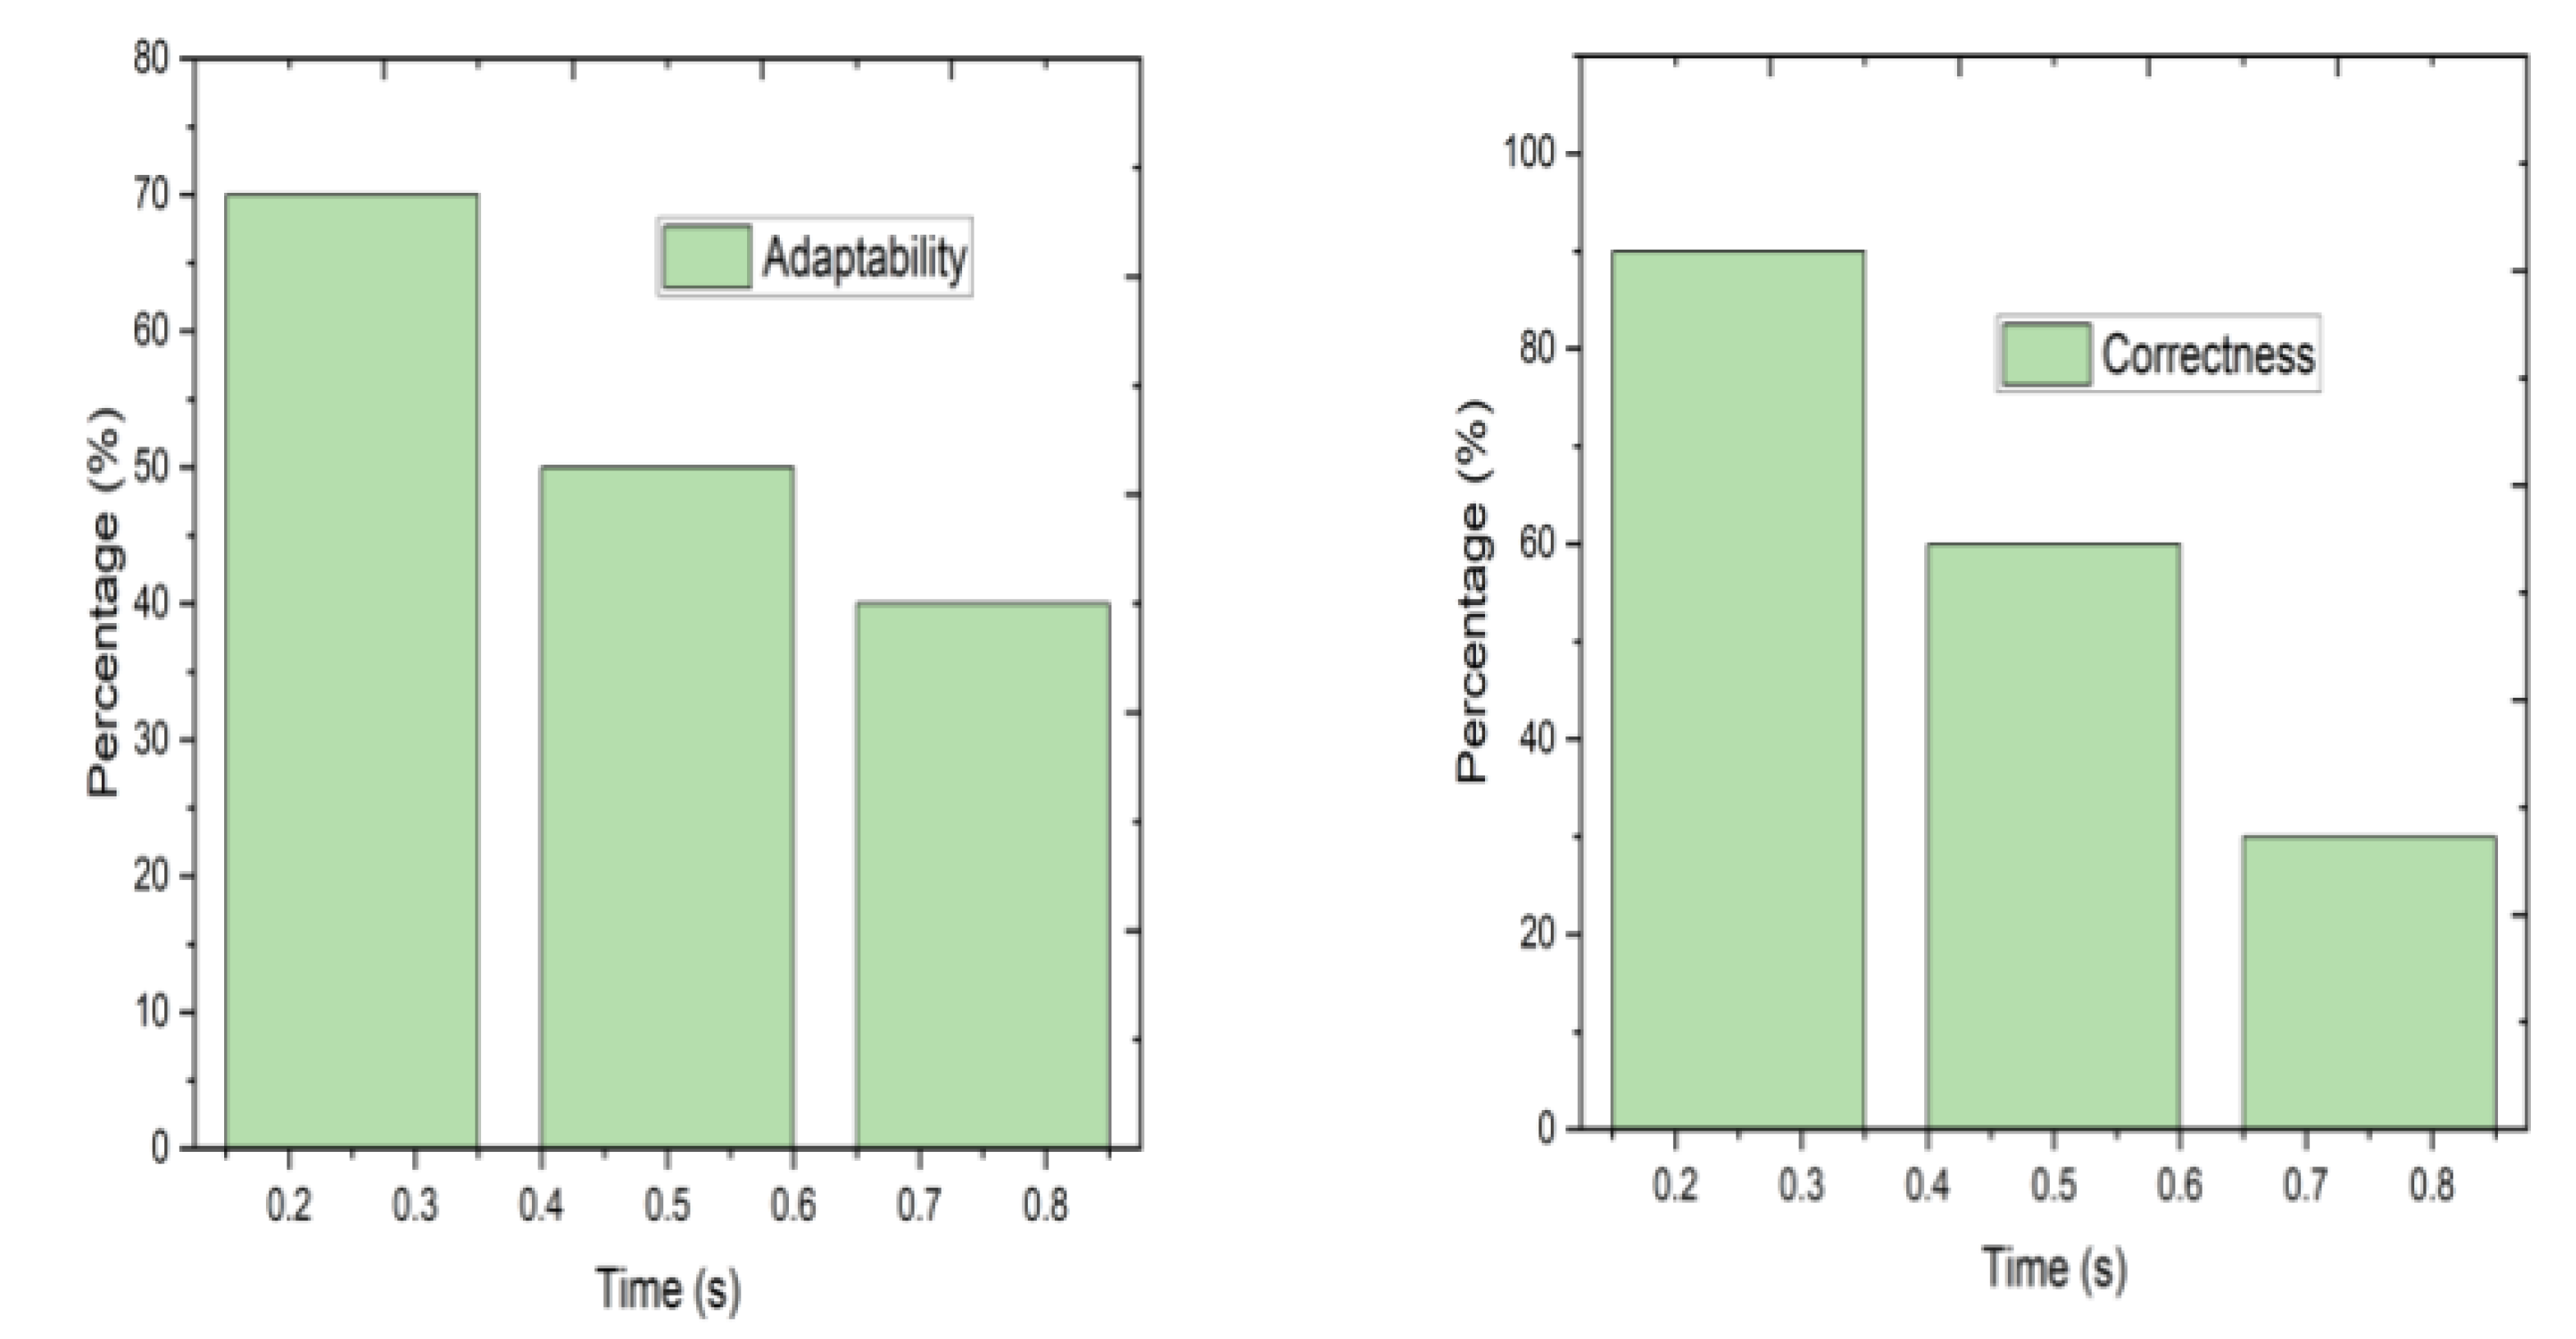
In Figure 8, adaptability refers to the ability of software to change or adapt to new circumstances or requirements. On the other hand, correctness refers to the ability of software to produce correct and accurate results. We want to achieve these in a short time. The metric of adaptability obtained a score of 70% at approximately 0.25 s, 50% at around 0.50 s, and 40% at around 0.75 s. Additionally, the data suggest that correctness achieved a score of 90% at approximately 0.25 s, 60% at around 0.50 s, and 30% at around 0.75 s.

Figure 8.
Graphical representation of quality attributes between “adaptability” and “correctness”.
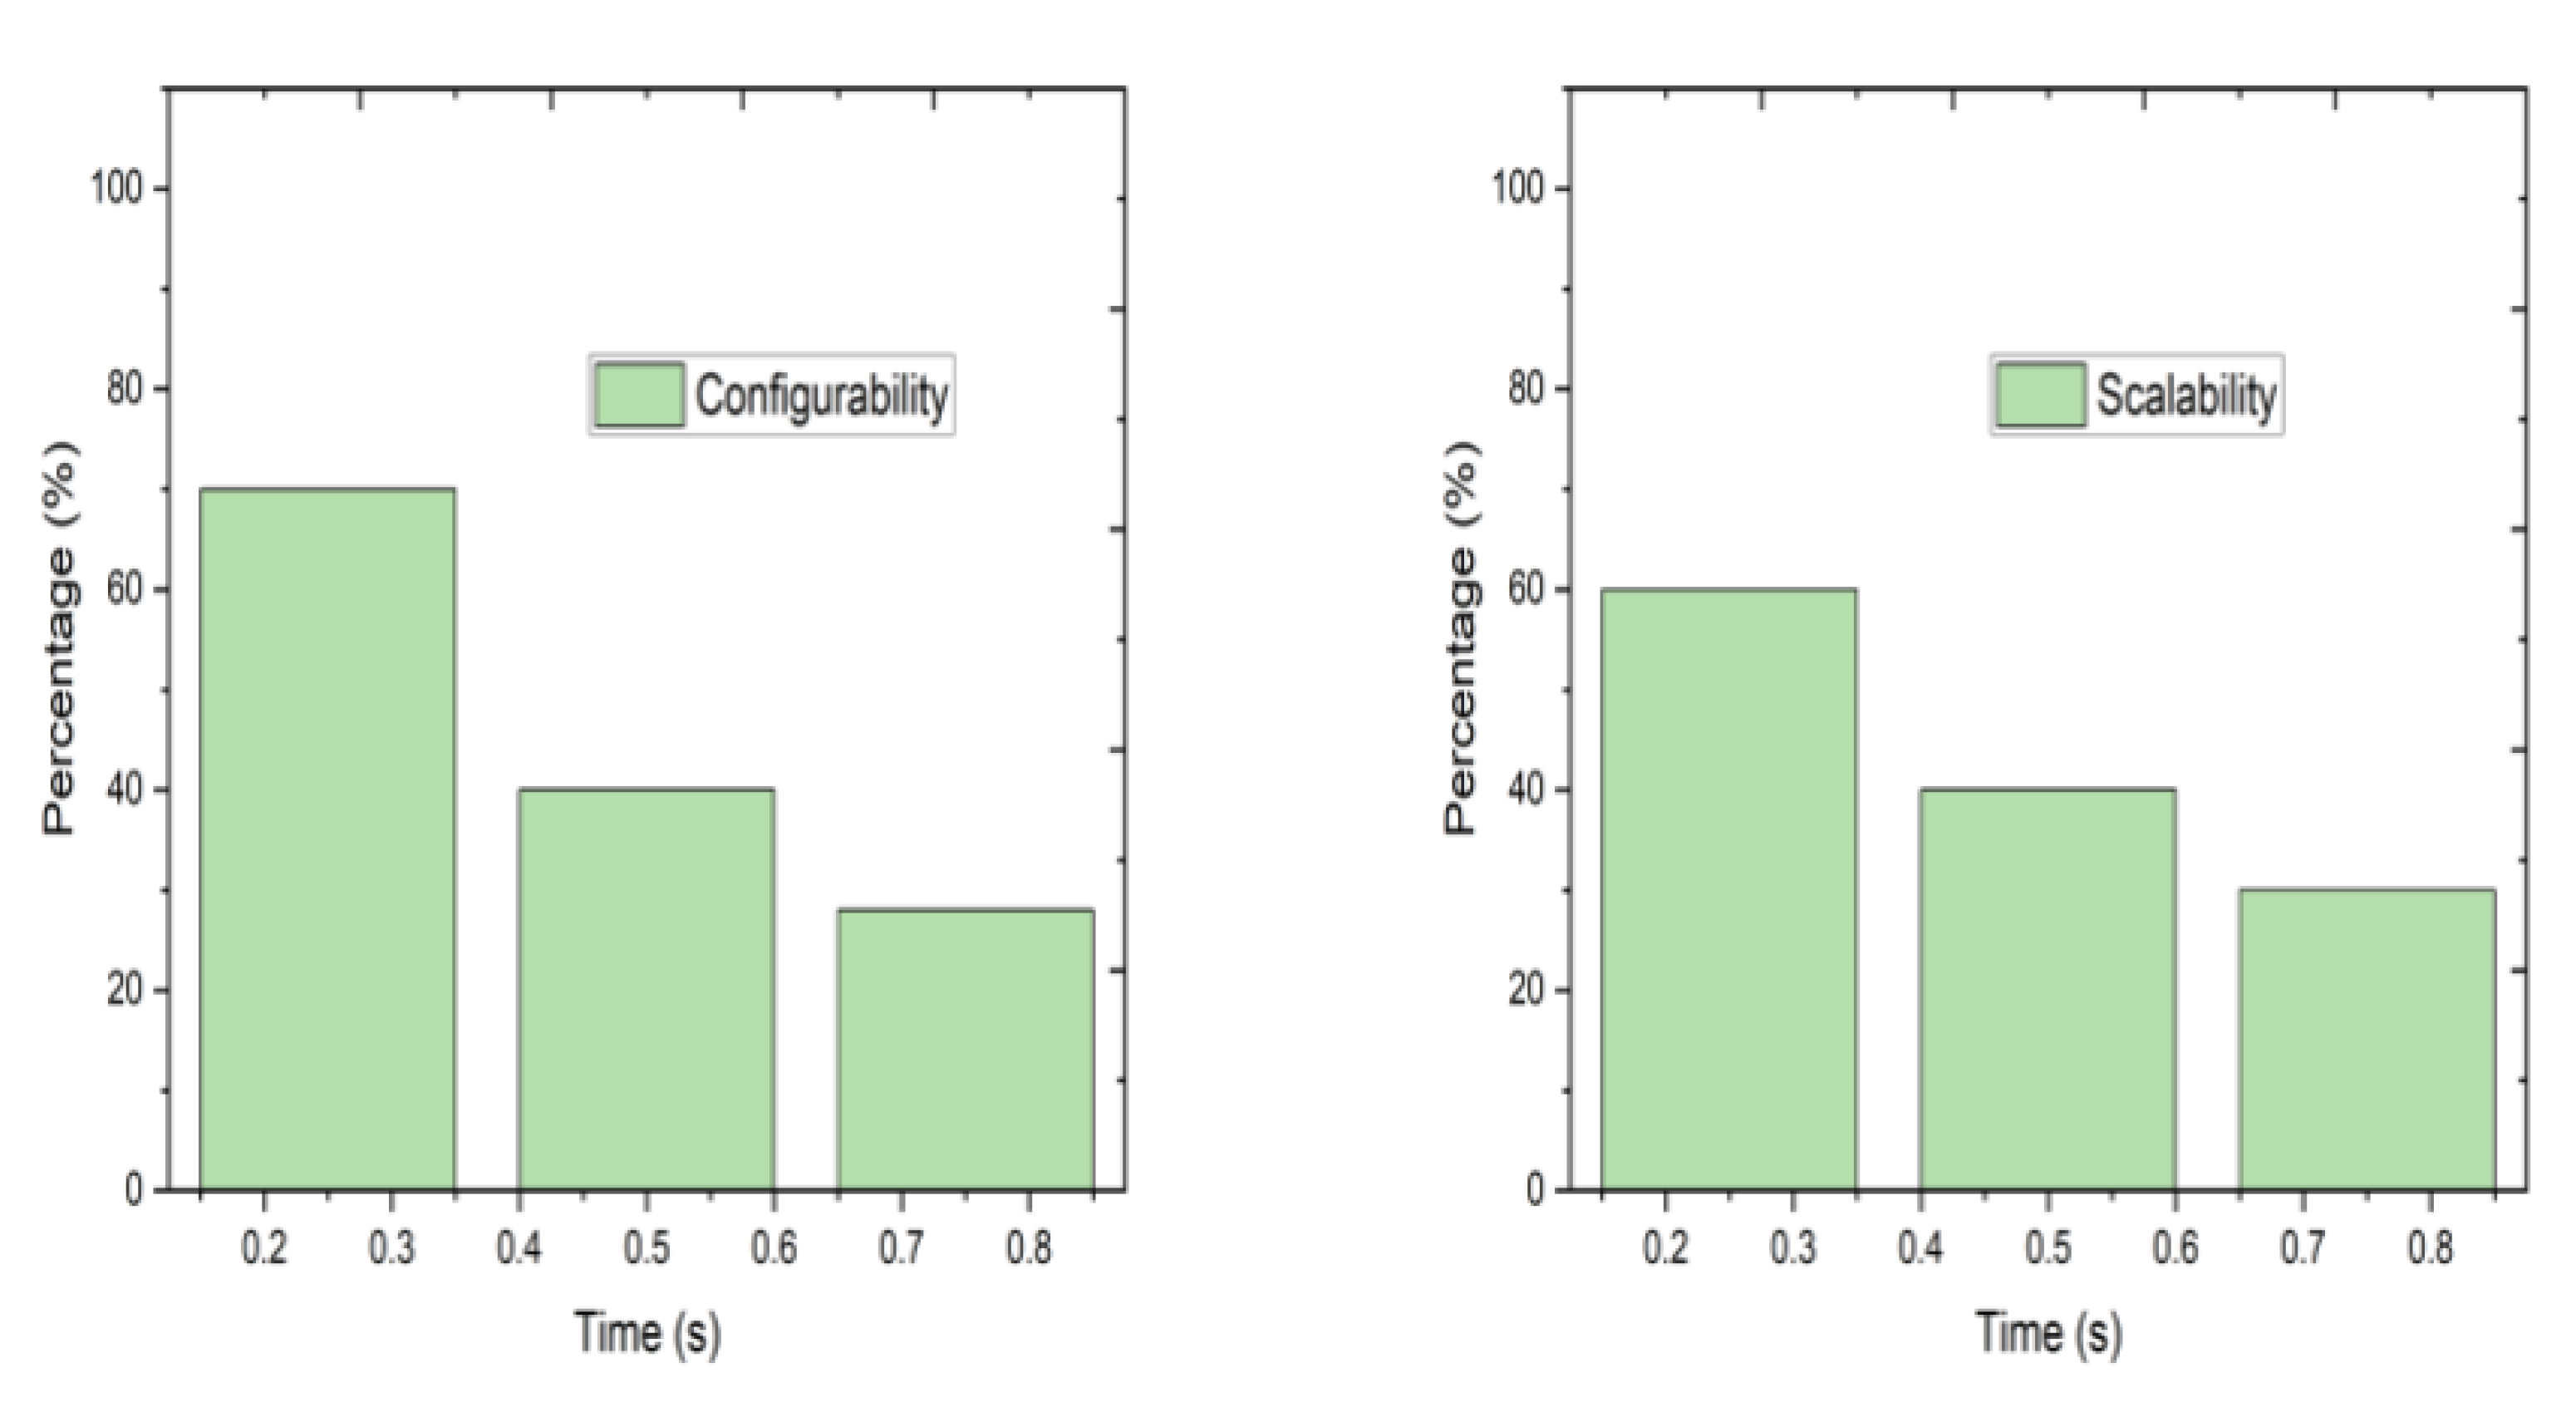
In Figure 9, configurability refers to the ability of software to be customized and configured to meet specific needs or preferences. On the other hand, scalability refers to the ability of software to handle increasing workloads or user demands without sacrificing performance or functionality. The reconfigurability metric obtained a score of 70% at around 0.25 s, 40% at around 0.50 s, and 25% at around 0.75 s. Moreover, the data indicate that the scalability metric obtained a score of 60% at approximately 0.25 seconds, 40% at around 0.50 s, and 30% at around 0.75 s.

Figure 9.
Graphical representation of quality attributes between “configurability” and “scalability”.
8. Limitations and Future Works
In this work, our main contribution is to introduce a plan that helps minimize vehicle costs by optimizing bus seat allocation. However, there is still room for improvement. By increasing the vehicle optimization and seat optimization in our system, passengers cannot choose the seats they want. Moreover, transferring the total number of group members from one bus to another would require more work in our system. Consequently, our system cannot track bus locations, and packages cannot be optimized.
9. Conclusions
The significance of a flawless travel agency cannot be overstated in travel, as it forms an essential cornerstone for every individual traveler. Likewise, attaining satisfactory profit margins holds crucial importance for travel agencies. The interdependence between these two factors is undeniable, as the absence of harmonious alignment can detrimentally impact travelers and travel agencies. Our ongoing endeavor involves creating a comprehensive system designed to address these issues. Some applications include “SHOHOZ” and “Bus Ticket BD” in Bangladesh. Those applications provide bus tickets, but do not have an optimization system. With the system described in this paper, travelers are empowered to navigate their challenges effectively. Travelers are granted the tools to make informed decisions in selecting their ideal destinations through a carefully curated selection of packages, blogs, and descriptive information. Once this selection is made, the reservation process is streamlined, allowing travelers to secure their seats by making advance payments. Additionally, our system reduces the carbon footprint by around 40%. Parallelly, our system extends its benefits to travel agencies by facilitating the optimization of their fleet of vehicles. This optimization process aids in efficiently allocating limited resources, enabling travel agencies to maximize profits while utilizing their vehicles judiciously. Our total budget was approximately 4,02,208 BDT, and our total earnings were about 5,00,000 BDT (per month). Thus, our total profit is 97,792 BDT in the first month, after which the profit increases more from the second month. Consequently, our system serves as a common platform, fostering a symbiotic relationship between travelers and travel agencies, where both parties stand to reap substantial benefits from the amalgamation of convenience, choice, and profitability.
Author Contributions
Conceptualization, N.J.S., M.A. and F.A.R.; methodology, M.A. and N.J.S.; software, M.A.; validation M.A. and N.J.S.; formal analysis, N.J.S., M.A. and F.A.R.; investigation, M.A. and N.J.S.; resources, F.A.R.; data curation, M.A.; writing—original draft preparation, N.J.S. and F.A.R.; writing—review and editing, N.J.S. and F.A.R.; visualization, M.A.; supervision, M.M.I.; project administration, N.J.S.; funding acquisition, M.M.I. All authors have read and agreed to the published version of the manuscript.
Funding
Funded by the Institute for Advanced Research Publication Grant of the United International University, Ref. No.: IAR-2023-Pub-030.
Institutional Review Board Statement
Not applicable.
Informed Consent Statement
Not applicable.
Data Availability Statement
Not applicable.
Conflicts of Interest
The authors declare no conflict of interest.
References
- Tabassum, A.; Barua, S.; Hashem, T.; Chowdhury, T. Dynamic group trip planning queries in spatial databases. In Proceedings of the 29th International Conference on Scientific and Statistical Database Management, Chicago, IL, USA, 27–29 June 2017; pp. 1–6. [Google Scholar]
- Hashem, T.; Barua, S.; Ali, M.E.; Kulik, L.; Tanin, E. Efficient computation of trips with friends and families. In Proceedings of the 24th ACM International on Conference on Information and Knowledge Management, Melbourne, Australia, 18–23 October 2015; pp. 931–940. [Google Scholar]
- Sharma, D.; Sharma, K.S. Tour and Travels Information Management System; Galgotias University: Greater Noida, India, 2021. [Google Scholar]
- Golden, B.; Assad, A.; Levy, L.; Gheysens, F. The fleet size and mix vehicle routing problem. Comput. Oper. Res. 1984, 10, 49–66. [Google Scholar] [CrossRef]
- Li, M.; Zheng, N.; Wu, X.; Li, W.; Wu, J. An Efficient solving method to vehicle and passenger matching problem for sharing autonomous vehicle system. J. Adv. Transp. 2020, 2020, 3271608. [Google Scholar] [CrossRef]
- Gavalas, D.; Kenteris, M. A web-based pervasive recommendation system for mobile tourist guides. Pers. Ubiquitous Comput. 2011, 15, 759–770. [Google Scholar] [CrossRef]
- Nistrina, K.; Rusdianto, D. Web-Based Tour Package Information System on Brader Bus Holiday Bandung Tour. J. Mantik 2022, 10, 142–149. [Google Scholar]
- Aboubakar, A.; Kamalluddin. Travel and Tour System; Islamic University of Technology (IUT): Gazipur, Bangladesh, 2016. [Google Scholar]
- Amazing Tour BD. Available online: https://www.amazingtoursbd.com/ (accessed on 2 November 2022).
- Paribahan.com. Available online: https://paribahan.com/ (accessed on 11 November 2022).
- Shohoz. Available online: https://www.shohoz.com/bus-tickets (accessed on 11 November 2022).
- Travelers of Bangladesh. Available online: https://www.facebook.com/groups/647450768707652/?ref=share (accessed on 11 November 2022).
- Chologhuri Bangladesh. Available online: https://www.facebook.com/groups/chologhuribangladesh/?ref=share (accessed on 11 November 2022).
- Bus Ticket BD. Available online: https://play.google.com/store/apps/details?id=com.mrsoftbd.busticketbd (accessed on 12 November 2022).
- Hashem, T.; Kulik, L.; Zhang, R. Privacy preserving group nearest neighbor queries. In Proceedings of the 13th International Conference on Extending Database Technology, Lausanne, Switzerland, 22–26 March 2010; pp. 489–500. [Google Scholar]
- Li, F.; Cheng, D.; Hadjieleftheriou, M.; Kollios, G.; Teng, S.H. On trip planning queries in spatial databases. In Proceedings of the International Symposium on Spatial and Temporal Databases, Angra dos Reis, Brazil, 22–24 August 2005; Springer: Berlin/Heidelberg, Germany, 2005; pp. 273–290. [Google Scholar]
- Fan, L.; Bonomi, L.; Shahabi, C.; Xiong, L. Optimal group route query: Finding itinerary for group of users in spatial databases. GeoInformatica 2018, 22, 845–867. [Google Scholar] [CrossRef]
- Soma, S.C.; Hashem, T.; Cheema, M.A.; Samrose, S. Trip planning queries with location privacy in spatial databases. World Wide Web 2017, 20, 205–236. [Google Scholar] [CrossRef]
- Hashem, T.; Hashem, T.; Ali, M.E.; Kulik, L. Group trip planning queries in spatial databases. In Advances in Spatial and Temporal Databases, Proceedings of the 13th International Symposium, SSTD 2013, Munich, Germany, 21–23 August 2013; Proceedings 13; Springer: Berlin/Heidelberg, Gemany, 2013; pp. 259–276. [Google Scholar]
- Al-Baghdadi, A.; Sharma, G.; Lian, X. Efficient processing of group planning queries over spatial-social networks. IEEE Trans. Knowl. Data Eng. 2020, 34, 2135–2147. [Google Scholar] [CrossRef]
- Hashem, T.; Hashem, T.; Ali, M.E.; Kulik, L.; Tanin, E. Trip planning queries for subgroups in spatial databases. In Databases Theory and Applications, Proceedings of the 27th Australasian Database Conference, ADC 2016, Sydney, Australia, 28–29 September 2016; Proceedings 27; Springer: Berlin/Heidelberg, Gemany, 2016; pp. 110–122. [Google Scholar]
- Ali, M.M.; Parvin, R. Strategic Management of Tourism Sector in Bangladesh to Raise Gross Domestic Product: An Analysis; AIUB Business and Economic Paper Series, July; American International University Bangladesh: Dhaka, Bangladesh, 2010. [Google Scholar]
- npm-auth. Available online: https://www.npmjs.com/package/npm-auth?fbclid=IwAR1snVvY_SK5QsuveLhh11mm0t13mz4FSxr0F-arXB5KL4aQssGTrTtMwxA (accessed on 17 August 2023).
- Zhang, Y.; Li, W.; Qin, Y.; Zhang, Y. Synthetic Matrix Representation Method Research on Urban Road Networks. In CICTP 2014: Safe, Smart, and Sustainable Multimodal Transportation Systems; American Society of Civil Engineers: Reston, VA, USA, 2014; pp. 3344–3353. [Google Scholar]
- Zhao, L.; Liu, Z.; Mbachu, J. Highway alignment optimization: An integrated BIM and GIS approach. Int. J. Geo-Inf. 2019, 8, 172. [Google Scholar] [CrossRef]


Disclaimer/Publisher’s Note: The statements, opinions and data contained in all publications are solely those of the individual author(s) and contributor(s) and not of MDPI and/or the editor(s). MDPI and/or the editor(s) disclaim responsibility for any injury to people or property resulting from any ideas, methods, instructions or products referred to in the content. |
© 2023 by the authors. Licensee MDPI, Basel, Switzerland. This article is an open access article distributed under the terms and conditions of the Creative Commons Attribution (CC BY) license (https://creativecommons.org/licenses/by/4.0/).