
Influence of Instrumental Factors in the Measurement of Power Profiles of Intraocular Lenses with a Commercial Deflectometer

 , , and
Abstract
:1. Introduction
2. Materials and Methods
2.1. Calibration Lenses
2.2. Filters
2.3. Thick Lens or Thin Lens
2.4. Intraocular Lenses Studied
2.4.1. RayOne
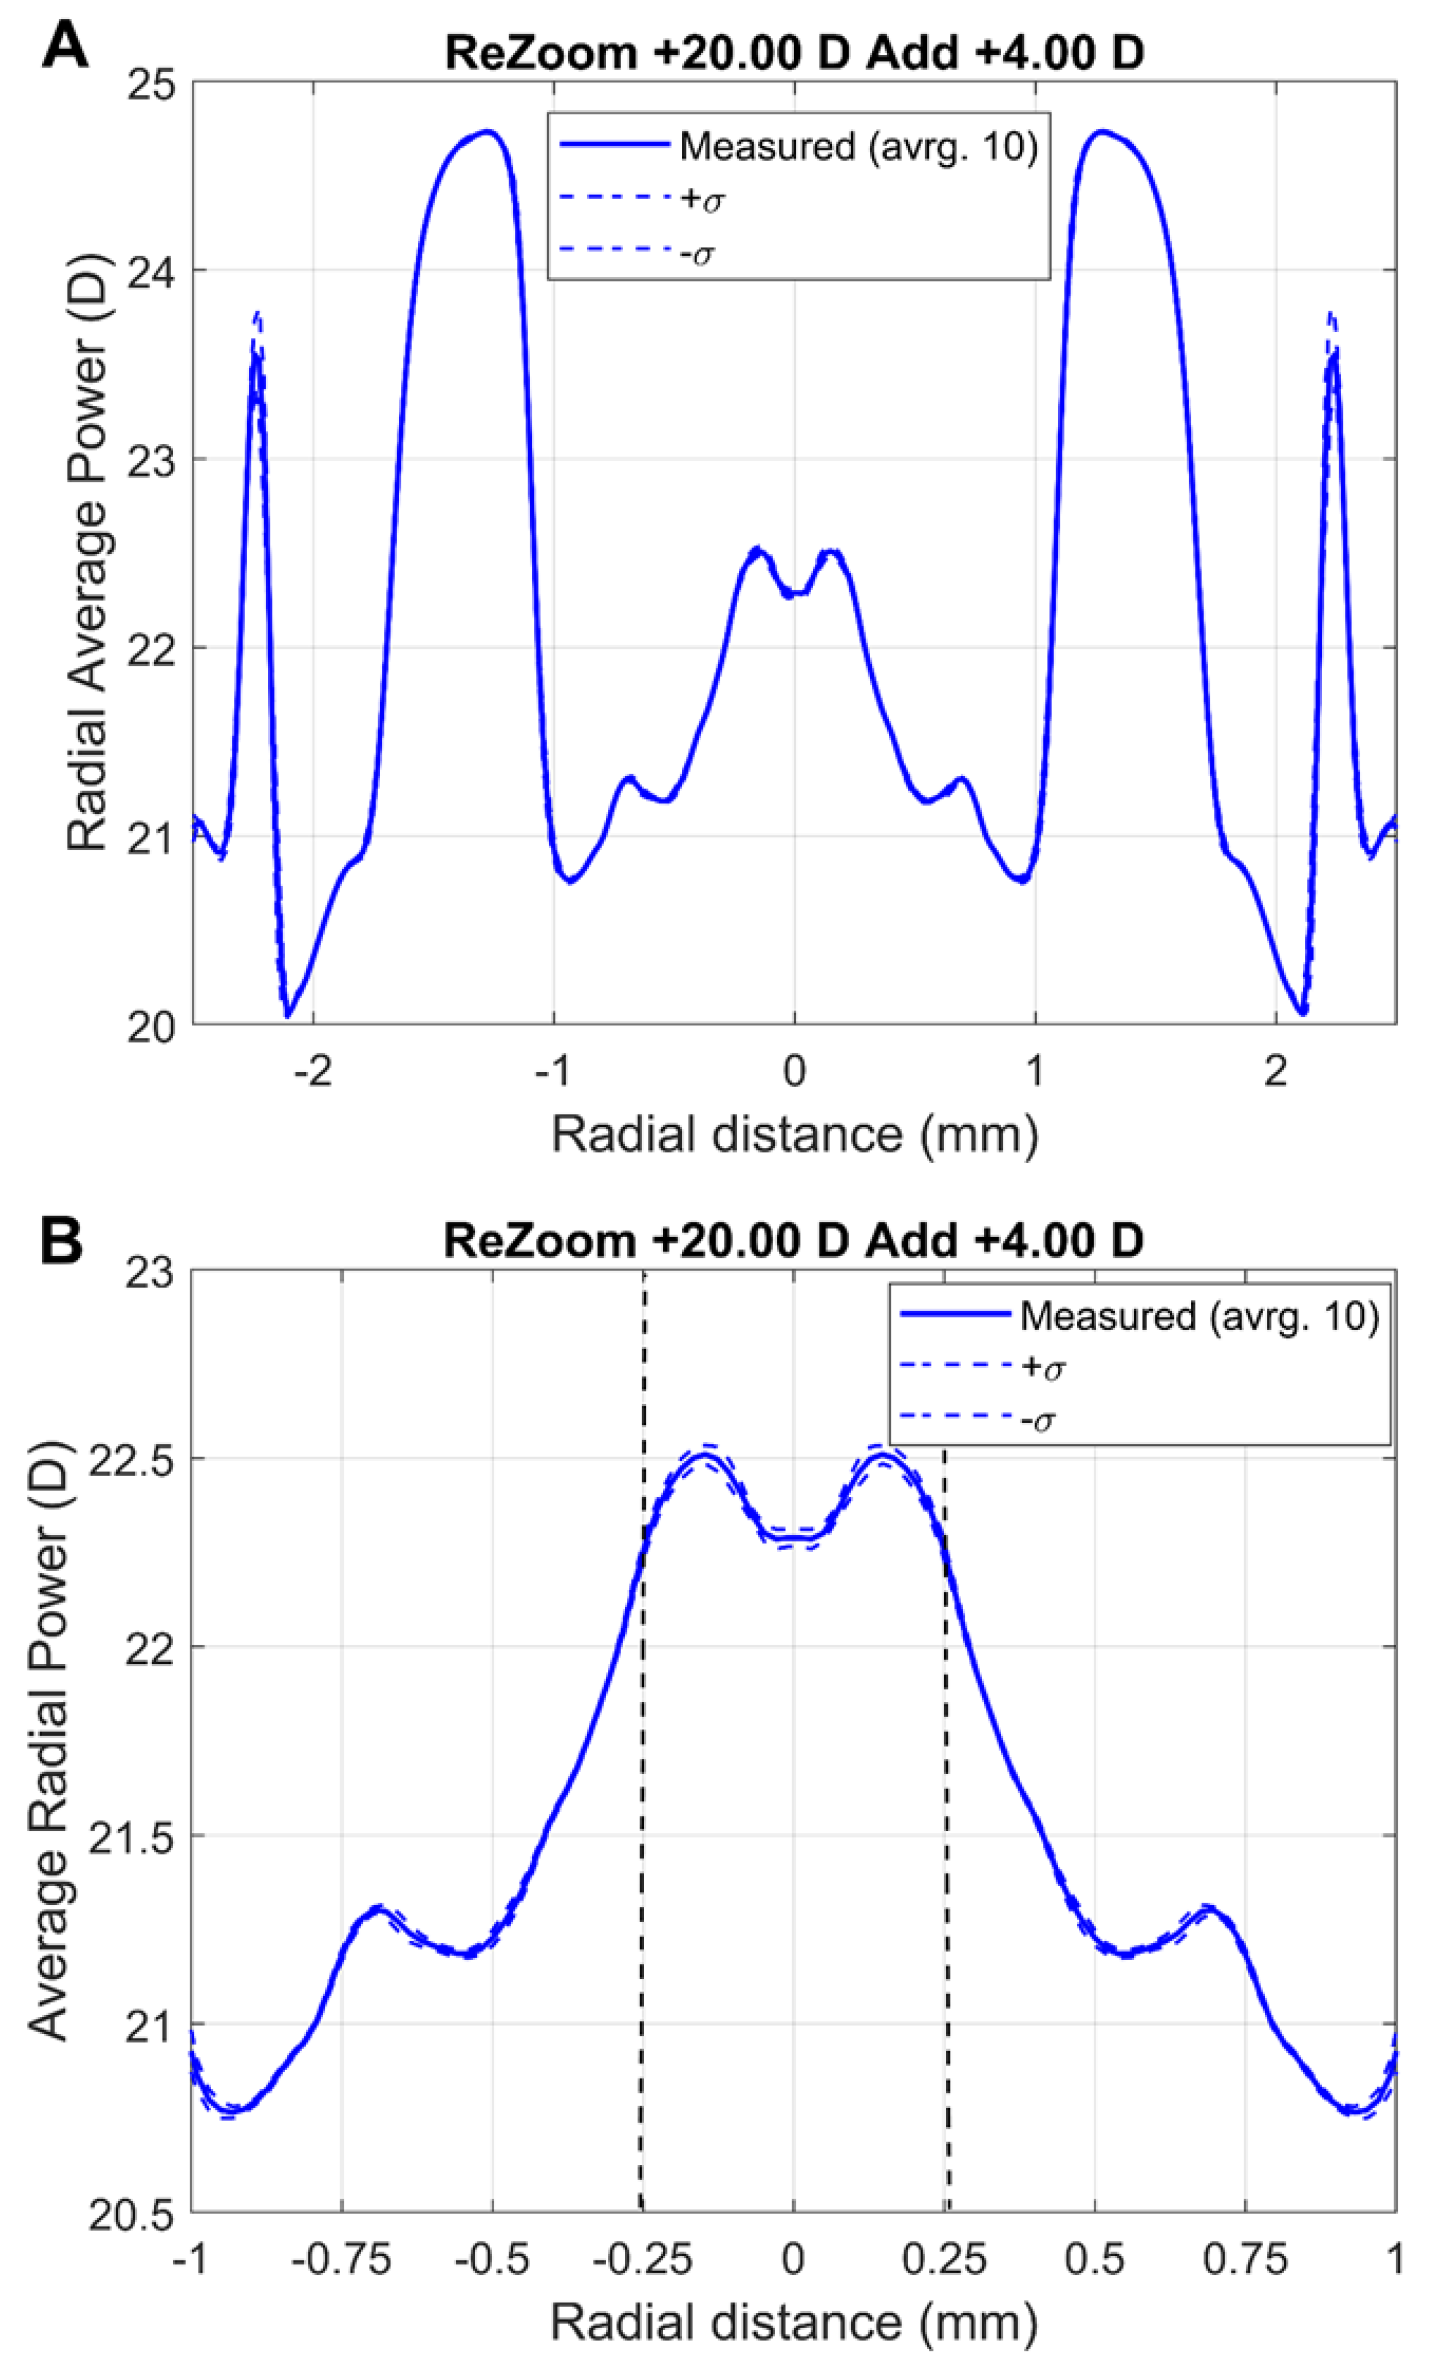
2.4.2. ReZoom
2.4.3. SN60WF
3. Results
3.1. Accuracy and Repeatability
3.2. Filters
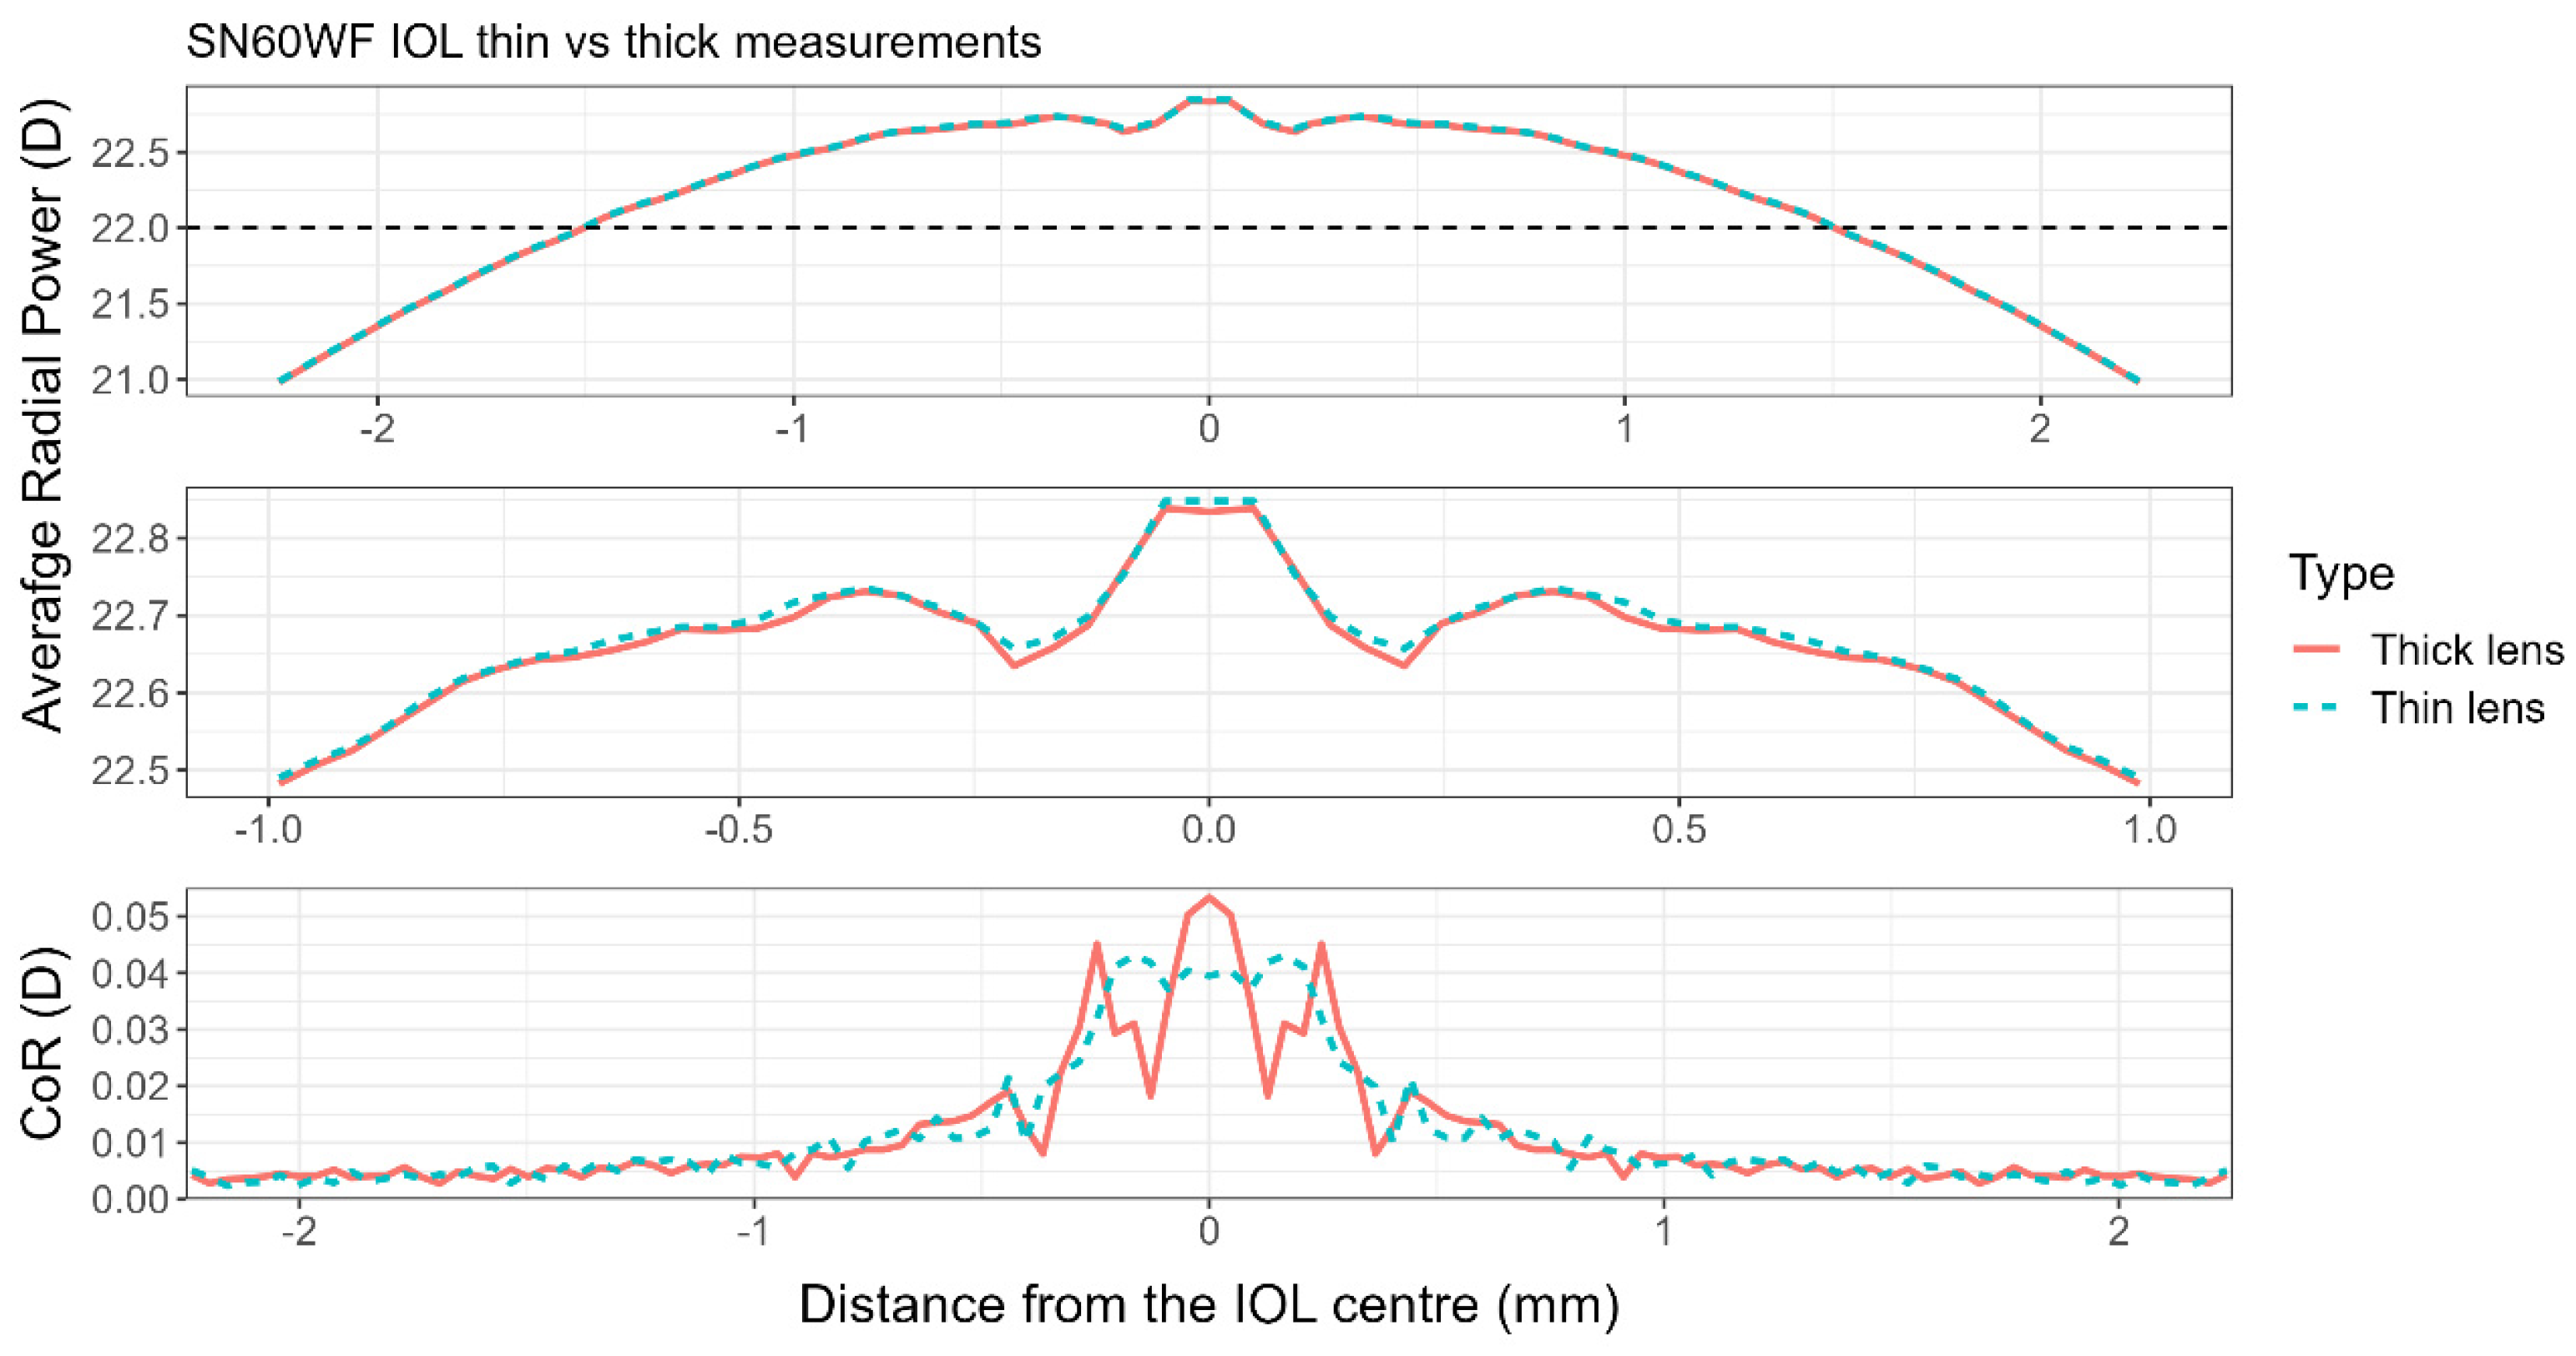
3.3. Thick and Thin Lens
4. Discussion
4.1. Accuracy and Repeatability
4.2. Filters
4.3. Thick and Thin Lens
5. Conclusions
Author Contributions
Funding
Institutional Review Board Statement
Informed Consent Statement
Data Availability Statement
Conflicts of Interest
References
- Gollogly, H.E.; Hodge, D.O.; St Sauver, J.L.; Erie, J.C. Increasing incidence of cataract surgery: Population-based study. J. Cataract. Refract. Surg. 2013, 39, 1383–1389. [Google Scholar] [CrossRef] [PubMed]
- Azor, J.A.; Vega, F.; Armengol, J.; Millan, M.S. Optical Assessment and Expected Visual Quality of Four Extended Range of Vision Intraocular Lenses. J. Refract. Surg. 2022, 38, 688–697. [Google Scholar] [CrossRef] [PubMed]
- Schmid, R.; Fuchs, C.; Luedtke, H.; Borkenstein, A.F. Depth of focus of four novel extended range of vision intraocular lenses. Eur. J. Ophthalmol. 2023, 33, 257–261. [Google Scholar] [CrossRef] [PubMed]
- Alonso, J.; Gómez-Pedrero, J.A.; Quiroga, J.A. Modern Ophthalmic Optics, 1st ed.; Cambridge University Press: Cambridge, UK, 2019. [Google Scholar]
- Joannes, L.; Dubois, F.; Legros, J.C. Phase-shifting schlieren: High-resolution quantitative schlieren that uses the phase-shifting technique principle. Appl. Opt. 2003, 42, 5046–5053. [Google Scholar] [CrossRef] [PubMed]
- Kreis, T. Processing of the Interference Phase. In Handbook of Holographic Interferometry; Krei, T., Ed.; Wiley Online Library: Hoboken, NJ, USA, 2004; pp. 297–398. [Google Scholar]
- Domínguez-Vicent, A.; Esteve-Taboada, J.J.; Recchioni, A.; Brautaset, R. Power Profiles and In Vitro Optical Quality of Scleral Contact Lenses: Effect of the Aperture and Power. Eye Contact Lens 2018, 44, 149–158. [Google Scholar] [CrossRef] [PubMed]
- Kim, E.; Bakaraju, R.C.; Ehrmann, K. Power Profiles of Commercial Multifocal Soft Contact Lenses. Optom. Vis. Sci. 2017, 94, 183–196. [Google Scholar] [CrossRef] [PubMed]
- Madrid-Costa, D.; Ruiz-Alcocer, J.; Garcia-Lazaro, S.; Ferrer-Blasco, T.; Montes-Mico, R. Optical power distribution of refractive and aspheric multifocal contact lenses: Effect of pupil size. Cont. Lens Anterior Eye 2015, 38, 317–321. [Google Scholar] [CrossRef] [PubMed]
- Monsálvez-Romín, D.; Domínguez-Vicent, A.; García-Lázaro, S.; Esteve-Taboada, J.J.; Cerviño, A. Power profiles in multifocal contact lenses with variable multifocal zone. Clin. Exp. Optom. 2018, 101, 57–63. [Google Scholar] [CrossRef]
- Dominguez-Vicent, A.; Ferrer-Blasco, T.; Perez-Vives, C.; Esteve-Taboada, J.J.; Montes-Mico, R. Optical quality comparison between 2 collagen copolymer posterior chamber phakic intraocular lens designs. J. Cataract. Refract. Surg. 2015, 41, 1268–1278. [Google Scholar] [CrossRef]
- Ferrer-Blasco, T.; Dominguez-Vicent, A.; Garcia-Lazaro, S.; Diez-Ajenjo, M.A.; Alfonso, J.F.; Esteve-Taboada, J.J. Repeatability of in-vitro optical quality measurements of intraocular lenses with a deflectometry technique effect of the toricity. Int. J. Ophthalmol. 2018, 11, 1139–1144. [Google Scholar] [CrossRef]
- Perez-Vives, C.; Ferrer-Blasco, T.; Madrid-Costa, D.; Garcia-Lazaro, S.; Montes-Mico, R. Optical quality of aspheric toric intraocular lenses at different degrees of decentering. Graefes Arch. Clin. Exp. Ophthalmol. 2014, 252, 969–975. [Google Scholar] [CrossRef]
- Kim, E.; Bakaraju, R.C.; Ehrmann, K. Reliability of power profiles measured on NIMO TR1504 (Lambda-X) and effects of lens decentration for single vision, bifocal and multifocal contact lenses. J. Optom. 2016, 9, 126–136. [Google Scholar] [CrossRef]
- Joannes, L.; Jacot, M.; Hutsebaut, X.; Dubois, X. NIMO TR1504 Software User Guide, Version 2.17.3; Lambda-X: Nivelles, Belgium, 2019.
- de Groot, P. Phase Shifting Interferometry. In Optical Measurement of Surface Topography; Leach, R., Ed.; Springer: Berlin, Germany, 2011; pp. 167–186. [Google Scholar]
- Wade, N.; Swanston, M. Visual Perception: An Introduction, 3rd ed.; Psychology Press: London, UK, 2012. [Google Scholar]
- Vargas, J.; Gómez-Pedrero, J.A.; Alonso, J.; Quiroga, J.A. Deflectometric method for the measurement of user power for ophthalmic lenses. Appl. Opt. 2010, 49, 5125–5132. [Google Scholar] [CrossRef] [PubMed]
- Joannes, L.; Hough, T.; Hutsebaut, X.; Dubois, X.; Ligot, R.; Saoul, B.; Van Donink, P.; De Coninck, K. The reproducibility of a new power mapping instrument based on the phase shifting schlieren method for the measurement of spherical and toric contact lenses. Cont. Lens Anterior Eye 2010, 33, 3–8. [Google Scholar] [CrossRef] [PubMed]
- ISO 11979-2 2014; Ophthalmic Implants—Intraocular Lenses-Part 2: Optical Properties and Test Methods. ISO: Geneva, Switzerland, 2014.
- Bell, S. A Beginner’s Guide to Uncertainty of Measurement, 2011, National Physical Laboratory, UK. Available online: https://eprintspublications.npl.co.uk/1568/ (accessed on 19 August 2023).
- Squires, G.L. Practical Physics, 4th ed.; Cambridge University Press: Cambridge, UK, 2001. [Google Scholar]
- Barbero, S.; Marcos, S.; Montejo, J.; Dorronsoro, C. Design of isoplanatic aspheric monofocal intraocular lenses. Opt. Express 2011, 19, 6215–6230. [Google Scholar] [CrossRef]
- Rayner. RayOne EMV Technical Specifications. Available online: https://rayner.com/en/iol/monofocal/rayone-emv/ (accessed on 8 May 2023).
- Gierek-Ciaciura, S.; Cwalina, L.; Bednarski, L.; Mrukwa-Kominek, E. A comparative clinical study of the visual results between three types of multifocal lenses. Graefes Arch. Clin. Exp. Ophthalmol. 2010, 248, 133–140. [Google Scholar] [CrossRef] [PubMed]
- Alcon. Product Information Acrysof Aspheric. Available online: http://embed.widencdn.net/pdf/plus/alcon/vmjmutqbkm/40-500-214_us_en.pdf?u=4rqn9d (accessed on 8 May 2023).
- Belda-Salmeron, L.; Madrid-Costa, D.; Ferrer-Blasco, T.; Garcia-Lazaro, S.; Montes-Mico, R. In vitro power profiles of daily disposable contact lenses. Cont. Lens Anterior Eye 2013, 36, 247–252. [Google Scholar] [CrossRef] [PubMed]
- Dominguez-Vicent, A.; Marin-Franch, I.; Esteve-Taboada, J.J.; Madrid-Costa, D.; Montes-Mico, R. Repeatability of in vitro power profile measurements for multifocal contact lenses. Cont. Lens Anterior Eye 2015, 38, 168–172. [Google Scholar] [CrossRef] [PubMed]
- Servin, M.; Estrada, J.C.; Quiroga, J.A.; Mosiño, J.F.; Cywiak, M. Noise in phase shifting interferometry. Opt. Express 2009, 17, 8789–8794. [Google Scholar] [CrossRef] [PubMed]
- Plainis, S.; Atchison, D.A.; Charman, W.N. Power profiles of multifocal contact lenses and their interpretation. Optom. Vis. Sci. 2013, 90, 1066–1077. [Google Scholar] [CrossRef] [PubMed]
- Schwiegerling, J. Field Guide to Visual and Ophthalmic Optical; Press, S., Ed.; Spie: Bellingham, WA, USA, 2004. [Google Scholar] [CrossRef]


| Lens | Power (D) | Sys. Error (D) | Sys. Error (%) | Rand. Error (D) | Rand. Error (%) |
|---|---|---|---|---|---|
| LA1207 | 10.03 | −4.1·10−4 | −0.004 | 0.002 | 0.02 |
| LA1207 * | 10.03 * | 0.03 * | 0.3 * | 0.013 * | 0.13 * |
| LA1213 | 20.08 | −0.12 | −0.6 | 0.002 | 0.01 |
| LA1213 * | 20.08 * | 0.018 * | 0.09 * | 0.015 * | 0.07 * |
| LA1289 | 33.44 | 0.51 | 1.7 | 0.003 | 0.01 |
| LA1289 * | 33.44 * | 0.47 * | 1.4 * | 0.016 * | 0.05 * |
Disclaimer/Publisher’s Note: The statements, opinions and data contained in all publications are solely those of the individual author(s) and contributor(s) and not of MDPI and/or the editor(s). MDPI and/or the editor(s) disclaim responsibility for any injury to people or property resulting from any ideas, methods, instructions or products referred to in the content. |
© 2023 by the authors. Licensee MDPI, Basel, Switzerland. This article is an open access article distributed under the terms and conditions of the Creative Commons Attribution (CC BY) license (https://creativecommons.org/licenses/by/4.0/).
Share and Cite
Gómez-Pedrero, J.A.; Albarrán-Diego, C.; García-Montero, M.; Garzón, N.; Gonzalez-Fernandez, V. Influence of Instrumental Factors in the Measurement of Power Profiles of Intraocular Lenses with a Commercial Deflectometer. Appl. Sci. 2023, 13, 9882. https://doi.org/10.3390/app13179882
Gómez-Pedrero JA, Albarrán-Diego C, García-Montero M, Garzón N, Gonzalez-Fernandez V. Influence of Instrumental Factors in the Measurement of Power Profiles of Intraocular Lenses with a Commercial Deflectometer. Applied Sciences. 2023; 13(17):9882. https://doi.org/10.3390/app13179882
Chicago/Turabian StyleGómez-Pedrero, José Antonio, César Albarrán-Diego, María García-Montero, Nuria Garzón, and Veronica Gonzalez-Fernandez. 2023. "Influence of Instrumental Factors in the Measurement of Power Profiles of Intraocular Lenses with a Commercial Deflectometer" Applied Sciences 13, no. 17: 9882. https://doi.org/10.3390/app13179882
APA StyleGómez-Pedrero, J. A., Albarrán-Diego, C., García-Montero, M., Garzón, N., & Gonzalez-Fernandez, V. (2023). Influence of Instrumental Factors in the Measurement of Power Profiles of Intraocular Lenses with a Commercial Deflectometer. Applied Sciences, 13(17), 9882. https://doi.org/10.3390/app13179882