Abstract
Aiming at the problem that the non-probabilistic reliability analysis method of slope engineering, which is based on an interval model, cannot consider the cross-correlation of geotechnical parameters, a non-probabilistic reliability analysis method of slopes based on a multidimensional parallelepiped model is proposed. This method can effectively alleviate the problem of difficult data survey in the field of geotechnical engineering. Using the limited sample data of soil parameters, the multidimensional parallelepiped model is constructed. The performance function of the slope is constructed based on Latin hypercube sampling and the quadratic response surface method. Then, the limit state equation of the slope can be standardized using the multidimensional parallelepiped model. The non-probabilistic reliability indexes of the slope are calculated based on the global optimal solution to judge the stability state of the slope. The example analysis verifies the feasibility of the proposed method. The results show that the correlation of shear strength parameters of soil has a great influence on the non-probabilistic reliability indexes of the slope. When the correlation coefficients of the shear strength parameters are between −1.0 and 0, the smaller the correlation coefficient is, the greater the non-probabilistic reliability index of the slope is; when the correlation coefficients of the shear strength parameters are between 0 and 1.0, the non-probabilistic reliability index of the slope does not change with the correlation coefficient. The non-probabilistic reliability indexes of the slope obtained using the multidimensional parallelepiped model are between the results obtained using an ellipsoid model and those obtained using an interval model, which are validated by Monte Carlo method and relatively more reasonable. In the absence of a large number of geotechnical sample data, this method provides a new way for slope stability analysis and expands the application field of calculation methods based on non-probabilistic theory.
1. Introduction
Slope stability analysis [1,2,3,4,5,6,7] is one of the most important research techniques in the field of geotechnical engineering. Slope stability analysis methods are mainly divided into qualitative analysis methods, quantitative analysis methods, and uncertainty analysis methods. Since most of the geotechnical parameters affecting slope stability have uncertainties, such as randomness, fuzziness, and variability, an uncertainty analysis method is more appropriate for actual slope projects. The non-probabilistic reliability method, as one of the uncertainty analysis methods, does not require detailed parametric probabilistic statistical characterization to take into account the uncertainty of influencing factors. Therefore, it is suitable for use when sample data are small. It also has the advantages of less computational workload and relatively simpler operation than probabilistic reliability analysis methods.
The correlation between geotechnical parameters is a result of long-term geological evolutionary processes and an important factor affecting slope stability. When using the non-probabilistic reliability method to analyze slope stability, the influence of the correlation between geotechnical parameters needs to be considered. Currently, domestic research in China and international research on non-probabilistic reliability analysis of slopes can be divided into two categories according to the convex set model used: (1) The first is non-probabilistic reliability analysis based on an interval model. Liu et al. [8], Yu et al. [9], and Mu [10] used an interval mathematical method to calculate the interval of safety coefficient of slopes, and then calculated a non-probabilistic reliability index of slopes using an interval model. This kind of method only needs to determine the upper and lower boundaries of the interval of geotechnical parameter values, and the calculation process is relatively simple. However, its limitation is that it cannot take into account the correlation between geotechnical parameters. In some cases, the interval expansion problem will arise during the calculation process. (2) The second category is non-probabilistic reliability analysis based on an ellipsoid model. Han et al. [11], Gao et al. [12], and Shu et al. [13] used an ellipsoid model to construct the uncertainty domain of geotechnical parameters, and calculated the non-probabilistic reliability index of slopes using a direct iterative method to assess the stability of slopes. This type of method considers the correlation between geotechnical parameters, but the calculation process is relatively complicated. Therefore, in the field of non-probabilistic reliability analysis of slopes, it is of great significance to develop a method that can take into account the correlation of geotechnical parameters and has a relatively simple calculation process.
The multidimensional parallelepiped model proposed by Ni [14] is a class of models that can take into account the correlation between interval variables. A multidimensional parallelepiped model can be used to express the situation where the parameters under consideration are independent or correlated, or where both correlation and independence coexist [15]. Lv et al. [16] introduced a multidimensional parallelepiped model to deal with the case of coexistence of correlation and independence of system parameters. Combining it with the Monte Carlo method, they proposed a method to analyze the uncertainty in the intrinsic characteristics of automotive powertrain suspension systems. Zhao et al. [17] applied a multidimensional parallelepiped model to the interval analysis of complex-valued domains, which significantly alleviated the interval overestimation problem. Zheng et al. [18] proposed a new topology optimization method based on a multidimensional parallelepiped model for non-probabilistic reliability, which was used to take into account the interval uncertainty of parameter correlation, and provided an effective method for solving topology optimization problems under non-probabilistic uncertainty. The above study verified the feasibility of the multidimensional parallelepiped model for non-probabilistic reliability analysis. However, there is no current research work on the use of such a model for slope stability analysis, and the feasibility of using this model for slope engineering is yet to be investigated due to the complexity of geotechnical parameters.
This paper proposes a non-probabilistic reliability analysis method of slopes based on a multidimensional parallelepiped model. First, the multidimensional parallelepiped model is constructed based on limited sample data of geotechnical parameters. Next, the performance function of the slope is constructed by using Latin hypercube sampling and response surface methodology. Then, the limit state equation of the slope can be standardized by using the multidimensional parallelepiped model. Finally, the non-probabilistic reliability index of the slope is solved using a global optimal solution method. The effects of different multidimensional parallelepiped models, correlation, and variability of shear strength parameters on the non-probabilistic reliability index of the slope are investigated. The novelty of the proposed method lies in the fact that a multidimensional parallelepiped model is introduced into the non-probabilistic reliability analysis of slopes for the first time, which solves the problem that the correlation between geotechnical parameters cannot be considered by traditional interval models. Thus, it has important practical engineering significance.
2. Non-Probabilistic Reliability Analysis Method Based on a Multidimensional Parallelepiped Model
A non-probabilistic reliability analysis method is a structural reliability assessment method that uses a non-probabilistic convex model theory to describe parameter uncertainty [19]. The convex set models used in this method mainly include interval models and ellipsoid models; an interval model can only deal with independent interval variables, while an ellipsoid model can only deal with correlated interval variables. Multidimensional parallelepiped models are a new class of convex set models that can consider both independent interval variables and correlated interval variables [15]. According to the way of measuring the correlation of interval variables and the way of constructing the shape kernel matrix, multidimensional parallelepiped models can be subdivided into the following types: the MP-1 model, the MP-2 model, the rectangular model, the lower triangular model, and the upper triangular model. Among these models, the MP-1 model and the MP-2 model are the most representative. In this paper, the MP-1 model and the MP-2 model are used for non-probabilistic reliability analysis.
2.1. Construction of the Multidimensional Parallelepiped Model
is a vector consisting of n uncertainty parameters of the structure, where the uncertainty parameter can be expressed in terms of an interval as follows:
where is the median of the marginal interval of the uncertainty parameter , and is the deviation of the marginal interval of the uncertainty parameter .
Consider any two uncertainty parameters and in . Based on a dataset with a limited number of sample points, the parallelogram uncertainty domain ABCD can be constructed that satisfies the following four conditions [15] (as shown in Figure 1):
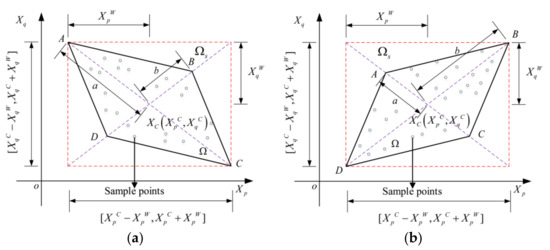
Figure 1.
The MP interval model (two-dimensional case): (a) and (b) .
- (1)
- The parallelogram uncertainty domain is contained in the rectangular domain .
- (2)
- The vertices A, B, C, and D of the parallelogram uncertainty domain are located on the diagonal lines of the rectangular domain .
- (3)
- The parallelogram uncertainty domain is the minimum area parallelogram containing all sample points.
- (4)
- When the uncertainty parameters and are independent of each other, the parallelogram uncertainty domain degenerates into the rectangular domain .
In Figure 1, the white circles are the sample points, the rectangle domain formed by the red dashed lines represents the uncertainty domain in the traditional interval model, and the purple dashed lines are the diagonal lines of the rectangle. denotes the distance from the center point to the vertex of the parallelogram uncertainty domain, and denotes the distance from the center point to the vertex . For the MP-1 multidimensional parallelepiped model [20], the correlation coefficient between the uncertainty parameters and is defined as follows:
when the value of is equal to the value of , the value of the correlation coefficient is equal to 0. At the same time, the uncertainty parameters and are independent of each other and the uncertainty domain degenerates into a traditional interval model. The uncertainty domain coincides with the rectangular domain (the rectangle enclosed by the red dashed line in Figure 1). When the value of is not equal to the value of and neither the value of nor the value of is equal to 0, the value of the correlation coefficient is greater than −1 and less than 1. In this case, there is a certain degree of correlation between the uncertainty parameters and . The uncertainty domain is represented by the parallelogram ABCD surrounded by the solid lines in Figure 1. Specifically, when the value of is equal to 0 (the value of the correlation coefficient is equal to 1) or the value of is equal to 0 (the value of the correlation coefficient is equal to −1), the uncertainty domain degenerates into the straight line BD or the straight line AC, which is represented by the purple dashed line in Figure 1.
For n uncertainty parameters , , …, , the multidimensional correlation coefficient matrix is defined as follows:
where is an symmetric matrix; is the autocorrelation coefficient of the uncertainty parameter , whose value is 1; and is the correlation coefficient between any uncertainty parameters and , whose value can be obtained from Equation (2) by constructing the parallelogram uncertainty domain.
The MP-1 model can be constructed using the following equation:
where
The most important difference between the MP-2 model and the MP-1 model is the different definitions of the correlation coefficient and the multidimensional correlation coefficient matrix for the uncertainty parameters. For the MP-2 model, the correlation coefficient between any uncertainty parameters and is defined as follows:
The multidimensional correlation coefficient matrix is defined as follows:
where is an symmetric matrix; is the autocorrelation coefficient of the uncertainty parameter , whose value is 1; and is the correlation coefficient between any uncertainty parameters and , whose value can be obtained from Equation (6) by constructing the parallelogram uncertainty domain.
The MP-2 model can be constructed using the following equation:
where
As shown in Figure 2, when the uncertainty domain is described by a multidimensional parallelepiped model, it can be normalized to the uncertainty domain by means of matrix transformation, regardless of whether the MP-1 model or the MP-2 model is used. The transformation relation equation from the original -space to the standard -space for the MP-1 model in the two-dimensional case is presented by Jiang et al. [21]:
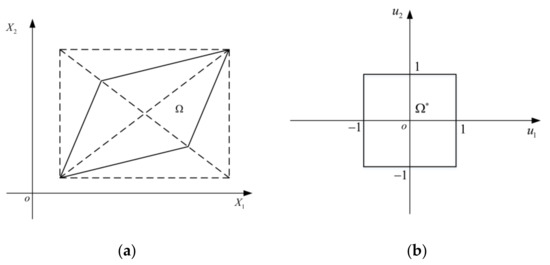
Figure 2.
Matrix transformation for the MP model. (a) The original -space; (b) The standard -space.
Similarly, this paper derives a transformation relation equation from the original -space to the standard -space for the MP-2 model in the two-dimensional case:
Using the above equation, the original vector can be transformed into the vector in the standard space. Thus, the structure performance function is changed into the standardized performance function .
2.2. Non-Probabilistic Reliability Analysis
In a multidimensional parallelepiped model, the non-probabilistic reliability index denotes the shortest distance from the coordinate origin to the limit state surface in the extended space of the standardized interval variables measured via the minimum infinity norm (Figure 3 shows the two-dimensional case). It is consistent with the meaning of the non-probabilistic reliability index in a traditional interval model. The non-probabilistic reliability index is defined as follows [22]:
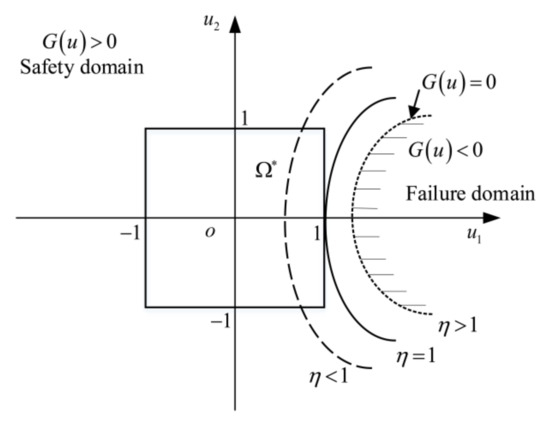
Figure 3.
Definition of non-probabilistic reliability index.
The solution methods for calculating the non-probabilistic reliability index are mainly divided into three categories [23]: the definition method, the transformation method, and the optimization method. Theoretically, the definition method and the transformation method are accurate methods, while the optimization method is an approximation method. The optimization method is more adaptable in the case of complexity of the performance function, but there is the problem of interval expansion in the calculation. Commonly used in the definition method is the sequential quadratic programming method [24], which is backed up by good mathematical theory. However, it is limited to the fact that the performance function is a standard quadratic formula. What is worse, when solving with this iterative algorithm, there may be cases where the solution falls into a local optimum or the iterations do not converge. The transformation method is an analytic method, in which the global optimal solution method [25] is simple to operate and obtains a stable global optimal solution.
The steps to compute non-probabilistic reliability indexes using the global optimal solution method are as follows. First, we solve all the minimum points of the limit state equation with respect to . Second, we reduce the dimension of the limit state equation as follows:
Then, we find all the minimum points of the above n (n − 1) equations (calculated according to the n − 1 dimensional problem). The process of reducing the dimension of the limit state equation and searching for the minimum points is repeated until the limit state equation is reduced to two dimensions. Finally, we solve the equation (a total of 2n − 1 equations) and obtain all the root value points. Then the non-probabilistic reliability index is the minimum value of the distance between all the minimum points of the equation and the root value points to the coordinate origin measured via the infinity norm. In this paper, the global optimal solution method is used to solve the non-probabilistic reliability index.
As shown in Figure 3, the solid squares represent the normalized parameters’ uncertainty domain. When the non-probabilistic reliability index , the limit state surface of the standardized structure performance function is tangent to the parameter uncertainty domain, and the structure is in a critical state between being reliable and unreliable. When the non-probabilistic reliability index , the standardized parameter uncertainty domain is within the safety domain and the structure is reliable. The larger the value of is, the more reliable the structure is. When the non-probabilistic reliability index , a portion of the area of the standardized parameter uncertainty domain is in the failure domain. Thus, the possibility of failure exists and the structure is unreliable.
3. Non-Probabilistic Reliability Analysis of Slopes Based on a Multidimensional Parallelepiped Model
First, based on the limited sample data of geotechnical parameters, the means, standard deviations, and correlation coefficients between different geotechnical parameters are calculated for each uncertainty parameter, and the marginal interval of each uncertainty parameter is delineated according to the 3σ truncation rule [26]. The sample data are screened. If a sample point outside a marginal intervals exist, the sample point will be excluded. The statistical characterization data for the geotechnical parameters are recalculated from the remaining sample points, and a new round of screening is performed until all sample points are within the marginal intervals of the parameters.
Next, the median and deviation of the uncertainty parameters are calculated from the upper and lower bounding values of the marginal interval of the parameters. As described in Section 2.1, the multidimensional parallelepiped model is constructed from the sample data to establish the transformation relation equation of the uncertainty parameters from the original space to the standard space.
Again, based on the range of the marginal interval of each parameter and the correlation coefficient between the parameters, several groups of sample data are generated via Latin hypercube sampling (Compared with other experimental design methods such as the uniform sampling method and orthogonal design method, the Latin hypercube sampling method has many advantages [27] such as good sample representativeness, applicability to both independent and correlated variables, and stable sampling valuation). After the slope safety coefficients corresponding to each group of sample data are computed using the limit equilibrium method, we use the quadratic polynomial response surface function without cross terms to fit the slope performance function as follows:
where are the factors of polynomial to be determined.
According to Equation (10), when the MP-1 model is used to standardize the parameters, the limit state equation of the slope can be expressed as follows:
According to Equation (11), when the MP-2 model is used to standardize the parameters, the limit state equation of the slope can be expressed as follows:
Finally, based on the above limit state equation that is used, the non-probabilistic reliability index of the slope is solved via the global optimal solution method. The specific analysis process is shown in Figure 4.
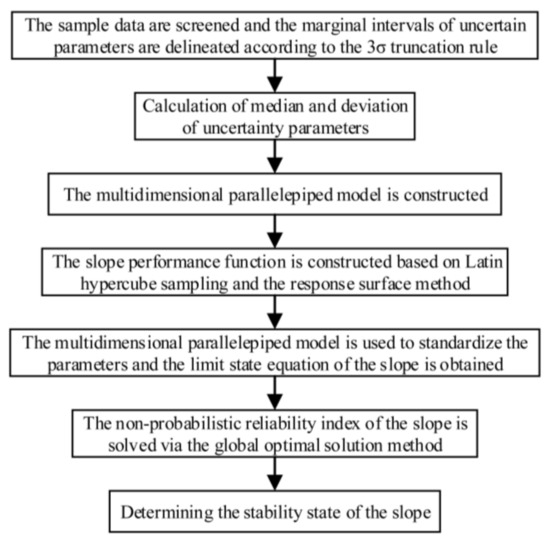
Figure 4.
Analysis process of the proposed non-probabilistic reliability analysis method for the slope.
4. Example Analysis
4.1. Basic Information
A single-layer homogeneous slope proposed in the literature [28] was studied, and the spatial variability of soil was not considered. The cross-sectional dimensions of the slope are shown in Figure 5. The weight γ of the layer of this slope is 20 kN/m3, the modulus of elasticity E is 100 MPa, and the Poisson’s ratio μ is 0.3. No water table or external water was considered. Thus, it is appropriate to use the total stress method. This study used the Bishop method in the limit equilibrium method as the basis for calculating the slope safety factor. In the non-probabilistic reliability analysis of slopes, we can get two kinds of slip surfaces. One is the slip surface corresponding to the mean value of geotechnical parameters, which is only related to the mean value of geotechnical parameters. The other is the minimum safety factor slip surface. In the non-probabilistic reliability analysis, the parameters are as interval variables, there will be a lot of slip surfaces. We take the slip surface with the minimum safety factor, this kind of slip surface will change with the parameter range of intervals. The cohesion c and the internal friction angle φ are uncertain variables, and the test data of shear strength parameters are shown in Table 1.
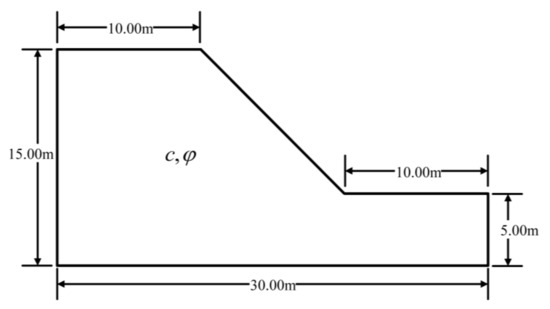
Figure 5.
The slope calculation cross-section.

Table 1.
Test data of shear strength parameters.
4.2. Calculation Results and Analysis
4.2.1. Feasibility Validation of the Non-Probabilistic Reliability Analysis Method for the Slope
In Table 1, the sample mean values of the cohesion c and the internal friction angle φ are 15.03 kPa and 29.86°, respectively. The sample standard deviations are 3.02 kPa and 3.16°, respectively. The correlation coefficient of the cohesion and the internal friction angle is −0.70. The Monte Carlo method was used, which is a more accurate method in probabilistic reliable analysis. And 1 × 10⁷ simulations were performed while considering or not considering the parameter correlation (the correlation coefficient is 0). The failure probability of the slope was calculated to be 0 or 0.0032, respectively.
When using the method proposed in this paper for non-probabilistic reliability analysis, according to the 3σ truncation law, the marginal intervals of the cohesion c and internal friction angle φ are [5.97, 24.09] and [20.38, 39.34], respectively. All the data presented in Table 1 are located in the range of the marginal intervals; thus, there was no need to exclude the sample points. The multidimensional parallelepiped model was constructed based on the sample data, and the global optimal solution method was used to calculate the non-probabilistic reliability index of the slope. The results are shown in Table 2.
Table 2.
Comparison of results of non-probabilistic and probabilistic methods.
As shown in Table 2, under the consideration of the correlation between the cohesion and the internal friction angle, the non-probabilistic reliability indexes of the slope obtained based on the MP-1 model and the MP-2 model are very close to each other, and the values are all greater than 1, which indicates that the slope is in a stable state. It is in agreement with the calculation results obtained using the Monte Carlo method in the probabilistic reliability analysis. Because both the MP-1 model and the MP-2 model degenerate into a traditional interval model when sample correlation is not taken into account, the non-probabilistic reliability indexes of the slope obtained based on the MP-1 model and the MP-2 model are consistent without considering the correlation between the cohesion and the internal friction angle. At this time, the calculated non-probabilistic reliability indexes are all less than 1, indicating that there is a risk of destabilization and damage of the slope, which is also consistent with the calculation results obtained using the Monte Carlo method.
It can be seen that it is feasible to use the non-probabilistic reliability method based on the multidimensional parallelepiped model to analyze the stability of the slope, and it can solve the problem that a traditional interval model cannot consider the correlation between the uncertainty parameters. In this way, the calculation results are more in line with the actual situation of slope engineering.
4.2.2. Influence of Correlation of Shear Strength Parameters on the Non-Probabilistic Reliability of the Slope
In order to study the influence of the correlation coefficients of the cohesion c and the internal friction angle φ on the non-probabilistic reliability indexes of the slope, the sample mean and standard deviation of the original data presented in Table 1 were used as the benchmark to generate 25 sets of random data with correlation coefficients of −0.7, −0.5, −0.3, −0.1, 0, 0.1, 0.3, 0.5, and 0.7, respectively. Then, the methodology proposed in this paper was used to calculate the non-probabilistic reliability indexes of the slope. The results are shown in Figure 6. In this figure, ME indicates that an ellipsoid model was used, and MI indicates that a traditional interval model (the special case where the correlation coefficient is 0 in the MP-1 model and the MP-2 model) was used.
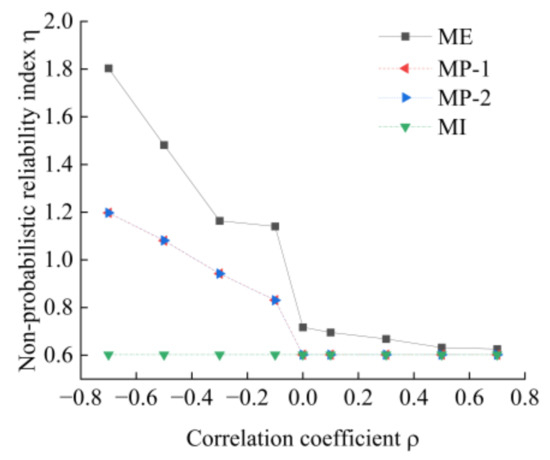
Figure 6.
The curve of correlation coefficients of geotechnical parameters and non-probabilistic reliability indexes.
As shown in Figure 6, when there is a negative correlation between the cohesion c and the internal friction angle φ, the non-probabilistic reliability indexes of the slope obtained based on the ellipsoid model and those based on the multidimensional parallelepiped model both decrease with an increase in the correlation coefficient. The magnitude of the change of the calculation results obtained based on the ellipsoid model is larger, and the magnitude of the change of the calculation results obtained based on the multidimensional parallelepiped model is relatively uniform. With correlation coefficients of −0.7 and −0.5, the failure probabilities of the slope calculated using the Monte Carlo method are, respectively, 0 and 0.003% (close to 0). The non-probabilistic reliability indexes of the slope obtained based on the ellipsoid model and those based on the MP model are greater than 1, which is reasonable. However, the non-probabilistic reliability indexes of the slope obtained based on the interval model are less than 1, which underestimates the stability of the slope. With correlation coefficients of −0.3 and −0.1, the failure probabilities of the slope calculated using the Monte Carlo method are 0.061% and 0.203%, respectively. The non-probabilistic reliability indexes of the slope obtained using the MP model and the interval model are less than 1, which is also reasonable. But the non-probabilistic reliability indexes of the slope obtained using the ellipsoid model are greater than 1, which overestimates the stability of the slope.
When there is a positive correlation between the cohesion c and the internal friction angle φ, the non-probabilistic reliability indexes of the slope obtained based on the ellipsoid model decreases slightly with the increase in the correlation coefficient. The non-probabilistic reliability indexes of the slope obtained based on the multidimensional parallelepiped model remain unchanged and are the same as the calculation results obtained based on the interval model. It is consistent with the situation presented in the literature [21]. There are two reasons to explain this result. On the one hand, in actual slope engineering, the cohesion and the internal friction angle of soil are negatively correlated in most cases. And the influence of the negative correlation on slope stability is mainly considered. On the other hand, as shown in Figure 6, when the correlation coefficient is greater than 0, the difference between the non-probabilistic reliability indexes of the slope based on the ellipsoid model and those based on the MP model or the interval model is small. The values are all less than 1, which indicates that there is the possibility of instability of the slope. At this time, a change in the value of the non-probabilistic reliability indexes of the slope has no effect on the judgment of the stability of the slope.
According to Figure 6, the non-probabilistic reliability indexes of the slope obtained based on the MP-1 model and those obtained based on the MP-2 model are very close and almost equal. Regardless of how the correlation coefficients of the geotechnical parameters change, the calculation results based on the MP-1 model and the MP-2 model are always smaller than those based on the ellipsoid model. None of the values are smaller than the non-probabilistic reliability indexes calculated based on the traditional interval model, which proves again that the non-probabilistic reliability method of the slope based on the multidimensional parallelepiped model not only can take into account the correlation of the uncertain parameters, but also can obtain more appropriate calculation results than the ellipsoid model.
4.2.3. Influence of Variability of Shear Strength Parameters on the Non-Probabilistic Reliability of the Slope
The variability of shear strength parameters is also an important factor affecting slope stability. In order to study the influence of the variability of the cohesion c and internal friction angle φ on the non-probabilistic reliability indexes of the slope, the data of the internal friction angle presented in Table 1 were first kept unchanged, and the cohesion was taken to have five different coefficients of variation (in this study, the coefficient of variation was defined as the ratio of the deviation to the median of the interval of an uncertainty variable, which served to compute the marginal interval of the parameter. For example, when the coefficient of variation δc of the cohesion was taken as 0.5, the marginal interval of the cohesion c was [7.51, 22.55]), which was taken on the basis of the mean values of the original data, such as 0.1, 0.3, 0.5, 0.7, and 0.9. After randomly generating 25 sets of sample data for each, the influence of the variability of the cohesion on the non-probabilistic reliability indexes of the slope with different correlation coefficients was determined using the method proposed in this paper, and the results are shown in Figure 7.
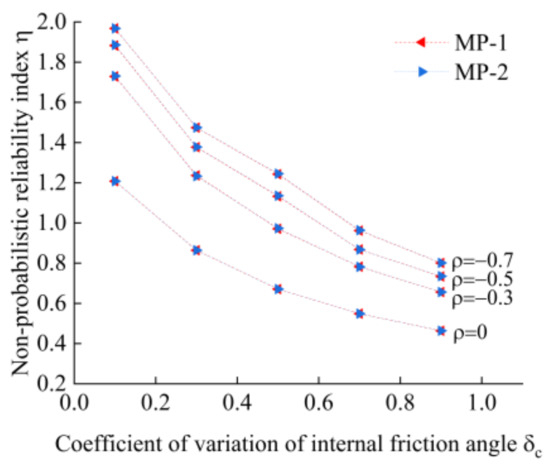
Figure 7.
The curve of variation coefficients of the cohesion and non-probabilistic reliability indexes under different correlation coefficients.
Similarly, while keeping the data of the cohesion presented in Table 1 unchanged, the internal friction angle was taken to have five different coefficients of variation on the basis of the mean values of its original data, such as 0.1, 0.3, 0.5, 0.7, and 0.9. After randomly generating 25 sets of sample data for each, the influence of the variability of the internal friction angle on the non-probabilistic reliability indexes of the slope with different correlation coefficients was determined using the method proposed in this paper, and the results are shown in Figure 8.
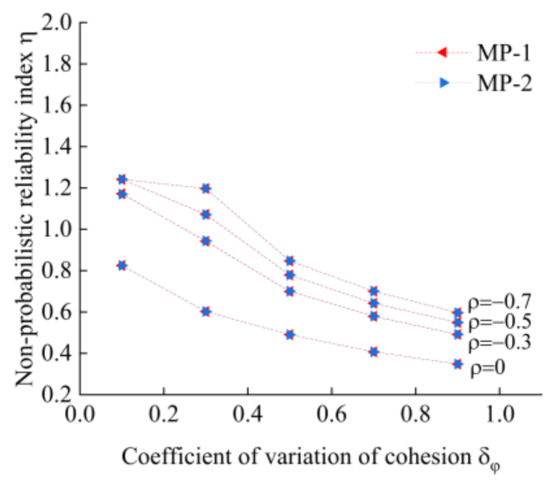
Figure 8.
The curve of variation coefficients of the internal friction angle and non-probabilistic reliability indexes under different correlation coefficients.
As shown in Figure 7 and Figure 8, the non-probabilistic reliability indexes of the slope calculated based on the MP-1 model and the MP-2 model are very close. As the cohesion or the internal friction angle coefficient of variation increases, the non-probabilistic reliability index of the slope decreases. This is consistent with the evaluation obtained using the probabilistic reliability method. When using the probabilistic reliability method to calculate the failure probability of the slope, the stability reliability of the slope is lower when the variability of the cohesion c or the internal friction angle φ is larger. By comparing Figure 7 and Figure 8, it can also be seen that the variability of the cohesion has a greater impact on the non-probabilistic reliability index of the slope for the example slope, which indicates that the stability of the slope is more sensitive to the variability of the cohesion.
As shown in Figure 7 and Figure 8, with an increase in the coefficient of variation of the parameters, the difference between the non-probabilistic reliability indexes of the slope obtained under different correlation coefficients also changes to a certain extent, exhibiting a tendency to decrease. This shows that the influence of parameter correlation on slope stability is also related to the variability of parameters, and this effect is more obvious when the parameter variability is small. Both variability and correlation of parameters need to be taken into account when performing non-probabilistic reliability analysis of slopes.
5. Conclusions
In this paper, a non-probabilistic reliability analysis method of slopes based on a multidimensional parallelepiped model is proposed. The distinctive and significant findings of the study are as follows: first, the feasibility of the method is verified via case analysis, which indicates the multidimensional parallelepiped model is suitable for non-probabilistic reliability analysis of slope engineering. Second, the calculation results of this method are intermediate between those based on a traditional interval model and those based on an ellipsoid model, which are more in line with engineering practice. Third, the correlation between the geotechnical parameters and its own variability have a greater impact on the non-probabilistic reliability indexes of the slope, which must be taken into account when using the proposed non-probabilistic reliability method to analyze the stability of slopes. The research’s significance and implications are as follows: The proposed method only needs a small number of geotechnical samples to judge the slope stability state, without the need to assume the probability distribution type of geotechnical parameters through the use of a large number of samples statistically as in the case of the probabilistic reliability method, and the correlation of the geotechnical parameters can be taken into account. Moreover, the multidimensional parallelepiped model is combined with non-probabilistic theory for slope engineering, which expands the application field of calculation methods based on non-probabilistic theory and provides a new feasible scheme for slope stability analysis.
Author Contributions
Conceptualization, S.S.; methodology, J.Q.; software, J.Q.; formal analysis, Z.Y. and W.G.; investigation, Z.Y.; resources, S.S. and W.G.; data curation, K.P.; writing—original draft preparation, J.Q.; writing—review and editing, S.S.; supervision, S.S. All authors have read and agreed to the published version of the manuscript.
Funding
This research was funded by the National Natural Science Foundation of China (No. 52008319).
Institutional Review Board Statement
Not applicable.
Informed Consent Statement
Not applicable.
Data Availability Statement
Data is unavailable due to privacy or ethical restrictions.
Conflicts of Interest
The authors declare no conflict of interest.
References
- Mahmood, K.; Kim, J.M.; Ashraf, M.; Ziaurrehman. The effect of soil type on matric suction and stability of unsaturated slope under uniform rainfall. KSCE J. Civ. Eng. 2016, 20, 1294–1299. [Google Scholar] [CrossRef]
- Prakasam, C.R.A.; Nagarajan, B.; Kanwar, V.S. Site-specific geological and geotechnical investigation of a debris landslide along unstable road cut slopes in the Himalayan region, India. Geomat. Nat. Hazards Risk 2020, 11, 1827–1848. [Google Scholar] [CrossRef]
- Kardani, N.; Zhou, A.; Nazem, M.; Shen, S.-L. Improved prediction of slope stability using a hybrid stacking ensemble method based on finite element analysis and field data. J. Rock Mech. Geotech. Eng. 2021, 13, 188–201. [Google Scholar] [CrossRef]
- Pham, K.; Kim, D.; Park, S.; Choi, H. Ensemble learning-based classification models for slope stability analysis. Catena 2021, 196, 104886. [Google Scholar] [CrossRef]
- Ahangari Nanehkaran, Y.; Pusatli, T.; Chengyong, J.; Chen, J.; Cemiloglu, A.; Azarafza, M.; Derakhshani, R. Application of Machine Learning Techniques for the Estimation of the Safety Factor in Slope Stability Analysis. Water 2022, 14, 3743. [Google Scholar] [CrossRef]
- Ijaz, N.; Ye, W.; Rehman, Z.u.; Dai, F.; Ijaz, Z. Numerical study on stability of lignosulphonate-based stabilized surficial layer of unsaturated expansive soil slope considering hydro-mechanical effect. Transp. Geotech. 2022, 32, 100697. [Google Scholar] [CrossRef]
- Singh, P.; Bardhan, A.; Han, F.; Samui, P.; Zhang, W. A critical review of conventional and soft computing methods for slope stability analysis. Model. Earth Syst. Environ. 2023, 9, 1–17. [Google Scholar] [CrossRef]
- Liu, C.Y.; Zhang, J.Q.; Pan, G.; Song, H.C.; Liu, C.W. Non-Probabilistic Slope Stability Analysis. Adv. Mater. Res. 2011, 243–249, 5627–5631. [Google Scholar] [CrossRef]
- Yu, S.; Chen, Z.; Jiang, X.; Jiang, Y. Non-probabilistic Reliability Analysis of Rock Slope Stability Based on Interval Methods. J. Disaster Prev. Mitig. Eng. 2012, 32, 170–175. (In Chinese) [Google Scholar]
- Mu, H.S. Non-Probabilistic Reliability and Slope Stability Analysis. Appl. Mech. Mater. 2014, 578–579, 1538–1541. [Google Scholar] [CrossRef]
- Han, X.; Chen, H. Non-probabilistic Reliability Analysis Based on the Ellipsoidal Model of Rock Slope Stability. J. Xihua Univ. (Nat. Sci. Ed.) 2015, 34, 96–100. (In Chinese) [Google Scholar]
- Gao, L.-X.; Liang, B.; Wu, Z. Nonprobabilistic Reliability Solution Method of Slope Convex Set Model. J. Highw. Transp. Res. Dev. (Engl. Ed.) 2022, 16, 51–59. [Google Scholar] [CrossRef]
- Shu, S.; Qian, J.; Gong, W.; Pi, K.; Yang, Z. Non-Probabilistic Reliability Analysis of Slopes Based on Fuzzy Set Theory. Appl. Sci. 2023, 13, 7024. [Google Scholar] [CrossRef]
- Ni, B. Interval Process and Interval Field Models with Applications in Uncertainty Analysis of Structures. Ph.D. Thesis, Hunan University, Changsha, China, 2017. [Google Scholar]
- Ni, B.Y.; Jiang, C.; Han, X. An improved multidimensional parallelepiped non-probabilistic model for structural uncertainty analysis. Appl. Math. Model. 2016, 40, 4727–4745. [Google Scholar] [CrossRef]
- Lv, H.; Yang, K.; Yin, H.; Shangguan, W.; Yu, D. Inherent Characteristic Analysis of Powertrain Mounting SystemBased on Multidimensional Parallelepiped Model. Automot. Eng. 2020, 42, 498–504. (In Chinese) [Google Scholar]
- Zhao, M.-Y.; Yan, W.-J.; Yuen, K.-V.; Beer, M. Non-probabilistic uncertainty quantification for dynamic characterization functions using complex ratio interval arithmetic operation of multidimensional parallelepiped model. Mech. Syst. Signal Process. 2021, 156, 107559. [Google Scholar] [CrossRef]
- Zheng, J.; Luo, Z.; Jiang, C.; Ni, B.; Wu, J. Non-probabilistic reliability-based topology optimization with multidimensional parallelepiped convex model. Struct. Multidiscip. Optim. 2018, 57, 2205–2221. [Google Scholar] [CrossRef]
- Jena, S.K.; Chakraverty, S.; Malikan, M. Implementation of non-probabilistic methods for stability analysis of nonlocal beam with structural uncertainties. Eng. Comput. 2021, 37, 2957–2969. [Google Scholar] [CrossRef]
- Ni, B.Y.; Jiang, C.; Huang, Z.L. Discussions on non-probabilistic convex modelling for uncertain problems. Appl. Math. Model. 2018, 59, 54–85. [Google Scholar] [CrossRef]
- Jiang, C.; Fu, C.-M.; Ni, B.-Y.; Han, X. Interval arithmetic operations for uncertainty analysis with correlated interval variables. Acta Mech. Sin. 2016, 32, 743–752. [Google Scholar] [CrossRef]
- Wang, M.R.; Fan, J.P.; Hu, J. A non-probabilistic reliability-based design optimization method for structures based on interval models. Fatigue Fract. Eng. Mater. Struct. 2018, 41, 425–439. [Google Scholar] [CrossRef]
- Guo, S.; Zhang, L.; Li, Y. Procedures for Computing the Non-Probabilistic Reliability Index of Uncertain structures. Chin. J. Comput. Mech. 2005, 22, 227–231. (In Chinese) [Google Scholar]
- Gill, P.E.; Wong, E. Sequential Quadratic Programming Methods. In Mixed Integer Nonlinear Programming; Springer: New York, NY, USA, 2012; pp. 147–224. [Google Scholar]
- Fan, J.; Chen, X. Theoretical Analysis of Non-Probabilistic Reliability Based on Interval Model. Chin. J. Solid Mech. 2014, 35, 476–484. (In Chinese) [Google Scholar]
- Xia, Y.; Zhang, N.; Li, J.; Xu, D. The relationship between probabilistic and non-probabilistic reliability index of structure. J. Guangxi Univ. (Nat. Sci. Ed.) 2016, 41, 1279–1284. (In Chinese) [Google Scholar]
- McKay, M.D.; Beckman, R.J.; Conover, W.J. A Comparison of Three Methods for Selecting Values of Input Variables in the Analysis of Output From a Computer Code. Technometrics 2000, 42, 55–61. [Google Scholar] [CrossRef]
- Cho, S.E. Probabilistic Assessment of Slope Stability That Considers the Spatial Variability of Soil Properties. J. Geotech. Geoenviron. Eng. 2010, 136, 975–984. [Google Scholar] [CrossRef]
Disclaimer/Publisher’s Note: The statements, opinions and data contained in all publications are solely those of the individual author(s) and contributor(s) and not of MDPI and/or the editor(s). MDPI and/or the editor(s) disclaim responsibility for any injury to people or property resulting from any ideas, methods, instructions or products referred to in the content. |
© 2023 by the authors. Licensee MDPI, Basel, Switzerland. This article is an open access article distributed under the terms and conditions of the Creative Commons Attribution (CC BY) license (https://creativecommons.org/licenses/by/4.0/).