Abstract
The best approach to avoid collisions between adjacent structures during earthquakes is to provide sufficient spacing between them. However, the existing formulas for calculating the optimum seismic gap preventing pounding were found to provide inaccurate results upon the consideration of different soil types. The aim of this paper is to propose new equations for the evaluation of the sufficient in-between separation gap for buildings founded on different soil conditions. The double-difference formula has been taken into account in this study. The seismic gap depends on the correlation factor and on the top displacements of adjacent buildings. The correlation factor depends on the ratio of the periods of adjacent buildings (smaller period to larger period). The modification of the correlation factor has been introduced for buildings founded on five different soil types. Five soil types were taken into account in this study, as defined in the ASCE 7-10 code, i.e., hard rock, rock, very dense soil and soft rock, stiff soil, and soft clay soil. The normalized root mean square errors have been calculated for the proposed equations. The results of the study indicate that the error ranges between 2% and 14%, confirming the accuracy of the approach. Therefore, the proposed equations can be effectively used for the determination of the optimum seismic gap preventing earthquake-induced pounding between buildings founded on different soil types.
1. Introduction
One of the most dangerous phenomena occurring during earthquakes is related to the earthquake-induced structural pounding, which may have a significant effect on the response of colliding buildings [1,2,3,4] as well as on the damage state [5]. Structural pounding has been observed in different earthquakes. For instance, in the Mexico earthquake (1985), 40% of the damaged buildings experienced pounding, and, in 15% of the severely damaged or collapsed structures, pounding was found [6], where, in 20–30% of them, collisions could be the major reason of damage [7]. Indeed, in the Loma Prieta earthquake, pounding was experienced in 200 out of 500 surveyed buildings [8]. Moreover, collisions were also observed in recent earthquakes, such as in Lorca (Spain 2001) [9], Wenchuan (Sichuan Province in China in 2008) [10], Christchurch (New Zealand 2010) [11,12], Christchurch (2011) [13,14], and Gorkha (Nepal 2015) [15,16,17,18,19,20].
The research on earthquake-induced structural pounding, as well as on different methods to prevent it, has been conducted for more than three decades (see, for example, [21,22]). Pounding leads to the amplification in the peak interstorey drift (IDR), residual IDR, floor peak accelerations, shear forces, and impact forces, while the displacements may increase or decrease [23,24,25,26,27]. This amplification is significant in the direction of pounding and insignificant in the other directions [28]. The degree of amplification depends on the dynamic properties of colliding buildings, and this amplification is more significant when there is a major difference in the dynamic properties of colliding structures [1,29]. Also, the impact force depends on the earthquake characteristics as well as on the relation between the natural frequencies of the colliding buildings [30]. Indeed, in some studies [31,32], pounding was found to have a greater effect on the response of the flexible structure, as compared to the stiff one, and it was found to have a greater effect on the response of the stiff structure, as compared to the flexible one, in other studies [33]. Furthermore, using the Monte Carlo simulations based on Sobol’s method, Crozet et al. [34,35] found that the frequency ratio had the largest influence on the maximum impact force and ductility demands while the frequency and mass ratios had the largest influence on the impact impulse (mass ratio is predominant for low frequency range).
The in-between seismic gap has a significant influence on the response of colliding buildings. However, increasing the seismic gap does not necessarily lead to the reduction in the effects of pounding, unless it is large enough to totally eliminate structural collisions [28,33]. Several formulas have been suggested to evaluate the optimum seismic gap preventing pounding, i.e., the absolute sum (ABS) formula (Equation (1)) [36], square root of the sum of the squares (SRSS) formula (Equation (2)) [29], double-difference (DDC) formula (Equations (3) and (4)) [37], Australian Code formula (Equation (5)) [38], and Naderpour et al. formula (Equations (3) and (6)) [39].
where S is the sufficient seismic separation gap, U1, ξ1, and T1 are the design displacement, damping ratio, and natural period for the first building, and U2, ξ2, and T2 are the design displacement, damping ratio, and natural period for the second building (T1 < T2), respectively; stands for the correlation factor and Hmax is the height of the taller structure. The DDC formula involves the evaluation of the seismic gap based on the maximum displacements of both buildings and the correlation factor. The correlation factor represents the uncertainties in earthquake-induced structural pounding. The accurate estimation of the seismic gap between adjacent buildings based on the DDC formula requires a proper consideration of the uncertainties involved in the pounding phenomena. The correlation factor depends on the natural periods of adjacent buildings, which represent the dynamic properties of the vibrating structures, including the mass and the stiffness. Most of the studies concerning earthquake-induced structural pounding ignored the soil type and the soil–structure interaction (SSI). However, the SSI and the soil type have a significant influence on the response of vibrating buildings due to the fact that the flexibility induced by soil decreases the stiffness of the colliding buildings [40]. Furthermore, in the case of braced frames, taking into account fixed base buildings is considered conservative and it is not necessary to consider SSI. However, in the case of unbraced frames resting on soft soil, the consideration of the SSI is necessary. This refers to several factors, including the fact that the SSI has a significant influence on the interstorey drifts and the lateral deflections [41]. Moreover, through the comparison of the responses of unbraced frames resting on soft soil considering fixed base buildings as well as considering SSI, it can be concluded that the SSI significantly increases the interstorey drifts and decreases the base shear [42]. Indeed, the necessity of considering SSI increases as the shear wave velocity and shear modulus of the soil decrease [43,44,45]. Also, considering nonlinearity is important in SSI problems to obtain results with acceptable accuracy [46]. Because considering SSI can change the structural dominant frequency and lead to a mistuned mass damper, Wang et al. [47,48,49] developed advanced versions of mistuned mass dampers to adjust to the effects of considering SSI, to control human-induced vibrations, as well as to control the vibrations of base-isolated buildings. It is worth noting that several methods have been proposed for the numerical evaluation of the response of vibrating buildings taking into account SSI [45,50,51]. Also, several methods have been proposed for the experimental evaluation of the response of vibrating buildings taking into account SSI using the shaking table tests (see [52,53], for example). More details were reported in the literature, providing an in-depth description of considering SSI experimentally, describing the necessary procedure and equipment for the consideration of the SSI, including creating the physical model [54] and the soil mixture [55]. Furthermore, previous studies confirm that pounding is significant in the case of SSI as well as in the case of soil–pile–structure interaction [56,57]. Several contradictory results about the effects of the SSI on the response of colliding buildings have been reported in the literature. It was found that pounding with SSI leads to the increase in the displacements, shear forces, and impact forces in some studies (see [56,58,59,60,61,62,63], for example). However, in some other studies (see [64,65], for example), it was found that pounding with SSI leads to the decrease in the displacements, shear forces, and impact forces. The contradictory results referred to several factors that were overlooked in these studies, such as the soil type, since the effects of the soil type have been ignored in some studies and the fact that these studies considered different soil types.
Recently, Miari et al. [66,67,68] studied the effect of the soil type on the response of buildings experiencing floor-to-floor pounding during earthquakes. Five soil types have been considered in the investigation, as defined in the ASCE 7-10 code [69], i.e., hard rock, rock, very dense soil and soft rock, stiff soil, and soft clay soil. The results of the study show that pounding is more significant for the buildings founded on the soft clay soil than for buildings founded on stiff soil, than for buildings founded on very dense soil and soft rock, and finally for buildings founded on the rock and hard rock. Indeed, Miari et al. [70] studied the effects of the soil type on the response of buildings experiencing floor-to-column pounding where special attention has been paid to the shear demands of the impacted column (the column experiencing the hit from the top slab of the shorter building). The same five soil types have been taken into account. It was found that the shear demands of the impacted column significantly increase due to collisions. Also, it was found that the impacted column experiences higher shear demands for buildings founded on the soft clay soil than for buildings founded on the stiff soil, than for buildings founded on very dense soil and soft rock, and finally for buildings founded on the rock and hard rock. Moreover, Miari et al. [71] studied experimentally (using the shaking table tests) the effects of the soil type on the response of colliding buildings. Two steel-storey buildings with different dynamic properties have been considered in the case of pounding as well as the no-pounding case. Four seismic gaps and five earthquakes have been considered in the study. The same five soil types have been taken into account. The results of this study reveal that the soil type has a significant effect on the response of buildings in the case of pounding as well as in the no-pounding case. However, the soil type effect is more significant in the case of pounding than the no-pounding case. Furthermore, Miari et al. [72,73,74] investigated the accuracy of five different formulas (ABS, SRSS, DDC, Australian Code, and Naderpour et al. formula; see Equations (1)–(6)) in evaluating the seismic gap upon the consideration of different soil conditions. The same five soil types have been taken into account. It was found that the seismic gap has a significant influence on the response of colliding buildings. For all soil types, larger gaps do not necessarily lead to lower responses unless it is large enough to eliminate collisions at all (this finding was also emphasized by other works reported in the literature (see [28,33,71,75], for example)). The results of this study also show that all five formulas provide poor estimates when considering different soil types. The ABS and the Naderpour et al. formulas were found to be always conservative, but they overestimated the minimum gap. Moreover, the DDC and Australian Code formulas provided overestimate, accurate, and underestimate results, and the SRSS formula provided both accurate and overestimated results. Similar findings were reported concerning the Australian Code formula (Equation (5)) as it was found that it provides accurate results only in the case of the far-field earthquakes considering the in-between gap equal to 1% of the height of the taller building and not related to the height of the shorter building (see [76] for details). In the case of near-field earthquakes, or in the case when the gap was considered as equal to 1% of the height of the shorter building, the Australian Code formula (Equation (5) provides inaccurate results and underestimates the gap [76].
The aforementioned literature review illustrates that the soil types may have a significant effect on the response of colliding buildings under seismic excitation. Indeed, the currently used formulas for the evaluation of the seismic gap show the discrepancy between providing accurate, underestimate, and overestimate results upon the consideration of different types of soil. Thus, it is necessary to develop new accurate equations for the separation gap that are capable of eliminating collisions as well as taking the soil type into account. Therefore, the aim of this study is to propose new effective equations for the evaluation of the optimum seismic gap by introducing the modification of the correlation factor (see Equation (4)) for different soil types defined in the ASCE 7-10 code [69], i.e., for hard rock, rock, very dense soil and soft rock, stiff soil, and soft clay soil. By designing the buildings and providing separation between them based on the proposed equations, no collisions will occur between them, which means that providing spacing based on the proposed equations will provide more safety to the vibrating buildings during earthquakes.
2. Proposed Equations
In the process of modification of the correlation factor, 1260 pounding cases have been taken into account. In the study, 60 three-dimensional numerical models of concrete buildings have been considered. Table 1 presents the number of storeys, natural period, and frequency for each building. It should be noted that the natural period has been evaluated in the direction of possible pounding. Among these 60 numerical models, 1260 pounding cases have been considered. Table A1 in Appendix A presents a detailed description of these 1260 pounding cases, including the colliding buildings of every case as well as the period ratio between them. To generalize the proposed equations, the authors intended to consider multiple cases with varied situations and scenarios. The authors considered low-rise, mid-rise, and high-rise buildings (from 1-storey buildings up to 20-storey buildings). The torsional pounding was taken into account as well. All the cases have been studied considering five earthquake excitations. Considering the combination of all these factors has led to the generalizability of the proposed equations. These cases have concerned collisions between concrete buildings with different dynamic properties (see details in [66,67,72]), including different number of storeys (ranging from 1 storey up to 20 storeys). Among these buildings, 20 buildings have identical inertia in both directions x and y (ranging from 1 storey up to 20 storeys), 20 buildings have higher inertia in the x-direction (ranging from 1 storey up to 20 storeys), and 20 buildings have higher inertia in the y-direction (ranging from 1 storey up to 20 storeys). Figure 1 presents the plan views of the considered models. These buildings are reinforced concrete structures with a storey height of 3 m and with different lengths and widths. The shortest buildings were 3 m (one storey) and the highest buildings were 60 m (20 storeys). All the storey cases in between have been considered (buildings with 2 storeys, 3 storeys, 4 storeys, 5 storeys, up to 20 storey buildings). The properties of the material used in the models in this study are as follows: concrete with the compressive strength of 35 MPa and the modulus of elasticity of 27.8 Gpa, steel (grade 60) with the yield strength of 420 Mpa and the modulus of elasticity of 200 Gpa. Indeed, the live load was taken to be equal to 4 kN/m2 and the superimposed dead load was taken to be equal to 2 kN/m2. These values were taken considering the frequent use of such materials in construction sites. However, it should be underlined that they will not affect the accuracy of the proposed equations since the authors considered a wide range of natural structural periods, which is considered to be the main factor influencing the earthquake-induced structural pounding. Moreover, the buildings were designed to satisfy the minimum reinforcement requirements based on the ACI code (American Concrete Institute). The ACI code (in Section 10.9.1) states that the reinforcement ratio should be between 1% and 8% of the concrete area. In this study, the reinforcement ratio in the columns has been taken as equal to 1% to ensure both optimum and economic design. Also, the columns and beams were defined as frame elements, while slabs were modelled as shell elements. In this study, the frame element uses a general three-dimensional beam–column formulation that involves the effects of biaxial bending, torsion, axial deformation, and biaxial shear deformations (see [77] for details). Several damping ratios have been considered in this study so that the proposed equations will be valid for all ranges of damping ratios. All the buildings considered in this study have been modelled and designed solely for this study. The criteria of modelling have been verified using the results of shaking table experimental study [71]. For each pounding scenario, the displacement time histories for the level of possible contact (the level of the top storey of the shorter building) have been firstly obtained for both buildings vibrating independently under the specified ground motion. Then, the spacing required to avoid collisions has been calculated using Equation (7). In the next step, the peak displacements U1 and U2 have also been obtained for each building vibrating separately from the time history analyses. In this study, the DDC formula has been used (Equation (3)). The value of the correlation factor has been calculated based on Equation (8) (obtained from re-arranging of Equation (3)). This procedure has been performed for 1260 pounding cases for buildings exposed to 5 different earthquakes and founded on 5 different soil types.
where U1(t) is the displacement time history of the shorter building at the top storey and U2*(t) is the displacement time history of the taller building at the storey corresponding to the top storey of the shorter building; e.g., if pounding occurs between 4- and 6-storey buildings, U1(t) and U2*(t) concern the 4th storey of these two buildings, respectively.
S = max|U2*(t) − U1(t)|

Table 1.
Dynamic properties of the considered buildings.
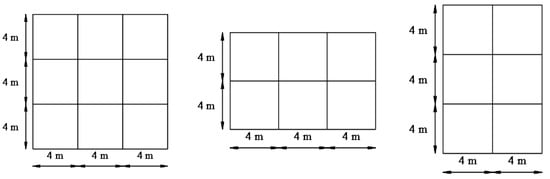
Figure 1.
Plan views of the considered models.
For instance, in the case of pounding between the 10-storey and 12-storey buildings (10–12 pounding scenario), the structures have been firstly studied when they vibrate independently. The displacement time histories of both buildings at the possible contact level (the level of the top storey of the shorter building, i.e., the level of 10th storey) have been obtained. In 10–12 pounding scenario, the U1(t) and U2*(t) correspond to the displacement time histories at the 10th storey of the 10-storey and 12-storey building, respectively. In the next step, using Equation (7), the spacing required to avoid collisions between them has been calculated. Then, U1 and U2, corresponding to the peak displacement of the 10-storey and the 12-storey buildings, respectively, have been determined. After calculating the values of U1 and U2, as well as the spacing S, the calculation of the correlation factor has been conducted using Equation (8).
Most seismic codes require a number of 2 to 4 independent ground motion simulations so as to obtain the average responses (see [78] for details). Therefore, five ground motions have been taken into account in this study (see Table 2) downloaded from the PEER website [79]. These ground motions are ground surface records. The authors have intentionally adopted different ground motions with different PGAs and frequency content to obtain insight into the issue of how different PGAs and frequency content may contribute to the dynamic response of colliding buildings. Also, different ground motions with significantly different PGAs have been considered to ensure that the proposed equations will be valid for large range of PGAs and not limited to a specific range of PGAs.
Table 2.
Earthquake records used in the study.
The correlation factor has been calculated for each of the 1260 cases under these five ground motions and then the average value has been determined. The analysis has been performed using ETABS software v.18 [80]. Then, the correlation factor has been plotted as a function of the ratio of the natural periods of both buildings T1/T2 (T1 < T2). The ratio of the natural periods has been taken into account since it is the primary factor affecting the earthquake-induced structural pounding [81]. Then, the curve defined by the proposed equation has been fitted into the data set of actual values using the method of least squares. The difference between the actual results and the results based on the proposed equation has been assessed by calculating the normalized root mean square (RMS) error presented in Equation (9) (see [82]):
where , are the actual value and the value obtained by using the proposed equation, respectively, and NV denotes the number of values in the data set. Several techniques have been followed for fitting the curves, including equations with different types: polynomial, power, linear, logarithmic, and exponential. The chosen equation is the one that leads to the lowest percentage of error that is reported in the paper. The whole procedure has been performed for five soil types, A, B, C, D, and E, defined in the ASCE 7-10 code [69] (see Table 3).
Table 3.
Definition of the site classes.
The soil type/site class has been considered by defining the response spectrum in ETABS software, and then by matching the earthquake records (defined in Table 2) with the target response spectrum. In the definition of the response spectrum, several parameters are required to be defined, which are the site class and the site properties. In this article, the value of Ss (mapped risk-targeted maximum considered earthquake spectral response acceleration parameter at short period) has been considered to be equal to 1.25, the value of S1 (mapped risk-targeted maximum considered earthquake spectral response acceleration parameter at 1 s period) has been considered to be equal to 0.5, and the value of TL (long transition long period) has been taken as equal to 8 s (see [66,67] for details). These values have been taken into account based on the studies conducted by Miari and Jankowski [66,67], involving extensive analysis on several scaling parameters, with the conclusion that these values lead to the highest and most significant responses. After defining these parameters, the response spectrum has been defined and the five ground motions have been scaled to the target response spectrum. The structural response has been obtained by applying the fast nonlinear analysis (FNA) method developed by Ibrahimbegovic and Wilson [83]. Jaradat and Far [84] conducted a pilot test using the direct integration, by Newmark (1959) and FNA methods. The test was conducted for the top floor relative displacement time histories for the no-pounding case. The results revealed a very good agreement between the two methods. Because of that, and considering that the FNA method consumes much less time unlike the Newmark method (which requires long period of time), the FNA method has been used in this study. In this method, the nonlinearity is considered for the gap and support elements while the linearity is considered for other elements. The dynamic equilibrium equation of the vibrating structure based on this method is shown in Equation (10).
where is the stiffness matrix for the linear elastic elements (all elements except for the gap and support elements); C is the proportional damping matrix; M is the diagonal mass matrix; (t) is the vector of forces from the nonlinear degrees of freedom (gap and support elements); , , and are vectors of the relative displacements, velocities, and accelerations with respect to the ground; and is the vector of ground motion accelerations. In this study, as no gap elements have been used, the nonlinearity has been considered only for the support elements. Also, (t) in Equation (10) is the vector of forces from the nonlinear degrees of freedom for the support elements. A time step of 0.001 s has been used in this study since it is considered to be small enough to satisfy the conditions of numerical stability and accuracy during collisions between adjacent buildings.
It should be highlighted at the end that all the buildings considered in this study are concrete buildings and the cases involve floor-to-floor pounding in both symmetric and torsional pounding. Steel and timber buildings were not considered in this study. Therefore, the proposed equations are valid for all kinds of concrete buildings that respond in the linear elastic range: in the cases of symmetric and torsional pounding and for all ranges of stiffnesses, masses, and damping ratios.
2.1. Soil Type A
In this section, the proposed equation for the correlation factor when the colliding buildings are founded on soil type A is presented. Figure 2 presents the plot of the correlation factor when the colliding buildings are founded on soil type A versus T1/T2. It can be seen that the plot is a piecewise function, and it is composed of two different functions. It can also be noticed that the correlation factor follows two different trends depending on whether T1 ≤ 0.2 s or T1 > 0.2 s (see Figure 2). Therefore, the proposed equation for the correlation factor when the colliding buildings are founded on soil type A is composed of two equations depending on whether T1 ≤ 0.2 s or T1 > 0.2 s (see Equation (11)). Figure 3 shows a comparison between the proposed equation (Equation (11)) and the actual values of the correlation factor obtained for different cases. Using Equation (9), the RMS error has been calculated as equal to 2.94% for T1 ≤ 0.2 s and 12.92% for T1 > 0.2 s.
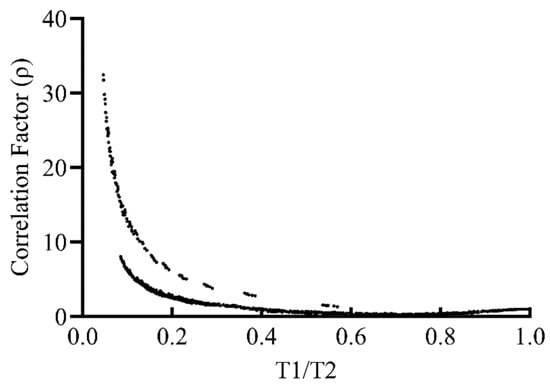
Figure 2.
The correlation factor when the colliding buildings are founded on soil type A versus T1/T2. All lines correspond to the same thing (correlation factor). The graph of the correlation factor is not continuous.
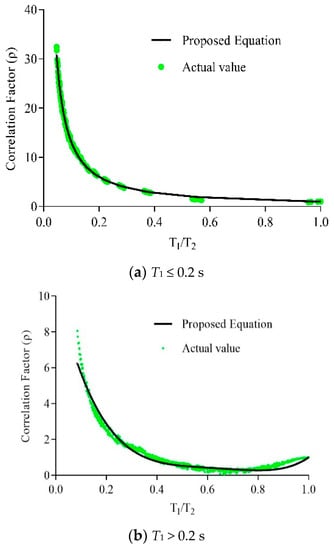
Figure 3.
Comparison between the actual trend and the proposed equation for the correlation factor when the colliding buildings are founded on soil type A.
2.2. Soil Type B
In this section, the proposed equation for the correlation factor when the colliding buildings are founded on soil type B is presented. Figure 4 presents the plot of the correlation factor when the colliding buildings are founded on soil type B versus T1/T2. It can be seen that the plot is a piecewise function, and it is composed of two different functions. It can also be noticed that the correlation factor follows two different trends depending on whether T1 ≤ 0.2 s or T1 > 0.2 s (see Figure 4). Therefore, the proposed equation for the correlation factor when the colliding buildings are founded on soil type B is composed of two equations depending on whether T1 ≤ 0.2 s or T1 > 0.2 s. After fitting the curves, it has been found that the equation for the correlation factor, when the colliding buildings are founded on soil type B, is the same equation for the correlation factor when the colliding buildings are founded on soil type A (see Equation (11)). Figure 5 shows a comparison between the proposed equation (Equation (11)) and the actual values of the correlation factor obtained for different cases. Using Equation (9), the RMS error has been calculated as equal to 3.00% for T1 ≤ 0.2 s and 13.17% for T1 > 0.2 s.
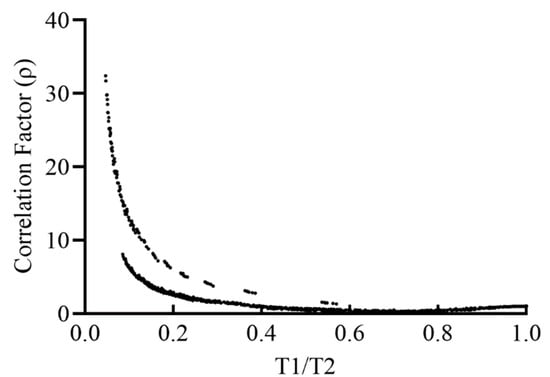
Figure 4.
The correlation factor when the colliding buildings are founded on soil type B versus T1/T2. Both lines correspond to the same thing (correlation factor). The graph of the correlation factor is not continuous.
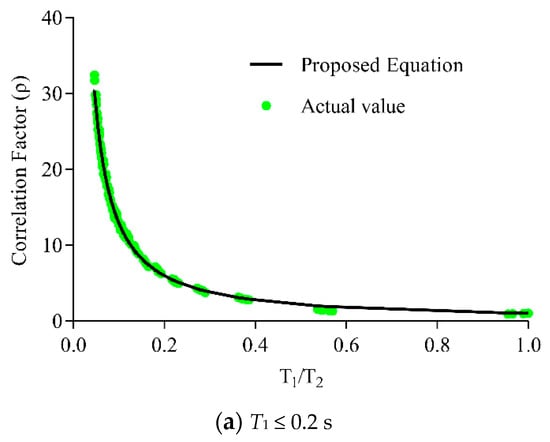
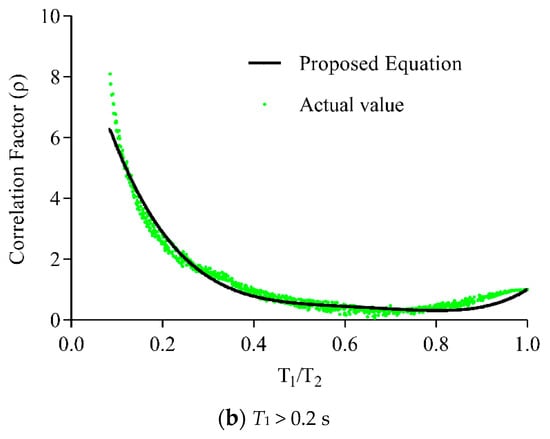
Figure 5.
Comparison between the actual trend and the proposed equation for the correlation factor when the colliding buildings are founded on soil type B.
2.3. Soil Type C
In this section, the proposed equation for the correlation factor when the colliding buildings are founded on soil type C is presented. Figure 6 presents the plot of the correlation factor when the colliding buildings are founded on soil type C versus T1/T2. It can be seen that the plot is a piecewise function, and it is composed of three different functions. It can also be noticed that the correlation factor follows three different trends depending on whether T1 ≤ 0.2 s, 0.2 s < T1 ≤ 0.4 s, or T1 > 0.4 s (see Figure 6). Therefore, the proposed equation for the correlation factor when the colliding buildings are founded on soil type C is composed of three equations depending on whether T1 ≤ 0.2 s, 0.2 s < T1 ≤ 0.4 s, or T1 > 0.4 s (see Equation (12)). Figure 7 shows a comparison between the proposed equation (Equation (12)) and the actual values of the correlation factor obtained for different cases. Using Equation (9), the RMS error has been calculated as equal to 7.00% for T1 ≤ 0.2 s, 2.98% for 0.2 s < T1 ≤ 0.4 s, and 6.31% for T1 > 0.4 s.
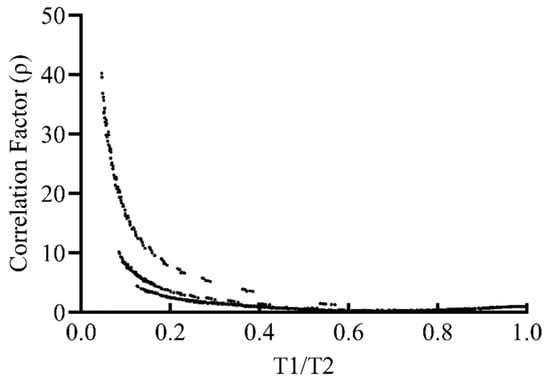
Figure 6.
The correlation factor when the colliding buildings are founded on soil type C versus T1/T2. All lines correspond to the same thing (correlation factor). The graph of the correlation factor is not continuous.
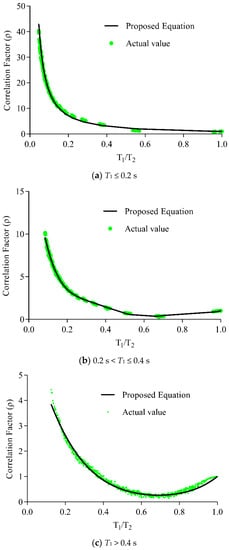
Figure 7.
Comparison between the actual trend and the proposed equation for the correlation factor when the colliding buildings are founded on soil type C.
2.4. Soil Type D
In this section, the proposed equation for the correlation factor when the colliding buildings are founded on soil type D is presented. Figure 8 presents the plot of the correlation factor when the colliding buildings are founded on soil type D versus T1/T2. It can be seen that the plot is a piecewise function, and it is composed of three different functions. It can also be noticed that the correlation factor follows three different trends depending on whether T1 ≤ 0.2 s, 0.2 s < T1 ≤ 0.4 s, or T1 > 0.4 s (see Figure 8). Therefore, the proposed equation for the correlation factor when the colliding buildings are founded on soil type D is composed of three equations depending on whether T1 ≤ 0.2 s, 0.2 s < T1 ≤ 0.4 s, or T1 > 0.4 s (see Equation (13)). Figure 9 shows a comparison between the proposed equation (Equation (13)) and the actual values of the correlation factor obtained for different cases. Using Equation (9), the RMS error has been calculated as equal to 10.37% for T1 ≤ 0.2 s, 3.59% for 0.2 s < T1 ≤ 0.4 s, and 10.03% for T1 > 0.4 s.
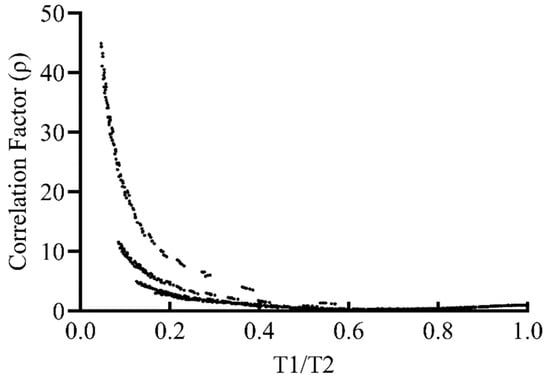
Figure 8.
The correlation factor when the colliding buildings are founded on soil type D versus T1/T2. All lines correspond to the same thing (correlation factor). The graph of the correlation factor is not continuous.
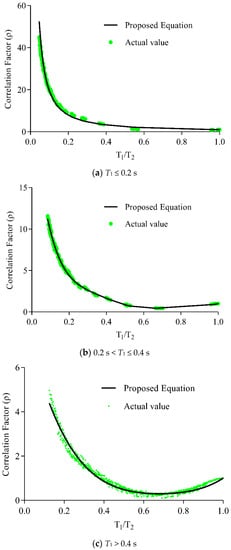
Figure 9.
Comparison between the actual trend and the proposed equation for the correlation factor when the colliding buildings are founded on soil type D.
2.5. Soil Type E
In this section, the proposed equation for the correlation factor when the colliding buildings are founded on soil type E is presented. Figure 10 presents the plot of the correlation factor when the colliding buildings are founded on soil type D versus T1/T2. It can be seen that the plot is a piecewise function, and it is composed of three different functions. It can also be noticed that the correlation factor follows three different trends depending on whether T1 ≤ 0.2 s, 0.2 s < T1 ≤ 0.4 s, or T1 > 0.4 s (see Figure 10). Therefore, the proposed equation for the correlation factor when the colliding buildings are founded on soil type D is composed of three equations depending on whether T1 ≤ 0.2 s, 0.2 s < T1 ≤ 0.4 s, or T1 > 0.4 s (see Equation (14)). Figure 11 shows a comparison between the proposed equation (Equation (14)) and the actual values of the correlation factor obtained for different cases. Using Equation (9), the RMS error has been calculated as equal to 7.00% for T1 ≤ 0.2 s, 2.98% for 0.2 s < T1 ≤ 0.4 s, and 8.30% for T1 > 0.4 s. It should be noted at the end that, if the calculation based on the proposed correlation factors results in a negative value of the term , then the absolute value should be taken into account for the calculation of the spacing S.
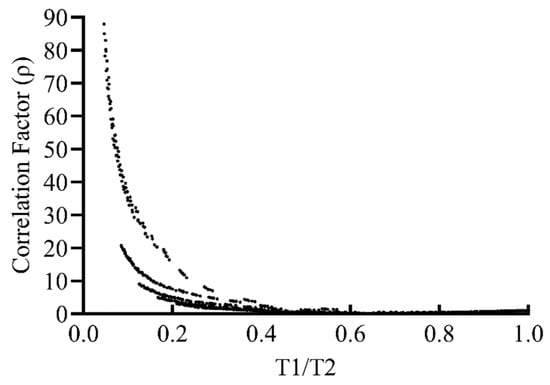
Figure 10.
The correlation factor when the colliding buildings are founded on soil type E versus T1/T2. All lines correspond to the same thing (correlation factor). The graph of the correlation factor is not continuous.
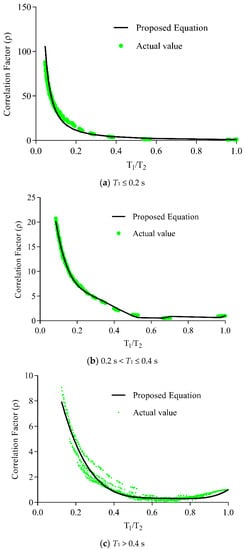
Figure 11.
Comparison between the actual trend and the proposed equation for the correlation factor when the colliding buildings are founded on soil type E.
3. Verification of the Effectiveness of the Proposed Equations
In this section, the effectiveness of the proposed equations is verified by comparing them with the equations existing in the literature. Table 4 considers a few pounding cases between buildings number 21–26 (see Table 1) founded on different soil types. Table 4 presents the exact required seismic gap to avoid collisions based on Equation (8), the gap calculated using equations proposed in this study, and the ratio between them. When this ratio is equal or close to 1, it means that the equation is accurate, while, when the ratio is much larger or much smaller than 1, it means that the equation is not accurate. It can be seen that the ratio of the gap using the equations proposed in this study and the exact required seismic gap to avoid collisions ranges between 0.99 and 1.34 and, in most cases, is close to 1. This means that the proposed equations are effective in calculating the accuracy of the seismic gap. Indeed, Table 5 presents the comparison between the seismic gap calculated using the ABS formula (Equation (1)) and the exact required seismic gap to avoid collisions based on Equation (8) as well as the ratio between them. It can be seen that the ratio of the gap calculated using the ABS formula and the exact required seismic gap to avoid collisions ranges between 1.55 and 3.74. This means that the ABS formula significantly overestimates the gap for the considered cases and the proposed equations provide better accuracy than the ABS formula. Also, Table 6 presents the comparison between the seismic gap calculated using the SRSS formula (Equation (2)) and the exact required seismic gap to avoid collisions based on Equation (8) as well as the ratio between them. It can be seen that the ratio of the gap calculated using the SRSS formula and the exact required seismic gap to avoid collisions ranges between 1.18 and 3.53. This means that the SRSS formula significantly overestimates the gap for the considered cases and the proposed equations provide better accuracy than the SRSS formula. Also, Table 7 presents the comparison between the seismic gap calculated using the DDC formula (Equations (3) and (4)) and the exact required seismic gap to avoid collisions based on Equation (8) as well as the ratio between them. It can be seen that the ratio of the gap calculated using the DDC formula and the exact required seismic gap to avoid collisions ranges between 1.18 and 3.53. This means that the DDC formula significantly overestimates the gap for the considered cases and the proposed equations provide better accuracy than the DDC formula. Moreover, Table 8 presents the comparison between the seismic gap calculated using the Australian Code formula (Equation (5)) and the exact required seismic gap to avoid collisions based on Equation (8) as well as the ratio between them. It can be seen that the ratio of the gap calculated using the Australian Code formula and the exact required seismic gap to avoid collisions ranges between 0.74 and 14.81. This means that the Australian Code formula provides both accurate results as well as significantly overestimated results and the proposed equations provide better accuracy than the Australian Code formula. Furthermore, Table 9 presents the comparison between the seismic gap calculated using the Naderpour et al. [39] formula (Equations (4) and (6)) and the exact required seismic gap to avoid collisions based on Equation (8) as well as the ratio between them. It can be seen that the ratio of the gap calculated using the Naderpour et al. [39] formula and the exact required seismic gap to avoid collisions ranges between 1.43 and 3.88. This means that the Naderpour et al. [39] formula significantly overestimates the gap for the considered cases and the proposed equations provide better accuracy than the Naderpour et al. [39] formula. Miari and Jankowski [72] have extensively studied these formulas and it was found that these formulas provide accurate, underestimate, and overestimate results. The equations for the seismic gap proposed in this study aim to provide more accurate results.
Table 4.
Comparison between the exact required gap and the gap evaluated by the proposed equations.
Table 5.
Comparison between the exact required gap and the gap evaluated by the ABS formula.
Table 6.
Comparison between the exact required gap and the gap evaluated by the SRSS formula.
Table 7.
Comparison between the exact required gap and the gap evaluated by the DDC formula.
Table 8.
Comparison between the exact required gap and the gap evaluated by the Australian Code formula.
Table 9.
Comparison between the exact required gap and the gap evaluated by the Naderpour et al. [39] formula.
4. Conclusions
In this paper, new equations for the evaluation of the optimum seismic gap preventing earthquake-induced pounding between adjacent buildings founded on different soil conditions have been proposed. The DDC formula has been taken into consideration and the modification of the correlation factor has been introduced. In the study, 1260 cases of pounding between different concrete buildings with various dynamic properties have been considered under five ground motions. Five soil types have been taken into account, as defined in the ASCE 7-10 code [69], i.e., hard rock, rock, very dense soil and soft rock, stiff soil, and soft clay soil. The normalized RMS errors have been calculated for the proposed equations. The results of the study indicate that the error ranges between 2% and 14%, confirming the accuracy of the approach. Therefore, the proposed equations can be effectively used for the determination of the optimum seismic gap preventing earthquake-induced pounding between buildings founded on different soil types. The current equations existing in the literature consider only one equation for the separation distance regardless of the soil type, which means that the same equation is supposed to be valid no matter the soil type. However, the proposed equations are multiple equations where every equation corresponds to a certain soil type, which means that the selection of the equation to be used is dependent on the soil type that the buildings are founded on. By designing the buildings and providing separation between them based on the proposed equations, no collisions will occur between them, which means that providing spacing based on the proposed equations will provide more safety to the vibrating buildings during earthquakes. Since only concrete buildings are considered in this study, it can be said that the accuracy of the formulas is verified for concrete buildings and for concrete-to-concrete pounding. The accuracy of these formulas has to be investigated for other kinds of pounding, such as steel-to-steel pounding and timber-to-timber pounding, and compared with the formulas existing in the literature. The current formulas existing in the literature can be less or more accurate than the proposed equations in other kinds of pounding, such as steel-to-steel pounding and timber-to-timber pounding. Since the equations are based on natural periods, they should also be valid for steel and timber structures. However, further checking and verification are necessary. Also, checking the accuracy of the proposed equations compared with the current formulas existing in the literature in the case of direct integration nonlinear analyses rather than fast nonlinear analyses (FNAs) is required. Finally, an experimental verification of the proposed equations is necessary. The experimental verification can be completed using the shaking table by simulating two models placed with a separation distance based on the proposed equations and checking if pounding occurs or not.
Author Contributions
M.M.: Conceptualization, Methodology, Formal analysis, Investigation, Writing—Original Draft. R.J.: Supervision, Writing—Review & Editing. All authors have read and agreed to the published version of the manuscript.
Funding
The first author (Mahmoud Miari) gratefully acknowledges the financial support of this research from the “Doctoral Scholarship” awarded from Gdańsk University of Technology.
Institutional Review Board Statement
Not applicable.
Informed Consent Statement
Not applicable.
Data Availability Statement
All the data are included in the article.
Conflicts of Interest
The authors declare no conflict of interest.
Appendix A
Table A1.
Pounding cases considered in this study.
Table A1.
Pounding cases considered in this study.
| Pounding Case | Building 1 | Building 2 | Period Ratio |
|---|---|---|---|
| 1 | 1 | 1 | 1.000 |
| 2 | 1 | 2 | 0.548 |
| 3 | 1 | 3 | 0.372 |
| 4 | 1 | 4 | 0.280 |
| 5 | 1 | 5 | 0.224 |
| 6 | 1 | 6 | 0.186 |
| 7 | 1 | 7 | 0.159 |
| 8 | 1 | 8 | 0.139 |
| 9 | 1 | 9 | 0.123 |
| 10 | 1 | 10 | 0.110 |
| 11 | 1 | 11 | 0.100 |
| 12 | 1 | 12 | 0.091 |
| 13 | 1 | 13 | 0.083 |
| 14 | 1 | 14 | 0.077 |
| 15 | 1 | 15 | 0.071 |
| 16 | 1 | 16 | 0.066 |
| 17 | 1 | 17 | 0.062 |
| 18 | 1 | 18 | 0.058 |
| 19 | 1 | 19 | 0.054 |
| 20 | 1 | 20 | 0.051 |
| 21 | 1 | 21 | 1.046 |
| 22 | 1 | 22 | 0.570 |
| 23 | 1 | 23 | 0.386 |
| 24 | 1 | 24 | 0.290 |
| 25 | 1 | 25 | 0.232 |
| 26 | 1 | 26 | 0.193 |
| 27 | 1 | 27 | 0.165 |
| 28 | 1 | 28 | 0.144 |
| 29 | 1 | 29 | 0.127 |
| 30 | 1 | 30 | 0.114 |
| 31 | 1 | 31 | 0.103 |
| 32 | 1 | 32 | 0.094 |
| 33 | 1 | 33 | 0.086 |
| 34 | 1 | 34 | 0.079 |
| 35 | 1 | 35 | 0.074 |
| 36 | 1 | 36 | 0.068 |
| 37 | 1 | 37 | 0.064 |
| 38 | 1 | 38 | 0.060 |
| 39 | 1 | 39 | 0.056 |
| 40 | 1 | 40 | 0.053 |
| 41 | 1 | 41 | 1.036 |
| 42 | 1 | 42 | 0.562 |
| 43 | 1 | 43 | 0.379 |
| 44 | 1 | 44 | 0.285 |
| 45 | 1 | 45 | 0.227 |
| 46 | 1 | 46 | 0.189 |
| 47 | 1 | 47 | 0.161 |
| 48 | 1 | 48 | 0.140 |
| 49 | 1 | 49 | 0.123 |
| 50 | 1 | 50 | 0.110 |
| 51 | 1 | 51 | 0.099 |
| 52 | 1 | 52 | 0.090 |
| 53 | 1 | 53 | 0.082 |
| 54 | 1 | 54 | 0.075 |
| 55 | 1 | 55 | 0.069 |
| 56 | 1 | 56 | 0.064 |
| 57 | 1 | 57 | 0.060 |
| 58 | 1 | 58 | 0.056 |
| 59 | 1 | 59 | 0.052 |
| 60 | 1 | 60 | 0.049 |
| 61 | 2 | 2 | 1.000 |
| 62 | 2 | 3 | 0.678 |
| 63 | 2 | 4 | 0.510 |
| 64 | 2 | 5 | 0.409 |
| 65 | 2 | 6 | 0.340 |
| 66 | 2 | 7 | 0.291 |
| 67 | 2 | 8 | 0.254 |
| 68 | 2 | 9 | 0.224 |
| 69 | 2 | 10 | 0.201 |
| 70 | 2 | 11 | 0.182 |
| 71 | 2 | 12 | 0.166 |
| 72 | 2 | 13 | 0.152 |
| 73 | 2 | 14 | 0.140 |
| 74 | 2 | 15 | 0.130 |
| 75 | 2 | 16 | 0.121 |
| 76 | 2 | 17 | 0.113 |
| 77 | 2 | 18 | 0.105 |
| 78 | 2 | 19 | 0.099 |
| 79 | 2 | 20 | 0.093 |
| 80 | 2 | 22 | 1.039 |
| 81 | 2 | 23 | 0.703 |
| 82 | 2 | 24 | 0.529 |
| 83 | 2 | 25 | 0.423 |
| 84 | 2 | 26 | 0.352 |
| 85 | 2 | 27 | 0.301 |
| 86 | 2 | 28 | 0.262 |
| 87 | 2 | 29 | 0.232 |
| 88 | 2 | 30 | 0.208 |
| 89 | 2 | 31 | 0.188 |
| 90 | 2 | 32 | 0.171 |
| 91 | 2 | 33 | 0.157 |
| 92 | 2 | 34 | 0.145 |
| 93 | 2 | 35 | 0.134 |
| 94 | 2 | 36 | 0.125 |
| 95 | 2 | 37 | 0.117 |
| 96 | 2 | 38 | 0.109 |
| 97 | 2 | 39 | 0.103 |
| 98 | 2 | 40 | 0.097 |
| 99 | 2 | 42 | 1.025 |
| 100 | 2 | 43 | 0.691 |
| 101 | 2 | 44 | 0.519 |
| 102 | 2 | 45 | 0.414 |
| 103 | 2 | 46 | 0.344 |
| 104 | 2 | 47 | 0.293 |
| 105 | 2 | 48 | 0.255 |
| 106 | 2 | 49 | 0.225 |
| 107 | 2 | 50 | 0.200 |
| 108 | 2 | 51 | 0.180 |
| 109 | 2 | 52 | 0.164 |
| 110 | 2 | 53 | 0.149 |
| 111 | 2 | 54 | 0.137 |
| 112 | 2 | 55 | 0.127 |
| 113 | 2 | 56 | 0.117 |
| 114 | 2 | 57 | 0.109 |
| 115 | 2 | 58 | 0.101 |
| 116 | 2 | 59 | 0.095 |
| 117 | 2 | 60 | 0.089 |
| 118 | 3 | 3 | 1.000 |
| 119 | 3 | 4 | 0.753 |
| 120 | 3 | 5 | 0.603 |
| 121 | 3 | 6 | 0.502 |
| 122 | 3 | 7 | 0.429 |
| 123 | 3 | 8 | 0.374 |
| 124 | 3 | 9 | 0.331 |
| 125 | 3 | 10 | 0.297 |
| 126 | 3 | 11 | 0.268 |
| 127 | 3 | 12 | 0.244 |
| 128 | 3 | 13 | 0.224 |
| 129 | 3 | 14 | 0.207 |
| 130 | 3 | 15 | 0.191 |
| 131 | 3 | 16 | 0.178 |
| 132 | 3 | 17 | 0.166 |
| 133 | 3 | 18 | 0.156 |
| 134 | 3 | 19 | 0.146 |
| 135 | 3 | 20 | 0.138 |
| 136 | 3 | 23 | 1.038 |
| 137 | 3 | 24 | 0.781 |
| 138 | 3 | 25 | 0.625 |
| 139 | 3 | 26 | 0.520 |
| 140 | 3 | 27 | 0.444 |
| 141 | 3 | 28 | 0.387 |
| 142 | 3 | 29 | 0.343 |
| 143 | 3 | 30 | 0.307 |
| 144 | 3 | 31 | 0.277 |
| 145 | 3 | 32 | 0.253 |
| 146 | 3 | 33 | 0.232 |
| 147 | 3 | 34 | 0.214 |
| 148 | 3 | 35 | 0.198 |
| 149 | 3 | 36 | 0.184 |
| 150 | 3 | 37 | 0.172 |
| 151 | 3 | 38 | 0.161 |
| 152 | 3 | 39 | 0.151 |
| 153 | 3 | 40 | 0.142 |
| 154 | 3 | 43 | 1.020 |
| 155 | 3 | 44 | 0.766 |
| 156 | 3 | 45 | 0.611 |
| 157 | 3 | 46 | 0.507 |
| 158 | 3 | 47 | 0.432 |
| 159 | 3 | 48 | 0.376 |
| 160 | 3 | 49 | 0.331 |
| 161 | 3 | 50 | 0.296 |
| 162 | 3 | 51 | 0.266 |
| 163 | 3 | 52 | 0.242 |
| 164 | 3 | 53 | 0.221 |
| 165 | 3 | 54 | 0.203 |
| 166 | 3 | 55 | 0.187 |
| 167 | 3 | 56 | 0.173 |
| 168 | 3 | 57 | 0.161 |
| 169 | 3 | 58 | 0.150 |
| 170 | 3 | 59 | 0.140 |
| 171 | 3 | 60 | 0.131 |
| 172 | 4 | 4 | 1.000 |
| 173 | 4 | 5 | 0.801 |
| 174 | 4 | 6 | 0.666 |
| 175 | 4 | 7 | 0.570 |
| 176 | 4 | 8 | 0.497 |
| 177 | 4 | 9 | 0.440 |
| 178 | 4 | 10 | 0.394 |
| 179 | 4 | 11 | 0.356 |
| 180 | 4 | 12 | 0.324 |
| 181 | 4 | 13 | 0.298 |
| 182 | 4 | 14 | 0.274 |
| 183 | 4 | 15 | 0.254 |
| 184 | 4 | 16 | 0.236 |
| 185 | 4 | 17 | 0.221 |
| 186 | 4 | 18 | 0.207 |
| 187 | 4 | 19 | 0.194 |
| 188 | 4 | 20 | 0.183 |
| 189 | 4 | 24 | 1.037 |
| 190 | 4 | 25 | 0.829 |
| 191 | 4 | 26 | 0.690 |
| 192 | 4 | 27 | 0.590 |
| 193 | 4 | 28 | 0.514 |
| 194 | 4 | 29 | 0.455 |
| 195 | 4 | 30 | 0.407 |
| 196 | 4 | 31 | 0.368 |
| 197 | 4 | 32 | 0.336 |
| 198 | 4 | 33 | 0.308 |
| 199 | 4 | 34 | 0.284 |
| 200 | 4 | 35 | 0.263 |
| 201 | 4 | 36 | 0.245 |
| 202 | 4 | 37 | 0.228 |
| 203 | 4 | 38 | 0.214 |
| 204 | 4 | 39 | 0.201 |
| 205 | 4 | 40 | 0.189 |
| 206 | 4 | 44 | 1.017 |
| 207 | 4 | 45 | 0.812 |
| 208 | 4 | 46 | 0.674 |
| 209 | 4 | 47 | 0.574 |
| 210 | 4 | 48 | 0.499 |
| 211 | 4 | 49 | 0.440 |
| 212 | 4 | 50 | 0.393 |
| 213 | 4 | 51 | 0.354 |
| 214 | 4 | 52 | 0.321 |
| 215 | 4 | 53 | 0.293 |
| 216 | 4 | 54 | 0.269 |
| 217 | 4 | 55 | 0.248 |
| 218 | 4 | 56 | 0.230 |
| 219 | 4 | 57 | 0.213 |
| 220 | 4 | 58 | 0.199 |
| 221 | 4 | 59 | 0.186 |
| 222 | 4 | 60 | 0.174 |
| 223 | 5 | 5 | 1.000 |
| 224 | 5 | 6 | 0.832 |
| 225 | 5 | 7 | 0.711 |
| 226 | 5 | 8 | 0.620 |
| 227 | 5 | 9 | 0.549 |
| 228 | 5 | 10 | 0.492 |
| 229 | 5 | 11 | 0.444 |
| 230 | 5 | 12 | 0.405 |
| 231 | 5 | 13 | 0.371 |
| 232 | 5 | 14 | 0.342 |
| 233 | 5 | 15 | 0.317 |
| 234 | 5 | 16 | 0.295 |
| 235 | 5 | 17 | 0.276 |
| 236 | 5 | 18 | 0.258 |
| 237 | 5 | 19 | 0.242 |
| 238 | 5 | 20 | 0.228 |
| 239 | 5 | 25 | 1.035 |
| 240 | 5 | 26 | 0.862 |
| 241 | 5 | 27 | 0.736 |
| 242 | 5 | 28 | 0.642 |
| 243 | 5 | 29 | 0.568 |
| 244 | 5 | 30 | 0.509 |
| 245 | 5 | 31 | 0.460 |
| 246 | 5 | 32 | 0.419 |
| 247 | 5 | 33 | 0.384 |
| 248 | 5 | 34 | 0.354 |
| 249 | 5 | 35 | 0.328 |
| 250 | 5 | 36 | 0.305 |
| 251 | 5 | 37 | 0.285 |
| 252 | 5 | 38 | 0.267 |
| 253 | 5 | 39 | 0.251 |
| 254 | 5 | 40 | 0.236 |
| 255 | 5 | 45 | 1.013 |
| 256 | 5 | 46 | 0.841 |
| 257 | 5 | 47 | 0.717 |
| 258 | 5 | 48 | 0.623 |
| 259 | 5 | 49 | 0.549 |
| 260 | 5 | 50 | 0.490 |
| 261 | 5 | 51 | 0.441 |
| 262 | 5 | 52 | 0.401 |
| 263 | 5 | 53 | 0.366 |
| 264 | 5 | 54 | 0.336 |
| 265 | 5 | 55 | 0.310 |
| 266 | 5 | 56 | 0.287 |
| 267 | 5 | 57 | 0.266 |
| 268 | 5 | 58 | 0.248 |
| 269 | 5 | 59 | 0.232 |
| 270 | 5 | 60 | 0.217 |
| 271 | 6 | 6 | 1.000 |
| 272 | 6 | 7 | 0.855 |
| 273 | 6 | 8 | 0.746 |
| 274 | 6 | 9 | 0.660 |
| 275 | 6 | 10 | 0.591 |
| 276 | 6 | 11 | 0.534 |
| 277 | 6 | 12 | 0.487 |
| 278 | 6 | 13 | 0.447 |
| 279 | 6 | 14 | 0.412 |
| 280 | 6 | 15 | 0.381 |
| 281 | 6 | 16 | 0.355 |
| 282 | 6 | 17 | 0.331 |
| 283 | 6 | 18 | 0.310 |
| 284 | 6 | 19 | 0.291 |
| 285 | 6 | 20 | 0.274 |
| 286 | 6 | 26 | 1.036 |
| 287 | 6 | 27 | 0.885 |
| 288 | 6 | 28 | 0.772 |
| 289 | 6 | 29 | 0.683 |
| 290 | 6 | 30 | 0.612 |
| 291 | 6 | 31 | 0.553 |
| 292 | 6 | 32 | 0.504 |
| 293 | 6 | 33 | 0.462 |
| 294 | 6 | 34 | 0.426 |
| 295 | 6 | 35 | 0.395 |
| 296 | 6 | 36 | 0.367 |
| 297 | 6 | 37 | 0.343 |
| 298 | 6 | 38 | 0.321 |
| 299 | 6 | 39 | 0.302 |
| 300 | 6 | 40 | 0.284 |
| 301 | 6 | 46 | 1.011 |
| 302 | 6 | 47 | 0.861 |
| 303 | 6 | 48 | 0.749 |
| 304 | 6 | 49 | 0.660 |
| 305 | 6 | 50 | 0.589 |
| 306 | 6 | 51 | 0.531 |
| 307 | 6 | 52 | 0.482 |
| 308 | 6 | 53 | 0.440 |
| 309 | 6 | 54 | 0.404 |
| 310 | 6 | 55 | 0.372 |
| 311 | 6 | 56 | 0.344 |
| 312 | 6 | 57 | 0.320 |
| 313 | 6 | 58 | 0.298 |
| 314 | 6 | 59 | 0.278 |
| 315 | 6 | 60 | 0.261 |
| 316 | 7 | 7 | 1.000 |
| 317 | 7 | 8 | 0.872 |
| 318 | 7 | 9 | 0.771 |
| 319 | 7 | 10 | 0.691 |
| 320 | 7 | 11 | 0.625 |
| 321 | 7 | 12 | 0.569 |
| 322 | 7 | 13 | 0.522 |
| 323 | 7 | 14 | 0.481 |
| 324 | 7 | 15 | 0.446 |
| 325 | 7 | 16 | 0.415 |
| 326 | 7 | 17 | 0.387 |
| 327 | 7 | 18 | 0.363 |
| 328 | 7 | 19 | 0.340 |
| 329 | 7 | 20 | 0.320 |
| 330 | 7 | 27 | 1.035 |
| 331 | 7 | 28 | 0.902 |
| 332 | 7 | 29 | 0.798 |
| 333 | 7 | 30 | 0.715 |
| 334 | 7 | 31 | 0.646 |
| 335 | 7 | 32 | 0.589 |
| 336 | 7 | 33 | 0.540 |
| 337 | 7 | 34 | 0.498 |
| 338 | 7 | 35 | 0.462 |
| 339 | 7 | 36 | 0.429 |
| 340 | 7 | 37 | 0.401 |
| 341 | 7 | 38 | 0.375 |
| 342 | 7 | 39 | 0.353 |
| 343 | 7 | 40 | 0.332 |
| 344 | 7 | 47 | 1.007 |
| 345 | 7 | 48 | 0.875 |
| 346 | 7 | 49 | 0.772 |
| 347 | 7 | 50 | 0.689 |
| 348 | 7 | 51 | 0.620 |
| 349 | 7 | 52 | 0.563 |
| 350 | 7 | 53 | 0.514 |
| 351 | 7 | 54 | 0.472 |
| 352 | 7 | 55 | 0.435 |
| 353 | 7 | 56 | 0.403 |
| 354 | 7 | 57 | 0.374 |
| 355 | 7 | 58 | 0.348 |
| 356 | 7 | 59 | 0.326 |
| 357 | 7 | 60 | 0.305 |
| 358 | 8 | 8 | 1.000 |
| 359 | 8 | 9 | 0.885 |
| 360 | 8 | 10 | 0.793 |
| 361 | 8 | 11 | 0.716 |
| 362 | 8 | 12 | 0.653 |
| 363 | 8 | 13 | 0.599 |
| 364 | 8 | 14 | 0.552 |
| 365 | 8 | 15 | 0.512 |
| 366 | 8 | 16 | 0.476 |
| 367 | 8 | 17 | 0.444 |
| 368 | 8 | 18 | 0.416 |
| 369 | 8 | 19 | 0.390 |
| 370 | 8 | 20 | 0.368 |
| 371 | 8 | 28 | 1.035 |
| 372 | 8 | 29 | 0.916 |
| 373 | 8 | 30 | 0.820 |
| 374 | 8 | 31 | 0.741 |
| 375 | 8 | 32 | 0.676 |
| 376 | 8 | 33 | 0.620 |
| 377 | 8 | 34 | 0.571 |
| 378 | 8 | 35 | 0.529 |
| 379 | 8 | 36 | 0.492 |
| 380 | 8 | 37 | 0.460 |
| 381 | 8 | 38 | 0.431 |
| 382 | 8 | 39 | 0.404 |
| 383 | 8 | 40 | 0.381 |
| 384 | 8 | 48 | 1.004 |
| 385 | 8 | 49 | 0.885 |
| 386 | 8 | 50 | 0.790 |
| 387 | 8 | 51 | 0.711 |
| 388 | 8 | 52 | 0.646 |
| 389 | 8 | 53 | 0.589 |
| 390 | 8 | 54 | 0.541 |
| 391 | 8 | 55 | 0.499 |
| 392 | 8 | 56 | 0.462 |
| 393 | 8 | 57 | 0.429 |
| 394 | 8 | 58 | 0.400 |
| 395 | 8 | 59 | 0.373 |
| 396 | 8 | 60 | 0.350 |
| 397 | 9 | 9 | 1.000 |
| 398 | 9 | 10 | 0.896 |
| 399 | 9 | 11 | 0.810 |
| 400 | 9 | 12 | 0.738 |
| 401 | 9 | 13 | 0.677 |
| 402 | 9 | 14 | 0.624 |
| 403 | 9 | 15 | 0.578 |
| 404 | 9 | 16 | 0.538 |
| 405 | 9 | 17 | 0.502 |
| 406 | 9 | 18 | 0.470 |
| 407 | 9 | 19 | 0.441 |
| 408 | 9 | 20 | 0.415 |
| 409 | 9 | 29 | 1.035 |
| 410 | 9 | 30 | 0.927 |
| 411 | 9 | 31 | 0.838 |
| 412 | 9 | 32 | 0.764 |
| 413 | 9 | 33 | 0.700 |
| 414 | 9 | 34 | 0.646 |
| 415 | 9 | 35 | 0.598 |
| 416 | 9 | 36 | 0.557 |
| 417 | 9 | 37 | 0.520 |
| 418 | 9 | 38 | 0.487 |
| 419 | 9 | 39 | 0.457 |
| 420 | 9 | 40 | 0.430 |
| 421 | 9 | 49 | 1.001 |
| 422 | 9 | 50 | 0.893 |
| 423 | 9 | 51 | 0.804 |
| 424 | 9 | 52 | 0.730 |
| 425 | 9 | 53 | 0.666 |
| 426 | 9 | 54 | 0.612 |
| 427 | 9 | 55 | 0.564 |
| 428 | 9 | 56 | 0.522 |
| 429 | 9 | 57 | 0.485 |
| 430 | 9 | 58 | 0.452 |
| 431 | 9 | 59 | 0.422 |
| 432 | 9 | 60 | 0.395 |
| 433 | 10 | 10 | 1.000 |
| 434 | 10 | 11 | 0.904 |
| 435 | 10 | 12 | 0.824 |
| 436 | 10 | 13 | 0.756 |
| 437 | 10 | 14 | 0.697 |
| 438 | 10 | 15 | 0.645 |
| 439 | 10 | 16 | 0.600 |
| 440 | 10 | 17 | 0.560 |
| 441 | 10 | 18 | 0.525 |
| 442 | 10 | 19 | 0.493 |
| 443 | 10 | 20 | 0.464 |
| 444 | 10 | 30 | 1.035 |
| 445 | 10 | 31 | 0.935 |
| 446 | 10 | 32 | 0.853 |
| 447 | 10 | 33 | 0.782 |
| 448 | 10 | 34 | 0.721 |
| 449 | 10 | 35 | 0.668 |
| 450 | 10 | 36 | 0.621 |
| 451 | 10 | 37 | 0.580 |
| 452 | 10 | 38 | 0.543 |
| 453 | 10 | 39 | 0.510 |
| 454 | 10 | 40 | 0.480 |
| 455 | 10 | 50 | 0.997 |
| 456 | 10 | 51 | 0.898 |
| 457 | 10 | 52 | 0.815 |
| 458 | 10 | 53 | 0.744 |
| 459 | 10 | 54 | 0.683 |
| 460 | 10 | 55 | 0.630 |
| 461 | 10 | 56 | 0.583 |
| 462 | 10 | 57 | 0.541 |
| 463 | 10 | 58 | 0.504 |
| 464 | 10 | 59 | 0.471 |
| 465 | 10 | 60 | 0.441 |
| 466 | 11 | 11 | 1.000 |
| 467 | 11 | 12 | 0.911 |
| 468 | 11 | 13 | 0.836 |
| 469 | 11 | 14 | 0.771 |
| 470 | 11 | 15 | 0.714 |
| 471 | 11 | 16 | 0.664 |
| 472 | 11 | 17 | 0.620 |
| 473 | 11 | 18 | 0.580 |
| 474 | 11 | 19 | 0.545 |
| 475 | 11 | 20 | 0.513 |
| 476 | 11 | 31 | 1.035 |
| 477 | 11 | 32 | 0.943 |
| 478 | 11 | 33 | 0.865 |
| 479 | 11 | 34 | 0.798 |
| 480 | 11 | 35 | 0.739 |
| 481 | 11 | 36 | 0.687 |
| 482 | 11 | 37 | 0.642 |
| 483 | 11 | 38 | 0.601 |
| 484 | 11 | 39 | 0.564 |
| 485 | 11 | 40 | 0.532 |
| 486 | 11 | 51 | 0.993 |
| 487 | 11 | 52 | 0.901 |
| 488 | 11 | 53 | 0.823 |
| 489 | 11 | 54 | 0.755 |
| 490 | 11 | 55 | 0.697 |
| 491 | 11 | 56 | 0.645 |
| 492 | 11 | 57 | 0.599 |
| 493 | 11 | 58 | 0.558 |
| 494 | 11 | 59 | 0.521 |
| 495 | 11 | 60 | 0.488 |
| 496 | 12 | 12 | 1.000 |
| 497 | 12 | 13 | 0.917 |
| 498 | 12 | 14 | 0.846 |
| 499 | 12 | 15 | 0.783 |
| 500 | 12 | 16 | 0.729 |
| 501 | 12 | 17 | 0.680 |
| 502 | 12 | 18 | 0.637 |
| 503 | 12 | 19 | 0.598 |
| 504 | 12 | 20 | 0.563 |
| 505 | 12 | 32 | 1.035 |
| 506 | 12 | 33 | 0.949 |
| 507 | 12 | 34 | 0.875 |
| 508 | 12 | 35 | 0.811 |
| 509 | 12 | 36 | 0.754 |
| 510 | 12 | 37 | 0.704 |
| 511 | 12 | 38 | 0.660 |
| 512 | 12 | 39 | 0.619 |
| 513 | 12 | 40 | 0.583 |
| 514 | 12 | 52 | 0.989 |
| 515 | 12 | 53 | 0.903 |
| 516 | 12 | 54 | 0.829 |
| 517 | 12 | 55 | 0.764 |
| 518 | 12 | 56 | 0.707 |
| 519 | 12 | 57 | 0.657 |
| 520 | 12 | 58 | 0.612 |
| 521 | 12 | 59 | 0.572 |
| 522 | 12 | 60 | 0.536 |
| 523 | 13 | 13 | 1.000 |
| 524 | 13 | 14 | 0.922 |
| 525 | 13 | 15 | 0.854 |
| 526 | 13 | 16 | 0.794 |
| 527 | 13 | 17 | 0.742 |
| 528 | 13 | 18 | 0.694 |
| 529 | 13 | 19 | 0.652 |
| 530 | 13 | 20 | 0.614 |
| 531 | 13 | 33 | 1.035 |
| 532 | 13 | 34 | 0.954 |
| 533 | 13 | 35 | 0.884 |
| 534 | 13 | 36 | 0.822 |
| 535 | 13 | 37 | 0.768 |
| 536 | 13 | 38 | 0.719 |
| 537 | 13 | 39 | 0.675 |
| 538 | 13 | 40 | 0.636 |
| 539 | 13 | 53 | 0.984 |
| 540 | 13 | 54 | 0.904 |
| 541 | 13 | 55 | 0.833 |
| 542 | 13 | 56 | 0.771 |
| 543 | 13 | 57 | 0.716 |
| 544 | 13 | 58 | 0.667 |
| 545 | 13 | 59 | 0.624 |
| 546 | 13 | 60 | 0.584 |
| 547 | 14 | 14 | 1.000 |
| 548 | 14 | 15 | 0.926 |
| 549 | 14 | 16 | 0.862 |
| 550 | 14 | 17 | 0.804 |
| 551 | 14 | 18 | 0.753 |
| 552 | 14 | 19 | 0.707 |
| 553 | 14 | 20 | 0.666 |
| 554 | 14 | 34 | 1.035 |
| 555 | 14 | 35 | 0.959 |
| 556 | 14 | 36 | 0.892 |
| 557 | 14 | 37 | 0.833 |
| 558 | 14 | 38 | 0.780 |
| 559 | 14 | 39 | 0.732 |
| 560 | 14 | 40 | 0.690 |
| 561 | 14 | 54 | 0.980 |
| 562 | 14 | 55 | 0.904 |
| 563 | 14 | 56 | 0.837 |
| 564 | 14 | 57 | 0.777 |
| 565 | 14 | 58 | 0.724 |
| 566 | 14 | 59 | 0.676 |
| 567 | 14 | 60 | 0.633 |
| 568 | 15 | 15 | 1.000 |
| 569 | 15 | 16 | 0.930 |
| 570 | 15 | 17 | 0.868 |
| 571 | 15 | 18 | 0.813 |
| 572 | 15 | 19 | 0.763 |
| 573 | 15 | 20 | 0.719 |
| 574 | 15 | 35 | 1.035 |
| 575 | 15 | 36 | 0.963 |
| 576 | 15 | 37 | 0.899 |
| 577 | 15 | 38 | 0.842 |
| 578 | 15 | 39 | 0.791 |
| 579 | 15 | 40 | 0.744 |
| 580 | 15 | 55 | 0.976 |
| 581 | 15 | 56 | 0.903 |
| 582 | 15 | 57 | 0.839 |
| 583 | 15 | 58 | 0.781 |
| 584 | 15 | 59 | 0.730 |
| 585 | 15 | 60 | 0.684 |
| 586 | 16 | 16 | 1.000 |
| 587 | 16 | 17 | 0.934 |
| 588 | 16 | 18 | 0.874 |
| 589 | 16 | 19 | 0.821 |
| 590 | 16 | 20 | 0.773 |
| 591 | 16 | 36 | 1.035 |
| 592 | 16 | 37 | 0.966 |
| 593 | 16 | 38 | 0.905 |
| 594 | 16 | 39 | 0.850 |
| 595 | 16 | 40 | 0.800 |
| 596 | 16 | 56 | 0.971 |
| 597 | 16 | 57 | 0.902 |
| 598 | 16 | 58 | 0.840 |
| 599 | 16 | 59 | 0.785 |
| 600 | 16 | 60 | 0.735 |
| 601 | 17 | 17 | 1.000 |
| 602 | 17 | 18 | 0.936 |
| 603 | 17 | 19 | 0.879 |
| 604 | 17 | 20 | 0.828 |
| 605 | 17 | 37 | 1.035 |
| 606 | 17 | 38 | 0.969 |
| 607 | 17 | 39 | 0.910 |
| 608 | 17 | 40 | 0.857 |
| 609 | 17 | 57 | 0.966 |
| 610 | 17 | 58 | 0.900 |
| 611 | 17 | 59 | 0.841 |
| 612 | 17 | 60 | 0.787 |
| 613 | 18 | 18 | 1.000 |
| 614 | 18 | 19 | 0.939 |
| 615 | 18 | 20 | 0.884 |
| 616 | 18 | 38 | 1.036 |
| 617 | 18 | 39 | 0.972 |
| 618 | 18 | 40 | 0.916 |
| 619 | 18 | 58 | 0.961 |
| 620 | 18 | 59 | 0.898 |
| 621 | 18 | 60 | 0.841 |
| 622 | 19 | 19 | 1.000 |
| 623 | 19 | 20 | 0.941 |
| 624 | 19 | 39 | 1.036 |
| 625 | 19 | 40 | 0.975 |
| 626 | 19 | 59 | 0.956 |
| 627 | 19 | 60 | 0.895 |
| 628 | 20 | 20 | 1.000 |
| 629 | 20 | 40 | 1.036 |
| 630 | 20 | 60 | 0.951 |
| 631 | 21 | 21 | 1.000 |
| 632 | 21 | 22 | 0.545 |
| 633 | 21 | 23 | 0.369 |
| 634 | 21 | 24 | 0.277 |
| 635 | 21 | 25 | 0.222 |
| 636 | 21 | 26 | 0.185 |
| 637 | 21 | 27 | 0.158 |
| 638 | 21 | 28 | 0.138 |
| 639 | 21 | 29 | 0.122 |
| 640 | 21 | 30 | 0.109 |
| 641 | 21 | 31 | 0.099 |
| 642 | 21 | 32 | 0.090 |
| 643 | 21 | 33 | 0.082 |
| 644 | 21 | 34 | 0.076 |
| 645 | 21 | 35 | 0.070 |
| 646 | 21 | 36 | 0.065 |
| 647 | 21 | 37 | 0.061 |
| 648 | 21 | 38 | 0.057 |
| 649 | 21 | 39 | 0.054 |
| 650 | 21 | 40 | 0.051 |
| 651 | 21 | 41 | 0.990 |
| 652 | 21 | 42 | 0.537 |
| 653 | 21 | 43 | 0.362 |
| 654 | 21 | 44 | 0.272 |
| 655 | 21 | 45 | 0.217 |
| 656 | 21 | 46 | 0.180 |
| 657 | 21 | 47 | 0.154 |
| 658 | 21 | 48 | 0.133 |
| 659 | 21 | 49 | 0.118 |
| 660 | 21 | 50 | 0.105 |
| 661 | 21 | 51 | 0.095 |
| 662 | 21 | 52 | 0.086 |
| 663 | 21 | 53 | 0.078 |
| 664 | 21 | 54 | 0.072 |
| 665 | 21 | 55 | 0.066 |
| 666 | 21 | 56 | 0.061 |
| 667 | 21 | 57 | 0.057 |
| 668 | 21 | 58 | 0.053 |
| 669 | 21 | 59 | 0.050 |
| 670 | 21 | 60 | 0.046 |
| 671 | 22 | 22 | 1.000 |
| 672 | 22 | 23 | 0.677 |
| 673 | 22 | 24 | 0.509 |
| 674 | 22 | 25 | 0.407 |
| 675 | 22 | 26 | 0.339 |
| 676 | 22 | 27 | 0.290 |
| 677 | 22 | 28 | 0.252 |
| 678 | 22 | 29 | 0.223 |
| 679 | 22 | 30 | 0.200 |
| 680 | 22 | 31 | 0.181 |
| 681 | 22 | 32 | 0.165 |
| 682 | 22 | 33 | 0.151 |
| 683 | 22 | 34 | 0.139 |
| 684 | 22 | 35 | 0.129 |
| 685 | 22 | 36 | 0.120 |
| 686 | 22 | 37 | 0.112 |
| 687 | 22 | 38 | 0.105 |
| 688 | 22 | 39 | 0.099 |
| 689 | 22 | 40 | 0.093 |
| 690 | 22 | 42 | 0.986 |
| 691 | 22 | 43 | 0.665 |
| 692 | 22 | 44 | 0.499 |
| 693 | 22 | 45 | 0.399 |
| 694 | 22 | 46 | 0.331 |
| 695 | 22 | 47 | 0.282 |
| 696 | 22 | 48 | 0.245 |
| 697 | 22 | 49 | 0.216 |
| 698 | 22 | 50 | 0.193 |
| 699 | 22 | 51 | 0.174 |
| 700 | 22 | 52 | 0.158 |
| 701 | 22 | 53 | 0.144 |
| 702 | 22 | 54 | 0.132 |
| 703 | 22 | 55 | 0.122 |
| 704 | 22 | 56 | 0.113 |
| 705 | 22 | 57 | 0.105 |
| 706 | 22 | 58 | 0.098 |
| 707 | 22 | 59 | 0.091 |
| 708 | 22 | 60 | 0.085 |
| 709 | 23 | 23 | 1.000 |
| 710 | 23 | 24 | 0.752 |
| 711 | 23 | 25 | 0.602 |
| 712 | 23 | 26 | 0.501 |
| 713 | 23 | 27 | 0.428 |
| 714 | 23 | 28 | 0.373 |
| 715 | 23 | 29 | 0.330 |
| 716 | 23 | 30 | 0.296 |
| 717 | 23 | 31 | 0.267 |
| 718 | 23 | 32 | 0.244 |
| 719 | 23 | 33 | 0.223 |
| 720 | 23 | 34 | 0.206 |
| 721 | 23 | 35 | 0.191 |
| 722 | 23 | 36 | 0.178 |
| 723 | 23 | 37 | 0.166 |
| 724 | 23 | 38 | 0.155 |
| 725 | 23 | 39 | 0.146 |
| 726 | 23 | 40 | 0.137 |
| 727 | 23 | 43 | 0.983 |
| 728 | 23 | 44 | 0.738 |
| 729 | 23 | 45 | 0.589 |
| 730 | 23 | 46 | 0.489 |
| 731 | 23 | 47 | 0.417 |
| 732 | 23 | 48 | 0.362 |
| 733 | 23 | 49 | 0.319 |
| 734 | 23 | 50 | 0.285 |
| 735 | 23 | 51 | 0.257 |
| 736 | 23 | 52 | 0.233 |
| 737 | 23 | 53 | 0.213 |
| 738 | 23 | 54 | 0.195 |
| 739 | 23 | 55 | 0.180 |
| 740 | 23 | 56 | 0.167 |
| 741 | 23 | 57 | 0.155 |
| 742 | 23 | 58 | 0.144 |
| 743 | 23 | 59 | 0.135 |
| 744 | 23 | 60 | 0.126 |
| 745 | 24 | 24 | 1.000 |
| 746 | 24 | 25 | 0.800 |
| 747 | 24 | 26 | 0.666 |
| 748 | 24 | 27 | 0.569 |
| 749 | 24 | 28 | 0.496 |
| 750 | 24 | 29 | 0.439 |
| 751 | 24 | 30 | 0.393 |
| 752 | 24 | 31 | 0.355 |
| 753 | 24 | 32 | 0.324 |
| 754 | 24 | 33 | 0.297 |
| 755 | 24 | 34 | 0.274 |
| 756 | 24 | 35 | 0.254 |
| 757 | 24 | 36 | 0.236 |
| 758 | 24 | 37 | 0.220 |
| 759 | 24 | 38 | 0.206 |
| 760 | 24 | 39 | 0.194 |
| 761 | 24 | 40 | 0.182 |
| 762 | 24 | 44 | 0.980 |
| 763 | 24 | 45 | 0.783 |
| 764 | 24 | 46 | 0.650 |
| 765 | 24 | 47 | 0.554 |
| 766 | 24 | 48 | 0.481 |
| 767 | 24 | 49 | 0.424 |
| 768 | 24 | 50 | 0.379 |
| 769 | 24 | 51 | 0.341 |
| 770 | 24 | 52 | 0.309 |
| 771 | 24 | 53 | 0.282 |
| 772 | 24 | 54 | 0.259 |
| 773 | 24 | 55 | 0.239 |
| 774 | 24 | 56 | 0.221 |
| 775 | 24 | 57 | 0.206 |
| 776 | 24 | 58 | 0.192 |
| 777 | 24 | 59 | 0.179 |
| 778 | 24 | 60 | 0.168 |
| 779 | 25 | 25 | 1.000 |
| 780 | 25 | 26 | 0.832 |
| 781 | 25 | 27 | 0.711 |
| 782 | 25 | 28 | 0.620 |
| 783 | 25 | 29 | 0.549 |
| 784 | 25 | 30 | 0.491 |
| 785 | 25 | 31 | 0.444 |
| 786 | 25 | 32 | 0.405 |
| 787 | 25 | 33 | 0.371 |
| 788 | 25 | 34 | 0.342 |
| 789 | 25 | 35 | 0.317 |
| 790 | 25 | 36 | 0.295 |
| 791 | 25 | 37 | 0.275 |
| 792 | 25 | 38 | 0.258 |
| 793 | 25 | 39 | 0.242 |
| 794 | 25 | 40 | 0.228 |
| 795 | 25 | 45 | 0.979 |
| 796 | 25 | 46 | 0.812 |
| 797 | 25 | 47 | 0.692 |
| 798 | 25 | 48 | 0.602 |
| 799 | 25 | 49 | 0.530 |
| 800 | 25 | 50 | 0.473 |
| 801 | 25 | 51 | 0.426 |
| 802 | 25 | 52 | 0.387 |
| 803 | 25 | 53 | 0.353 |
| 804 | 25 | 54 | 0.324 |
| 805 | 25 | 55 | 0.299 |
| 806 | 25 | 56 | 0.277 |
| 807 | 25 | 57 | 0.257 |
| 808 | 25 | 58 | 0.239 |
| 809 | 25 | 59 | 0.224 |
| 810 | 25 | 60 | 0.209 |
| 811 | 26 | 26 | 1.000 |
| 812 | 26 | 27 | 0.854 |
| 813 | 26 | 28 | 0.745 |
| 814 | 26 | 29 | 0.659 |
| 815 | 26 | 30 | 0.590 |
| 816 | 26 | 31 | 0.534 |
| 817 | 26 | 32 | 0.486 |
| 818 | 26 | 33 | 0.446 |
| 819 | 26 | 34 | 0.411 |
| 820 | 26 | 35 | 0.381 |
| 821 | 26 | 36 | 0.354 |
| 822 | 26 | 37 | 0.331 |
| 823 | 26 | 38 | 0.310 |
| 824 | 26 | 39 | 0.291 |
| 825 | 26 | 40 | 0.274 |
| 826 | 26 | 46 | 0.976 |
| 827 | 26 | 47 | 0.831 |
| 828 | 26 | 48 | 0.723 |
| 829 | 26 | 49 | 0.637 |
| 830 | 26 | 50 | 0.569 |
| 831 | 26 | 51 | 0.512 |
| 832 | 26 | 52 | 0.465 |
| 833 | 26 | 53 | 0.424 |
| 834 | 26 | 54 | 0.390 |
| 835 | 26 | 55 | 0.359 |
| 836 | 26 | 56 | 0.332 |
| 837 | 26 | 57 | 0.309 |
| 838 | 26 | 58 | 0.288 |
| 839 | 26 | 59 | 0.269 |
| 840 | 26 | 60 | 0.252 |
| 841 | 27 | 27 | 1.000 |
| 842 | 27 | 28 | 0.872 |
| 843 | 27 | 29 | 0.772 |
| 844 | 27 | 30 | 0.691 |
| 845 | 27 | 31 | 0.625 |
| 846 | 27 | 32 | 0.569 |
| 847 | 27 | 33 | 0.522 |
| 848 | 27 | 34 | 0.481 |
| 849 | 27 | 35 | 0.446 |
| 850 | 27 | 36 | 0.415 |
| 851 | 27 | 37 | 0.387 |
| 852 | 27 | 38 | 0.363 |
| 853 | 27 | 39 | 0.341 |
| 854 | 27 | 40 | 0.321 |
| 855 | 27 | 47 | 0.973 |
| 856 | 27 | 48 | 0.846 |
| 857 | 27 | 49 | 0.746 |
| 858 | 27 | 50 | 0.666 |
| 859 | 27 | 51 | 0.599 |
| 860 | 27 | 52 | 0.544 |
| 861 | 27 | 53 | 0.497 |
| 862 | 27 | 54 | 0.456 |
| 863 | 27 | 55 | 0.420 |
| 864 | 27 | 56 | 0.389 |
| 865 | 27 | 57 | 0.361 |
| 866 | 27 | 58 | 0.337 |
| 867 | 27 | 59 | 0.315 |
| 868 | 27 | 60 | 0.295 |
| 869 | 28 | 28 | 1.000 |
| 870 | 28 | 29 | 0.885 |
| 871 | 28 | 30 | 0.793 |
| 872 | 28 | 31 | 0.717 |
| 873 | 28 | 32 | 0.653 |
| 874 | 28 | 33 | 0.599 |
| 875 | 28 | 34 | 0.552 |
| 876 | 28 | 35 | 0.512 |
| 877 | 28 | 36 | 0.476 |
| 878 | 28 | 37 | 0.444 |
| 879 | 28 | 38 | 0.416 |
| 880 | 28 | 39 | 0.391 |
| 881 | 28 | 40 | 0.368 |
| 882 | 28 | 48 | 0.971 |
| 883 | 28 | 49 | 0.856 |
| 884 | 28 | 50 | 0.764 |
| 885 | 28 | 51 | 0.688 |
| 886 | 28 | 52 | 0.624 |
| 887 | 28 | 53 | 0.570 |
| 888 | 28 | 54 | 0.523 |
| 889 | 28 | 55 | 0.482 |
| 890 | 28 | 56 | 0.446 |
| 891 | 28 | 57 | 0.415 |
| 892 | 28 | 58 | 0.386 |
| 893 | 28 | 59 | 0.361 |
| 894 | 28 | 60 | 0.338 |
| 895 | 29 | 29 | 1.000 |
| 896 | 29 | 30 | 0.895 |
| 897 | 29 | 31 | 0.809 |
| 898 | 29 | 32 | 0.738 |
| 899 | 29 | 33 | 0.677 |
| 900 | 29 | 34 | 0.624 |
| 901 | 29 | 35 | 0.578 |
| 902 | 29 | 36 | 0.538 |
| 903 | 29 | 37 | 0.502 |
| 904 | 29 | 38 | 0.470 |
| 905 | 29 | 39 | 0.442 |
| 906 | 29 | 40 | 0.416 |
| 907 | 29 | 49 | 0.967 |
| 908 | 29 | 50 | 0.863 |
| 909 | 29 | 51 | 0.777 |
| 910 | 29 | 52 | 0.705 |
| 911 | 29 | 53 | 0.644 |
| 912 | 29 | 54 | 0.591 |
| 913 | 29 | 55 | 0.545 |
| 914 | 29 | 56 | 0.504 |
| 915 | 29 | 57 | 0.468 |
| 916 | 29 | 58 | 0.436 |
| 917 | 29 | 59 | 0.408 |
| 918 | 29 | 60 | 0.382 |
| 919 | 30 | 30 | 1.000 |
| 920 | 30 | 31 | 0.904 |
| 921 | 30 | 32 | 0.824 |
| 922 | 30 | 33 | 0.755 |
| 923 | 30 | 34 | 0.697 |
| 924 | 30 | 35 | 0.646 |
| 925 | 30 | 36 | 0.601 |
| 926 | 30 | 37 | 0.561 |
| 927 | 30 | 38 | 0.525 |
| 928 | 30 | 39 | 0.493 |
| 929 | 30 | 40 | 0.464 |
| 930 | 30 | 50 | 0.963 |
| 931 | 30 | 51 | 0.868 |
| 932 | 30 | 52 | 0.787 |
| 933 | 30 | 53 | 0.719 |
| 934 | 30 | 54 | 0.660 |
| 935 | 30 | 55 | 0.609 |
| 936 | 30 | 56 | 0.563 |
| 937 | 30 | 57 | 0.523 |
| 938 | 30 | 58 | 0.487 |
| 939 | 30 | 59 | 0.455 |
| 940 | 30 | 60 | 0.426 |
| 941 | 31 | 31 | 1.000 |
| 942 | 31 | 32 | 0.912 |
| 943 | 31 | 33 | 0.836 |
| 944 | 31 | 34 | 0.771 |
| 945 | 31 | 35 | 0.714 |
| 946 | 31 | 36 | 0.664 |
| 947 | 31 | 37 | 0.620 |
| 948 | 31 | 38 | 0.581 |
| 949 | 31 | 39 | 0.545 |
| 950 | 31 | 40 | 0.514 |
| 951 | 31 | 51 | 0.960 |
| 952 | 31 | 52 | 0.871 |
| 953 | 31 | 53 | 0.795 |
| 954 | 31 | 54 | 0.730 |
| 955 | 31 | 55 | 0.673 |
| 956 | 31 | 56 | 0.623 |
| 957 | 31 | 57 | 0.579 |
| 958 | 31 | 58 | 0.539 |
| 959 | 31 | 59 | 0.504 |
| 960 | 31 | 60 | 0.472 |
| 961 | 32 | 32 | 1.000 |
| 962 | 32 | 33 | 0.917 |
| 963 | 32 | 34 | 0.846 |
| 964 | 32 | 35 | 0.783 |
| 965 | 32 | 36 | 0.729 |
| 966 | 32 | 37 | 0.680 |
| 967 | 32 | 38 | 0.637 |
| 968 | 32 | 39 | 0.598 |
| 969 | 32 | 40 | 0.563 |
| 970 | 32 | 52 | 0.956 |
| 971 | 32 | 53 | 0.872 |
| 972 | 32 | 54 | 0.801 |
| 973 | 32 | 55 | 0.738 |
| 974 | 32 | 56 | 0.684 |
| 975 | 32 | 57 | 0.635 |
| 976 | 32 | 58 | 0.591 |
| 977 | 32 | 59 | 0.553 |
| 978 | 32 | 60 | 0.517 |
| 979 | 33 | 33 | 1.000 |
| 980 | 33 | 34 | 0.922 |
| 981 | 33 | 35 | 0.855 |
| 982 | 33 | 36 | 0.795 |
| 983 | 33 | 37 | 0.742 |
| 984 | 33 | 38 | 0.695 |
| 985 | 33 | 39 | 0.653 |
| 986 | 33 | 40 | 0.615 |
| 987 | 33 | 53 | 0.951 |
| 988 | 33 | 54 | 0.873 |
| 989 | 33 | 55 | 0.805 |
| 990 | 33 | 56 | 0.746 |
| 991 | 33 | 57 | 0.692 |
| 992 | 33 | 58 | 0.645 |
| 993 | 33 | 59 | 0.603 |
| 994 | 33 | 60 | 0.564 |
| 995 | 34 | 34 | 1.000 |
| 996 | 34 | 35 | 0.926 |
| 997 | 34 | 36 | 0.862 |
| 998 | 34 | 37 | 0.804 |
| 999 | 34 | 38 | 0.753 |
| 1000 | 34 | 39 | 0.708 |
| 1001 | 34 | 40 | 0.666 |
| 1002 | 34 | 54 | 0.947 |
| 1003 | 34 | 55 | 0.873 |
| 1004 | 34 | 56 | 0.808 |
| 1005 | 34 | 57 | 0.751 |
| 1006 | 34 | 58 | 0.699 |
| 1007 | 34 | 59 | 0.653 |
| 1008 | 34 | 60 | 0.612 |
| 1009 | 35 | 35 | 1.000 |
| 1010 | 35 | 36 | 0.930 |
| 1011 | 35 | 37 | 0.868 |
| 1012 | 35 | 38 | 0.813 |
| 1013 | 35 | 39 | 0.764 |
| 1014 | 35 | 40 | 0.719 |
| 1015 | 35 | 55 | 0.943 |
| 1016 | 35 | 56 | 0.872 |
| 1017 | 35 | 57 | 0.810 |
| 1018 | 35 | 58 | 0.755 |
| 1019 | 35 | 59 | 0.705 |
| 1020 | 35 | 60 | 0.660 |
| 1021 | 36 | 36 | 1.000 |
| 1022 | 36 | 37 | 0.934 |
| 1023 | 36 | 38 | 0.874 |
| 1024 | 36 | 39 | 0.821 |
| 1025 | 36 | 40 | 0.773 |
| 1026 | 36 | 56 | 0.938 |
| 1027 | 36 | 57 | 0.871 |
| 1028 | 36 | 58 | 0.811 |
| 1029 | 36 | 59 | 0.758 |
| 1030 | 36 | 60 | 0.710 |
| 1031 | 37 | 37 | 1.000 |
| 1032 | 37 | 38 | 0.937 |
| 1033 | 37 | 39 | 0.880 |
| 1034 | 37 | 40 | 0.828 |
| 1035 | 37 | 57 | 0.933 |
| 1036 | 37 | 58 | 0.869 |
| 1037 | 37 | 59 | 0.812 |
| 1038 | 37 | 60 | 0.760 |
| 1039 | 38 | 38 | 1.000 |
| 1040 | 38 | 39 | 0.939 |
| 1041 | 38 | 40 | 0.884 |
| 1042 | 38 | 58 | 0.928 |
| 1043 | 38 | 59 | 0.867 |
| 1044 | 38 | 60 | 0.812 |
| 1045 | 39 | 39 | 1.000 |
| 1046 | 39 | 40 | 0.942 |
| 1047 | 39 | 59 | 0.923 |
| 1048 | 39 | 60 | 0.865 |
| 1049 | 40 | 40 | 1.000 |
| 1050 | 40 | 60 | 0.918 |
| 1051 | 41 | 41 | 1.000 |
| 1052 | 41 | 42 | 0.543 |
| 1053 | 41 | 43 | 0.366 |
| 1054 | 41 | 44 | 0.275 |
| 1055 | 41 | 45 | 0.219 |
| 1056 | 41 | 46 | 0.182 |
| 1057 | 41 | 47 | 0.155 |
| 1058 | 41 | 48 | 0.135 |
| 1059 | 41 | 49 | 0.119 |
| 1060 | 41 | 50 | 0.106 |
| 1061 | 41 | 51 | 0.096 |
| 1062 | 41 | 52 | 0.087 |
| 1063 | 41 | 53 | 0.079 |
| 1064 | 41 | 54 | 0.073 |
| 1065 | 41 | 55 | 0.067 |
| 1066 | 41 | 56 | 0.062 |
| 1067 | 41 | 57 | 0.058 |
| 1068 | 41 | 58 | 0.054 |
| 1069 | 41 | 59 | 0.050 |
| 1070 | 41 | 60 | 0.047 |
| 1071 | 42 | 42 | 1.000 |
| 1072 | 42 | 43 | 0.675 |
| 1073 | 42 | 44 | 0.506 |
| 1074 | 42 | 45 | 0.404 |
| 1075 | 42 | 46 | 0.335 |
| 1076 | 42 | 47 | 0.286 |
| 1077 | 42 | 48 | 0.248 |
| 1078 | 42 | 49 | 0.219 |
| 1079 | 42 | 50 | 0.195 |
| 1080 | 42 | 51 | 0.176 |
| 1081 | 42 | 52 | 0.160 |
| 1082 | 42 | 53 | 0.146 |
| 1083 | 42 | 54 | 0.134 |
| 1084 | 42 | 55 | 0.123 |
| 1085 | 42 | 56 | 0.114 |
| 1086 | 42 | 57 | 0.106 |
| 1087 | 42 | 58 | 0.099 |
| 1088 | 42 | 59 | 0.092 |
| 1089 | 42 | 60 | 0.087 |
| 1090 | 43 | 43 | 1.000 |
| 1091 | 43 | 44 | 0.750 |
| 1092 | 43 | 45 | 0.599 |
| 1093 | 43 | 46 | 0.497 |
| 1094 | 43 | 47 | 0.424 |
| 1095 | 43 | 48 | 0.368 |
| 1096 | 43 | 49 | 0.325 |
| 1097 | 43 | 50 | 0.290 |
| 1098 | 43 | 51 | 0.261 |
| 1099 | 43 | 52 | 0.237 |
| 1100 | 43 | 53 | 0.216 |
| 1101 | 43 | 54 | 0.198 |
| 1102 | 43 | 55 | 0.183 |
| 1103 | 43 | 56 | 0.169 |
| 1104 | 43 | 57 | 0.157 |
| 1105 | 43 | 58 | 0.147 |
| 1106 | 43 | 59 | 0.137 |
| 1107 | 43 | 60 | 0.128 |
| 1108 | 44 | 44 | 1.000 |
| 1109 | 44 | 45 | 0.798 |
| 1110 | 44 | 46 | 0.663 |
| 1111 | 44 | 47 | 0.565 |
| 1112 | 44 | 48 | 0.491 |
| 1113 | 44 | 49 | 0.433 |
| 1114 | 44 | 50 | 0.386 |
| 1115 | 44 | 51 | 0.348 |
| 1116 | 44 | 52 | 0.316 |
| 1117 | 44 | 53 | 0.288 |
| 1118 | 44 | 54 | 0.264 |
| 1119 | 44 | 55 | 0.244 |
| 1120 | 44 | 56 | 0.226 |
| 1121 | 44 | 57 | 0.210 |
| 1122 | 44 | 58 | 0.195 |
| 1123 | 44 | 59 | 0.182 |
| 1124 | 44 | 60 | 0.171 |
| 1125 | 45 | 45 | 1.000 |
| 1126 | 45 | 46 | 0.830 |
| 1127 | 45 | 47 | 0.707 |
| 1128 | 45 | 48 | 0.615 |
| 1129 | 45 | 49 | 0.542 |
| 1130 | 45 | 50 | 0.484 |
| 1131 | 45 | 51 | 0.435 |
| 1132 | 45 | 52 | 0.395 |
| 1133 | 45 | 53 | 0.361 |
| 1134 | 45 | 54 | 0.331 |
| 1135 | 45 | 55 | 0.305 |
| 1136 | 45 | 56 | 0.283 |
| 1137 | 45 | 57 | 0.263 |
| 1138 | 45 | 58 | 0.245 |
| 1139 | 45 | 59 | 0.229 |
| 1140 | 45 | 60 | 0.214 |
| 1141 | 46 | 46 | 1.000 |
| 1142 | 46 | 47 | 0.852 |
| 1143 | 46 | 48 | 0.741 |
| 1144 | 46 | 49 | 0.653 |
| 1145 | 46 | 50 | 0.583 |
| 1146 | 46 | 51 | 0.525 |
| 1147 | 46 | 52 | 0.476 |
| 1148 | 46 | 53 | 0.435 |
| 1149 | 46 | 54 | 0.399 |
| 1150 | 46 | 55 | 0.368 |
| 1151 | 46 | 56 | 0.341 |
| 1152 | 46 | 57 | 0.316 |
| 1153 | 46 | 58 | 0.295 |
| 1154 | 46 | 59 | 0.275 |
| 1155 | 46 | 60 | 0.258 |
| 1156 | 47 | 47 | 1.000 |
| 1157 | 47 | 48 | 0.869 |
| 1158 | 47 | 49 | 0.766 |
| 1159 | 47 | 50 | 0.684 |
| 1160 | 47 | 51 | 0.616 |
| 1161 | 47 | 52 | 0.559 |
| 1162 | 47 | 53 | 0.510 |
| 1163 | 47 | 54 | 0.468 |
| 1164 | 47 | 55 | 0.432 |
| 1165 | 47 | 56 | 0.400 |
| 1166 | 47 | 57 | 0.371 |
| 1167 | 47 | 58 | 0.346 |
| 1168 | 47 | 59 | 0.323 |
| 1169 | 47 | 60 | 0.303 |
| 1170 | 48 | 48 | 1.000 |
| 1171 | 48 | 49 | 0.882 |
| 1172 | 48 | 50 | 0.787 |
| 1173 | 48 | 51 | 0.709 |
| 1174 | 48 | 52 | 0.643 |
| 1175 | 48 | 53 | 0.587 |
| 1176 | 48 | 54 | 0.539 |
| 1177 | 48 | 55 | 0.497 |
| 1178 | 48 | 56 | 0.460 |
| 1179 | 48 | 57 | 0.427 |
| 1180 | 48 | 58 | 0.398 |
| 1181 | 48 | 59 | 0.372 |
| 1182 | 48 | 60 | 0.348 |
| 1183 | 49 | 49 | 1.000 |
| 1184 | 49 | 50 | 0.892 |
| 1185 | 49 | 51 | 0.804 |
| 1186 | 49 | 52 | 0.729 |
| 1187 | 49 | 53 | 0.666 |
| 1188 | 49 | 54 | 0.611 |
| 1189 | 49 | 55 | 0.564 |
| 1190 | 49 | 56 | 0.522 |
| 1191 | 49 | 57 | 0.485 |
| 1192 | 49 | 58 | 0.451 |
| 1193 | 49 | 59 | 0.422 |
| 1194 | 49 | 60 | 0.395 |
| 1195 | 50 | 50 | 1.000 |
| 1196 | 50 | 51 | 0.901 |
| 1197 | 50 | 52 | 0.817 |
| 1198 | 50 | 53 | 0.746 |
| 1199 | 50 | 54 | 0.685 |
| 1200 | 50 | 55 | 0.632 |
| 1201 | 50 | 56 | 0.585 |
| 1202 | 50 | 57 | 0.543 |
| 1203 | 50 | 58 | 0.506 |
| 1204 | 50 | 59 | 0.473 |
| 1205 | 50 | 60 | 0.443 |
| 1206 | 51 | 51 | 1.000 |
| 1207 | 51 | 52 | 0.908 |
| 1208 | 51 | 53 | 0.828 |
| 1209 | 51 | 54 | 0.761 |
| 1210 | 51 | 55 | 0.701 |
| 1211 | 51 | 56 | 0.649 |
| 1212 | 51 | 57 | 0.603 |
| 1213 | 51 | 58 | 0.562 |
| 1214 | 51 | 59 | 0.525 |
| 1215 | 51 | 60 | 0.491 |
| 1216 | 52 | 52 | 1.000 |
| 1217 | 52 | 53 | 0.913 |
| 1218 | 52 | 54 | 0.838 |
| 1219 | 52 | 55 | 0.773 |
| 1220 | 52 | 56 | 0.715 |
| 1221 | 52 | 57 | 0.664 |
| 1222 | 52 | 58 | 0.619 |
| 1223 | 52 | 59 | 0.578 |
| 1224 | 52 | 60 | 0.541 |
| 1225 | 53 | 53 | 1.000 |
| 1226 | 53 | 54 | 0.918 |
| 1227 | 53 | 55 | 0.847 |
| 1228 | 53 | 56 | 0.784 |
| 1229 | 53 | 57 | 0.728 |
| 1230 | 53 | 58 | 0.678 |
| 1231 | 53 | 59 | 0.633 |
| 1232 | 53 | 60 | 0.593 |
| 1233 | 54 | 54 | 1.000 |
| 1234 | 54 | 55 | 0.922 |
| 1235 | 54 | 56 | 0.854 |
| 1236 | 54 | 57 | 0.793 |
| 1237 | 54 | 58 | 0.738 |
| 1238 | 54 | 59 | 0.690 |
| 1239 | 54 | 60 | 0.646 |
| 1240 | 55 | 55 | 1.000 |
| 1241 | 55 | 56 | 0.926 |
| 1242 | 55 | 57 | 0.860 |
| 1243 | 55 | 58 | 0.801 |
| 1244 | 55 | 59 | 0.748 |
| 1245 | 55 | 60 | 0.701 |
| 1246 | 56 | 56 | 1.000 |
| 1247 | 56 | 57 | 0.929 |
| 1248 | 56 | 58 | 0.865 |
| 1249 | 56 | 59 | 0.808 |
| 1250 | 56 | 60 | 0.757 |
| 1251 | 57 | 57 | 1.000 |
| 1252 | 57 | 58 | 0.932 |
| 1253 | 57 | 59 | 0.870 |
| 1254 | 57 | 60 | 0.815 |
| 1255 | 58 | 58 | 1.000 |
| 1256 | 58 | 59 | 0.934 |
| 1257 | 58 | 60 | 0.875 |
| 1258 | 59 | 59 | 1.000 |
| 1259 | 59 | 60 | 0.936 |
| 1260 | 60 | 60 | 1.000 |
References
- Anagnostopoulos, S.A. Pounding of buildings in series during earthquakes. Earthq. Eng. Struct. Dyn. 1988, 16, 443–456. [Google Scholar] [CrossRef]
- Favvata, M.J. Minimum required separation gap for adjacent RC frames with potential inter-story seismic pounding. Eng. Struct. 2017, 152, 643–659. [Google Scholar] [CrossRef]
- Mavronicola, E.A.; Polycarpou, P.C.; Komodromos, P. Effect of ground motion directionality on the seismic response of base isolated buildings pounding against adjacent structures. Eng. Struct. 2020, 207, 110202. [Google Scholar] [CrossRef]
- Miari, M.; Jankowski, R. Pounding between high-rise buildings with different structural arrangements. In Proceedings of the International Conference on Wave Mechanics and Vibrations, Lisbon, Portugal, 4–6 July 2022; pp. 807–816. [Google Scholar]
- Miari, M.; Jankowski, R. Incremental dynamic analysis and fragility assessment of buildings with different structural arrangements experiencing earthquake-induced structural pounding. In Proceedings of the International Conference on Computational Science, London, UK, 21–23 June 2022; pp. 117–124. [Google Scholar]
- Rosenblueth, E.; Meli, R. The 1985 Mexico earthquake. Concr. Int. 1986, 8, 23–34. [Google Scholar]
- Anagnostopoulos, S. Building pounding re-examined: How serious a problem is it. In Proceedings of the Eleventh World Conference on Earthquake Engineering, Acapulco, Mexico, 23–28 June 1996; Pergamon: Oxford, UK, 1996; p. 2108. [Google Scholar]
- Kasai, K.; Maison, B.F. Building pounding damage during the 1989 Loma Prieta earthquake. Eng. Struct. 1997, 19, 195–207. [Google Scholar] [CrossRef]
- Romão, X.; Costa, A.; Paupério, E.; Rodrigues, H.; Vicente, R.; Varum, H.; Costa, A. Field observations and interpretation of the structural performance of constructions after the 11 May 2011 Lorca earthquake. Eng. Fail. Anal. 2013, 34, 670–692. [Google Scholar] [CrossRef]
- Wibowo, A.; Kafle, B.; Kermani, A.M.; Lam, N.T.; Wilson, J.L.; Gad, E.F. Damage in the 2008 China earthquake. In Proceedings of the Australian Earthquake Engineering Society Conference, Ballarat, Australia, 21–23 November 2008; pp. 1–8. [Google Scholar]
- Cole, G.; Dhakal, R.; Carr, A.; Bull, D. Interbuilding pounding damage observed in the 2010 Darfield earthquake. Bull. N. Z. Soc. Earthq. Eng. 2010, 43, 382–386. [Google Scholar] [CrossRef]
- Cole, G.; Dhakal, R.; Carr, A.; Bull, D. Case studies of observed pounding damage during the 2010 Darfield earthquake. In Proceedings of the 9th Pacific Conference on Earthquake Engineering, Auckland, The Netherlands, 14–16 April 2011. [Google Scholar]
- Cole, G.; Dhakal, R.; Chouw, N. Building Pounding Damage Observed in the 2011 Christchurch earthquake Christchurch Earthquake. In Proceedings of the 15th World Conference on Earthquake Engineering, Lisbon, Portugal, 24–28 September 2012. [Google Scholar]
- Cole, G.L.; Dhakal, R.P.; Turner, F.M. Building pounding damage observed in the 2011 Christchurch earthquake. Earthq. Eng. Struct. Dyn. 2012, 41, 893–913. [Google Scholar] [CrossRef]
- Gautam, D.; Rodrigues, H.; Bhetwal, K.K.; Neupane, P.; Sanada, Y. Common structural and construction deficiencies of Nepalese buildings. Innov. Infrastruct. Solut. 2016, 1, 1. [Google Scholar] [CrossRef]
- Sharma, K.; Deng, L.; Noguez, C.C. Field investigation on the performance of building structures during the April 25, 2015, Gorkha earthquake in Nepal. Eng. Struct. 2016, 121, 61–74. [Google Scholar] [CrossRef]
- Gautam, D.; Chaulagain, H. Structural performance and associated lessons to be learned from world earthquakes in Nepal after 25 April 2015 (MW 7.8) Gorkha earthquake. Eng. Fail. Anal. 2016, 68, 222–243. [Google Scholar] [CrossRef]
- Shakya, K.; Pant, D.; Maharjan, M.; Bhagat, S.; Wijeyewickrema, A.; Maskey, P. Lessons learned from performance of buildings during the September 18, 2011 earthquake in Nepal. Asian J. Civ. Eng. (Build. Hous.) 2013, 14, 719–733. [Google Scholar]
- Rai, D.C.; Singhal, V.; Raj, S.B.; Sagar, S.L. Reconnaissance of the effects of the M7. 8 Gorkha (Nepal) earthquake of April 25, 2015. Geomat. Nat. Hazards Risk 2016, 7, 1–17. [Google Scholar] [CrossRef]
- Shrestha, B.; Hao, H. Building pounding damages observed during the 2015 Gorkha earthquake. J. Perform. Constr. Facil. 2018, 32, 04018006. [Google Scholar] [CrossRef]
- Miari, M.; Choong, K.K.; Jankowski, R. Seismic pounding between adjacent buildings: Identification of parameters, soil interaction issues and mitigation measures. Soil Dyn. Earthq. Eng. 2019, 121, 135–150. [Google Scholar] [CrossRef]
- Miari, M.; Choong, K.K.; Jankowski, R. Seismic pounding between bridge segments: A state-of-the-art review. Arch. Comput. Methods Eng. 2021, 28, 495–504. [Google Scholar] [CrossRef]
- Raheem, S.E.A. Seismic pounding between adjacent building structures. Electron. J. Struct. Eng. 2006, 6, 155. [Google Scholar]
- Rojas, F.R.; Anderson, J.C. Pounding of an 18-story building during recorded earthquakes. J. Struct. Eng. 2012, 138, 1530–1544. [Google Scholar] [CrossRef]
- Raheem, S.E.A. Mitigation measures for earthquake induced pounding effects on seismic performance of adjacent buildings. Bull. Earthq. Eng. 2014, 12, 1705–1724. [Google Scholar] [CrossRef]
- Inel, M.; Cayci, B.T.; Kamal, M.; Altinel, O. Structural Pounding of Mid-Rise RC Buildings during Earthquakes. In Proceedings of the 3rd European Conference on Earthquake Engineering and Seismology, Bucharest, Romania, 4–9 September 2022. [Google Scholar]
- Efraimiadou, S.; Hatzigeorgiou, G.D.; Beskos, D.E. Structural pounding between adjacent buildings subjected to strong ground motions. Part I: The effect of different structures arrangement. Earthq. Eng. Struct. Dyn. 2013, 42, 1509–1528. [Google Scholar] [CrossRef]
- Jameel, M.; Islam, A.; Hussain, R.R.; Hasan, S.D.; Khaleel, M. Non-linear FEM analysis of seismic induced pounding between neighbouring multi-storey structures. Lat. Am. J. Solids Struct. 2013, 10, 921–939. [Google Scholar] [CrossRef]
- Anagnostopoulos, S.A.; Spiliopoulos, K.V. An investigation of earthquake induced pounding between adjacent buildings. Earthq. Eng. Struct. Dyn. 1992, 21, 289–302. [Google Scholar] [CrossRef]
- Jaradat, Y.; Far, H.; Mortazavi, M. Experimental evaluation of theoretical impact models for seismic pounding. J. Earthq. Eng. 2022. [CrossRef]
- Maison, B.F.; Kasai, K. Dynamics of pounding when two buildings collide. Earthq. Eng. Struct. Dyn. 1992, 21, 771–786. [Google Scholar] [CrossRef]
- Mouzakis, H.P.; Papadrakakis, M. Three dimensional nonlinear building pounding with friction during earthquakes. J. Earthq. Eng. 2004, 8, 107–132. [Google Scholar] [CrossRef]
- Gong, L.; Hao, H. Analysis of coupled lateral-torsional-pounding responses of one-storey asymmetric adjacent structures subjected to bi-directional ground motions Part I: Uniform ground motion input. Adv. Struct. Eng. 2005, 8, 463–479. [Google Scholar] [CrossRef]
- Crozet, V.; Politopoulos, I.; Yang, M.; Martinez, J.M.; Erlicher, S. Sensitivity analysis of pounding between adjacent structures. Earthq. Eng. Struct. Dyn. 2018, 47, 219–235. [Google Scholar] [CrossRef]
- Crozet, V.; Politopoulos, I.; Yang, M.; Martinez, J.; Erlicher, S. Influential structural parameters of pounding between buildings during earthquakes. Procedia Eng. 2017, 199, 1092–1097. [Google Scholar] [CrossRef]
- UBC97; Uniform Building Code. International Conference of Building Officials: Whittier, CA, USA, 1997.
- Jeng, V.; Kasai, K.; Maison, B.F. A spectral difference method to estimate building separations to avoid pounding. Earthq. Spectra 1992, 8, 201–223. [Google Scholar] [CrossRef]
- AS 1170.4—2007; Structural Design Actions: Earthquake Actions in Australia. Standards Australia: Sydney, NSW, Australia, 2007.
- Naderpour, H.; Khatami, S.M.; Barros, R.C. Prediction of critical distance between two MDOF systems subjected to seismic excitation in terms of artificial neural networks. Period. Polytech. Civ. Eng. 2017, 61, 516–529. [Google Scholar] [CrossRef]
- Stewart, J.P.; Fenves, G.L.; Seed, R.B. Seismic soil-structure interaction in buildings. I: Analytical methods. J. Geotech. Geoenviron. Eng. 1999, 125, 26–37. [Google Scholar] [CrossRef]
- Tabatabaiefar, H.R.; Clifton, T. Significance of considering soil-structure interaction effects on seismic design of unbraced building frames resting on soft soils. Aust. Geomech. J. 2016, 51, 55–64. [Google Scholar]
- Far, H. Dynamic behaviour of unbraced steel frames resting on soft ground. Steel Constr. 2019, 12, 135–140. [Google Scholar] [CrossRef]
- Tabatabaiefar, S.H.R.; Fatahi, B.; Samali, B. Finite difference modelling of soil-structure interaction for seismic design of moment resisting building frames. Aust. Geomech. J. 2012, 47, 113–120. [Google Scholar]
- Tabatabaiefar, H.R.; Fatahi, B.; Samali, B. Effects of dynamic soil-structure interaction on performance level of moment resisting buildings resting on different types of soil. In Proceedings of the 2011 Pacific Conference on Earthquake Engineering (PCEE), Auckland, New Zealand, 14–16 April 2011. [Google Scholar]
- Hamid Reza Tabatabaiefar, S.; Fatahi, B.; Samali, B. An empirical relationship to determine lateral seismic response of mid-rise building frames under influence of soil–structure interaction. Struct. Des. Tall Spec. Build. 2014, 23, 526–548. [Google Scholar] [CrossRef]
- Tabatabaiefar, H.R.; Fatahi, B.; Ghabraie, K.; Zhou, W.-H. Evaluation of numerical procedures to determine seismic response of structures under influence of soil-structure interaction. Struct. Eng. Mech. 2015, 56, 27–47. [Google Scholar] [CrossRef]
- Wang, L.; Shi, W.; Zhou, Y. Adaptive-passive tuned mass damper for structural aseismic protection including soil–structure interaction. Soil Dyn. Earthq. Eng. 2022, 158, 107298. [Google Scholar] [CrossRef]
- Wang, L.; Nagarajaiah, S.; Zhou, Y.; Shi, W. Experimental study on adaptive-passive tuned mass damper with variable stiffness for vertical human-induced vibration control. Eng. Struct. 2023, 280, 115714. [Google Scholar] [CrossRef]
- Wang, L.; Nagarajaiah, S.; Shi, W.; Zhou, Y. Seismic performance improvement of base-isolated structures using a semi-active tuned mass damper. Eng. Struct. 2022, 271, 114963. [Google Scholar] [CrossRef]
- Tabatabaiefar, H.R.; Massumi, A. A simplified method to determine seismic responses of reinforced concrete moment resisting building frames under influence of soil–structure interaction. Soil Dyn. Earthq. Eng. 2010, 30, 1259–1267. [Google Scholar] [CrossRef]
- Tabatabaiefar, H.R.; Fatahi, B. Idealisation of soil–structure system to determine inelastic seismic response of mid-rise building frames. Soil Dyn. Earthq. Eng. 2014, 66, 339–351. [Google Scholar] [CrossRef]
- Tabatabaiefar, H.R. Detail design and construction procedure of laminar soil containers for experimental shaking table tests. Int. J. Geotech. Eng. 2016, 10, 328–336. [Google Scholar] [CrossRef]
- Tabatabaiefar, S.H.R.; Fatahi, B.; Samali, B. Numerical and experimental investigations on seismic response of building frames under influence of soil-structure interaction. Adv. Struct. Eng. 2014, 17, 109–130. [Google Scholar] [CrossRef]
- Tabatabaiefar, H.R.; Mansoury, B. Detail design, building and commissioning of tall building structural models for experimental shaking table tests. Struct. Des. Tall Spec. Build. 2016, 25, 357–374. [Google Scholar] [CrossRef]
- Tabatabaiefar, H.R. Development of synthetic soil mixture for experimental shaking table tests on building frames resting on soft soils. Geomech. Geoengin. 2017, 12, 28–35. [Google Scholar] [CrossRef]
- Naserkhaki, S.; El-Rich, M.; Aziz, F.; Pourmohammad, H. Pounding between adjacent buildings of varying height coupled through soil. Struct. Eng. Mech. 2014, 52, 573–593. [Google Scholar] [CrossRef]
- Fatahi, B.; Van Nguyen, Q.; Xu, R.; Sun, W.-j. Three-dimensional response of neighboring buildings sitting on pile foundations to seismic pounding. Int. J. Geomech. 2018, 18, 04018007. [Google Scholar] [CrossRef]
- Ghandil, M.; Aldaikh, H. Damage-based seismic planar pounding analysis of adjacent symmetric buildings considering inelastic structure–soil–structure interaction. Earthq. Eng. Struct. Dyn. 2017, 46, 1141–1159. [Google Scholar] [CrossRef]
- Naserkhaki, S.; Aziz, F.N.; Pourmohammad, H. Earthquake induced pounding between adjacent buildings considering soil-structure interaction. Earthq. Eng. Eng. Vib. 2012, 11, 343–358. [Google Scholar] [CrossRef]
- Farghaly, A.A. Seismic analysis of adjacent buildings subjected to double pounding considering soil–structure interaction. Int. J. Adv. Struct. Eng. 2017, 9, 51–62. [Google Scholar] [CrossRef]
- Kontoni, D.-P.N.; Farghaly, A.A. Seismic response of adjacent unequal buildings subjected to double pounding considering soil-structure interaction. Computation 2018, 6, 10. [Google Scholar] [CrossRef]
- Naserkhaki, S.; El Rich, M.; Abdul, A.F.; Pourmohammad, H. Separation gap, a critical factor in earthquake induced pounding between adjacent buildings. Asian J. Civ. Eng. (Build. Hous.) 2013, 14, 881–898. [Google Scholar]
- Li, P.; Liu, S.; Lu, Z. Studies on pounding response considering structure-soil-structure interaction under seismic loads. Sustainability 2017, 9, 2219. [Google Scholar] [CrossRef]
- Shakya, K.; Wijeyewickrema, A.C. Mid-column pounding of multi-story reinforced concrete buildings considering soil effects. Adv. Struct. Eng. 2009, 12, 71–85. [Google Scholar] [CrossRef]
- Shakya, K.; Wijeyewickrema, A.C.; Ohmachi, T. Mid-column seismic pounding of reinforced concrete buildings in a row considering effects of soil. In Proceedings of the 14th World Conference on Earthquake Engineering, Beijing, China, 12–17 October 2008; pp. 12–17. [Google Scholar]
- Miari, M.; Jankowski, R. Analysis of pounding between adjacent buildings founded on different soil types. Soil Dyn. Earthq. Eng. 2022, 154, 107156. [Google Scholar] [CrossRef]
- Miari, M.; Jankowski, R. Incremental dynamic analysis and fragility assessment of buildings founded on different soil types experiencing structural pounding during earthquakes. Eng. Struct. 2022, 252, 113118. [Google Scholar] [CrossRef]
- Miari, M.; Jankowski, R. Pounding between high-rise buildings founded on different soil types. In Proceedings of the 17th World Conference on Earthquake Engineering, Sendai, Japan, 27 September 2021. [Google Scholar]
- ASCE Standard ASCE/SEI 7-10; Minimum Design Loads for Buildings and Other Structures. American Society of Civil Engineers: Reston, VA, USA, 2013.
- Miari, M.; Jankowski, R. Analysis of floor-to-column pounding of buildings founded on different soil types. Bull. Earthq. Eng. 2022, 20, 7241–7262. [Google Scholar] [CrossRef]
- Miari, M.; Jankowski, R. Shaking table experimental study on pounding between adjacent structures founded on different soil types. Structures 2022, 44, 851–879. [Google Scholar] [CrossRef]
- Miari, M.; Jankowski, R. Seismic gap between buildings founded on different soil types experiencing pounding during earthquakes. Earthq. Spectra 2022, 38, 2183–2206. [Google Scholar] [CrossRef]
- Miari, M.; Jankowski, R. Analysis of the effect of the seismic gap on the response of buildings experiencing pounding during earthquakes. AIP Conf. Proc. 2023, 2848, 020021. [Google Scholar]
- Miari, M.; Jankowski, R. Assessment of codes recommendations for the evaluation of the seismic gap of buildings founded on different soil types. AIP Conf. Proc. 2023, 2848, 020022. [Google Scholar]
- Yaghmaei-Sabegh, S.; Jalali-Milani, N. Pounding force response spectrum for near-field and far-field earthquakes. Sci. Iran. 2012, 19, 1236–1250. [Google Scholar] [CrossRef]
- Jaradat, Y.; Far, H.; Saleh, A. Examining the adequacy of separation gaps between adjacent buildings under near-field and far-field earthquakes. WIT Trans. Built Environ. 2021, 202, 59–71. [Google Scholar]
- Bathe, K.-J.; Wilson, E.L. Numerical Methods in Finite Element Analysis; Prentice Hall: Hoboken, NJ, USA, 1976. [Google Scholar]
- Hao, H. Analysis of seismic pounding between adjacent buildings. Aust. J. Struct. Eng. 2015, 16, 208–225. [Google Scholar] [CrossRef]
- Pacific Earthquake Engineering Research Centre (PEER NGA DATABASE). Available online: https://ngawest2.berkeley.edu/ (accessed on 8 August 2023).
- ETABS, version 18; Computers & Structures Inc.: Berkeley, CA, USA, 2018.
- DesRoches, R.; Muthukumar, S. Effect of pounding and restrainers on seismic response of multiple-frame bridges. J. Struct. Eng. 2002, 128, 860–869. [Google Scholar] [CrossRef]
- Bendat, J.; Piersol, A. Random Data: Analysis and Measurement Procedures; Wiley-Intersci: New York, NY, USA, 1971; Volume 1, p. 75. [Google Scholar]
- Ibrahimbegovic, A.; Wilson, E.L. Simple numerical algorithms for the mode superposition analysis of linear structural systems with non-proportional damping. Comput. Struct. 1989, 33, 523–531. [Google Scholar] [CrossRef]
- Jaradat, Y.; Far, H. Optimum stiffness values for impact element models to determine pounding forces between adjacent buildings. Struct. Eng. Mech. 2020, 77, 293–304. [Google Scholar]
Disclaimer/Publisher’s Note: The statements, opinions and data contained in all publications are solely those of the individual author(s) and contributor(s) and not of MDPI and/or the editor(s). MDPI and/or the editor(s) disclaim responsibility for any injury to people or property resulting from any ideas, methods, instructions or products referred to in the content. |
© 2023 by the authors. Licensee MDPI, Basel, Switzerland. This article is an open access article distributed under the terms and conditions of the Creative Commons Attribution (CC BY) license (https://creativecommons.org/licenses/by/4.0/).