Abstract
Orthotropic anisotropic steel bridge panels are widely used in civil engineering due to their advantages of light deadweight, high ultimate bearing capacity, and wide range of applications. However, their fatigue problem is serious, and the fatigue-resistant design of the steel box girder diaphragm curved cutout is still difficult. In order to effectively predict the fatigue life of this typical fatigue-susceptible detail, a fatigue test of the specimen with curved notched segments of the diaphragm was carried out. ABAQUS 2016 version finite element analysis software was used to establish three kinds of finite element simplified models of the fatigue specimens with curved notches, and the laws of the influence of different notch radii on the fatigue life of the specimens were studied. Through the finite element solution of the three arc notch specimen models with different radii under the tensile load of 50 kN their respective principal stress distributions were obtained. The critical distance theory was introduced to analyze the characteristic stresses in the stress concentration area of the arc notch, and the point method and line method were used to calculate the characteristic stresses. The fatigue life prediction models of three kinds of notched components were established by combining the material fatigue limit and FE-safe life results. The results show that the point method is more conservative than the line method; no matter if the point method or the line method is used, the characteristic stress and the notch radius are inversely proportional to each other, and it is beneficial for the fatigue life of the structure to appropriately increase the notch radius. The fatigue prediction model of steel box girder diaphragms with curved notches based on the critical distance theory is of high accuracy, which is basically consistent with the test results, verifying the feasibility of the critical distance theory in the fatigue life prediction of notched specimens, and providing a reference for the fatigue life assessment of similar steel structures.
1. Introduction
The fatigue of orthotropic anisotropic steel bridge deck panels, as the preferred deck structure for large-span bridges, has been a hot issue to which scholars from various countries have attached great importance [1,2,3]. Among them, fatigue cracks in the parent material sprouting from curved cutouts in the diaphragm are one of the major fatigue diseases of orthotropic anisotropic bridge deck panels [4,5,6]. Existing studies have shown that different notch geometries and dimensions, such as notch type and arc radius size, have a significant effect on the fatigue performance of curved notch details [7,8,9], but these conclusions are mainly drawn using the nominal stress method based on S–N curves or field monitoring [10,11]. It is worth pointing out that nominal stresses based on S–N curves are mainly used to predict the fatigue life of arcuate cutouts in diaphragms. The nominal stress method has been widely used by virtue of its advantages of clear definition and easy calculation [12,13,14,15,16]. The method is indeed convenient and feasible for clearly stressed members. However, the fatigue rating based on the nominal stress method is different in different design codes, and with complex geometric details, it is difficult to find the corresponding fatigue design detail types in the codes. Although both Eurocode 3 and AASHTO LRFD [17,18] have proposed a recommended curved cutout type, there is no unified understanding of the fatigue design of this construction detail, and the limitations of its use are large. In contrast, the field monitoring workload is huge, and the influence of traffic flow is significant. At present, there is a lack of accurate and simple methods to study the fatigue life at curved notches under different notch radii.
The critical distance theory has been applied to the fatigue analysis of notched components in the mechanical field [19,20,21,22,23]. The basic concept of the critical distance theory is that the fatigue damage of notches depends not only on the peak point of stress concentration, but also on the stress distribution in a certain distance range near the stress concentration [24]. This distance range is called the “critical distance L”. The average stress within this distance is defined as the characteristic stress, which is the controlling parameter for fatigue damage of notched members, and fatigue damage occurs when the characteristic stress reaches a threshold value. Neuber and Peterson [25,26] made the first attempt to use the critical distance theory to evaluate the fatigue strength of notched members. Kim et al. [27] found that specimens with different geometrical features and notch sizes had different critical distance. Taylor et al. extensively tested the efficiency and accuracy of the critical distance theory for the fatigue prediction of notched members and welded joints, verifying the applicability to a wide range of notch geometries [28,29,30]. Others have utilized the extended finite element method to analyze the fatigue crack extension, which in turn enables the fatigue life prediction of uncracked structural details [31,32]. For example, Yafei Ma et al. [33,34] investigated the fatigue of bridge steel wires based on the critical region method and Bayesian Gaussian process combined with the finite element method, and found that there was a good agreement between theoretical predictions and experimental observations. Existing studies have proved the applicability of the critical distance theory. Theoretically, any type of stress concentration problem can be analyzed using the critical distance, but few people have analyzed the fatigue problem of steel box girder diaphragms at the curved cutout with the critical distance theory.
Therefore, in this paper, fatigue life tests of notched specimens were carried out with three rectangular plate members with arc notches with different radii as the research object. ABAQUS software was used for finite element simulation to analyze the fatigue performance of arc notches of different radii. The fatigue life prediction model at the notch was established by using the critical distance theory, and the influence of the radius on the fatigue life of the arc notch was investigated. A simplified method for the fatigue life analysis of steel box girder diaphragm arc notches is obtained, with a view to providing a reference for fatigue design and the evaluation of steel bridge panel arc notches.
2. Critical Distance Theory
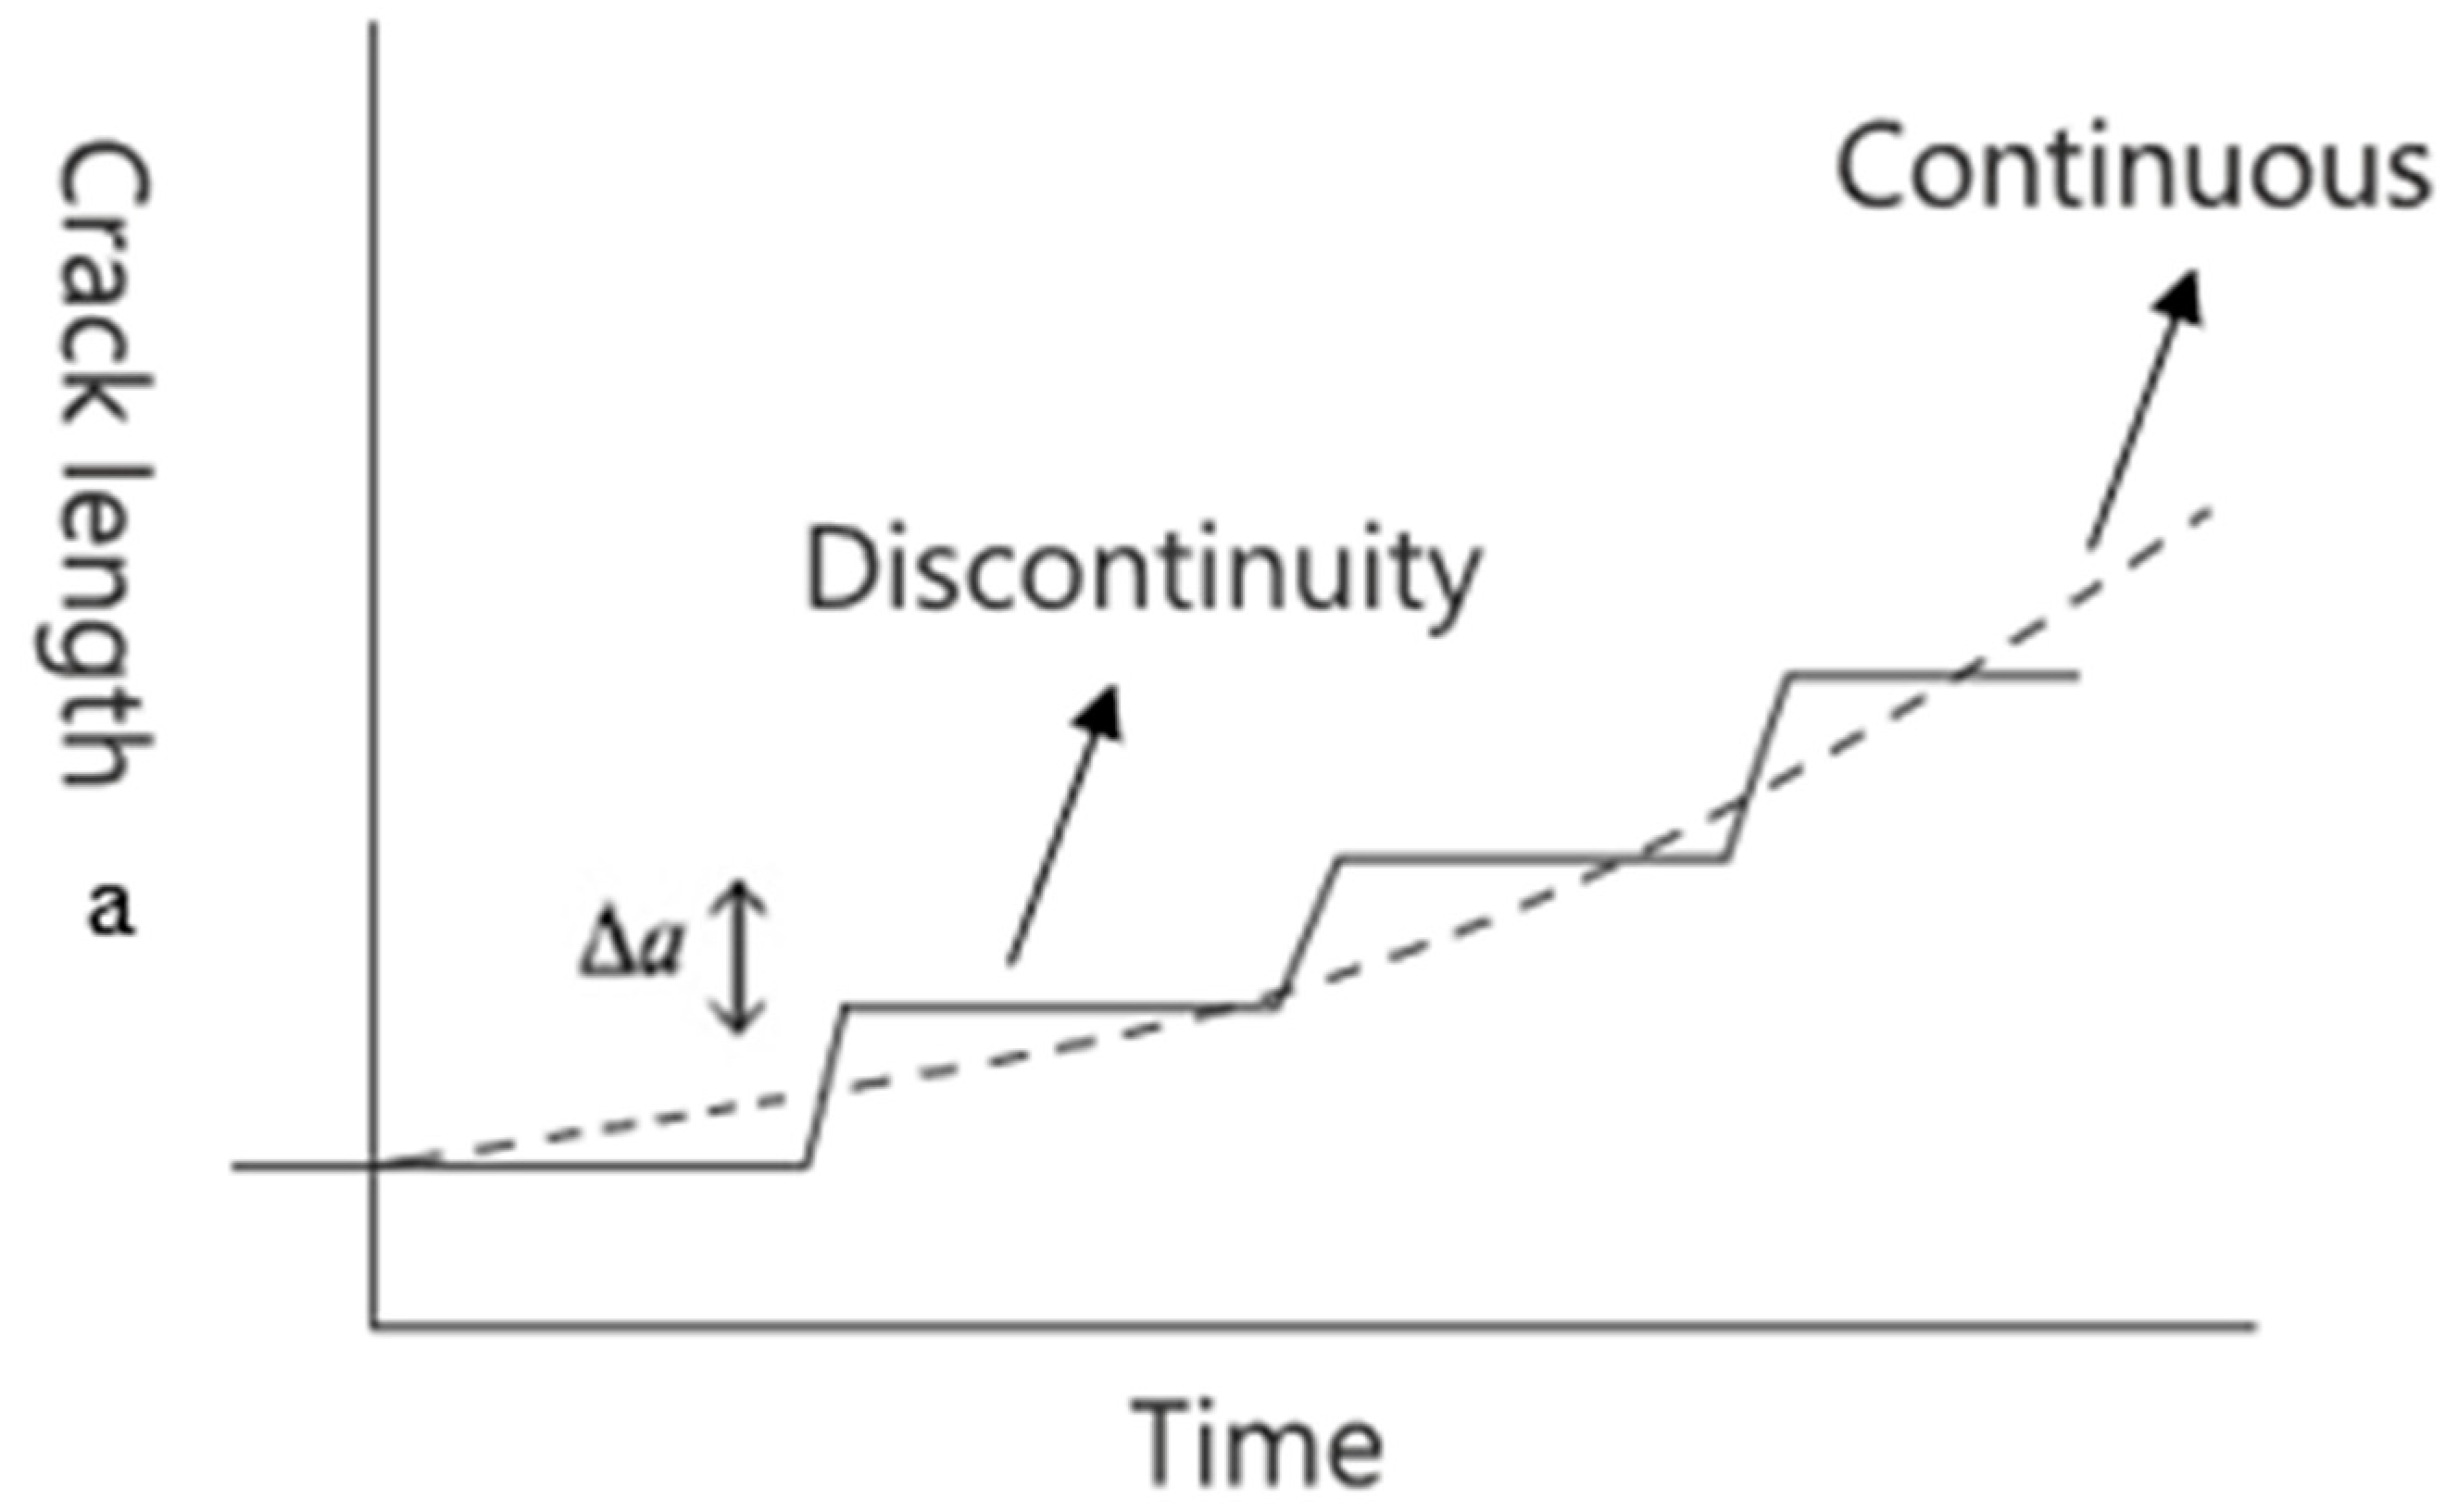
The critical distance theory belongs to the combined field of continuum media mechanics and linear elastic fracture mechanics, and its fracture mechanics is based on the assumption that crack extension does not occur smoothly and continuously as described in the traditional linear elastic fracture mechanics theory, and that crack extension is usually discontinuous, and occurs in a discontinuous manner through a series of jumps (see Figure 1), the step size of which is determined by the microstructure and deformation behavior of the material [35]. On the other hand, critical distance theory has many features in common with linear elastic fracture mechanics in terms of the mechanism. For example, the application of a small-scale yield criterion is expected in both critical distance theory and linear elastic fracture mechanics, requiring that the plastic zone at the root of the notch falls within a very small region of the specimen size in order to effectively predict fatigue fracture.

Figure 1.
Crack expansion-time relationship diagram.
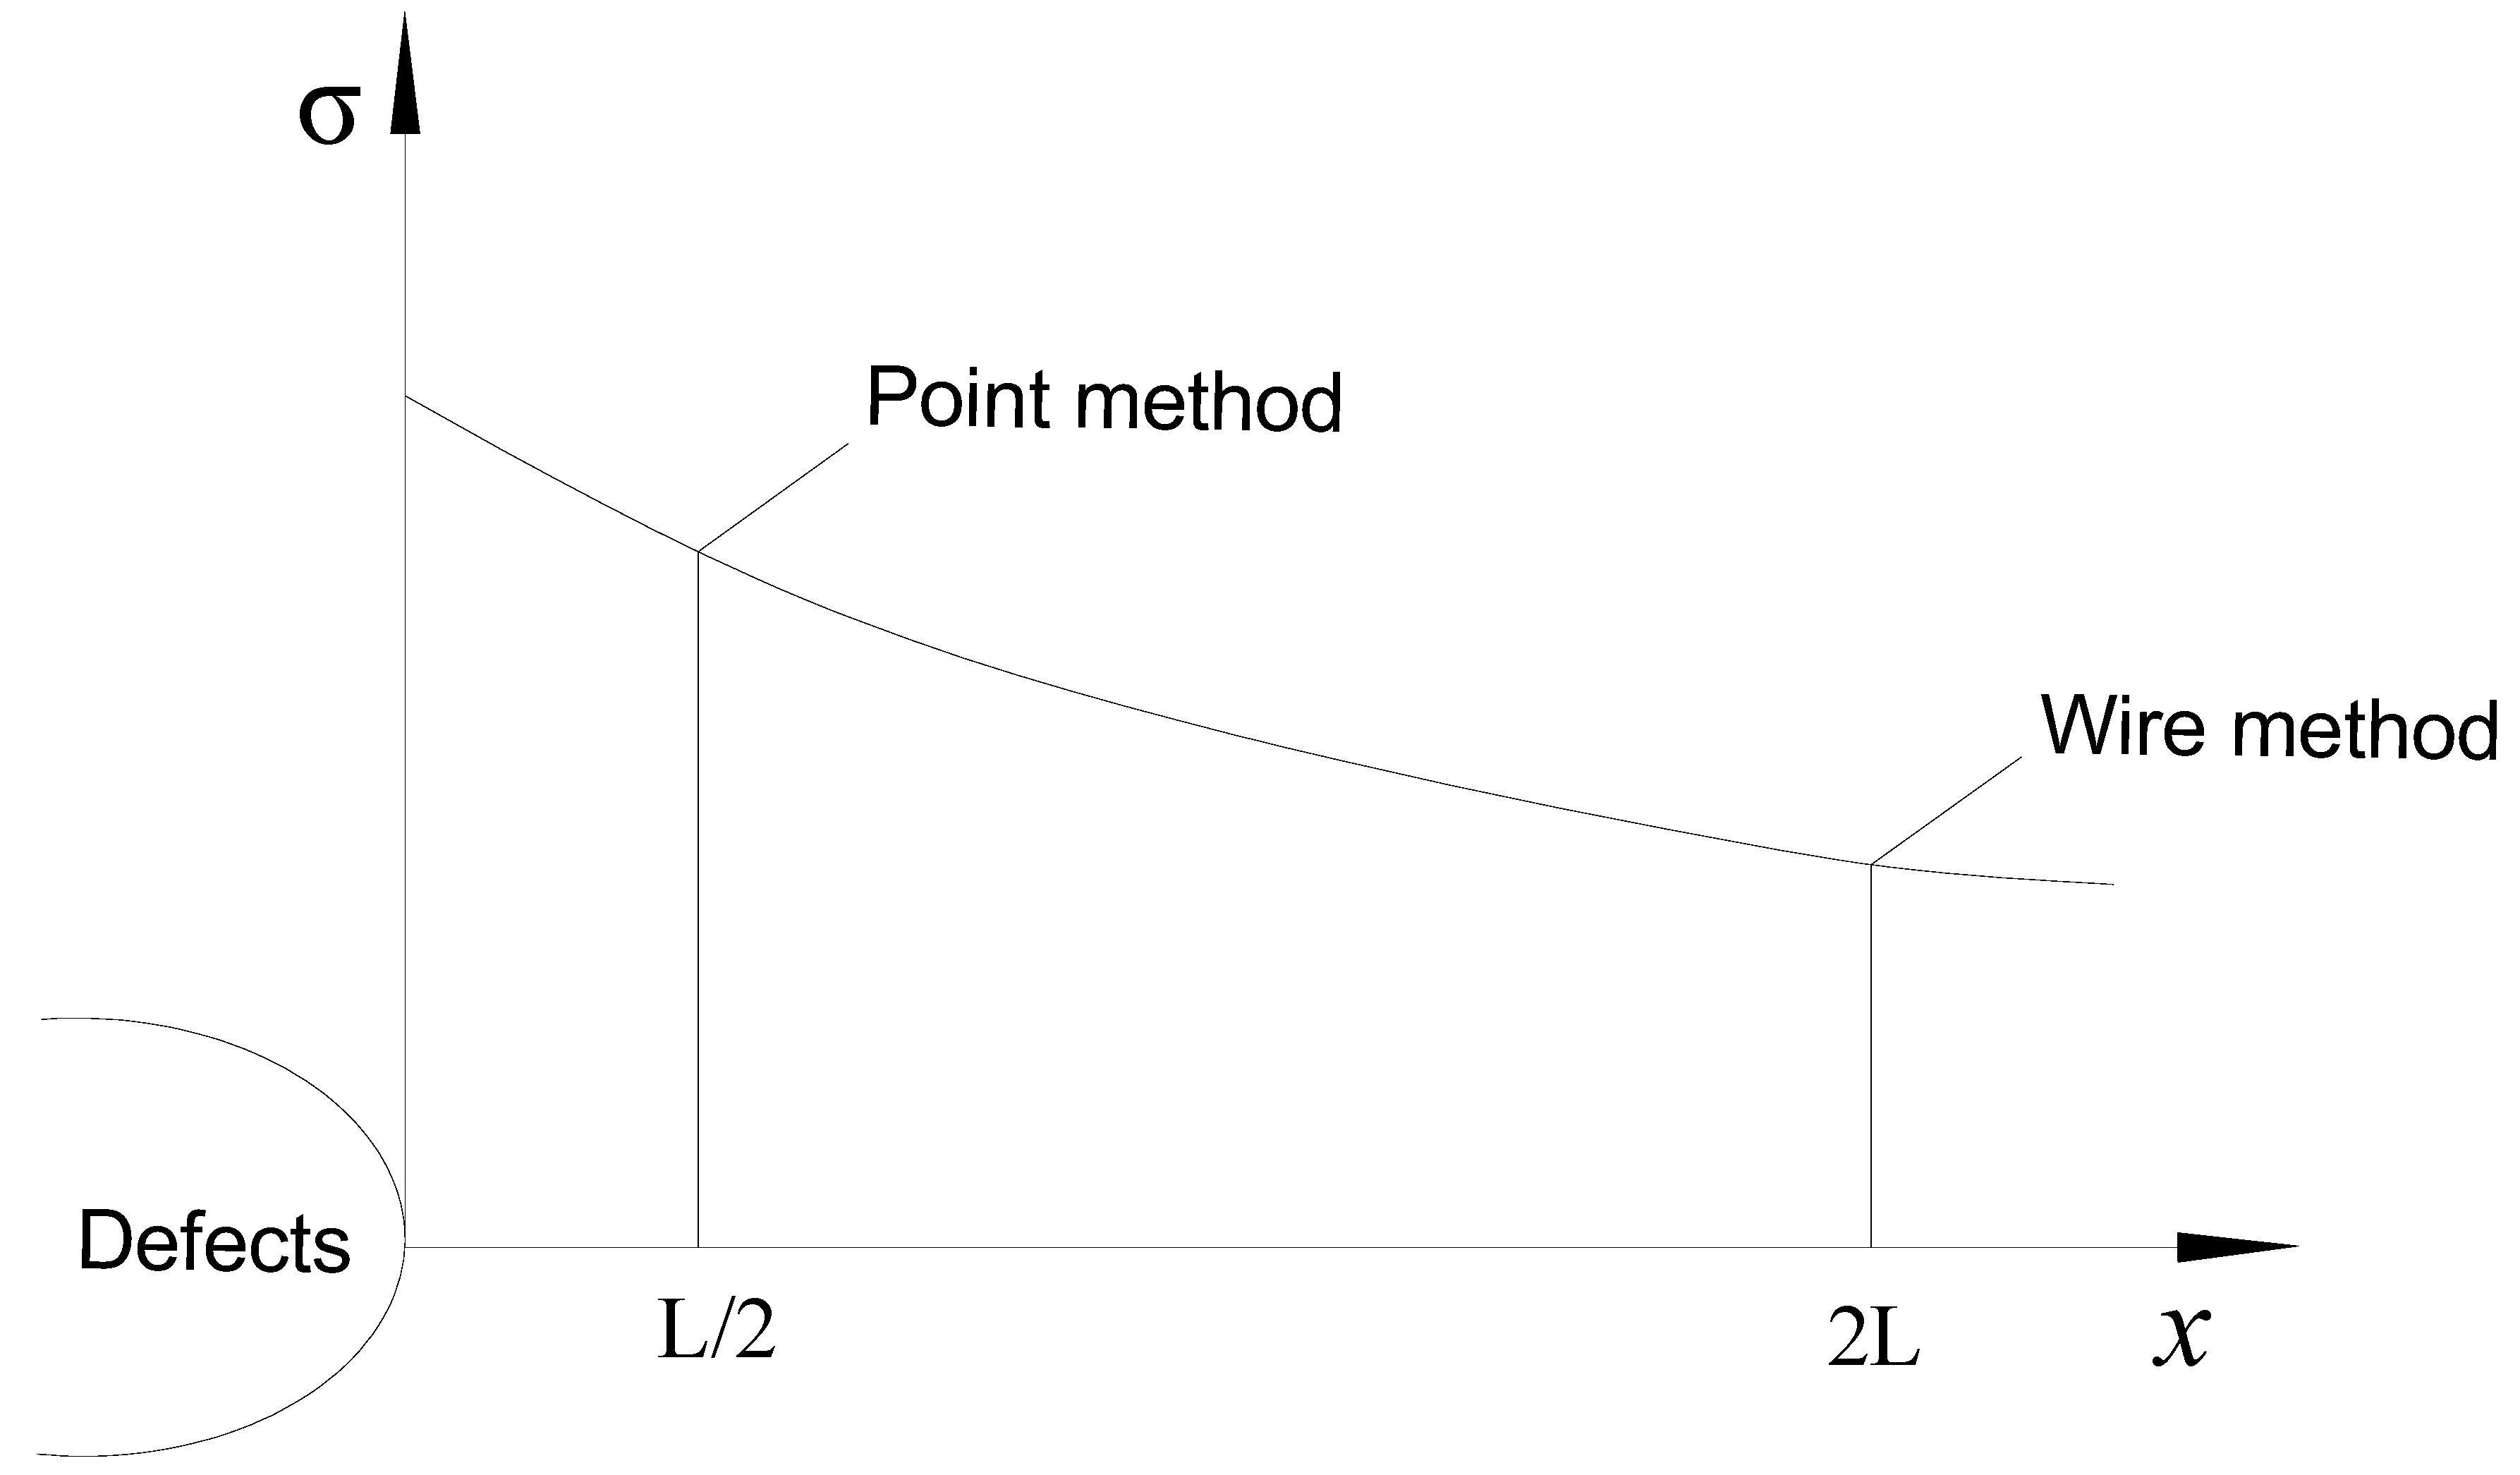
According to the different methods of calculating stress, the critical distance theory is divided into the point method, line method, area method, and volume method. Among them, the point method and the line method are the two most important calculation methods of the critical distance theory, where the point method considers the characteristic stress as the maximum principal stress at L/2 from the tip of the notch, and the line method considers the characteristic stress as the average value of the maximum principal stress within a line along the hot spot path of 2L, as shown in Figure 2.
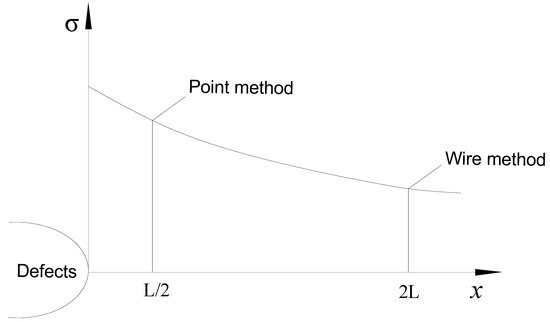
Figure 2.
Schematic diagram of critical distance theory point method and line method.
The characteristic stress in the line method can be calculated as
where σ(x) denotes the maximum principal stress at distance x from the defect along the hot spot path direction.
There are two important parameters in the critical distance theory: material strength and critical distance . Generally speaking, the values of both are only related to the material properties themselves. When the radius of the stress concentration region at the root of the notch in a structure or member is infinitely close to 0, the notch can be approximated as a sharp crack, and fatigue damage occurs in the notched member when the stress intensity factor of the member is equal to the fracture toughness of the material in this scenario. The fracture toughness is a constant for a given material, independent of the crack itself and the applied load, which is an inherent property of the material and is only related to the material itself. Certain parameters in the critical distance theory point method can be expressed in the form of fracture toughness correlation. David Taylor, in his book Critical Distance Theory: Engineering Fracture Mechanics, states that [36], the following expressions exist for fracture toughness , brittle fracture strength , and crack length :
The notch is approximately equivalent to a sharp crack condition; the relationship between the stress at the root of the notch and the distance can be expressed by Equation (3):
Relation (4) is only applicable in the case of , that is, the length of the sharp crack must be much larger than the critical distance of the material. Relationships (2) and (4) can be combined to obtain the following relationship for calculating the critical distance:
where is the material fracture toughness; is the characteristic stress.
In fatigue analysis, the same type of consistent relationship can be derived by simply replacing the corresponding static load parameters with fatigue-related parameters. The fatigue equivalent of fracture toughness is the fatigue crack expansion threshold , so the relation of critical distance in fatigue analysis can be expressed as (6).
where is the crack expansion threshold; is the fatigue limit of the material.
3. Notched Specimen Fatigue Life Test
3.1. Test Materials
The steel plate used for the test was Q345qD bridge structural steel. A series of nondestructive tests such as phased-array ultrasonic flaw detection were performed on the interior of the original material before the specimen was processed to ensure that the base material was initially free of defects and to avoid the introduction of random factors affecting the fatigue test results. The mechanical property parameters of the materials used in the tests are shown in Table 1.

Table 1.
Mechanical properties of materials.
3.2. Experimental Design
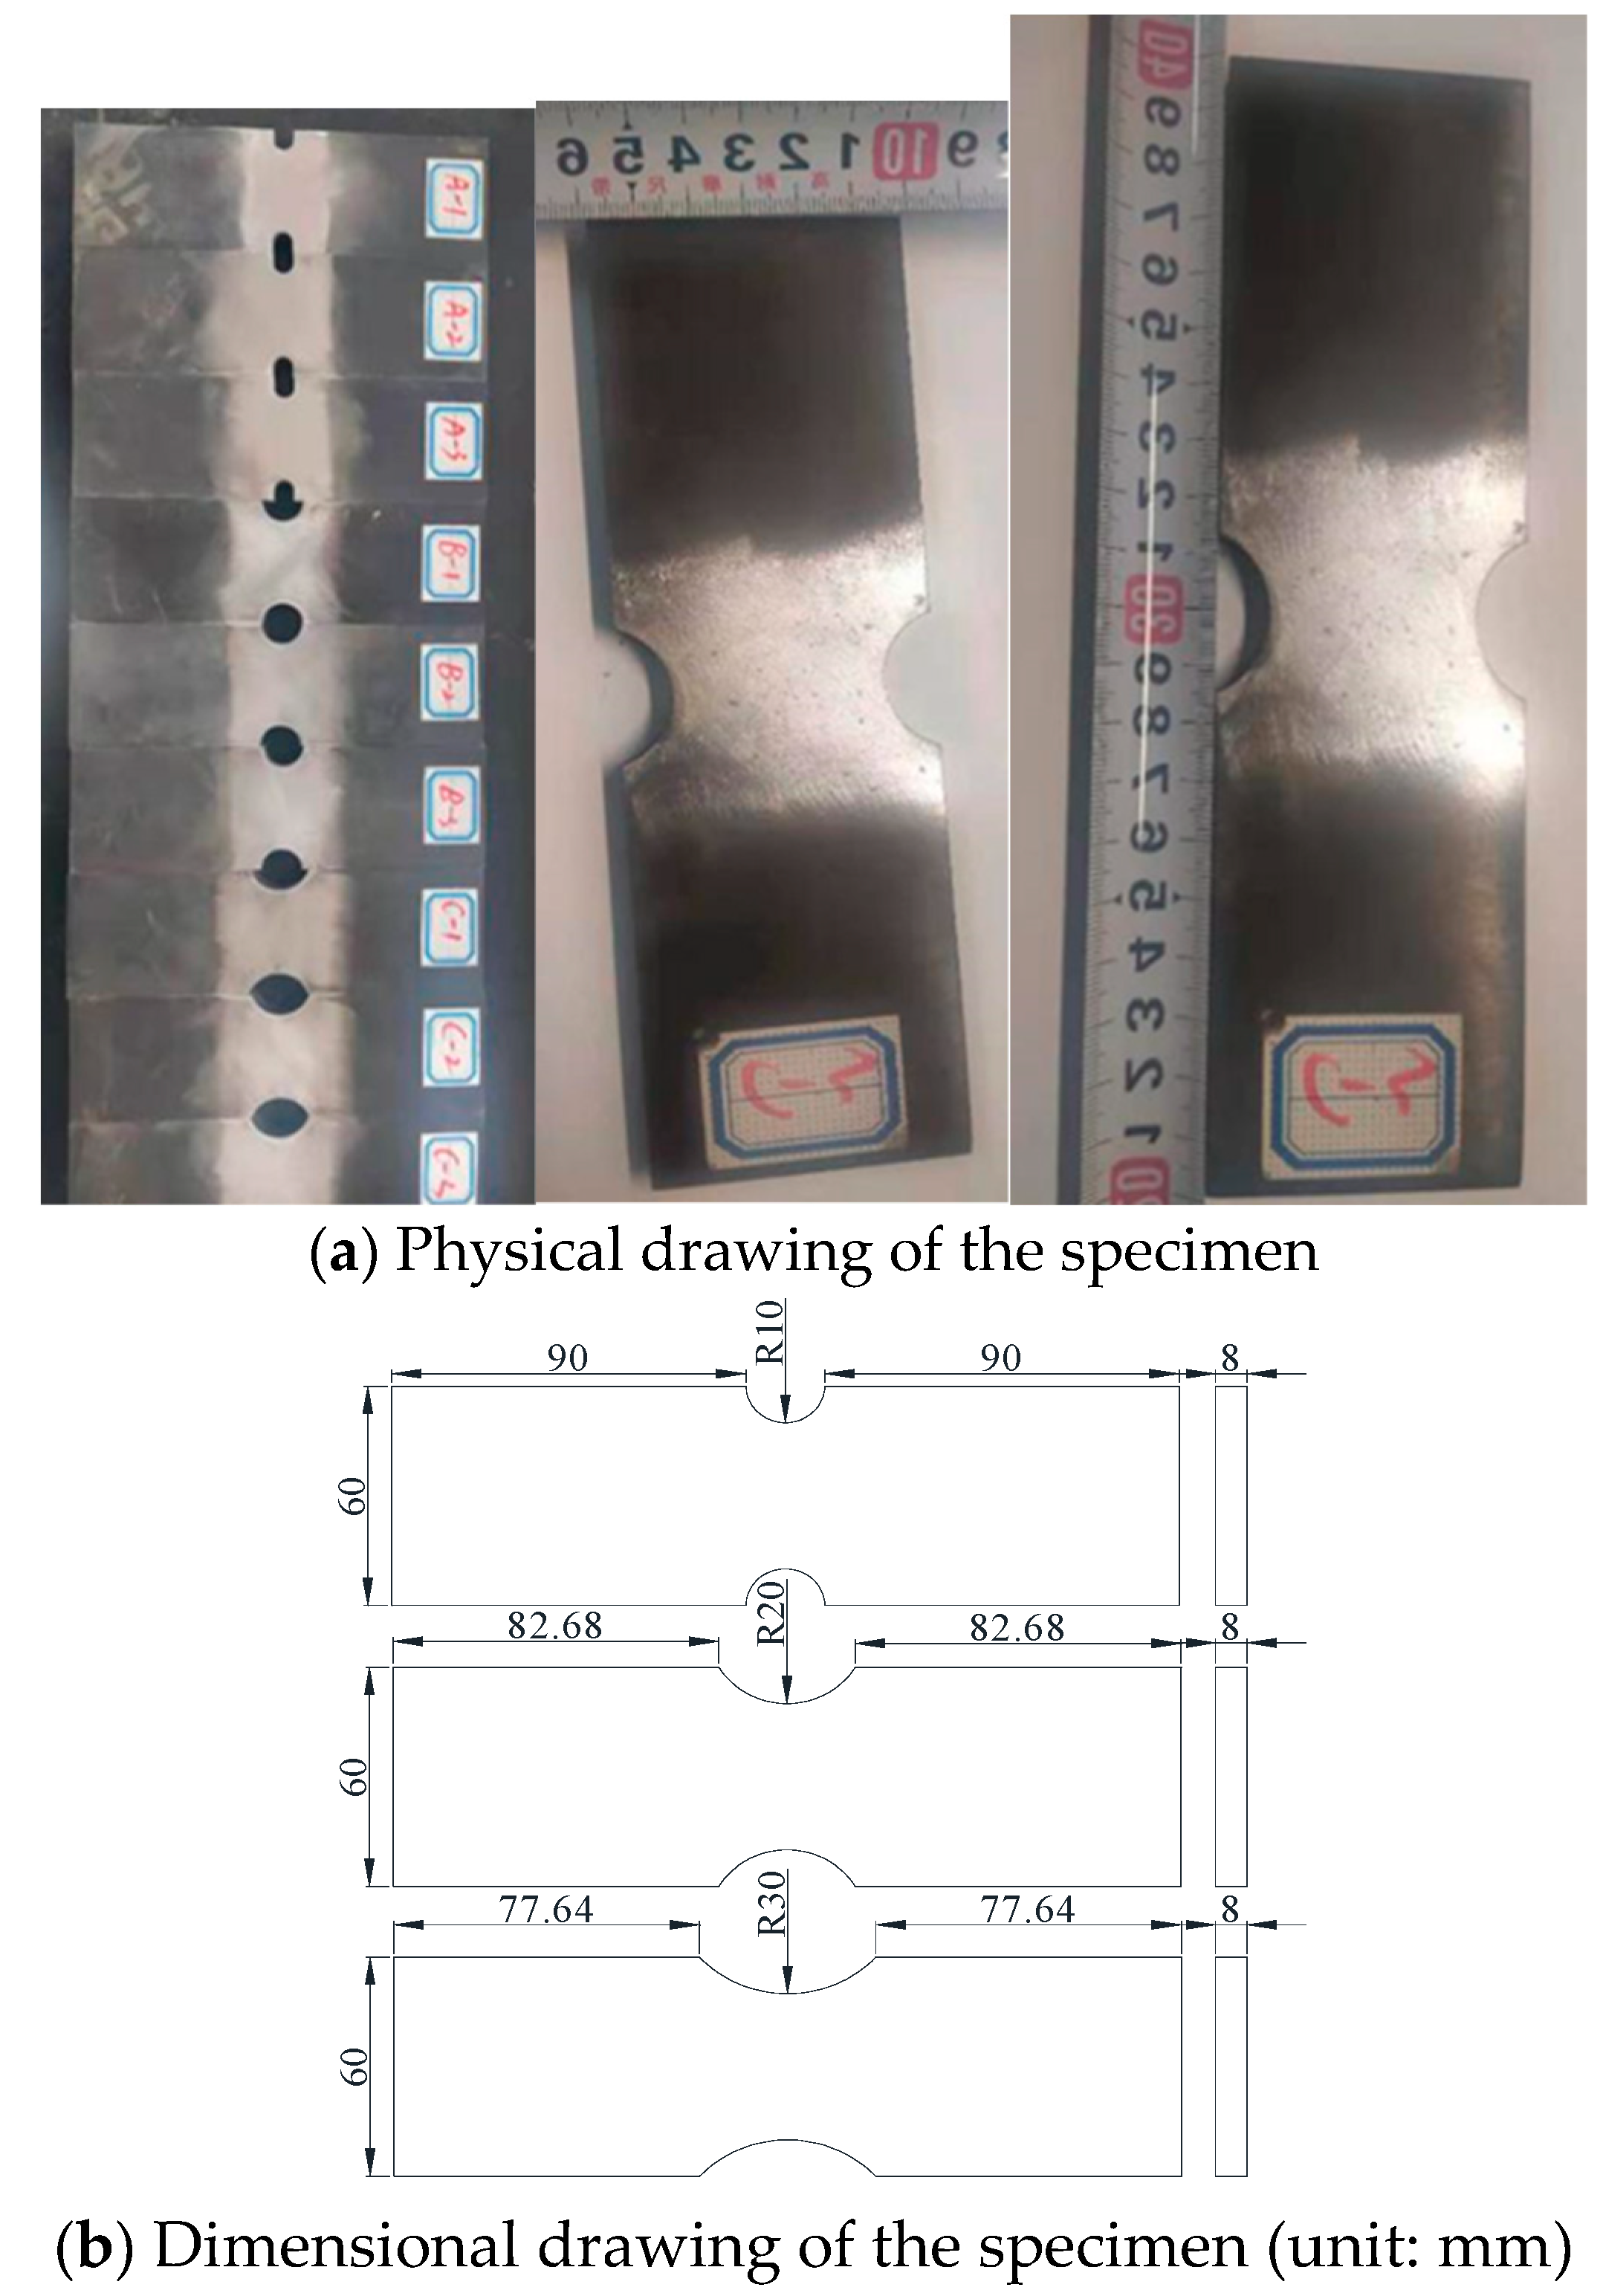
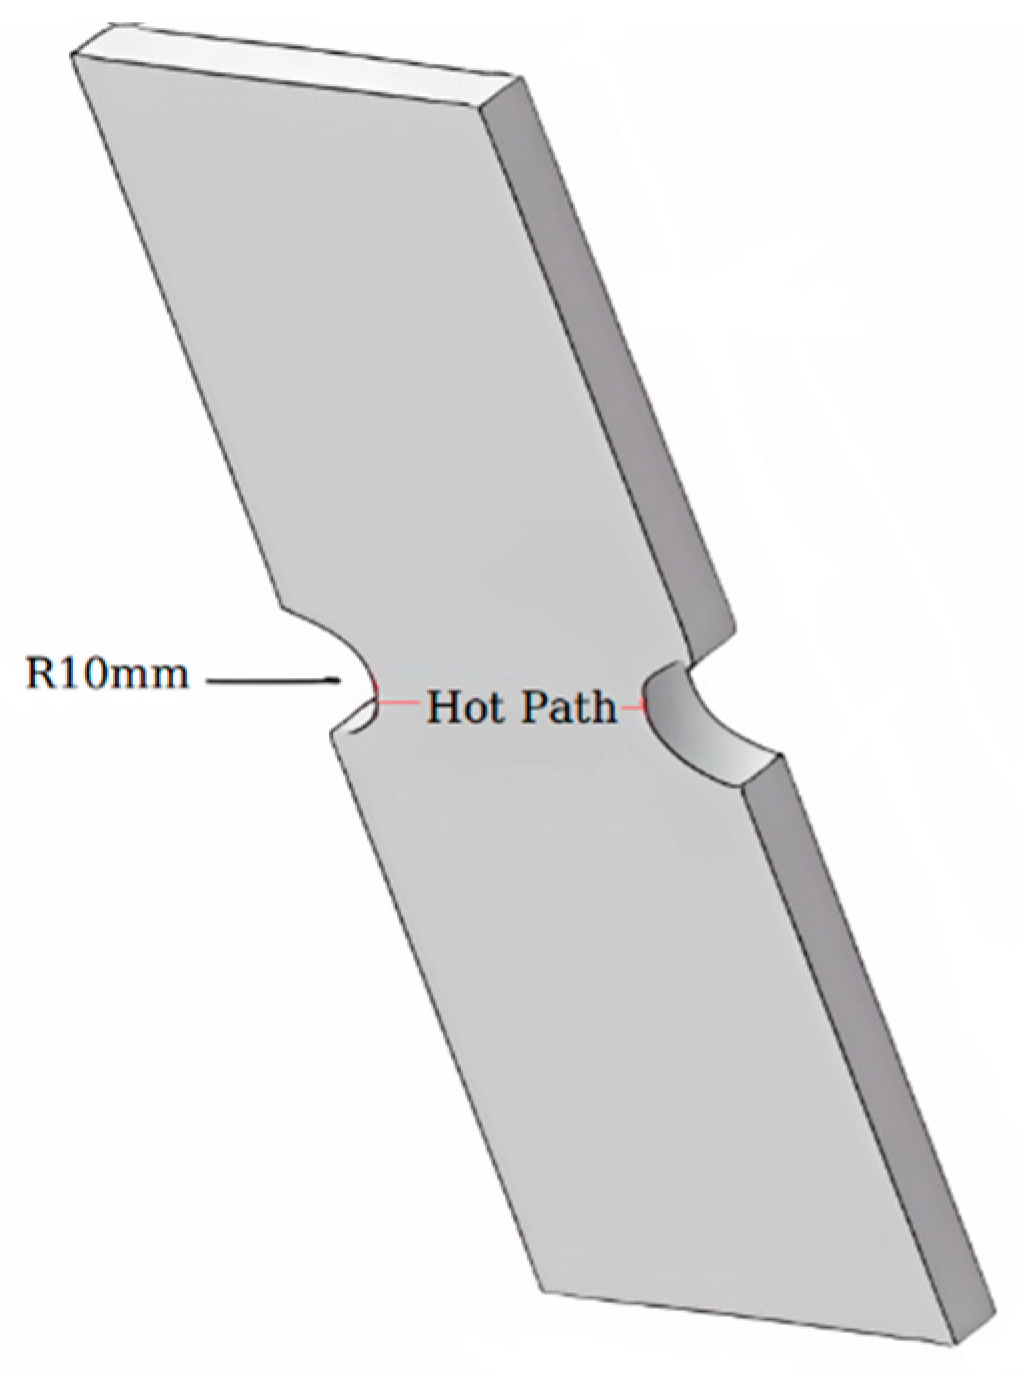
The test specimens were designed and produced in accordance with the standard specification of “Metallic materials fatigue testing axial force controlled method” (GB/T3075-2021) [37], and three arc-shaped notched plate specimens with notch radii of 10, 20, and 30 mm, respectively, are shown in Figure 3, and the dimensional parameters of the specimens are shown in Table 2. To ensure consistent force flow at the kerf, the width of the center position of the three types of specimens was controlled to be 40 mm.
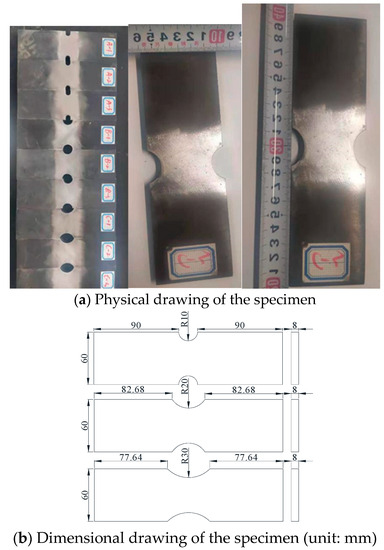
Figure 3.
Standard specimen.
Table 2.
Specimen size parameters.
According to the “Structural adhesives guidelines for the surface preparation of metals and plastics prior to adhesive bonding” GB/T21526-2008 [38] specification put forward inside the surface modification recommendations and plastics before bonding of structural adhesives, relevant surface modification is required before strain gauges are applied to metal surfaces. Integrating the material properties and the test situation, this paper adopts the physical method suggested in the specification in grinding for the relevant treatment, and its specific abrasion steps are as follows:
- Firstly, polish off the protective coating and impurities of the specimen with a grinding machine to make the specimen show a metallic luster;
- Dry grinding with water-grit sandpaper (grit range ~), firstly, 45° forward to the position of the strain gauges, until uniform light scratches appear on the surface of the test piece;
- Continue dry grinding perpendicular to the previous direction until all the light scratches in the forward 45° direction have been removed;
- Sand in a circular direction (diameter ) until all the scratches produced in the first two steps are ground off and the surface is uniform;
- Clean the debris. Use a clean lint-free cotton cloth dipped in alcohol to scrub the test piece until no contamination occurs after the cotton cloth is scrubbed.
Starting from the fatigue hot spot, multiple strain gauges are arranged along the direction of the highest stress gradient. The strain gauges sg1~sg4 are arranged on the same side of the specimen surface, and sg5~sg8 are symmetrically arranged on the other side of the specimen surface. As shown in Figure 4. Among them, sg1 (sg5) and sg4 (sg8) are symmetrically arranged at 5 mm from the free edge of the left and right cuts, and sg2 (sg6) and sg3 (sg7) are symmetrically arranged at 15 mm from the free edge of the left and right cuts. The size of the resistive strain gauge sensitive grid is 1 mm × 2 mm.

Figure 4.
Strain gauge arrangement.
3.3. Test Loading
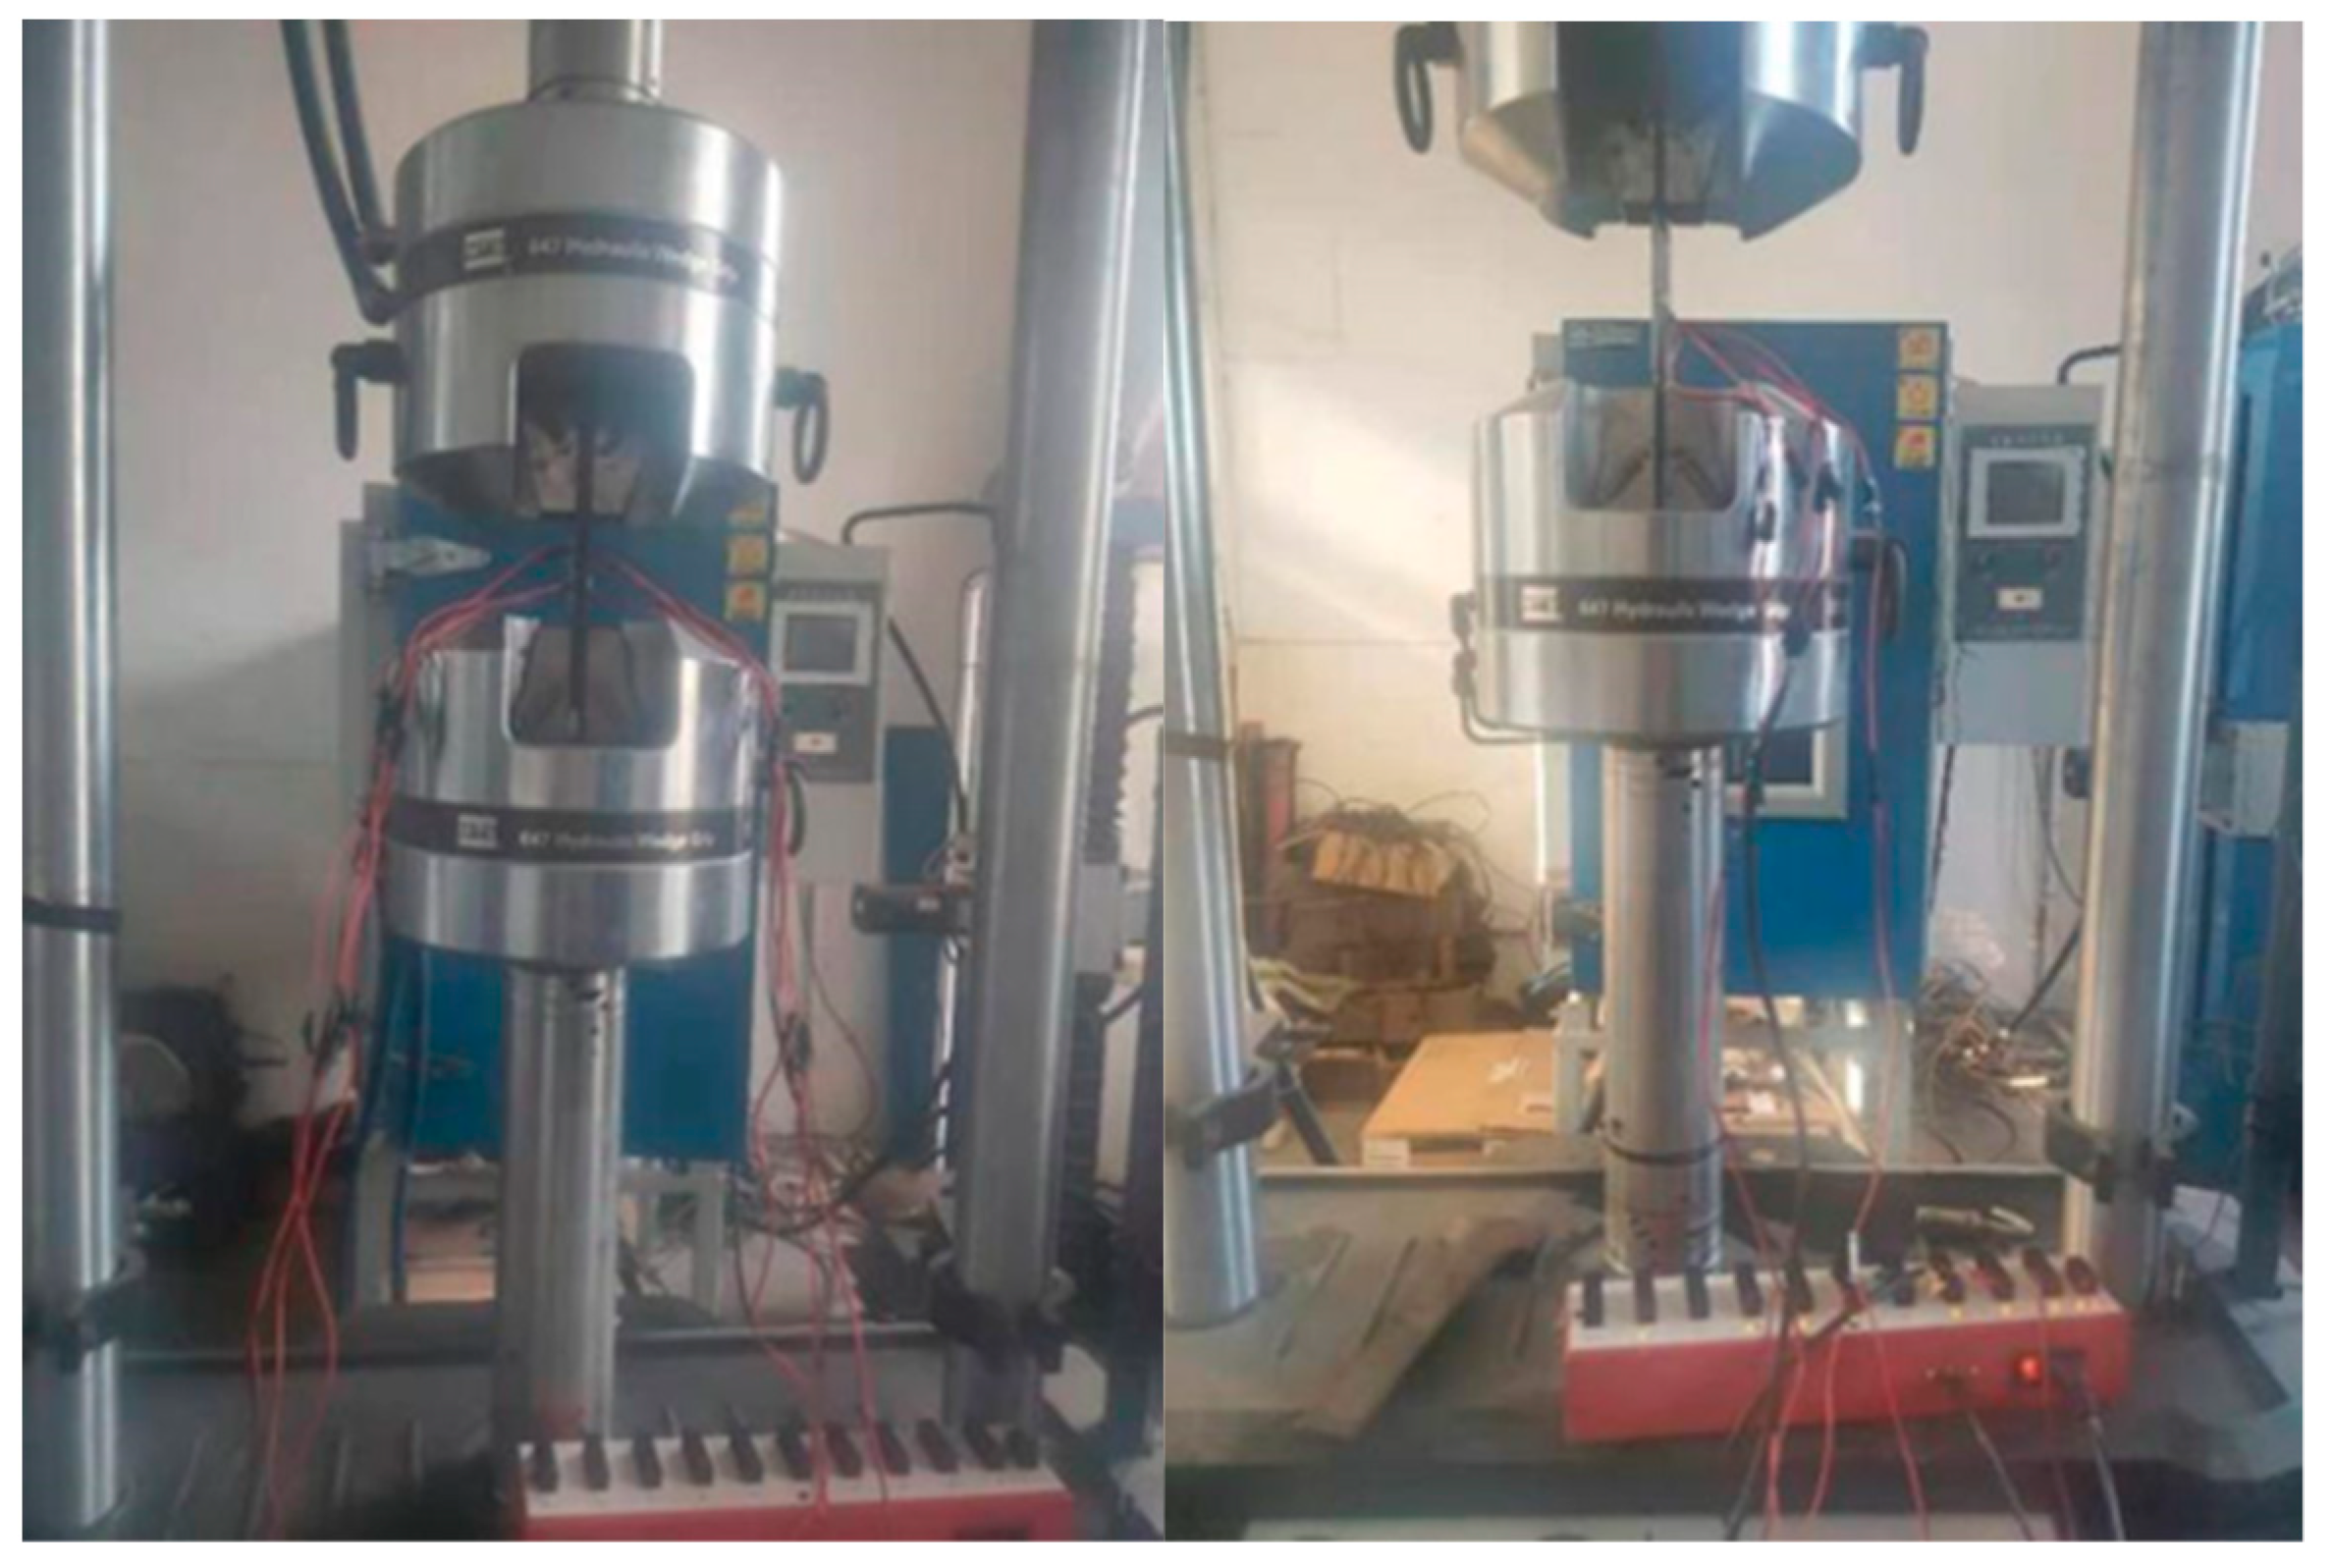
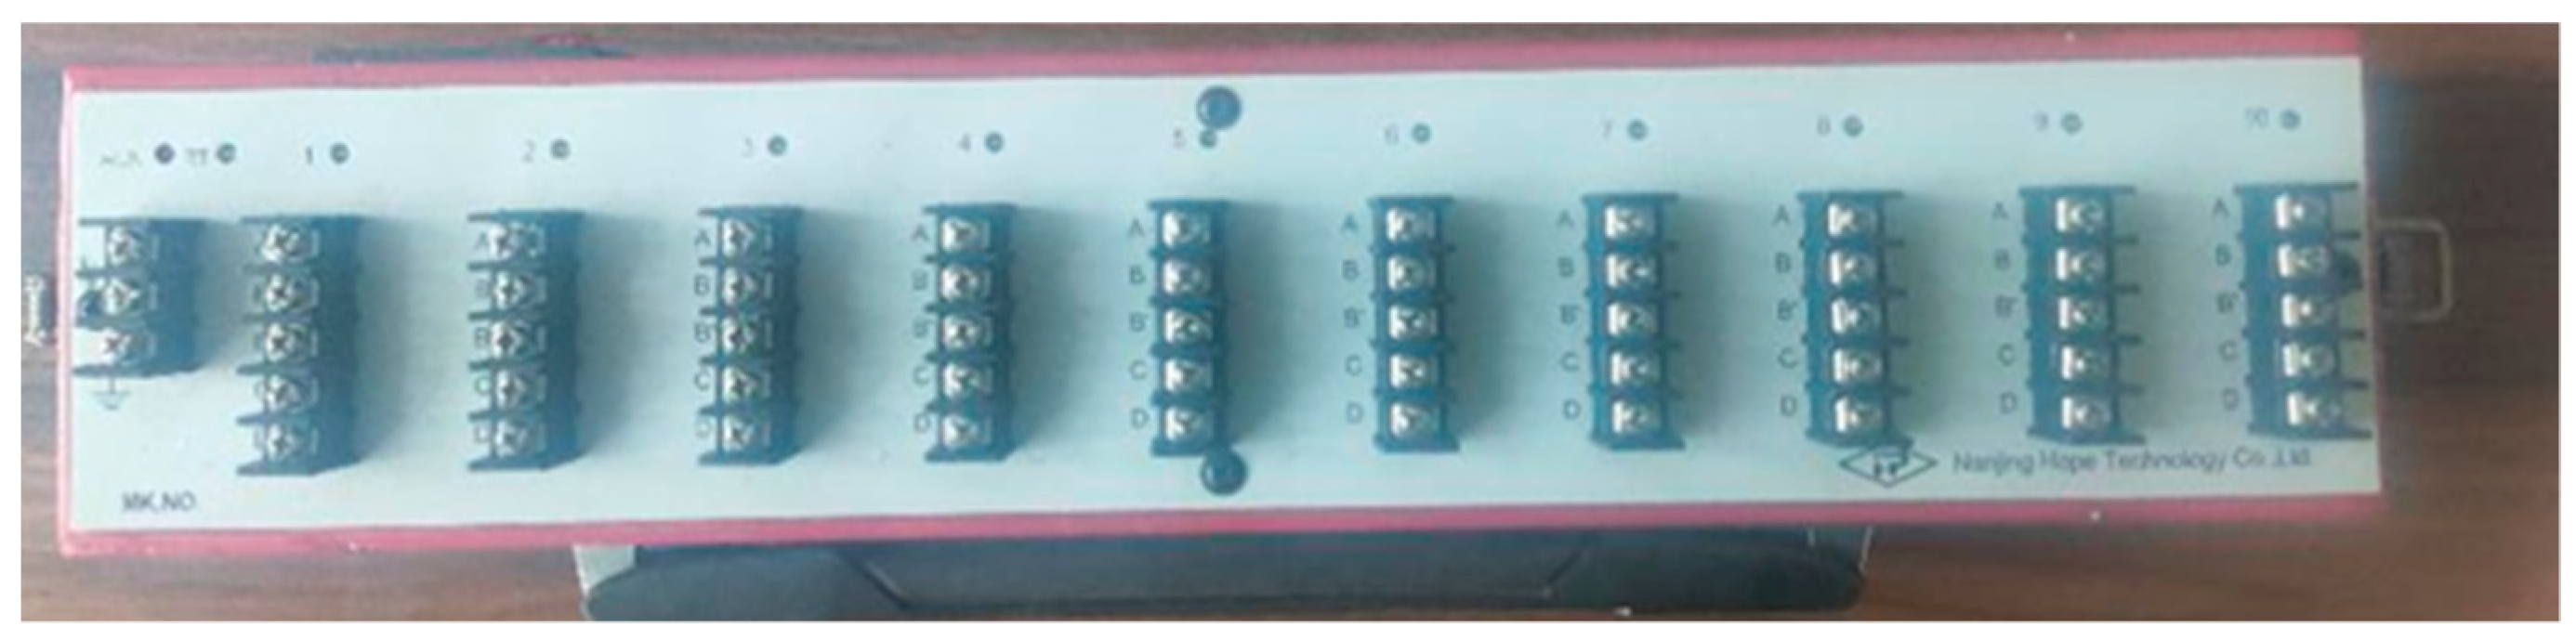
This fatigue test is performed on 250 kN MSTlandmark810, which consists of an MTS mainframe, hydraulic system, cooling tower system, program control system and related accessories, as shown in Figure 5. The working frequency is 0.01–20 Hz, and the maximum working load is 250 kN. The test is carried out strictly according to the test operation procedures, and the cooling tower is opened in turn, then the oil pressure system is opened, and finally the machine is turned on. The oil pressure gauge is limited to the maximum pressure of 200 MPa, for safety reasons generally not more than two-thirds of the maximum, so the output pressure of the oil pressure source should not be higher than 120 MPa. When clamping the test piece, attention should be paid to strict alignment, clamping the upper chuck first, and then clamping the lower chuck after clearing the zero in the control system. Set the loading mode, loading amplitude and frequency, loading curve type, overload limit protection and other parameters, and test only after all checks are normal. Since the MTS works on the principle of a computer program control system to control the upward movement of the upper acting head, it can only provide tensile stress, but not compressive stress. A 10-channel strain acquisition system, model HP-MK4, manufactured by a technology company in Nanjing, was used for static strain acquisition, as shown in Figure 6, and the acquisition frequency was 0.5 Hz.

Figure 5.
MTS fatigue machine equipment.

Figure 6.
HP-MK4 static strain acquisition system.
Constant amplitude fatigue loading was carried out by the load control method; considering the test conditions, the fatigue load valley value of loading was determined as −50 kN, the peak value as 0 kN, the load amplitude as 50 kN, and the cyclic loading frequency as 3 Hz. The fatigue test was suspended for every 50,000 cycles. The static load test was carried out using the method of graded loading until the maximum fatigue load was reached. The static grading loading procedure was as follows: 0 → 10 kN → 20 kN → 30 kN → 40 kN → 50 kN → 40 kN → 30 kN → 20 kN → 10 kN → 0. The static loading data at each specific number of cycles as well as the number of cycles at the time of final fatigue damage were recorded. From Table 3, it can be seen that the difference between the maximum and minimum values of fatigue life of each group of specimens is not large, indicating that the fatigue life of the specimens under the same conditions has a small dispersion, the average value of which can be taken as the fatigue life of the notched specimen under this condition.
Table 3.
Fatigue life table of specimens under cyclic loads.
4. Finite Element Analysis
4.1. Finite Element Model of Notched Specimen
To apply the point and line method in the three-dimensional case, a line for calculation needs to be defined in advance, starting from the fatigue hot spot and extending in the expected direction of fatigue crack expansion, and this line is called the hot spot path. The theoretical path is chosen in the direction of the highest stress gradient. In order to facilitate the determination of the hot spot path and fatigue test, a simplified specimen of the curved cutout of the cross-section is established and marked with the hot spot path as shown in Figure 7, by combining the stress characteristics of the curved cutout of the cross-section.
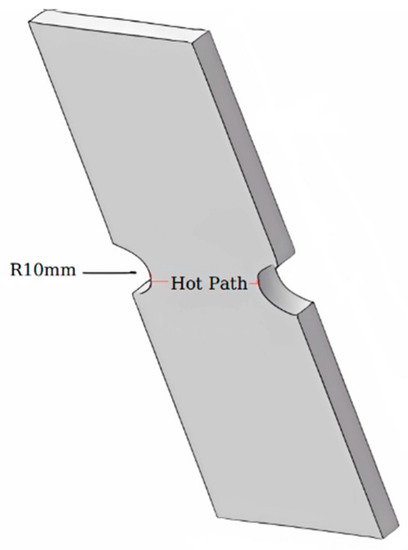
Figure 7.
Hotspot path diagram (r = 10 mm).
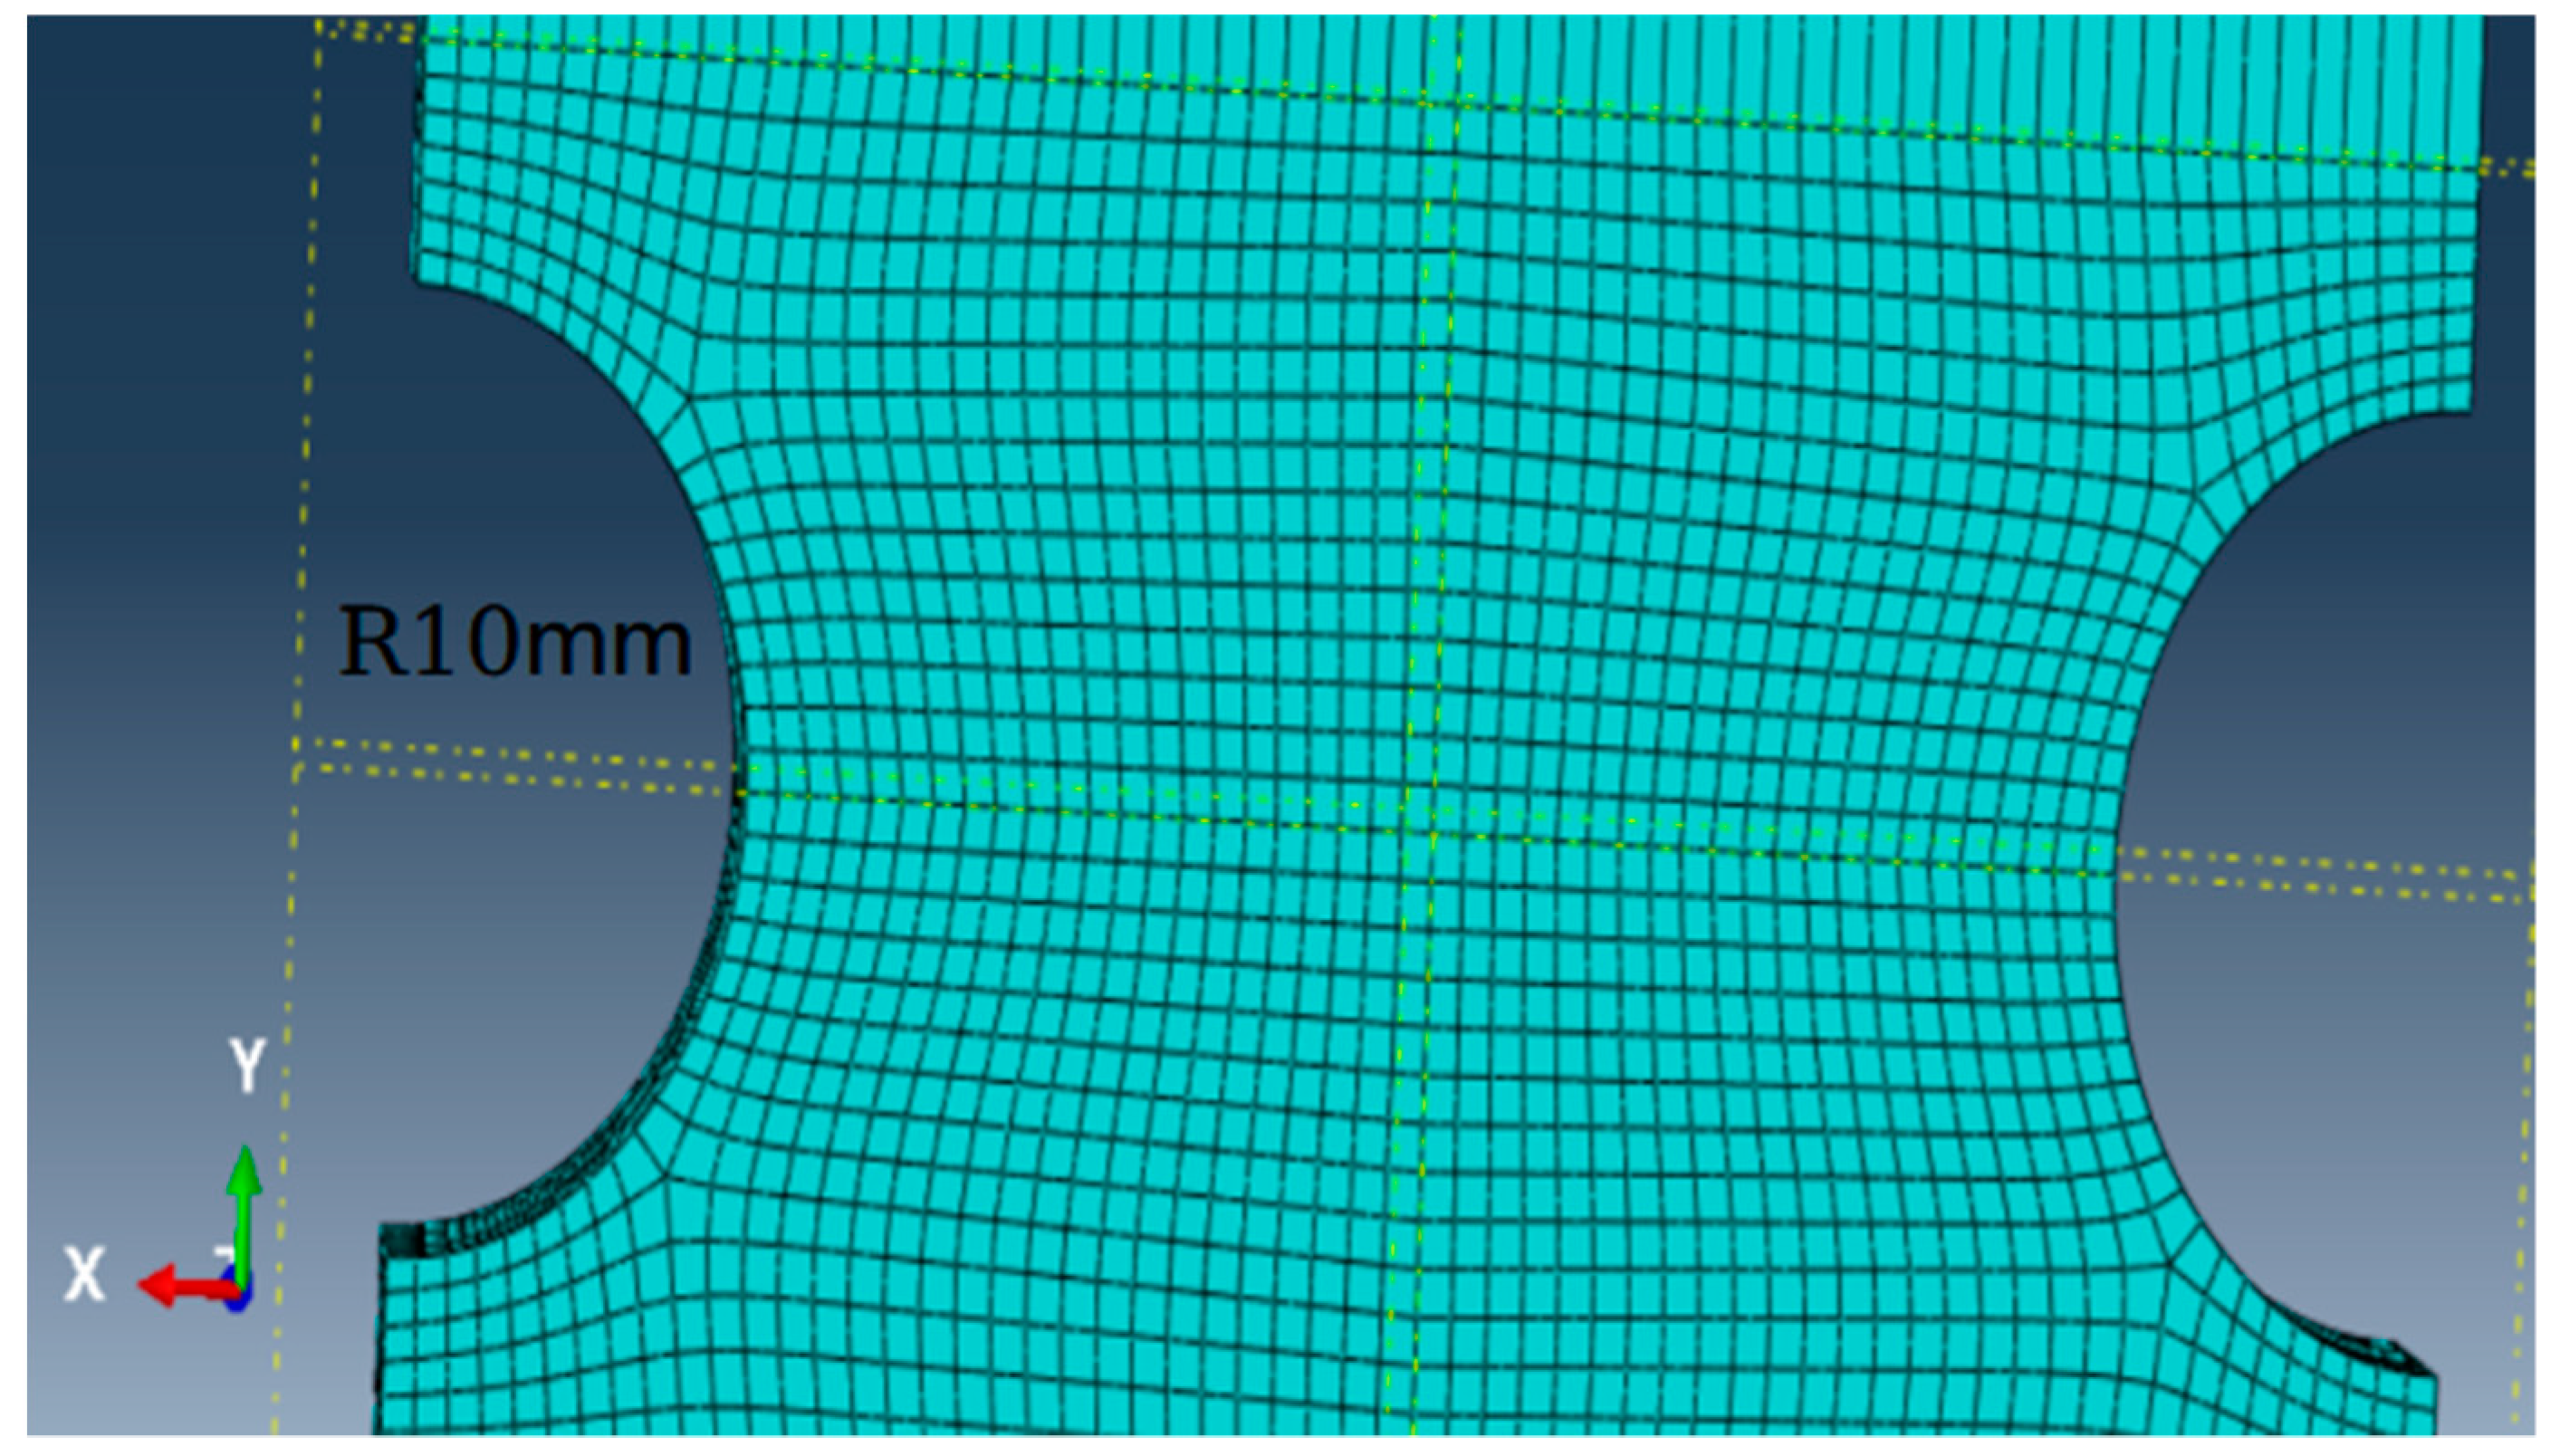
Using ABAQUS finite element software, a 3D finite element model of the rectangular plate was created based on the geometry and details shown in Figure 3. A 20-node solid-cell C3D20R simulation was used to make the finite element model identical to the actual geometric configuration. In the fatigue test, the numerical study mainly focuses on the stress distribution around the cutout, and the local sub-model cell of the curved cutout of the cross-sectional plate is refined to 0.5 mm, and the mesh was studied to meet the accuracy and convergence of the simulation, and the whole model mesh is divided as shown in Figure 8. In the finite element analysis, the bottom end of the rectangular plate is completely fixed, and the top end is allowed to be displaced in the y-direction. For static loading, a 50 kN tensile force is applied at the top center of the specimen with material parameters of Young’s modulus E = 206 GPa and Poisson’s ratio ν = 0.3. After that, the result file of the FEA is imported into Fe-safe, and a cyclic tensile force of 1–50 kN is applied at the top center of the specimen with a sinusoidal curve loading at a frequency of 3 Hz, representing the fatigue load in the test, fatigue analysis by applying Eurocode3 [17] correlation S-N curves.
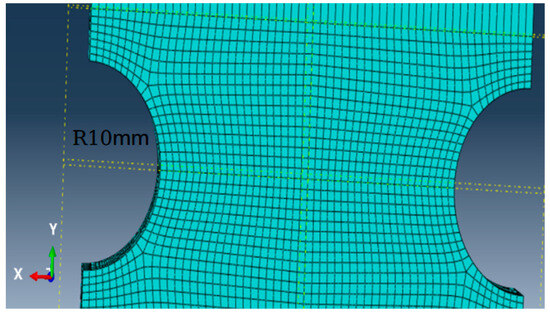
Figure 8.
Finite element model of curved notch specimens (r = 10 mm).
4.2. Fatigue Life Prediction Model
The critical distance theory was used to estimate the fatigue damage in the critical region, and the critical distance L was first determined for the bridge steel Q345qD. Where the crack expansion threshold , given by the empirical Equation (7), was obtained by referring to a series of fatigue crack expansion tests conducted by Yanping Liu et al. [39] on Q345qD steel at three different stress ratios of R = 0.05, 0.25 and 0.50.
where R is the stress ratio; unit MPa · m.
In this paper, a stress ratio of R = 0.02 is used for the fatigue simulation of the notched rectangular plate specimens. Therefore, the crack expansion threshold is 5.427 MPa · m. The fatigue limit of the orthogonal anisotropic steel bridge panel at the opening is used as the fatigue limit of the critical distance theory analysis, i.e., = 70 MPa. Substituting the values of and into Equation (6), we obtain L = 1.91 mm (R = 0.02).
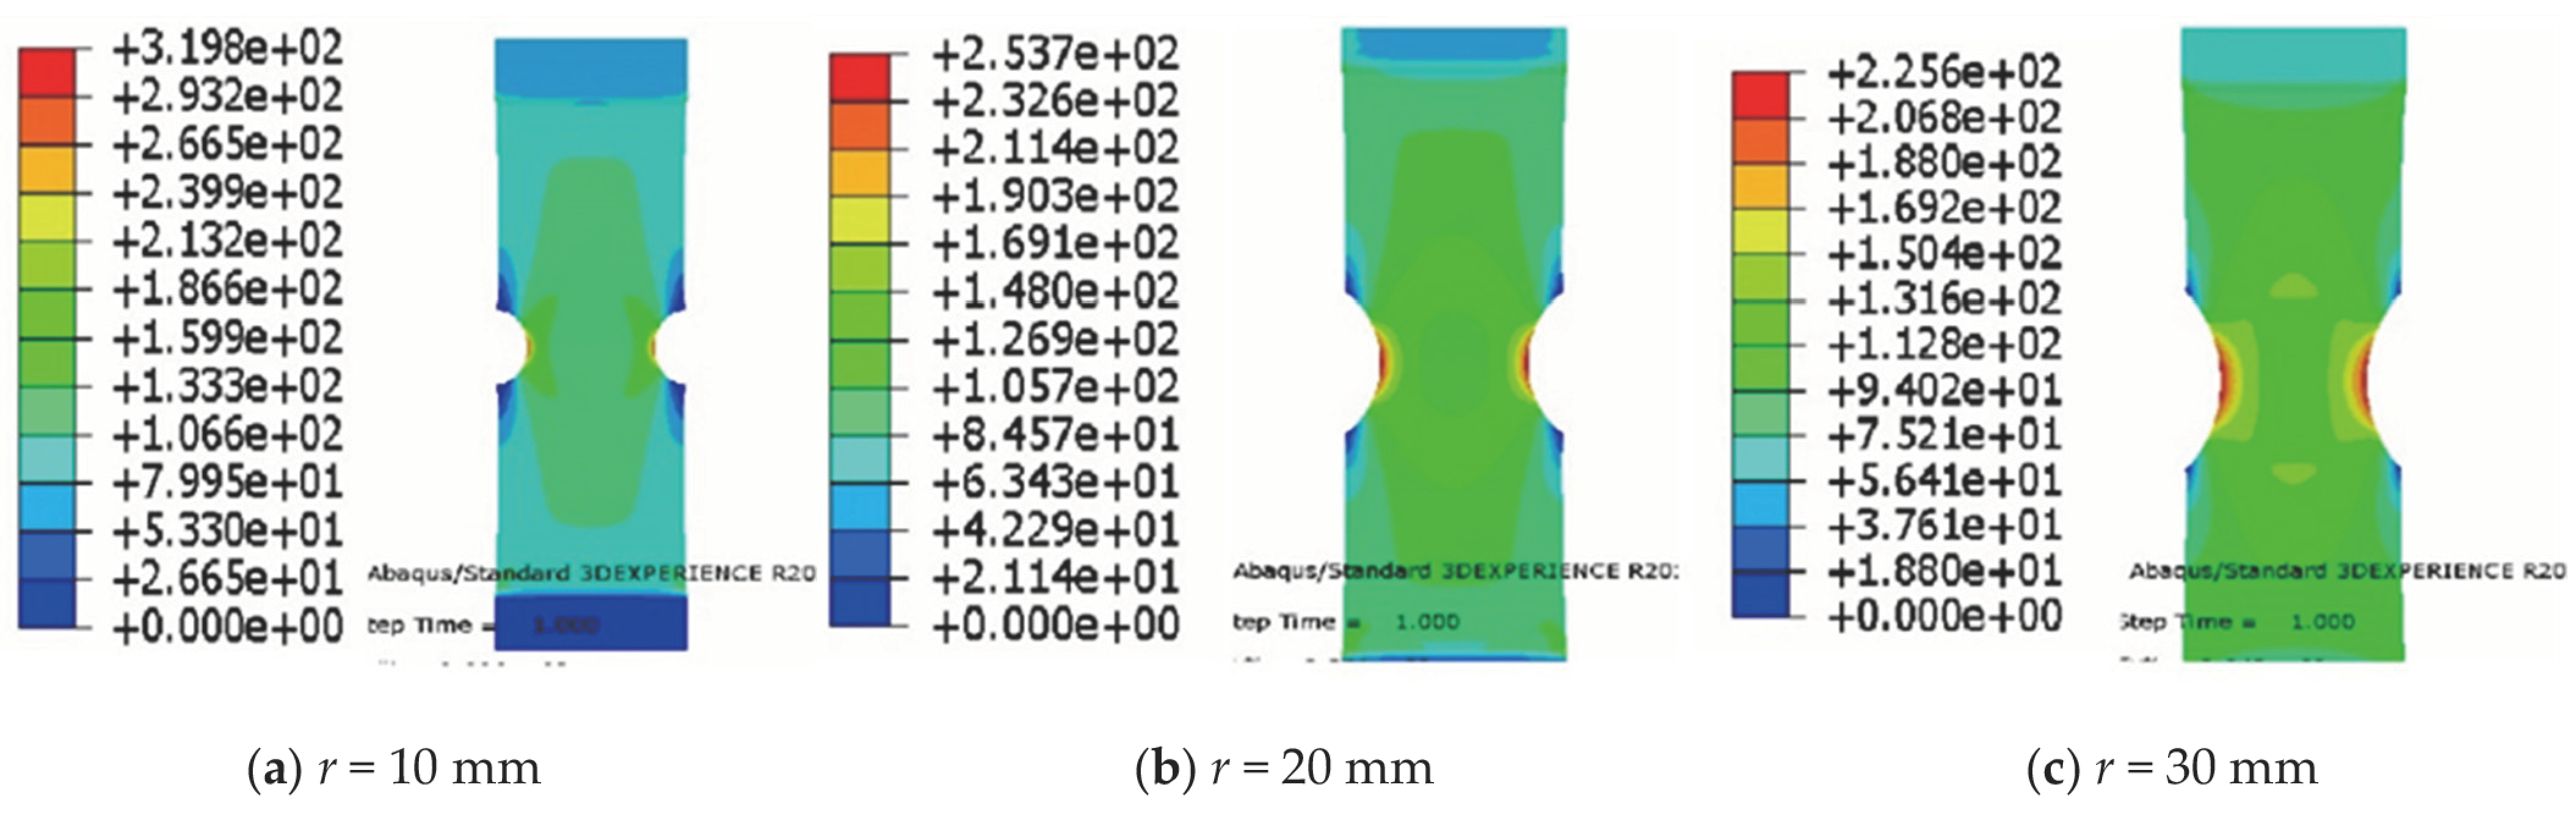
Through the finite element solution of three arc notch specimen models with different radii under the tensile load of 50 kN, the respective principal stress distributions were obtained, as shown in Figure 9. From the figure, it can be seen that the first principal stress at the notch decreases with the increase in notch radius: when the radius increases from 10 mm to 20 mm, the first principal stress decreases from 319.8 MPa to 253.7 MPa, with a reduction of 66.1 MPa; when the radius increases from 20 mm to 30 mm, the first principal stress decreases from 253.7 MPa to 225.6 MPa, with a reduction of 28.1 MPa, which is more gentle than before. The first principal stress decreases from 253.7 MPa to 225.6 MPa when the radius is increased from 20 mm to 30 mm, with a decrease of 28.1 MPa, which is flatter than before.
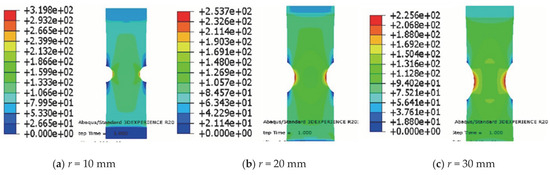
Figure 9.
First principal stress nephogram of the cutout ( = 50 kN) (Unit: MPa).
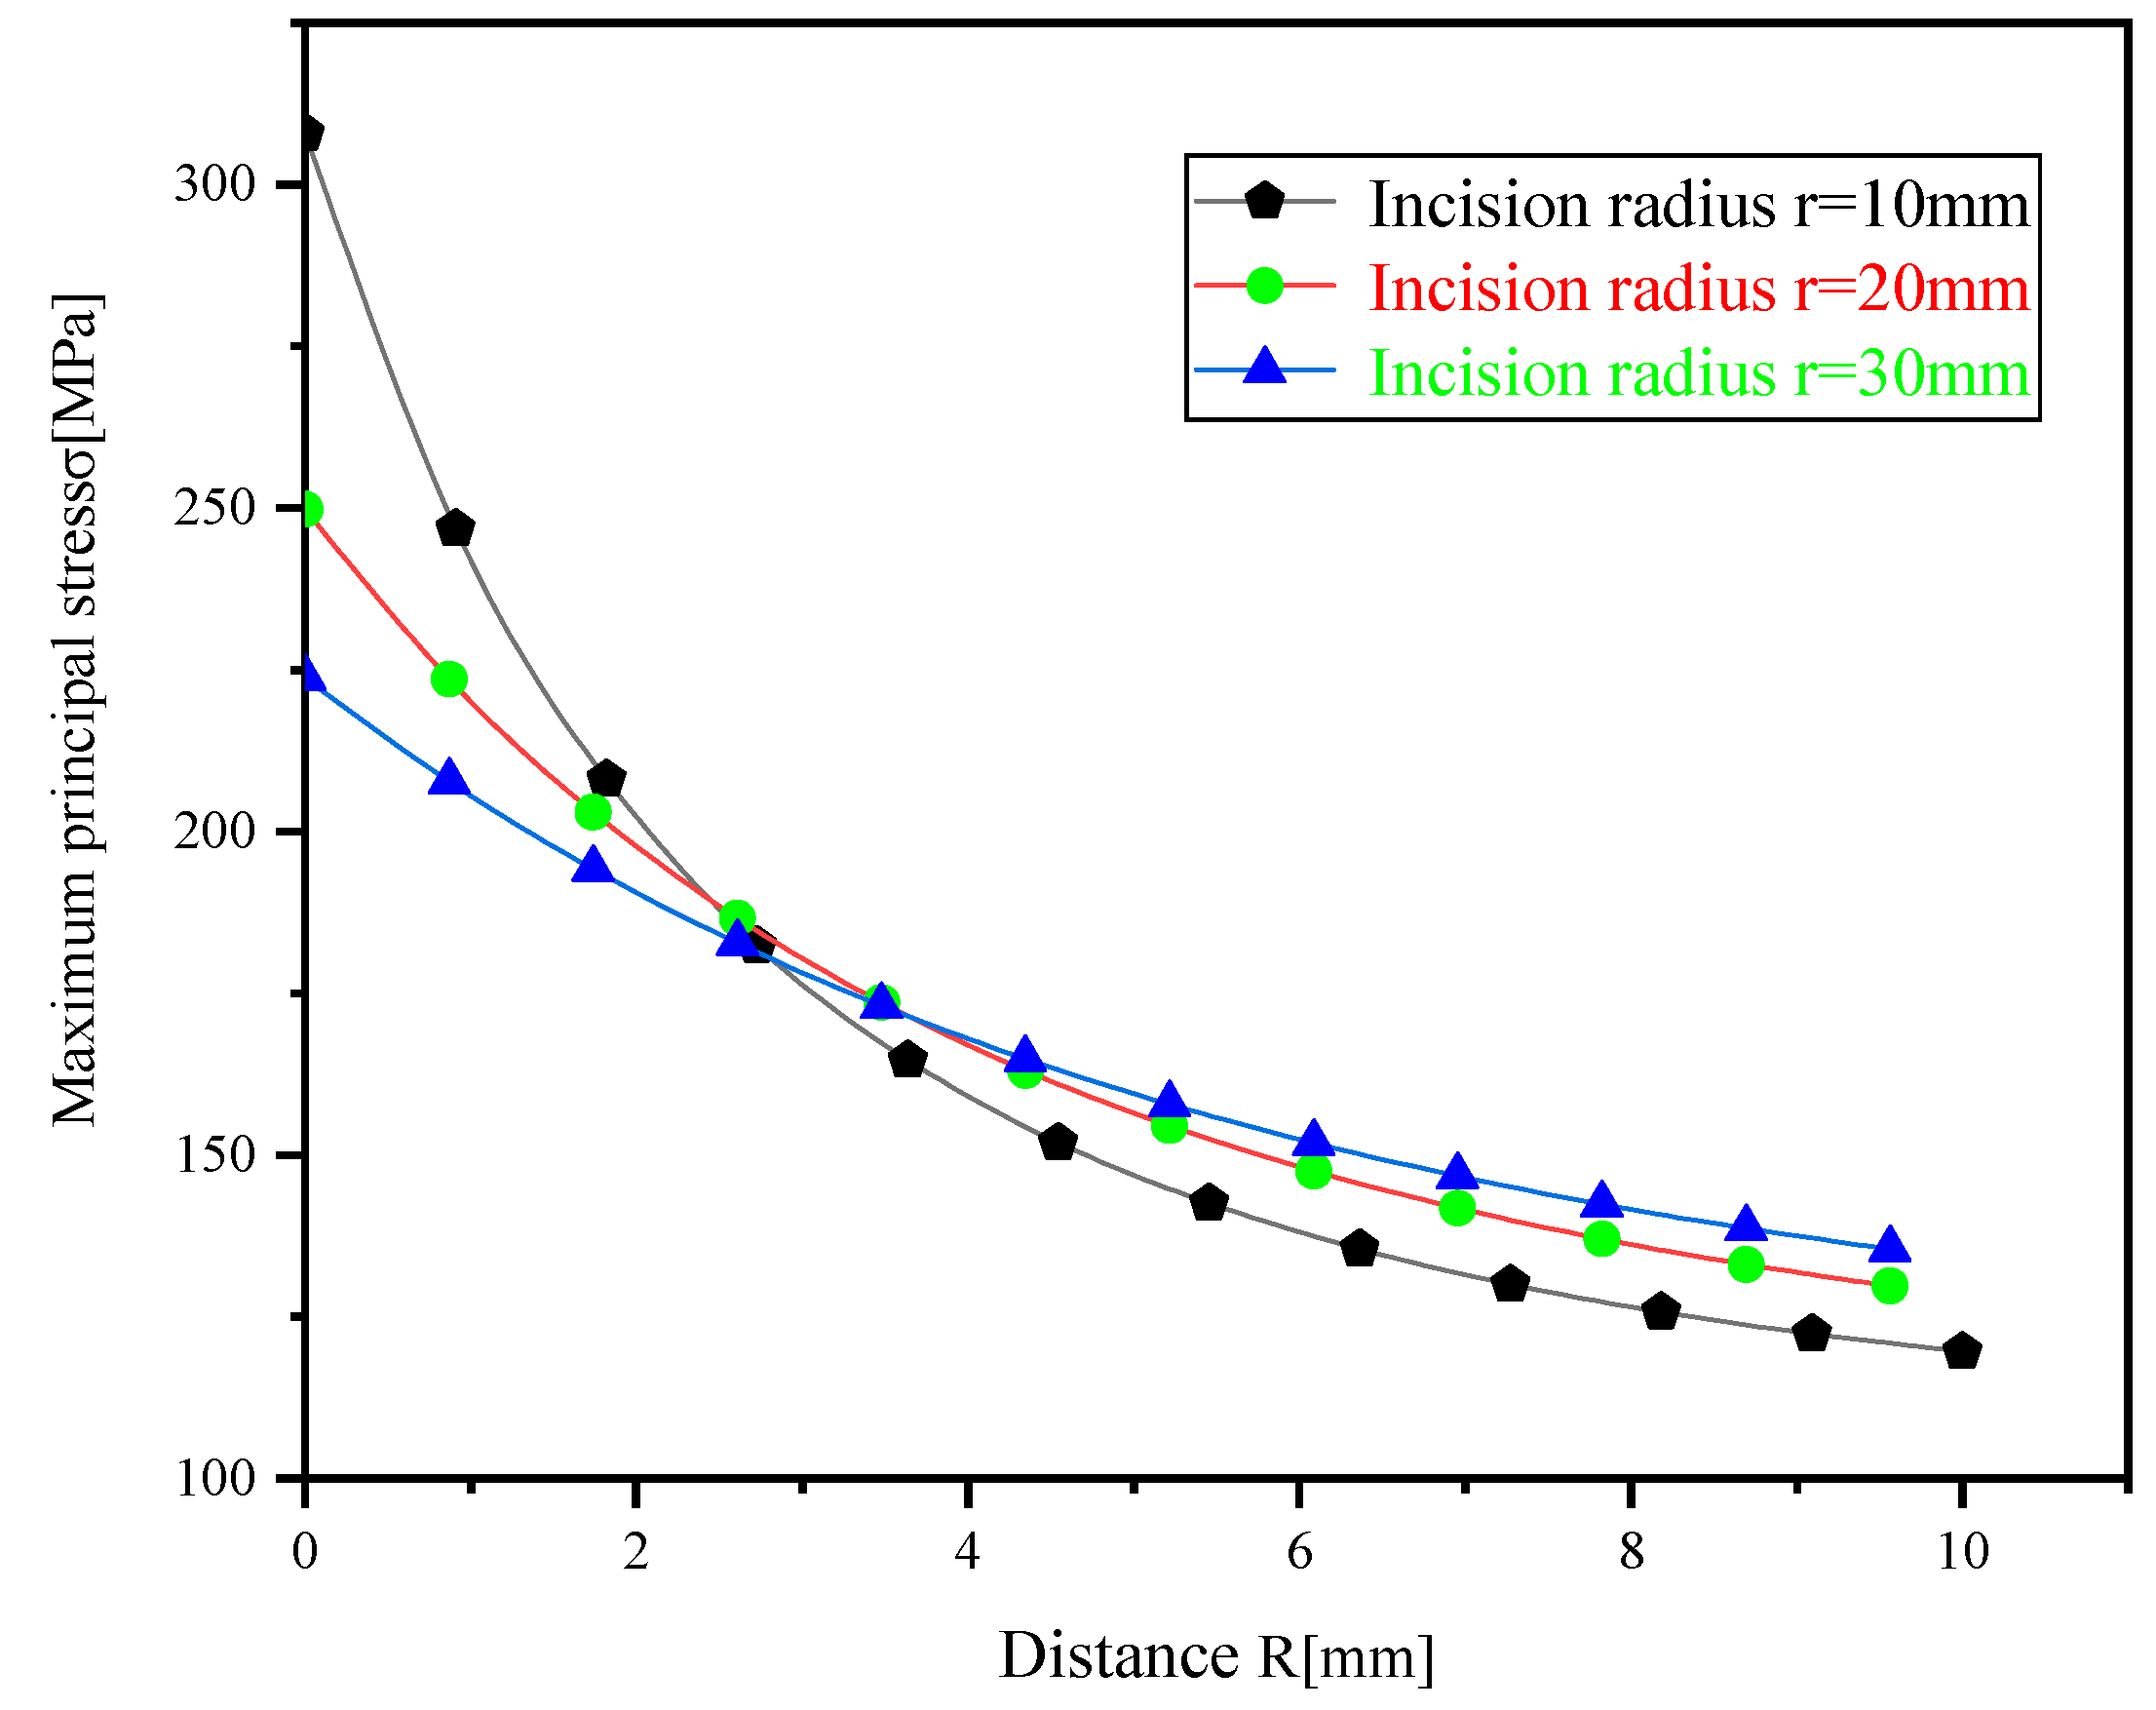
Since the stress state of the notched rectangular plate specimen is in a plane stress state [24], the characteristic stresses can be calculated using the point method and the line method. Using ABAQUS to set up the path from the peak of the maximum principal stress in the direction of the highest stress gradient, the first principal stress at each point and the distance of its location from the peak of the maximum principal stress are extracted, and the relationship curve is drawn as shown in Figure 10. On the hot spot path, the maximum principal stress is inversely related to the distance. In the range of 1.2 times the critical distance, the smaller the radius of the notch, the higher the stress level. In the region beyond the 2-times critical distance, the maximum principal stress curves of the 20 mm notch radius and 30 mm notch radius tend to converge, indicating that the notch is no longer a key factor affecting the stress level at this time.
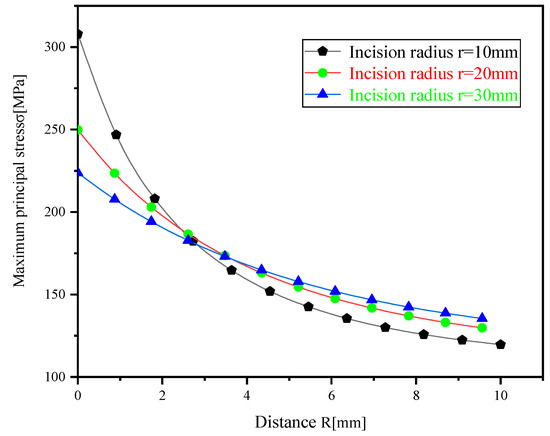
Figure 10.
Relationship between the peak point of the first principal stress and the distance from its location to the peak point.
The extracted Fe-safe lifetime results are presented in Table 4, and the characteristic stresses for the point and line methods are obtained according to the method mentioned in Section 2. It can be seen from Table 4 that the characteristic stress decreases with the increasing radius of the unique variable notch for both the point and line methods. Under the same fatigue load, the prediction accuracy of different radius notch specimens using the point method and the line method are different. The calculation results show that the predicted values of the point method are 7~13% higher than those of the line method.
Table 4.
Characteristic stresses and fatigue life of three notched specimens.
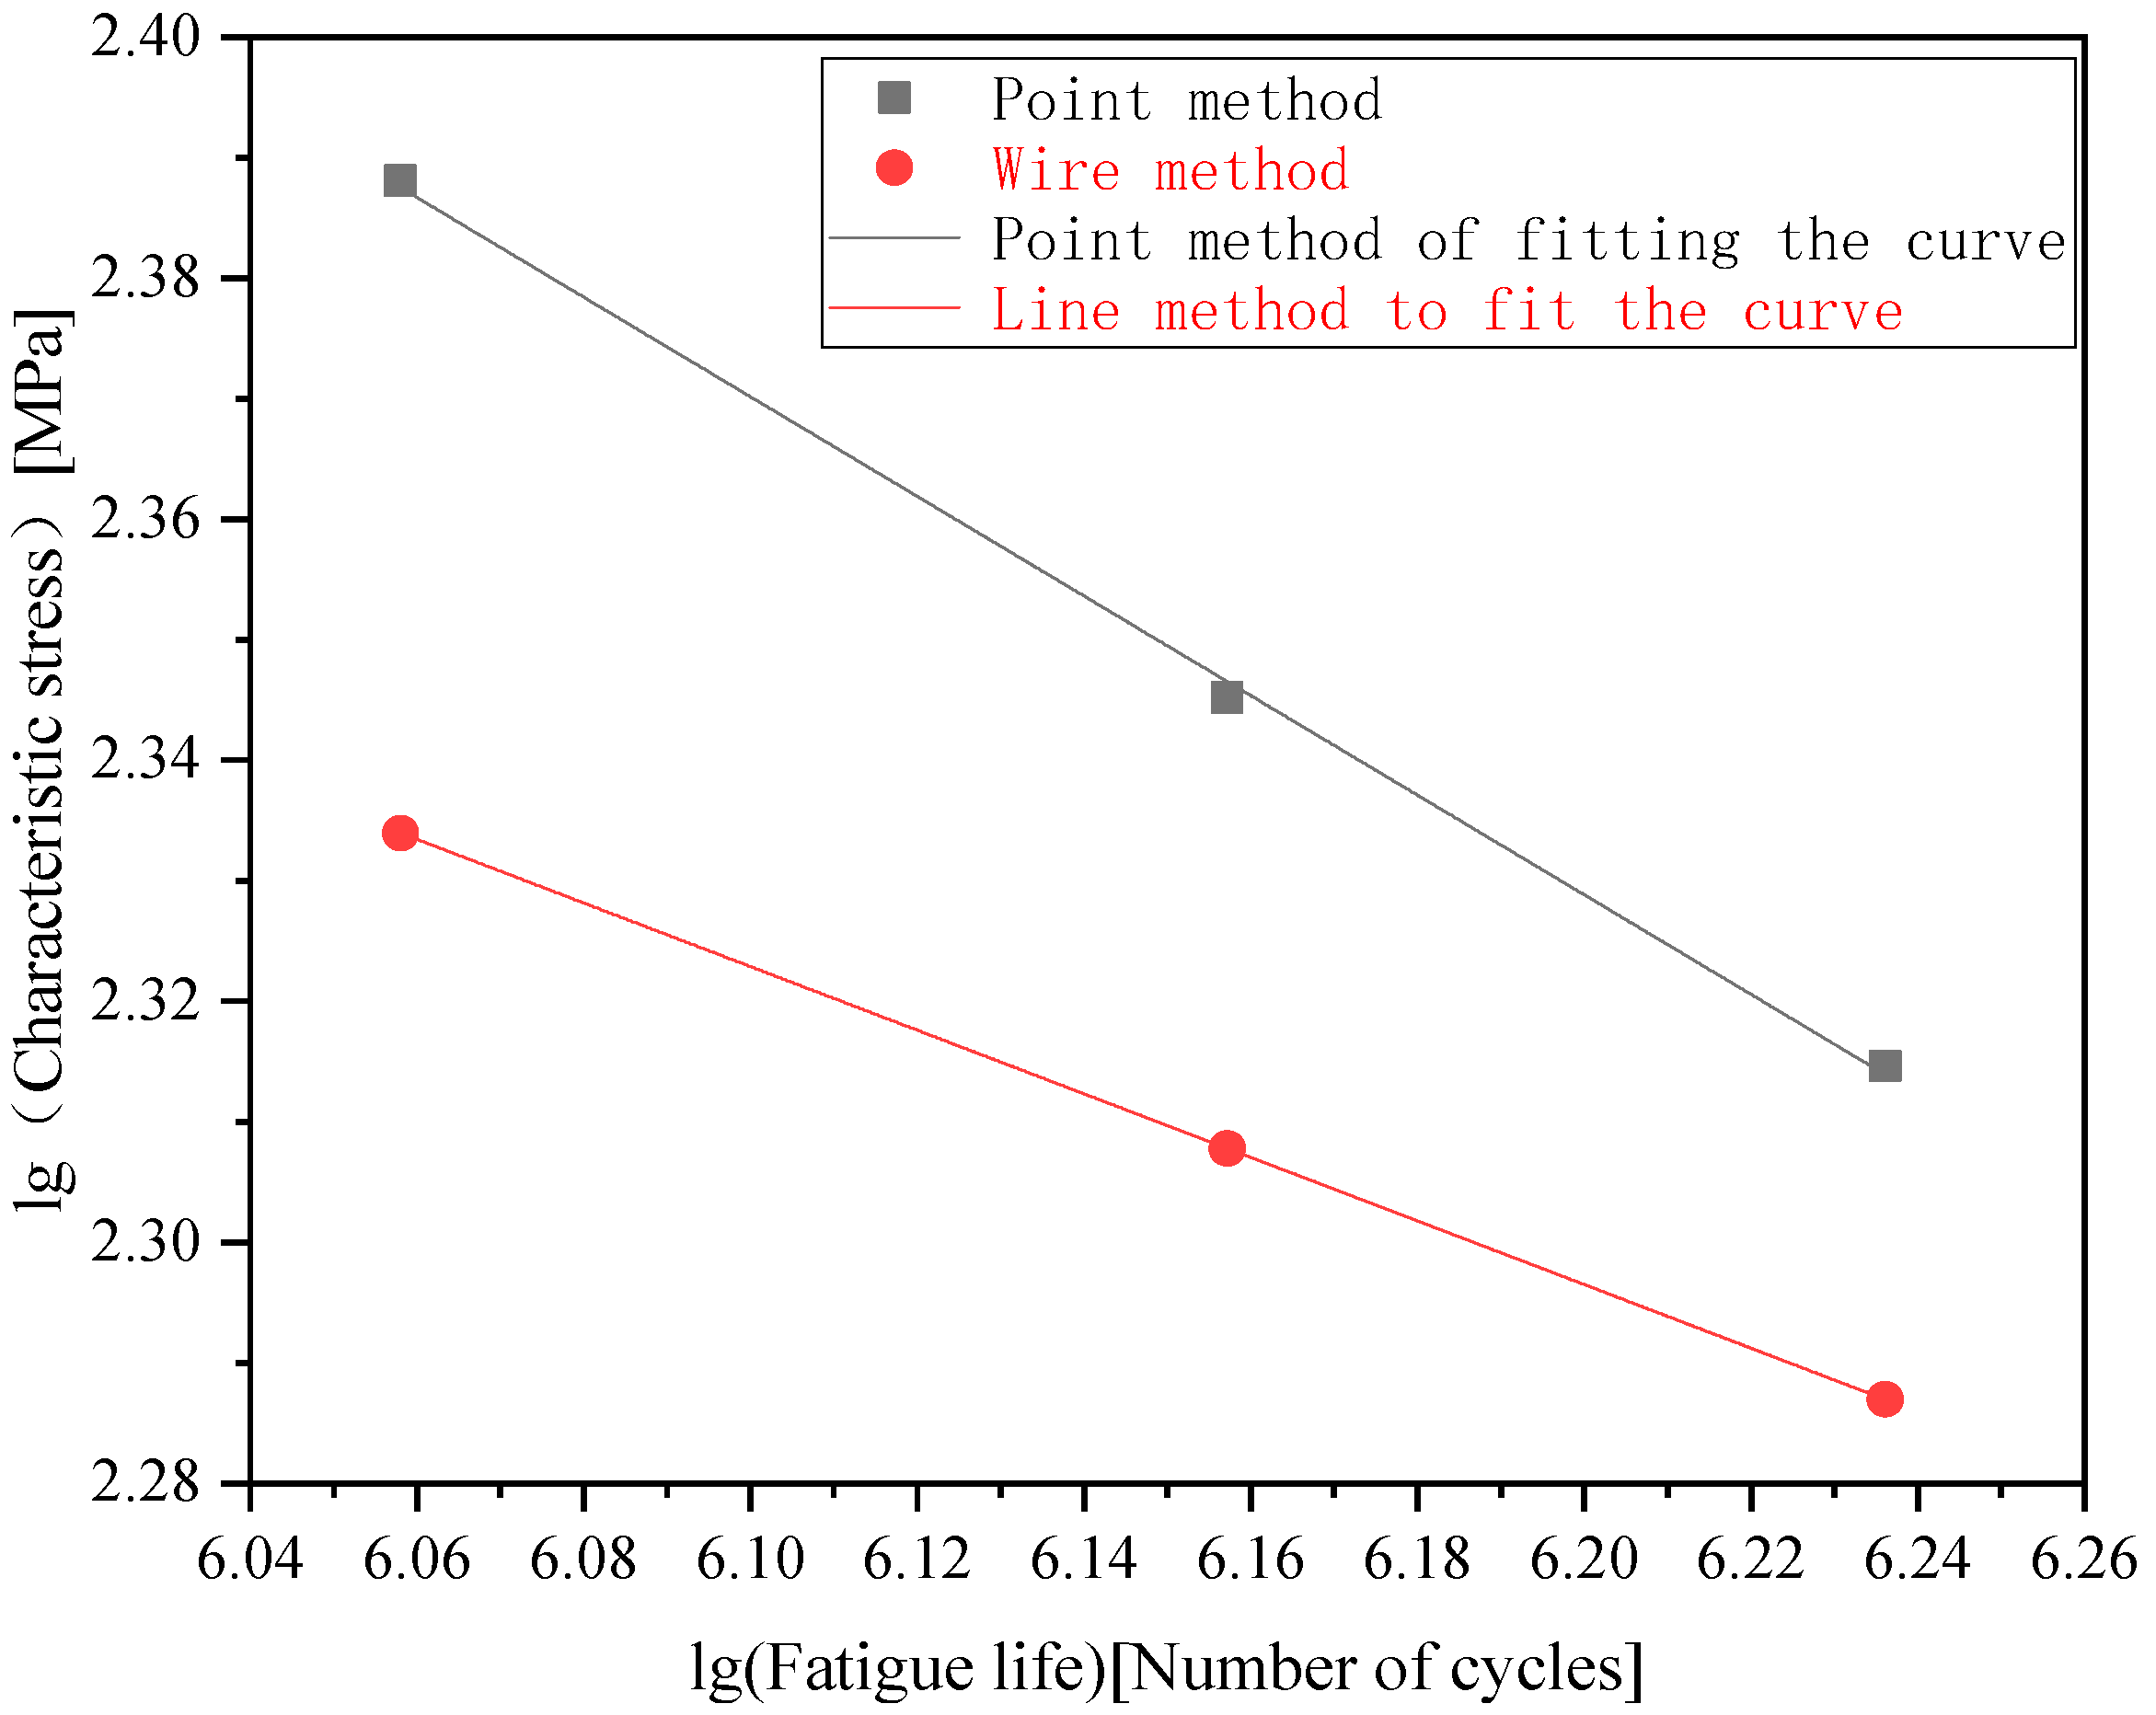
The calculation model of fatigue life with respect to the characteristic stress is obtained by linear fitting as shown in Equations (8) and (9). The logarithmic values of the point method characteristic stress, line method characteristic stress and fatigue life are calculated, respectively, and their correspondence is established as shown in Figure 11.
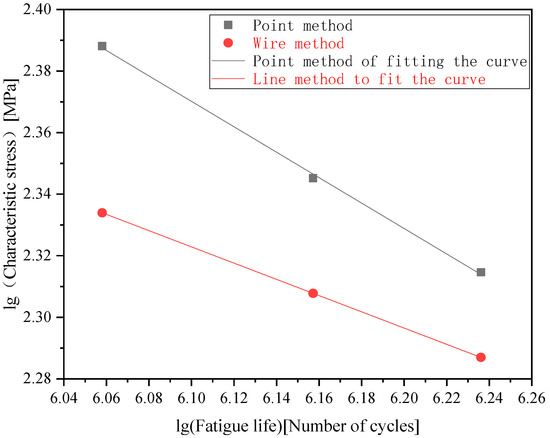
Figure 11.
The relation curve of .
Point method prediction model:
Line method prediction model:
5. Experimental Results Compared with Theory
According to the stress distribution at the arc notch measured by the static load combined with the finite element results according to Equations (1) and (7) to obtain each, and using Equations (8) and (9) to obtain the predicted fatigue life, the actual fatigue life obtained from the test and the calculated predicted fatigue life are combined in Table 5. The comparison results show that the data distortion is serious and the error is more than 65% at more than 10 million cycles when using the point method to predict the life of steel box girder cross-sectional notches. The line method is used to predict the life of steel box girder cross-sectional cutouts, and the error is basically within 20% except for model No. 3, which has a large dispersion of 29%. The error is inferred to be related to the size effect. Considering the mechanism of fatigue damage, the accumulation of fatigue damage of materials is determined by the joint influence of stresses in a certain region rather than a point at the root of the notch, and this influence is related to the stress–strain field in a certain range. The process of fatigue damage of a material is an irreversible change in itself at the microscopic level, and this change is mostly related to material deformation. In the interior of the material, the mutual forces between the grains prevent their own deformation, so it is relatively easy for that deformation to occur on the outer surface, i.e., the closer the region to the root of the notch, the greater the contribution to fatigue damage. If the calculation model for life prediction of full-scale specimens is established by the volume method, the fit of the conclusions obtained will be further improved.
Table 5.
Comparison of actual and calculated life of specimens.
6. Conclusions
- (1)
- The stress prediction value based on the point method at the cross-sectional cutout of steel box girders is 7~13% higher than that of the line method, and the fatigue life prediction value of the point method is basically more than 50% lower than that of the line method; the point method prediction value is more conservative than that of the line method.
- (2)
- The fatigue prediction model of steel box girder transverse bulkhead arc cutouts proposed in this paper has high accuracy, which is more precise compared with other methods currently used in engineering applications, and verifies the effectiveness and feasibility of the critical distance method. The fatigue life prediction results of the line method and the section model fatigue test results are basically about 10% error, the source of error is inferred to be related to the size effect, and the error will be further reduced if the volume method is used.
- (3)
- Whether using the point method or the line method, the calculated characteristic stress decreases with the increase in notch radius; the fatigue life increases with the increase in notch radius. When designing the curved notch of steel box girder cross-sections, the appropriate increase in notch radius is beneficial to the improvement of the fatigue life of the structure.
- (4)
- In this paper, the fatigue test specimens are all smooth curved notch specimens, and for the members containing initial defects, the calculation model for assessing fatigue life using critical distance theory needs further study.
Author Contributions
Conceptualization, H.N. and Y.Y.; Methodology, J.C. and Y.Y.; Software, H.N.; Validation, J.C.; Formal analysis, J.C.; Investigation, L.H. and Y.Y.; Resources, Z.C.; Writing—original draft, J.C.; Writing—review & editing, H.N. and Z.C.; Visualization, L.H.; Supervision, L.H.; Project administration, J.C. and Z.C.; Funding acquisition, Z.C. All authors have read and agreed to the published version of the manuscript.
Funding
This research was funded by Changsha City Natural Science Foundation Project, grant number kq2202207 and Hunan Provincial Natural Science Foundation Project, grant number 2023JJ40505.
Conflicts of Interest
The authors declare no conflict of interest.
References
- Li, H.; Wu, G. Fatigue Evaluation of Steel Bridge Details Integrating Multi-Scale Dynamic Analysis of Coupled Train-Track-Bridge System and Fracture Mechanics. Appl. Sci. 2020, 10, 3261. [Google Scholar] [CrossRef]
- Zhang, Q.H.; Bu, Y.Z.; Li, Q. Progress of research on fatigue of orthotropic anisotropic steel bridge panels. China J. Highw. 2017, 30, 14–30. [Google Scholar]
- Zhu, Z.; Yuan, T.; Xiang, Z.; Huang, Y.; Zhou, Y.E.; Shao, X. Behavior and Fatigue Performance of Details in an Orthotropic Steel Bridge with UHPC-Deck Plate Composite System under In-Service Traffic Flows. J. Bridge Eng. 2017, 23, 04017142. [Google Scholar] [CrossRef]
- Liu, Y.; Chen, Z.; Zeng, J.; Li, C.; Peng, H.; Gao, Y. Study of Secondary Effects of Fatigue Cracks in Cross Partitions of Steel Plate Reinforced Steel Box Girders. Appl. Sci. 2022, 12, 7198. [Google Scholar] [CrossRef]
- Chen, Z.Y.; Li, C.X.; Ke, L.; Guo, L.C.; Song, G.B. Fatigue Crack Repair and Optimization of Cope Holes in Orthotropic Steel Decks. China J. Highw. 2021, 34, 301–312. [Google Scholar]
- Chen, Y.; Lv, P.; Li, D. Research on Fatigue Strength for Weld Structure Details of Deck with U-rib and Diaphragm in Orthotropic Steel Bridge Deck. Metals 2019, 9, 484. [Google Scholar] [CrossRef]
- Chen, Z.-Y.; Li, C.-X.; He, J.; Xin, H.-H. Retrofit Fatigue Cracked Diaphragm Cutouts Using Improved Geometry in Orthotropic Steel Decks. Appl. Sci. 2020, 10, 3983. [Google Scholar] [CrossRef]
- Sim, H.B.; Uang, C.M. Stress analyses and parametric study on full-scale fatigue tests of rib-to-deck welded joints in steel orthotropic decks. J. Bridge Eng. 2012, 17, 765–773. [Google Scholar] [CrossRef]
- Song, Y.S.; Ding, Y.L.; Wang, G.X.; Li, A.Q. Fatigue-life evaluation of a high-speed railway bridge with an orthotropic steel deck integrating multiple factors. J. Perform. Constr. Facil. 2016, 30, 04016036. [Google Scholar] [CrossRef]
- Zhu, Z.; Xiang, Z. Fatigue cracking investigation on diaphragm cutout in a self-anchored suspension bridge with orthotropic steel deck. Struct. Infrastruct. Eng. 2019, 15, 1279–1291. [Google Scholar] [CrossRef]
- Yokozeki, K.; Miki, C. Fatigue evaluation for longitudinal-to-transverse rib connection of orthotropic steel deck by using structural hot spot stress. Weld. World 2016, 60, 83–92. [Google Scholar] [CrossRef]
- Huang, H.; Huang, C.; Peng, Z.; Li, Y.; Yin, H. Fatigue Life Prediction of Fan Blade Using Nominal Stress Method and Cumulative Fatigue Damage Theory. Int. J. Turbo Jet-Engines 2020, 37, 135–139. [Google Scholar] [CrossRef]
- Duran, J.A.R.; da Costa, D.J.R. An Evaluation of the Nominal Stress Method for Life Prediction of Cylindrical Circumferential V-Notched Specimens Tested under Variable Amplitude Loading. Appl. Mech. Mater. 2016, 851, 310–316. [Google Scholar] [CrossRef]
- Wang, B.; Liu, L.; Liu, Y.; Jia, X.; Xu, X.; Miao, K.; Ji, J. Full-Scale Fatigue Test and Finite Element Analysis on External Inclined Strut Welded Joints of a Wide-Flanged Composite Box Girder Bridge. Materials 2023, 16, 3637. [Google Scholar] [CrossRef]
- Ecker, A.; Unterweger, H. Fatigue Design in Penstocks—Comparison of the Nominal Stress and Structural Stress Method for Common Details. ce/Papers 2021, 4, 1126–1134. [Google Scholar] [CrossRef]
- Dong, D.S.; Lu, C.Y.; Teng, Y.Y. A Fatigue Life Analysis Method Based on Nominal Stress Method and MSC.FATIGUE Software. Adv. Mater. Res. 2012, 468–471, 663–667. [Google Scholar] [CrossRef]
- EN 1993-2; Eurocode 3: Design of Steel Structures—Part 2: Steel Bridges. CEN: London, UK, 2006.
- AASHTO. AASHTO LRFD, Bridge Design Specifications; Wiley: Washington, DC, USA, 2017. [Google Scholar]
- Susmel, L.; Taylor, D.; Tovo, R. The Theory of Critical Distances and the estimation of notch fatigue limits: L, a0 and open notches. Int. Conf. Comput. Exp. Eng. Sci. 2007, 1, 81–86. [Google Scholar]
- Liu, X.; Zhang, Y.; Xie, S.; Zhang, Q.; Guo, H. Fatigue Failure Analysis of Express Freight Sliding Side Covered Wagon Based on the Rigid-Flexibility Model. Int. J. Struct. Integr. 2019, 12, 98–108. [Google Scholar] [CrossRef]
- Kebir, T.; Correia, J.; Benguediab, M.; Jesus, A.M.P.D. Numerical Study of Fatigue Damage under Random Loading Using Rainflow Cycle Counting. Int. J. Struct. Integr. 2020, 12, 149–162. [Google Scholar] [CrossRef]
- Babich, D.; Bastun, V.; Dorodnykh, T. Structural-Probabilistic Modeling of Fatigue Failure under Elastic-Plastic Deformation. Int. J. Struct. Integr. 2019, 10, 484–496. [Google Scholar] [CrossRef]
- He, J.-C.; Zhu, S.-P.; Liao, D.; Niu, X.-P. Probabilistic Fatigue Assessment of Notched Components under Size Effect Using Critical Distance Theory. Eng. Fract. Mech. 2020, 235, 107150. [Google Scholar] [CrossRef]
- Zhou, H.; Wen, J.; Wang, Z.; Zhang, Y.; Du, X. Fatigue crack initiation prediction of cope hole details in orthotropic steel deck using the theory of critical distances. Fatigue Fract. Eng. Mater. Struct. 2016, 39, 1051–1066. [Google Scholar] [CrossRef]
- Neuber, H. Theory of Notch Stresses: Principles for Exact Calculation of Strength with Reference to Structural Form and Material, 2nd ed.; Springer: Berlin/Heidelberg, Germany, 1958. [Google Scholar]
- Peterson, R.E. Notch sensitivity. In Metal Fatigue; McGraw Hill: New York, NY, USA, 1959; pp. 293–306. [Google Scholar]
- Kim, J.-K.; Kim, D.-S.; Takeda, N. Notched Strength and Fracture Criterion in Fabric Composite Plates Containing a Circular Hole. J. Compos. Mater. 1995, 29, 982–998. [Google Scholar] [CrossRef]
- Ye, W.-L.; Zhu, S.-P.; Niu, X.; He, J.-C.; Correia, J.A.F.O. Fatigue Life Prediction of Notched Components under Size Effect Using Critical Distance Theory. Theor. Appl. Fract. Mech. 2022, 121, 103519. [Google Scholar] [CrossRef]
- Taylor, D. The Theory of Critical Distances applied to multiscale toughening mechanisms. Eng. Fract. Mech. 2019, 209, 392–403. [Google Scholar] [CrossRef]
- Taylor, D. The Theory of Critical Distances: A New Perspective in Fracture Mechanics; Elsevier: Oxford, UK, 2007. [Google Scholar]
- Xin, H.; Veljkovic, M. Fatigue crack initiation prediction using phantom nodes-based extended finite element method for S355 and S690 steel grades. Eng. Fract. Mech. 2019, 214, 164–176. [Google Scholar] [CrossRef]
- Gupta, R.S.; Xin, H.; Veljkovic, M. Fatigue crack propagation simulation of orthotropic bridge deck based on extended finite element method. Procedia Struct. Integr. 2019, 22, 283–290. [Google Scholar] [CrossRef]
- Ma, Y.; Wang, G.; Guo, Z.; Wang, L.; Jiang, T.; Zhang, J. Critical region method-based fatigue life prediction of notched steel wires of long-span bridges. Constr. Build. Mater. 2019, 225, 601–610. [Google Scholar] [CrossRef]
- Ma, Y.; He, Y.; Wang, G.; Wang, L.; Zhang, J.; Lee, D. Corrosion fatigue crack growth prediction of bridge suspender wires using Bayesian gaussian process. Int. J. Fatigue 2023, 168, 107377. [Google Scholar] [CrossRef]
- Taylor, D. The theory of critical distances. Eng. Fract. Mech. 2008, 75, 1696–1705. [Google Scholar] [CrossRef]
- Taylor, D. The Theory of Critical Distances: A New Perspective in Fracture Mechanics; Elsevier: Oxford, UK, 2010. [Google Scholar]
- GB/T3075-2021; Metallic Materials Fatigue Testing Axial Force Controlled Method. State Administration for Market Regulation: Beijing, China; National Standardization Management Committee: Beijing, China, 2021.
- GB/T21526-2008; Structural Adhesives Guidelines for the Surface Preparation of Metals and Plastics Prior to Adhesive Bonding. State Administration for Market Regulation: Beijing, China; National Standardization Management Committee: Beijing, China, 2008.
- Liu, Y.P.; Chen, C.Y.; Li, J.B.; Li, G.Q. Study on fatigue crack extension behavior of 14MnNbq welded bridge steel. Eng. Mech. 2008, 25, 209–213. (In Chinese) [Google Scholar]

Disclaimer/Publisher’s Note: The statements, opinions and data contained in all publications are solely those of the individual author(s) and contributor(s) and not of MDPI and/or the editor(s). MDPI and/or the editor(s) disclaim responsibility for any injury to people or property resulting from any ideas, methods, instructions or products referred to in the content. |
© 2023 by the authors. Licensee MDPI, Basel, Switzerland. This article is an open access article distributed under the terms and conditions of the Creative Commons Attribution (CC BY) license (https://creativecommons.org/licenses/by/4.0/).