

Evaluation of Glottal Inverse Filtering Techniques on OPENGLOT Synthetic Male and Female Vowels †


Abstract
1. Introduction
2. Analysis Methodology and GIF Methods
2.1. Analysis Methodology
2.2. IAIF-Based Approaches
2.2.1. IAIF
2.2.2. IOP-IAIF
2.2.3. GFM-IAIF
2.3. QCP-Based Approaches
2.3.1. QCP
2.3.2. ST-QCP
3. Experiments
3.1. OPENGLOT Dataset
3.2. GIF Parameter Tuning
3.3. Error Measures
4. Results
4.1. Global Results
4.2. F0
4.3. Phonation Type
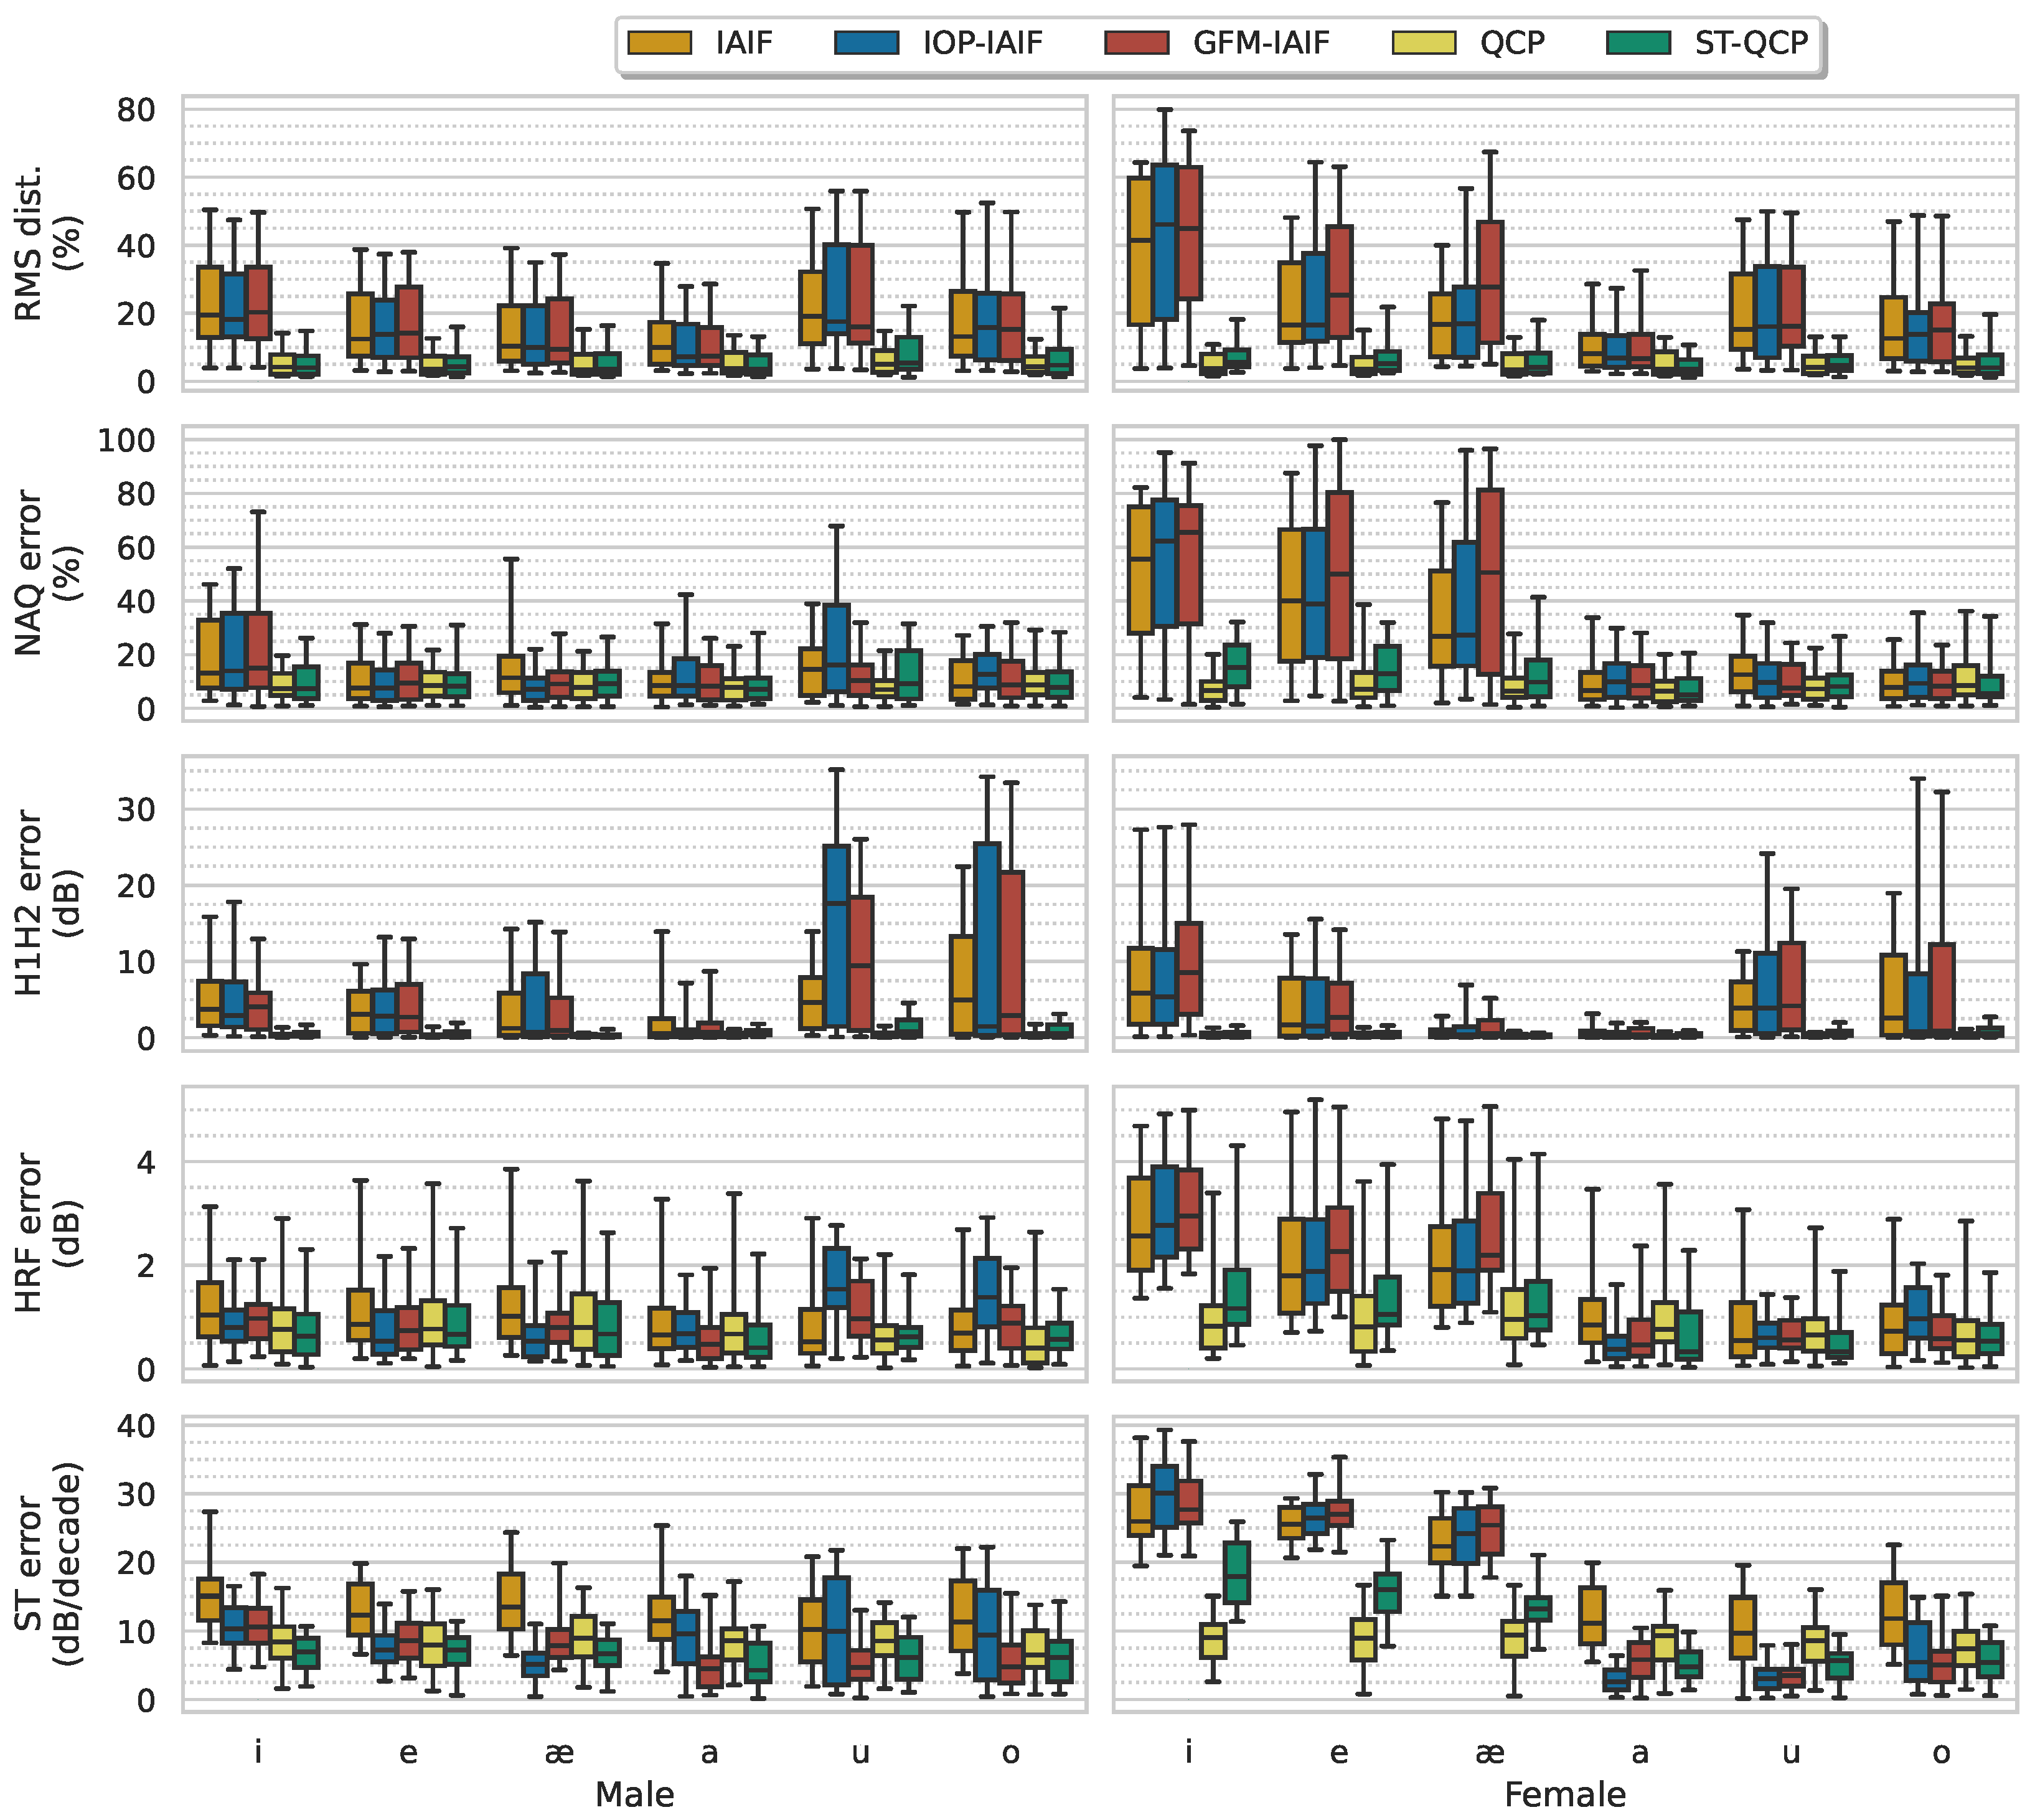
4.4. Vowels
5. Discussion
6. Conclusions
Supplementary Materials
Author Contributions
Funding
Institutional Review Board Statement
Informed Consent Statement
Data Availability Statement
Conflicts of Interest
Abbreviations
| AME | Attenuated main excitation |
| DQ | Duration quotient |
| FEM | Finite element method |
| GCI | Glottal closure instant |
| GIF | Glottal inverse filtering |
| GFM | Glottal flow model |
| GS | Glottal source |
| H1H2 | difference in amplitude between the first and second harmonics |
| HRF | Harmonic richness factor |
| HPF | High-pass filtering |
| IAIF | Iterative adaptive inverse filtering |
| IOP | Iterative optimal pre-emphasis |
| LF | Liljencrants–Fant model |
| LPC | Linear predictive coding |
| MAE-Wave | Median absolute waveform error |
| NAQ | Normalized amplitude quotient |
| PQ | Position quotient |
| QCP | Quasi-closed phase |
| RMS | Root-mean-square-error |
| RQ | Ramp quotient |
| ST | Spectral tilt |
| VT | Vocal tract |
Appendix A

| Paper | Pitch | Vowels | Type | Sample Freq. | Phonation | Other |
|---|---|---|---|---|---|---|
| [17] | 100:5:240 Hz | 14 | Synthetic (LF) | 16 kHz | Oq: 0.3:0.05:0.9 : 0.55:0.05:0.8 | SNR (dB): 10:10:80 |
| [20] | 60:20:180 Hz | /a/ /@/ /i/ /y/ | Synthetic (LF) | Oq: 0.4:0.05:0.9 : 0.6:0.05:0.9 | male | |
| [20] | Flat pitch | /a/ | Real | Decreasing Oq | ||
| [22] | Two values for the pitch period for female and male | /a/ | Synthetic [36] | 8 kHz | Breathy Normal Pressed | 8th order All-pole filter Male Female |
| [23] | F: 133–200 Hz M: 67–100 Hz | /a/ /i/ | Synthetic [36] | 8 kHz | Male Female | |
| [24] | /a/ | Real | 44.1 kHz down to 8 kHz | Weak, breathy Breathy Modal Loud, slightly tense Shouted & Tense | ||
| [25] | 100:5:240 Hz | 10 | Synthetic (LF) | 16 kHz | Rd: 0.4-2.7 | |
| [25] | Real | |||||
| [26] | Real | 48 kHz down to 16 kHz | Normal Lombard | 11 sentences 2 to 9 s | ||
| [28] | 75:10:405 | /a/ /e/ /i/ | Synthetic (LF) | 8 kHz | 625 different LF pulses | Optimize AME 8th order All-pole filter |
| [28] | 80:10:400 | /e/ /o/ /æ/ | Synthetic (LF) | 8 kHz | 4 LF values interlaced with the optim. set | Test set 8th order All-pole filter |
| [28] | 100:50:450 | /a/ /i/ /ae/ | Physical Model | 8 kHz | Test set Male Female 5 year-old | |
| [30] | 90:30:210 Hz | /i/ /e/ // /ä/ /o/ /u/ | Physical Model Two-mass, triangular-glottis vocal folds and transmission-line vocal tract | 48 kHz down to 16 kHz | pressed slightly pressed modal slightly breathy and breathy | VocalTractLab 2.1 {500, 708, 1000, 1414, 2000}Pa 0.6 s |
| [30] | 5 median target fundamental frequencies | Utterances derived from: “Lea und Doreen mögen Bananen.” | Physical Model Two-mass, triangular-glottis vocal folds and transmission-line vocal tract | 48 kHz down to 16 kHz | 5 median voice qualities | VocalTractLab 2.1 125 utterances 5 median pressure levels |
| [31] | 92, 110, 131, 156, 185, 220, 262, 311, 370, 440 Hz | /a/ /æ/ /i/ /ə/ /u/ /o/ | Physical Model | 4, 8, 12, 16 kHz | 11 steps from weak & breathy to strong & pressed | Vocal tract and trachea specified by 44 and 34 cross- sectional areas. |
| Paper | IAIF | IOP | GFM | QCP |
|---|---|---|---|---|
| [17] | Aparat default options = 10 = 2 d = 0.99 | |||
| [22] | = 8:2:12 = 2 d: Lip radiation effect cancelled by integrating the estimation of the glottal flow derivative. | |||
| [23] | = 10; = 4 d: Lip radiation effect cancelled by integrating the estimation of the glottal flow derivative. | |||
| [24] | = 8:2:18 = 4 d = 0.8:0.01:0.99 | = 8:2:18 = 4 d = 0.8:0.01:0.99 | ||
| [25] | = 14:2:22 = 3:1:6 d = 0.8:0.01:0.99 | = 14:2:22 = 3:1:6 d = 0.8:0.01:0.99 | = 14:2:22 = 3 d = 0.8:0.01:0.99 | |
| [28] | = 10 = 4 d = 0.99 | = 10 = 4 d = 0.99 DQ = 0.4:0.05:1 PQ = 0:0.025:0.2 RQ = 0:0.05:0.2 | ||
| [30] | = 20 = 4 | |||
| [31] | d = 0.75:0.001:0.999 = 2:2:10 (4 kHz) = 6:2:14 (8 kHz) = 10:2:16 (12 kHz) = 14:2:22 (16 kHz) = 3:1:6 | d = 0.75:0.001:0.999 = 2:2:10 (4 kHz) = 6:2:14 (8 kHz) = 10:2:16 (12 kHz) = 14:2:22 (16 kHz) = 3:1:6 | d = 0.75:0.001:0.999 = 2:2:10 (4 kHz) = 6:2:14 (8 kHz) = 10:2:16 (12 kHz) = 14:2:22 (16 kHz) = 3 |
Appendix B

Appendix C
| Male | Female | ||||||||
|---|---|---|---|---|---|---|---|---|---|
| Error | GIF Method | IOP-IAIF | GFM-IAIF | QCP | ST-QCP | IOP-IAIF | GFM-IAIF | QCP | ST-QCP |
| RMSE | IAIF | n | * | * | * | * | * | * | * |
| IOP-IAIF | * | * | * | * | * | * | |||
| GFM-IAIF | * | * | * | * | |||||
| QCP | * | * | |||||||
| NAQ | IAIF | * | * | * | * | * | * | * | * |
| IOP-IAIF | * | * | * | * | * | * | |||
| GFM-IAIF | * | * | * | * | |||||
| QCP | * | * | |||||||
| H1H2 | IAIF | * | * | * | * | * | * | * | * |
| IOP-IAIF | * | * | * | * | * | * | |||
| GFM-IAIF | * | * | * | * | |||||
| QCP | * | * | |||||||
| HRF | IAIF | * | * | * | * | * | * | * | * |
| IOP-IAIF | * | * | * | * | * | * | |||
| GFM-IAIF | n | * | * | * | |||||
| QCP | * | * | |||||||
| Spectral Tilt | IAIF | * | * | * | * | * | * | * | * |
| IOP-IAIF | * | * | * | * | * | * | |||
| GFM-IAIF | * | * | * | * | |||||
| QCP | * | * | |||||||
| Male | Female | ||||||||
|---|---|---|---|---|---|---|---|---|---|
| Error | GIF Method | IOP-IAIF | GFM-IAIF | QCP | ST-QCP | IOP-IAIF | GFM-IAIF | QCP | ST-QCP |
| F0 Range | l m h | l m h | l m h | l m h | l m h | l m h | l m h | l m h | |
| RMSE | IAIF | * * * | * * * | * * * | * * * | * * * | * * * | * * * | * * * |
| IOP-IAIF | * n * | * * * | * * * | * * * | * * * | * * * | |||
| GFM-IAIF | * * * | * * * | * * * | * * * | |||||
| QCP | * * * | * * * | |||||||
| NAQ | IAIF | * * * | * * n | n * * | * * * | * * * | * * * | * * * | * * * |
| IOP-IAIF | n * n | * * * | n * * | * * * | * * * | * * * | |||
| GFM-IAIF | * * * | * * * | * * * | * * * | |||||
| QCP | * * * | * * * | |||||||
| H1H2 | IAIF | n * * | * * * | * * * | * * * | n * * | * * * | * * * | * * * |
| IOP-IAIF | * * * | * * * | * * * | * * * | * * * | * * * | |||
| GFM-IAIF | n * * | * * * | * * * | * * * | |||||
| QCP | * * * | * * * | |||||||
| HRF | IAIF | * * * | * * * | * * * | * * * | * * * | * n * | * * * | * * * |
| IOP-IAIF | * * * | * * * | * * * | * * * | * * * | * * * | |||
| GFM-IAIF | * * * | * * * | * * * | * * * | |||||
| QCP | * * * | * * * | |||||||
| Spectral Tilt | IAIF | * * * | * * * | * * * | * * * | * * * | * * * | * * * | * * * |
| IOP-IAIF | n * * | * * * | * * * | * * * | * * * | * * * | |||
| GFM-IAIF | * * * | * * * | * * * | * * * | |||||
| QCP | * * * | * * * | |||||||
| Male | Female | ||||||||
|---|---|---|---|---|---|---|---|---|---|
| Error | GIF Method | IOP-IAIF | GFM-IAIF | QCP | ST-QCP | IOP-IAIF | GFM-IAIF | QCP | ST-QCP |
| Vocal Effort | c n b w | c n b w | c n b w | c n b w | c n b w | c n b w | c n b w | c n b w | |
| RMSE | IAIF | * * * * | * * * * | * * * * | * * * * | * * * * | * * * * | * * * * | * * * * |
| IOP-IAIF | n * * * | * * * * | * * * * | * * * * | * * * * | * * * * | |||
| GFM-IAIF | * * * * | * * * * | * * * * | * * * * | |||||
| QCP | * * n n | * * * * | |||||||
| NAQ | IAIF | * * * * | * * n * | * * * n | * * * * | * * * * | * * * * | * * * * | * * * * |
| IOP-IAIF | * * * * | * * * * | * * * * | * * * * | * * * * | * * * * | |||
| GFM-IAIF | * * * * | * * * * | * * * * | * * * * | |||||
| QCP | n * * * | * * * * | |||||||
| H1H2 | IAIF | * * * * | n * * * | * * * * | * * * * | * * * * | * * * * | * * * * | * * * * |
| IOP-IAIF | * * * * | * * * * | * * * * | n * * * | * * * * | * * * * | |||
| GFM-IAIF | * * * * | * * * * | * * * * | * * * * | |||||
| QCP | * * n * | * * * * | |||||||
| HRF | IAIF | * * * * | * * * * | * * * * | * * * * | * * * * | * * n * | * * * * | * * * * |
| IOP-IAIF | * * * * | * * * * | * * n * | * * * * | * * * * | * * * * | |||
| GFM-IAIF | * * * * | * * * * | * * * * | * * * * | |||||
| QCP | * * * * | * * * n | |||||||
| Spectral Tilt | IAIF | * * * * | * * * * | * * * * | * * * * | * * * * | * * * * | * * * * | * * * * |
| IOP-IAIF | * * * * | * * * * | * * * * | * * * * | * * * * | * * * * | |||
| GFM-IAIF | * * * * | * * * * | * * * * | * * * * | |||||
| QCP | * * * * | * * * * | |||||||
| Male | Female | ||||||||
|---|---|---|---|---|---|---|---|---|---|
| Error | GIF Method | IOP-IAIF | GFM-IAIF | QCP | ST-QCP | IOP-IAIF | GFM-IAIF | QCP | ST-QCP |
| vowel | i e æ a u o | i e æ a u o | i e æ a u o | i e æ a u o | i e æ a u o | i e æ a u o | i e æ a u o | i e æ a u o | |
| RMSE | IAIF | * * * * * * | * * * * * * | * * * * * * | * * * * * * | * * * * * * | * * * * * * | * * * * * * | * * * * * * |
| IOP-IAIF | * * * * * * | * * * * * * | * * * * * * | * * * * * n | * * * * * * | * * * * * * | |||
| GFM-IAIF | * * * * * * | * * * * * * | * * * * * * | * * * * * * | |||||
| QCP | * * * * * * | * * * * n * | |||||||
| NAQ | IAIF | * * * * * * | * * * n * n | * * * * * * | * * * * * * | * * * * * * | * * * * * n | * * * * * * | * * * * * n |
| IOP-IAIF | * * * * * * | * * * * * * | * n * * * * | n * * * * * | * * * * * * | * * * * * * | |||
| GFM-IAIF | * * n * * n | * * n * * n | * * * * * * | * * * * * n | |||||
| QCP | * n n n * n | * * * * * * | |||||||
| H1H2 | IAIF | * * * * * * | n n * n * * | * * * * * * | * * * * * * | * * * * * * | * * * * * * | * * * * * * | * * * * * * |
| IOP-IAIF | n * n * * n | * * * * * * | * * * n * * | * n * * * n | * * * * * * | * * * * * * | |||
| GFM-IAIF | * * * * * * | * * * * * * | * * * * * * | * * * * * * | |||||
| QCP | * * * * * * | * * n * * * | |||||||
| HRF | IAIF | * * * * * * | * * * * * n | * * * * * * | * * * * * * | * * * * * * | * * * * * * | * * * * * * | * * * * * * |
| IOP-IAIF | * * * * * * | n * * n * * | * * * * * * | * * * * * * | * * * * * * | * * * * * * | |||
| GFM-IAIF | * * * * * * | * * * * * * | * * * * * n | * * * n * * | |||||
| QCP | * * * * * * | * * * * * * | |||||||
| Spectral Tilt | IAIF | * * * * n * | * * * * * * | * * * * * * | * * * * * * | * * * * * * | * * * * * * | * * * * * * | * * * * * * |
| IOP-IAIF | * * * * * * | * * * * * * | * * * * * * | * * * * n * | * * * * * * | * * * * * * | |||
| GFM-IAIF | * * n * * * | * * * * * * | * * * * * * | * * * * * * | |||||
| QCP | * * * * * * | * * * * * * | |||||||
References
- Birkholz, P.; Jackel, D.; Kroger, B. Construction And Control Of A Three-Dimensional Vocal Tract Model. In Proceedings of the 2006 IEEE ICASSP Proceedings, Toulouse, France, 14–19 May 2006; Volume 1, p. I. [Google Scholar] [CrossRef]
- Blandin, R.; Arnela, M.; Laboissière, R.; Pelorson, X.; Guasch, O.; Hirtum, A.V.; Laval, X. Effects of higher order propagation modes in vocal tract like geometries. J. Acoust. Soc. Am. 2015, 137, 832–838. [Google Scholar] [CrossRef]
- Arnela, M.; Dabbaghchian, S.; Blandin, R.; Guasch, O.; Engwall, O.; Van Hirtum, A.; Pelorson, X. Influence of vocal tract geometry simplifications on the numerical simulation of vowel sounds. J. Acoust. Soc. Am. 2016, 140, 1707–1718. [Google Scholar] [CrossRef]
- Arnela, M.; Dabbaghchian, S.; Guasch, O.; Engwall, O. MRI-based vocal tract representations for the three-dimensional finite element synthesis of diphthongs. IEEE/ACM Trans. Audio Speech Lang. Process. 2019, 27, 2173–2182. [Google Scholar] [CrossRef]
- Dabbaghchian, S.; Arnela, M.; Engwall, O.; Guasch, O. Simulation of vowel-vowel utterances using a 3D biomechanical-acoustic model. Int. J. Numer. Methods Biomed. Eng. 2021, 37, e3407. [Google Scholar] [CrossRef] [PubMed]
- Arnela, M.; Guasch, O. Finite element simulation of /asa/ in a three-dimensional vocal tract using a simplified aeroacoustic source model. In Proceedings of the 23rd International Congress on Acoustics (ICA), Aachen, Germany, 9–13 September 2019; pp. 1802–1809. [Google Scholar]
- Pont, A.; Guasch, O.; Arnela, M. Finite element generation of sibilants /s/ and /z/ using random distributions of Kirchhoff vortices. Int. J. Numer. Methods Biomed. Eng. 2020, 36, e3302. [Google Scholar] [CrossRef] [PubMed]
- Schröder, M. Expressive speech synthesis: Past, present, and possible futures. In Affective Information Processing; Springer: Berlin/Heidelberg, Germany, 2009; pp. 111–126. [Google Scholar]
- Freixes, M.; Arnela, M.; Alías, F.; Socoró, J.C. GlottDNN-based spectral tilt analysis of tense voice emotional styles for the expressive 3D numerical synthesis of vowel [a]. In Proceedings of the 10th ISCA Speech Synthesis Workshop (SSW), Vienna, Austria, 20–22 September 2019; pp. 132–136. [Google Scholar] [CrossRef]
- Fant, G.; Liljencrants, J.; Lin, Q. A four-parameter model of glottal flow. Speech Transm. Lab. Q. Prog. Status Rep. (STL-QPSR) 1985, 26, 1–13. [Google Scholar] [CrossRef]
- Freixes, M.; Arnela, M.; Socoró, J.C.; Alías, F.; Guasch, O. Glottal Source Contribution to Higher Order Modes in the Finite Element Synthesis of Vowels. Appl. Sci. 2019, 9, 4535. [Google Scholar] [CrossRef]
- Arnela, M.; Guasch, O.; Freixes, M. Finite element generation of sung vowels tuning 3D MRI-based vocal tracts. In Proceedings of the 27th International Congress on Sound and Vibration (ICSV27), Graz, Austria, Online, 11–16 July 2021; pp. 1–8. [Google Scholar]
- Li, Y.; Li, J.; Akagi, M. Contributions of the glottal source and vocal tract cues to emotional vowel perception in the valence-arousal space. J. Acoust. Soc. Am. 2018, 144, 908. [Google Scholar] [CrossRef]
- Freixes, M.; Socoró, J.C.; Alías, F. Contribution of Vocal Tract and Glottal Source Spectral Cues in the Generation of Acted Happy and Aggressive Spanish Vowels. Appl. Sci. 2022, 12, 2055. [Google Scholar] [CrossRef]
- Li, K.; Unoki, M.; Li, Y.; Dang, J.; Akagi, M. Study on Simultaneous Estimation of Glottal Source and Vocal Tract Parameters by ARMAX-LF Model for Speech Analysis/Synthesis. In Proceedings of the 2021 Asia-Pacific Signal and Information Processing Association Annual Summit and Conference (APSIPA ASC), Tokyo, Japan, 14–17 December 2021; pp. 36–43. [Google Scholar]
- Schleusing, O.; Kinnunen, T.; Story, B.; Vesin, J.M. Joint Source-Filter Optimization for Accurate Vocal Tract Estimation Using Differential Evolution. IEEE Trans. Audio Speech Lang. Process. 2013, 21, 1560–1572. [Google Scholar] [CrossRef][Green Version]
- Drugman, T.; Bozkurt, B.; Dutoit, T. A Comparative Study of Glottal Source Estimation Techniques. Comput. Speech Lang. 2012, 26, 20–34. [Google Scholar] [CrossRef]
- Klatt, D.H.; Klatt, L.C. Analysis, synthesis, and perception of voice quality variations among female and male talkers. J. Acoust. Soc. Am. 1990, 87, 820–857. [Google Scholar] [CrossRef] [PubMed]
- Peterson, G.E.; Barney, H.L. Control methods used in a study of the vowels. J. Acoust. Soc. Am. 1952, 24, 175–184. [Google Scholar] [CrossRef]
- Drugman, T.; Dutoit, T. Complex Cepstrum-based Decomposition of Speech for Glottal Source Estimation. In Proceedings of the INTERSPEECH 2009, 10th Annual Conference of the International Speech, Brighton, UK, 6–10 September 2009; pp. 116–119. [Google Scholar]
- Bozkurt, B.; Dutoit, T. Mixed-phase speech modeling and formant estimation, using differential phase spectrums. In Proceedings of the ISCA Tutorial and Research Workshop on Voice Quality: Functions, Analysis and Synthesis, Geneva, Switzerland, 27–29 August 2003. [Google Scholar]
- Alku, P.; Vilkman, E.; Laine, U. Analysis of glottal waveform in different phonation types using the new IAIF-method. In Proceedings of the 12th lnternational Congress Phonetic Sciences, Aix-en-Provence, France, 19–24 August 1991; Volume 4, pp. 362–365. [Google Scholar]
- Alku, P. Glottal wave analysis with Pitch Synchronous Iterative Adaptive Inverse Filtering. Speech Commun. 1992, 11, 109–118. [Google Scholar] [CrossRef]
- Mokhtari, P.; Ando, H. Iterative Optimal Preemphasis for Improved Glottal-Flow Estimation by Iterative Adaptive Inverse Filtering. In Proceedings of the INTERSPEECH 2017–18th Annual Conference of the International Speech Communication Association, Stockholm, Sweden, 24–27 August 2017; pp. 1044–1048. [Google Scholar] [CrossRef]
- Perrotin, O.; McLoughlin, I. A Spectral Glottal Flow Model for Source-filter Separation of Speech. In Proceedings of the 2019 IEEE International Conference on Acoustics, Speech and Signal Processing (ICASSP), Brighton, UK, 12–17 May 2019; pp. 7160–7164. [Google Scholar] [CrossRef]
- Wong, D.; Markel, J.; Gray, A. Least squares glottal inverse filtering from the acoustic speech waveform. IEEE Trans. Acoust. Speech Signal Process. 1979, 27, 350–355. [Google Scholar] [CrossRef]
- Airaksinen, M.; Story, B.; Alku, P. Quasi closed phase analysis for glottal inverse filtering. In Proceedings of the INTERSPEECH’2013, Lyon, France, 25–29 August 2013. [Google Scholar]
- Airaksinen, M.; Raitio, T.; Story, B.; Alku, P. Quasi Closed Phase Glottal Inverse Filtering Analysis with Weighted Linear Prediction. IEEE/ACM Trans. Audio Speech Lang. Process. 2014, 22, 596–607. [Google Scholar] [CrossRef]
- Seshadri, S.; Juvela, L.; Räsänen, O.; Alku, P. Vocal Effort based Speaking Style Conversion using Vocoder Features and Parallel Learning. IEEE Access 2019, 7, 17230–17246. [Google Scholar] [CrossRef]
- Chien, Y.R.; Mehta, D.D.; Guðnason, J.; Zañartu, M.; Quatieri, T.F. Evaluation of Glottal Inverse Filtering Algorithms Using a Physiologically Based Articulatory Speech Synthesizer. IEEE/ACM Trans. Audio Speech Lang. Process. 2017, 25, 1718–1730. [Google Scholar] [CrossRef] [PubMed]
- Mokhtari, P.; Story, B.; Alku, P.; Ando, H. Estimation of the glottal flow from speech pressure signals: Evaluation of three variants of iterative adaptive inverse filtering using computational physical modelling of voice production. Speech Commun. 2018, 104, 24–38. [Google Scholar] [CrossRef]
- Alku, P.; Murtola, T.; Malinen, J.; Kuortti, J.; Story, B.; Airaksinen, M.; Salmi, M.; Vilkman, E.; Geneid, A. OPENGLOT–An Open Environment for the Evaluation of Glottal Inverse Filtering. Speech Commun. 2019, 107, 38–47. [Google Scholar] [CrossRef]
- Ma, C.; Kamp, Y.; Willems, L. Robust signal selection for linear prediction analysis of voiced speech. Speech Commun. 1993, 12, 69–81. [Google Scholar] [CrossRef]
- Levy, E.C. Complex-curve fitting. IRE Trans. Autom. Control. 1959, AC-4, 37–43. [Google Scholar] [CrossRef]
- Drugman, T.; Dutoit, T. Glottal closure and opening instant detection from speech signals. In Proceedings of the INTERSPEECH 2009, 10th Annual Conference of the International Speech, Brighton, UK, 6–10 September 2009; pp. 2891–2894. [Google Scholar]
- Gold, B.; Rabiner, L. Analysis of digital and analog formant synthesizers. IEEE Trans. Audio Electroacoust. 1968, 16, 81–94. [Google Scholar] [CrossRef]
- Alku, P.; Bäckström, T.; Vilkman, E. Normalized amplitude quotient for parametrization of the glottal flow. J. Acoust. Soc. Am. 2002, 112, 701–710. [Google Scholar] [CrossRef]
- Childers, D.G.; Lee, C.K. Vocal quality factors: Analysis, synthesis, and perception. J. Acoust. Soc. Am. 1991, 90, 2394–2410. [Google Scholar] [CrossRef] [PubMed]
- Summers, V.; Pisoni, D.; Bernacki, R.; Pedlow, R.; Stokes, M. Effects of noise on speech production: Acoustic and perceptual analyses. J. Acoust. Soc. Am. 1988, 84, 917–928. [Google Scholar] [CrossRef] [PubMed]
- Wilcoxon, F. Individual Comparisons by Ranking Methods. Biom. Bull. 1945, 1, 80–83. [Google Scholar] [CrossRef]


| d | HPF | DQ | PQ | RQ | ST | |||
|---|---|---|---|---|---|---|---|---|
| IAIF | 6:1:14 | 3:1:6 | 0.8:0.01:0.99 | 0/1 | ||||
| IOP-IAIF | 6:1:14 | 3:1:6 | 0.8:0.01:0.99 | |||||
| GFM-IAIF | 6:1:14 | 3 | 0.8:0.01:0.99 | 0/1 | ||||
| QCP | 6:1:14 | 3:1:6 | 0.8:0.01:0.99 | 0.4:0.05:1 | 0:0.025:0.2 | 0:0.05:0.2 | 0 | |
| ST-QCP | 6:1:14 | 3:1:6 | 0.8:0.01:0.99 | 0.4:0.05:1 | 0:0.025:0.2 | 0:0.05:0.2 | 1 |
| IAIF | IOP-IAIF | GFM-IAIF | QCP | ST-QCP | |
|---|---|---|---|---|---|
| RMS distance (%) | 13.45 | 15.41 | 15.16 | 3.97 | 4.44 |
| NAQ error (%) | 10.53 | 9.94 | 9.71 | 7.74 | 7.87 |
| H1H2 error (dB) | 2.81 | 2.07 | 2.1 | 0.27 | 0.41 |
| HRF error (dB) | 0.84 | 0.87 | 0.8 | 0.64 | 0.6 |
| ST error (dB/decade) | 12.31 | 7.93 | 6.79 | 8.38 | 6.55 |
| IAIF | IOP-IAIF | GFM-IAIF | QCP | ST-QCP | |
|---|---|---|---|---|---|
| RMS distance (%) | 15.06 | 15.7 | 17.79 | 3.74 | 4.74 |
| NAQ error (%) | 16.8 | 16.91 | 15.48 | 6.99 | 9.25 |
| H1H2 error (dB) | 1.22 | 0.93 | 1.51 | 0.25 | 0.34 |
| HRF error (dB) | 1.34 | 1.26 | 1.39 | 0.75 | 0.85 |
| ST error (dB/decade) | 19.58 | 15.02 | 16.62 | 8.8 | 9.9 |
Disclaimer/Publisher’s Note: The statements, opinions and data contained in all publications are solely those of the individual author(s) and contributor(s) and not of MDPI and/or the editor(s). MDPI and/or the editor(s) disclaim responsibility for any injury to people or property resulting from any ideas, methods, instructions or products referred to in the content. |
© 2023 by the authors. Licensee MDPI, Basel, Switzerland. This article is an open access article distributed under the terms and conditions of the Creative Commons Attribution (CC BY) license (https://creativecommons.org/licenses/by/4.0/).
Share and Cite
Freixes, M.; Joglar-Ongay, L.; Socoró, J.C.; Alías-Pujol, F. Evaluation of Glottal Inverse Filtering Techniques on OPENGLOT Synthetic Male and Female Vowels. Appl. Sci. 2023, 13, 8775. https://doi.org/10.3390/app13158775
Freixes M, Joglar-Ongay L, Socoró JC, Alías-Pujol F. Evaluation of Glottal Inverse Filtering Techniques on OPENGLOT Synthetic Male and Female Vowels. Applied Sciences. 2023; 13(15):8775. https://doi.org/10.3390/app13158775
Chicago/Turabian StyleFreixes, Marc, Luis Joglar-Ongay, Joan Claudi Socoró, and Francesc Alías-Pujol. 2023. "Evaluation of Glottal Inverse Filtering Techniques on OPENGLOT Synthetic Male and Female Vowels" Applied Sciences 13, no. 15: 8775. https://doi.org/10.3390/app13158775
APA StyleFreixes, M., Joglar-Ongay, L., Socoró, J. C., & Alías-Pujol, F. (2023). Evaluation of Glottal Inverse Filtering Techniques on OPENGLOT Synthetic Male and Female Vowels. Applied Sciences, 13(15), 8775. https://doi.org/10.3390/app13158775