Abstract
The shortage of precooling equipment in litchi-producing regions could lead to a high loss rate and poor quality of litchis. It is urgent to develop a portable precooling device for litchi-producing regions. In this study, a novel spray hydrocooler with thermal energy storage (TES) was designed, fabricated, and tested. A simple mathematical model of TES capacity, the ice-on-coil thermal resistance, and refrigeration system was employed to determine the hydrocooler parameters. Then, the structure of the spray hydrocooler was designed. The maximum charging test was implemented with full TES capacity, and the litchi spray hydrocooling experiments were carried out at different charging times (3–6 h), spray flow rates (30–60 L min−1), and litchi loads (8–28 kg) with one-third TES capacity. Results showed that: (1) the spray hydrocooler allows for the rapid and effective precooling of litchis within 15 min after harvest; (2) the hydrocooler can precool 299 kg litchis with one-third TES storage, meeting the precooling requirements; (3) the effective TES capacity achieved 1.25 × 10⁸ J at the maximum TES capacity of the hydrocooler, while the energy efficiency ratio (EER) is 2; (4) the precooling capacity was maximum and the average power consumption was minimum when the litchi load was 23 kg and the spray flow rate was 30 L min−1. Longer charging time is the most important factor in increasing the precooling capacity and reducing the average power consumption. It provides feasible precooling equipment for rapid precooling in litchi-production regions.
1. Introduction
Litchi (Litchi chinensis), a perishable fruit, is loved by people worldwide, and China contributes 60% of the world’s production [1]. Litchi mainly matures in summer and has high-temperature flesh and skin, which contain large amounts of field heat after harvest [2]. In the postharvest environment, water lost from litchi due to transpiration is not well replenished, causing rapid deterioration [3]. Loss of litchis occurs due to a lack of proper and timely postharvest treatment [4]. Applying a cold treatment during postharvest can effectively lessen respiration, inhibit microbial growth, and reduce enzyme activity in fruits and vegetables [5,6].
Precooling is the initial step to rapidly cooling down the harvested products to the desired temperature by using a low-temperature medium to extract heat. As such, precooling is required immediately after harvest to eliminate field heat, to significantly extend the shelf life, and to improve commodity quality [7]. There are four methods commonly used for the precooling of various fruits and vegetables [8,9]. Forced-air cooling requires several hours and can easily lead to the formation of hot spots and water loss [10]. Ice cooling can cause uneven cooling, insufficient cooling, frostbite, soft rots on products, and increase transportation costs [11,12]. Vacuum cooling leads to water loss and is not suitable for products with a low surface-to-volume rate [13,14]. Hydrocooling could reduce water loss, avoid skin softening of crops, and is about 2–15 times faster than forced-air cooling under similar conditions [15,16]. Litchi, apple, cherry, sweet corn, radishes, Barhee dates, and carrots are precooled successfully using hydrocooling [8,17,18,19].
At present, postharvest litchi precooling treatment is inadequate [20]. After being picked, most litchis are transported and sold with ice bags. However, litchi lose their commercial value by browning and decaying quickly [21]. Few litchis are transported to litchi processing enterprises while immersed in ice water or cold water for precooling. Precooling facilities are generally far away from litchi production [20]. Due to the costs of transportation and processing, litchi precooling costs are high. In addition, ice water immersion precooling is prone to overcooling or undercooling [22]. In China, the existing precooling equipment in litchi producing regions is limited to laboratory research. There is no precooling equipment that can precool litchis timely and quickly and meet the precooling demand of the litchi producer.
TES systems can store either heat or cold energy [23]. Energy can be charged, stored, and discharged on a daily, weekly, seasonal, or annual basis [24]. It can shift energy usage from the peak to the off-peak periods and shift the energy to areas faced with a shortage. A wet precooling system for fruit and vegetables with TES has strong applicability, easily realizes a low-temperature stable environment, and has a large application space during precooling [25]. TES of slurry ice can be used for precooling in the fish industry to reduce energy consumption, accelerate precooling, reduce microbial growth, and improve shelf life [26]. TES of slurry ice is the most effective technology that is relevant to increases in the shelf life of various chilled aquatic food products because of subzero storage temperature, fast chilling rates, and less physical damage caused by microscopic spherical particles [27].
In this study, a spray hydrocooling device using TES technology was newly designed and fabricated. The use of direct evaporative TES provides a cooling source for precooling fruits and vegetables, and melting ice is used for precooling litchi, enabling rapid release of cooling capacity. The use of TES not only allows energy storage but also facilitates energy transfer in space, meeting the precooling needs of fruit and vegetable production areas. This approach reduces the loss caused by inadequate precooling of litchi, improves the convenience of litchi precooling, reduces precooling costs, and solves the precooling challenge in litchi production areas.
2. Mathematical Model of the Hydrocooler
The usual precooler precools during refrigeration, with the refrigeration capacity determining the precooling rate of fruits and vegetables. The precooler in this study is provided energy from TES. The refrigerator is idle when cooling, and the thermal energy is stored in the TES tank. During precooling, the energy in the TES tank is released to cool fruits and vegetables. The hydrocooler is mainly composed of the TES system and spray hydrocooling system (Figure 1). The evaporation coil is located in the TES box, which is filled with water. During charging, the thermal energy is stored as cold water and ice. During precooling, the cold water of TES tank is pumped to the precooling box and sprayed on the surface of fruits and vegetables through the spray device of the precooling box. The temperature of fruits and vegetables is reduced due to the heat exchange between cold water and fruits and vegetables. The used water flows back to the TES tank and exchanges heat with the ice in the TES tank. The precooling capacity of fruits and vegetables is determined by the thermal energy stored in the TES tank, the thermal insulation characteristics of the device, and the thermodynamic properties of fruits and vegetables. Therefore, it is necessary to establish a mathematical model for the precooler to calculate the key design parameters, such as TES capacity, in order to design and manufacture a suitable device for precooling demand.
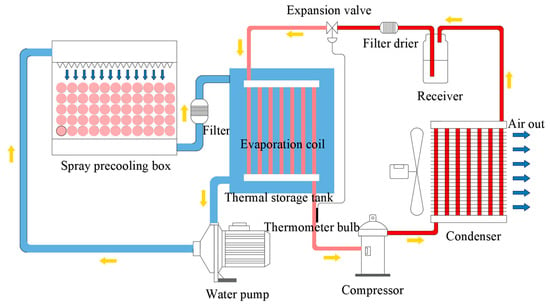
Figure 1.
Operation principle diagram of the spray hydrocooler.
2.1. Mathematical Model of TES System
During the charging process, the thermal energy is stored in cold water and ice as sensible and latent heat. Cold water storage only contains sensible heat, while ice storage contains both latent heat of ice and sensible heat of cold water. Therefore, latent heat has significant advantages over sensible heat and is the preferred method for energy storage.
In the case of litchi, a precooling system that handles 1000 kg can meet the demand of most small- and medium-sized orchards. The suitable storage temperature of litchi is about 5 °C, and it is appropriate to reach 8 °C after precooling. The pulp temperature of litchi is about 29 °C when picked. According to the principle of conservation of energy, the energy absorbed by litchi fruits precooling is calculated as [28]:
The TES tank also contains the TES capacity that cannot be used in the precooling process, since the water temperature drops from the initial charging temperature to the termination precooling temperature. There is significant thermal energy leakage during the refrigeration and storage phases. During precooling, the loss of cooling capacity caused by the water pump working on the water, opening the precooling box and changing the precooling litchi, the connection between the inlet and outlet of the box, and the heat bridge at the edge of the box need to be taken into account in the TES capacity. Therefore, the TES capacity of charging should be improved as follows [29]:
The temperature of ice water mixture is 0 °C after charging, and the total TES capacity comprises the sensible heat of water and latent heat of water freezing. Direct evaporation is used for TES, and external melt is used to release thermal energy. Ice is formed directly around the evaporation coil as a regular cylinder. The amount of ice stored in TES tank at the end of charging can be estimated using the following equation [30]:
2.2. Thermal Resistance of Ice-on-Coil
Ice-on-coil is a simple and effective TES method with good discharge characteristics. Direct evaporative TES refrigeration system has simple structure and good applicability to small equipment. The structure diagram of evaporation coil icing of the cold storage tank is shown in Figure 2. The coil is horizontal, and the icing state in the TES tank is represented by the evaporation coil per unit length.
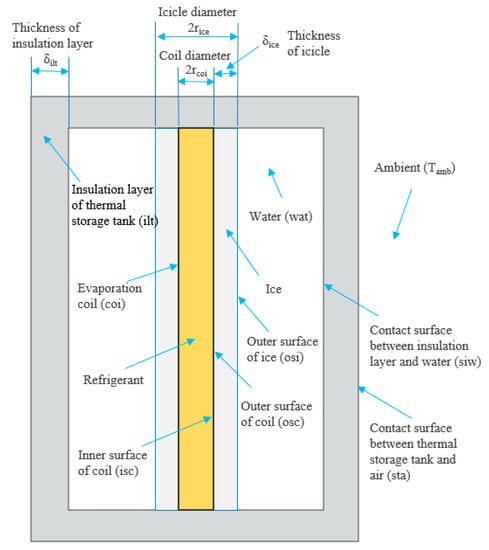
Figure 2.
Structure diagram of evaporation coil icing.
During the charging process, the refrigerant absorbs heat by evaporation and cools the water outside the coil. Both the thermal resistance between coil and water changes and the heat flow of coil section will change with the increase in ice thickness. According to the fundamental law of heat transfer, the heat flux of the evaporating coil can be expressed using the following equation [31]:
The refrigeration system uses R22 refrigerant [32]. The boiling thermal resistance of refrigerant in the coil per unit length can be expressed as [33]:
The heat conduction resistance of the evaporated coil per unit length can be expressed as [33]:
The heat conduction resistance of ice layer per unit length can be expressed as [33]:
The thermal resistance of heat convection between ice and water per unit length can be expressed as [33]:
The contact resistance between the ice and coil per unit length can be expressed as:
One-dimensional steady-state heat conduction analysis is used to solve the heat transfer process in the cylinder at any time instant. From Equations (11) and (12), it can be seen that increasing the coil radius can reduce the refrigerant evaporation thermal resistance and coil thermal resistance under constant coil thickness. It can be observed from Equations (13) and (14) that Rice increases and Rsiw decreases with increasing ice thickness when the coil radius remains unchanged.
2.3. Mathematical Model of Refrigeration System
Choosing the matching refrigeration system is important for meeting the TES demand and improving the efficiency of refrigeration. The working characteristics of a refrigeration compressor mainly involve the compressor’s refrigerating capacity and the power consumed. The theoretical gas transmission of the compressor is fixed based on the compressor and the refrigeration cycle. The refrigerating capacity and energy consumption are related to the unit refrigerating capacity, unit theoretical work, and compressor’s inspiratory capacity of the refrigeration cycle.
According to the thermodynamics of the refrigeration cycle [34], the refrigerating capacity and energy consumption of the refrigeration system are theoretically related, as follows:
The condenser adopts air-cooled forced convection, making it lightweight, small, environmentally friendly, simple, and convenient. According to the fundamental equation of heat transfer [34], the heat transfer area of a condenser is obtained as:
Direct evaporative coils are used for making ice in the hydrocooler. The convective heat exchange occurs between the coil and water before freezing, while the exchange is between the coil and ice after freezing. The outer surface area of the coil is taken as the heat transfer area. According to the fundamental equation of heat transfer [34], the heat transfer area of the evaporator is given by:
The values of equations’ parameters are summarised in Table 1. The structural parameters and precooling conditions of the device were assumed, the thermophysical parameters and refrigeration parameters were determined by references, and the environmental and litchi parameters were determined by measurement.

Table 1.
Values of equation parameters.
2.4. Solution of Mathematical Model
The weight of litchi precooling for the hydrocooler is dependent on the current situation of the orchard. According to Equation (1) and physical parameters of litchi, 1000 kg litchi precooling required thermal energy capacity of 8.1 × 10⁷ J. Solving Equations (2)–(7), the TES capacity of the TES tank was 2.4 × 10⁸ J, and the ice volume reached 256 kg.
The relationship between ice thickness and heat transfer coefficient can be obtained according to Equations (10)–(14), as shown in Figure 3. The thermal resistance increases while the heat transfer coefficient decreases with the increase in ice thickness. The total heat transfer coefficient is 17.875 W m−2 K−1, and the total thermal resistance is 0.056 m2 K W−1 when ice is not formed. The heat transfer coefficient decreases rapidly with ice thickness when the ice thickness is less than 40 mm. The heat transfer coefficient decreases significantly with ice thickness when the thickness is greater than 40 mm. The total thermal resistance is 0.143 m2 K W−1, and the heat transfer coefficient is 6.995 W m−2 K−1, which is 60.9% lower than that without ice when the ice thickness is 40 mm. Once the ice thickness exceeds 120 mm, the heat transfer coefficient reduces slowly.
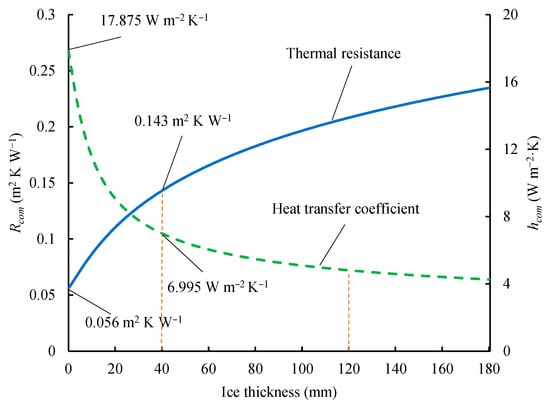
Figure 3.
The variation of the total thermal resistance and heat transfer coefficient with the ice thickness.
Given the thermal resistance analysis of the ice-on-coil, the best ice thickness was considered to be 40 mm. According to Equation (9), the evaporation coil length was 39.5 m. If using a single coil with 39.5 m, excessive coil length would increase the superheat, reduce the return air pressure, and cause the suction gas of the compressor to overheat and produce low refrigerant efficiency of refrigeration system. According to Equation (15), the refrigerating capacity of the compression should reach 5900 W in order to meet the TES demand in 12 h. Therefore, the cooling was divided into two refrigeration units, and the refrigerating capacity of each refrigeration system should reach 2950 W. From Equation (18), the condensation heat transfer area of the condenser is calculated to be greater than 11.3 m2 for a single refrigeration unit. Solving for Equation (19) determines that the evaporation heat transfer area of the evaporator should be greater than 0.84 m2 for a single refrigeration unit. The length of the evaporation coil was 19.75 m of a single refrigeration unit, so the outer surface area of the evaporation coil of a single refrigeration unit was 1 m2, which met the requirements of evaporation heat transfer area. The solutions of equations and determination of ice thickness are summarised in Table 2.

Table 2.
Solutions of equations and ice thickness determination.
3. Design and Fabrication of Hydrocooler
3.1. Overall Structure
The hydrocooler combines the functions of refrigeration, storage, and precooling to makes the device portable. The TES system and spray hydrocooling system were designed to realize the required thermal energy transfer. The hydrocooler based on the TES technology was designed by analysing the TES capacity, heat transfer characteristics, and refrigeration system configuration. The hydrocooler was composed mainly of the refrigeration unit, thermal storage tank, spray precooling box, circulating water pipe, water pump, and the base plate shown in Figure 4.
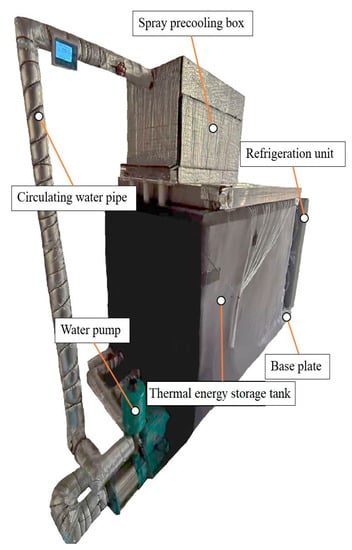
Figure 4.
Photograph of the spray hydrocooler.
The refrigeration capacity of one QXL-30E compressor was 3180 W when the evaporation temperature was –10 °C. Hence, the refrigeration capacity of two systems was 6360 W, which met the calculation requirements in Section 2. Two air-cooled condensers from SIMCO (small 3-HP, China) with an 18 m2 heat transfer area each were used. According to Section 2, the heat transfer area, Aeva, of the evaporator exceeded 1 m2, and the coil length, L, was not less than 39.6 m. Here, the length of the evaporation coil of the two refrigeration units was 43.4 m. The circulating water pipe with a diameter of 32 mm and a Weller SD-750 variable frequency water pump was selected, and the maximum flow reached 200 L min−1. The spray precooling method was adopted to realize the rapid precooling of the fruit. The sprinkler was selected as the spray structure, which had high uniformity and pressure regulation characteristics. The size of a single sprinkler was 0.25 × 0.25 × 0.006 m3. The diameter of nozzle was 1.5 mm, which was made of silica gel. The spray structure was made up of six sprinklers. The size of the spray precooling box was 0.75 × 0.52 × 0.45 m3; two precooling baskets could be placed in it at the same time. The size of the cold storage tank was 1.7 × 0.85 × 1 m3, and the maximum water capacity was 1.2 m3. The parameters of the spray hydrocooler are shown in Table 3.

Table 3.
Selection of spray hydrocooler components.
3.2. Structure of TES System
The structure of the TES tank and refrigeration system are shown in Figure 5. The evaporation coil layout is shown in Figure 5b. The coils’ centre was kept 120 mm apart horizontally and 135 mm apart vertically to avoid overlapping of ice. The coils in the first, third, and fifth layers were connected to the first compressor, while the coils of the second, fourth, and sixth layers were connected to the second compressor. During the charging process, the refrigerant flows into the first and second layers’ coils and flows out through the coils in the fifth and sixth layers, respectively.
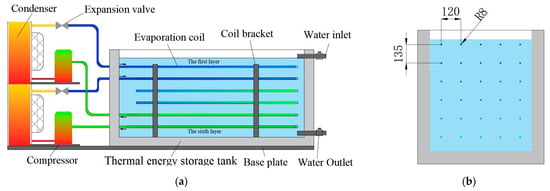
Figure 5.
Structure diagram of TES tank and refrigeration system. (a) The main view and. (b) The left view.
3.3. Structure of Spray Hydrocooling System
The precooling device was designed with a precooling capacity of 1000 kg litchi per day and a precooling time of 8 h. If six batches were precooled per hour, the precooling capacity of each batch was 21 kg. The size of packing basket selected was 0.35 × 0.48 × 0.16 m3, and each basket could hold 11.5 kg of litchi. Figure 6 shows the schematic diagram and photograph of the spray precooling box. Sprinklers were mounted at the top and a perforated plate was used at the bottom of the spray hydrocooling box. The outside of the box was covered with 1 cm thick insulation cotton. Six square stainless-steel sprinklers had nozzles made of silica gel. The nozzles were 1.5 mm in diameter under zero-pressure conditions and could enlarge with water pressure. The spray flow rate was controlled by the variable frequency water pump. Litchi packed in perforated baskets was kept in the spray precooling box for precooling. The cold water sprayed over the litchi initiates rapid heat exchange. The water then flows through the perforated bottom plate and enters the TES tank.

Figure 6.
Schematic diagram and photograph of spray precooling box and cold-water circulation system.
4. Charging Test and Litchi Spray Precooling Tests
4.1. Experimental Setup
The experimental setup is shown in Figure 4; the TES tank was covered with 50 mm thick insulation cotton, the spray hydrocooling box was covered with 10 mm thick insulation cotton, and the circulating water pipe was covered with 20 mm thick insulation cotton to prevent energy loss. The experiment was carried out using a VX810 paperless recorder (Hangzhou Pangu Automation System Co., Ltd., China) to record data at 1 s intervals. A PT100 temperature sensor (±0.1 °C) was used for temperature monitoring, and a KAA-T4 AC transmitter (0–30 A, ±0.2%, Zhuhai Xinghui Electronic Technology Co., Ltd., China) was used for measuring power consumption of the water pump and compressor. As shown in Figure 7, 27 PT100 temperature sensors are arranged in a 3 × 3 × 3 array. One (1) charging test and eleven (11) litchi spray precooling tests were conducted (Table 4).

Figure 7.
Temperature measuring and ice thickness measuring points of the spray hydrocooler.

Table 4.
Conditions of charging and spray hydrocooling tests.
4.2. Charging Test
During the charging test, the TES tank contained 1200 kg of water with an initial temperature of 31 °C. The TES tank was charged for 12 h. As shown in Figure 7, three ice thickness measuring points, a, b, and c in the first, third, and fifth layers of coil, respectively, were used to manually estimate ice mass by reading the scale. The ice thickness was manually measured every 30 min by reading the scale. The scales were fixed on the coil horizontally with the circle centre of the coil. When water outside of the coil was frozen, the contact position between the outer surface of the ice layer and the scale was considered the ice thickness (). The aim was to analyse the TES capacity and economy of the hydrocooler with an increase in charging time.
4.3. Litchi Spray Precooling Tests
Conditions of spray hydrocooling tests are shown in Table 4, which lists the three test conditions: charging time, litchi load, and spray flow rate. This design is a hub and spoke type experimental design where test 2 (4 h, 23 kg, 30 L min−1) was conducted at the central location, and then the ranges of the three parameters in both directions were explored. The spray precooling test was to study different test conditions and identify the best operating parameters of the spray hydrocooling box. Five litchis were selected from the middle layer of the litchi basket for monitoring the temperature of the pumps, and PT100 temperature sensors were inserted in litchi pulp, respectively. The litchi was taken out when the pulp temperature dropped to 8 °C and was replaced with the litchi to be precooled. This was repeated until the water temperature of the TES tank reached 7 °C, ending the precooling test.
4.4. Evaluation of Spray Hydrocooler Performance
The water temperature (Twat) was measured at three different layers (upper, middle, and lower) in the TES tank with nine temperature sensors in each layer. In the charging process, the water temperature of each layer was considered the average value. During litchi precooling, the water temperature was represented by the mean value of these 27 temperature sensors.
Ice thickness, δice, as shown in Figure 2, was the average value of the ice thickness.
The TES capacity (Qchr) indicated the sensible heat released by the water cooling and latent heat released by the water freezing. It could be expressed as:
The effective TES capacity (Qeff) refers to the thermal energy storage that can be used by litchi precooling. It is the part that uses the TES capacity to subtract the part that cannot be used, and that is the part where the water temperature of the TES tank decreases from the initial temperature to the end of precooling temperature. It can be expressed as:
The total power consumption (Etal) including water pump power consumption in the spray precooling test and compressor power consumption in the charging process can be expressed as:
EER, the energy efficiency ratio, is the ratio of TES capacity to power consumption. In order to obtain the real-time energy efficiency change and average energy efficiency change in the charging process, a 30 min energy efficiency ratio and average energy efficiency ratio are used. The 30 min energy efficiency ratio is the ratio of TES capacity and the energy consumption in 30 min, and the average energy efficiency ratio is the ratio of TES capacity and the energy consumption since the beginning of charging. All are expressed as [37]:
Precooling capacity (mspr) refers to the total amount of litchi precooled until finishing precooling in one test.
Precooling time (tspr) refers to the time from the beginning of precooling to the end of precooling in one test, when the water reaches 7 °C.
Precooling rate (uspr) is the ratio of precooling capacity to precooling time in one test.
Average power consumption (Ekg) is the power consumption per kilogram of litchi precooled. It is the most intuitive method to evaluate the cost of litchi precooling and an important index to evaluate the economy of precooling equipment. The average power consumption is given by:
5. Results and Discussion
5.1. Experiment I: Charging of TES Tank
5.1.1. Variation of Water Temperature and Ice Thickness
The variation of water temperature and ice thickness is shown in Figure 8. The water temperature decreased rapidly with charging time during the first 6 h, but the decrease became more gradual when the water temperature was lower than 5 °C. Before 6 h, the upper layer’s water temperature was higher than the lower and middle layers. From 0 to 6 h, the lower layer’s temperature was higher than that of the upper and middle layers. After 9 h, the water temperature remained almost unchanged and was in the range of 1.4 °C to 2 °C. The water density increases with the decrease in temperature when the water temperature is higher than 4 °C. The water density drops as the temperature decreases when the water temperature is lower than 4 °C. Hence, the sinking of colder water leads to the upper layer’s water temperature being higher than the lower and middle layers when water is higher than 4 °C. On the contrary, the floating of colder water leads to the lower layer’s water temperature being higher than the upper and middle layers when the water temperature is lower than 4 °C [38].
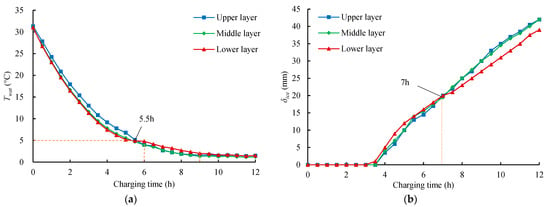
Figure 8.
Plots showing variation of (a) water temperature and (b) ice thickness of different layers with charging.
It can be seen from Figure 8 that the water around the coils begins to freeze at 3.5 h. Initially, the ice thickness of the lower layer was more than the upper and middle layers. After 7 h of charging, the lower layer’s ice thickness was less than the upper and middle layers. The temperature of the lower layer was more than the upper and middle layers after 6 h, which resulted in a reduced ice thickness in the lower layer after 7 h of charging. The ice thickness of the upper, middle, and lower layers after 12 h of charging was 42 mm, 42 mm, and 39 mm, respectively, and the average ice thickness was 41 mm, which is close to the designed thickness of 40 mm. The mass of ice from the two refrigeration units was 143.3 kg and 141.3 kg, respectively, after 12 h of charging. The total ice storage capacity was 284.6 kg, which meets the design requirements of having a capacity of less than 272.5 kg.
5.1.2. Variation of TES Capacity and EER
Figure 9 shows the changes in TES capacity and effective TES capacity with charging time. It can be seen from the figure that the TES capacity continued to increase, and the effective TES capacity was zero in the first 4 h. After 4 h of charging, the effective TES capacity began to increase linearly. After 12 h of charging, the effective TES capacity reached 1.25 × 10⁸ J. The TES capacity was 2.47 × 10⁸ J, which was twice that of the effective TES capacity. It can be seen from Section 2.4. that the design TES capacity of the device was 2.4 × 10⁸ J, and the test value meets the design requirements. The remaining 1/2 TES capacity that cannot be utilized was used to reduce the water temperature from its initial state to 7 °C. If the remaining 1/2 TES capacity for reducing the water temperature of the TES tank can be reused, the power consumed by charging will be greatly reduced.
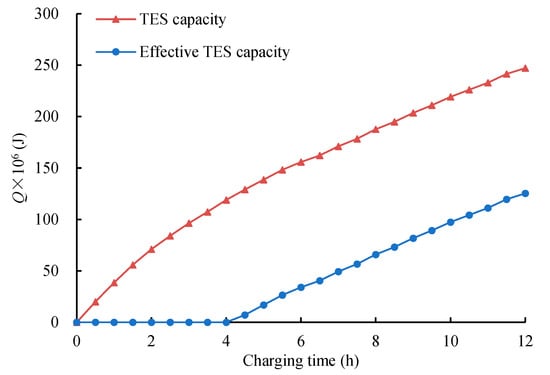
Figure 9.
Plots showing variation of TES capacity and effective TES capacity with charging.
As shown in Figure 10, the 30 min EER in charging was stable, and the maximum was 3.56 in one hour. It decreased rapidly after 1.5 h and reached 1.24 at 6.5 h. Then, followed by fluctuation, it reached the minimum value of 1.12 at 12 h. This showed that the efficiency of charging was high at the beginning, decreased rapidly, and remained stable after 6 h. The fluctuation of EER during the charging process was due to the measurement error of TES capacity, but the fluctuation cannot influence the overall trend of EER during charging. However, the average EER was 3.5 at the beginning of the charging process and gradually decreased after 1 h, reaching the lowest value of 2.0 at 12 h. From Figure 10, we can know that the longer the charging time is, the lower the EER of TES is.
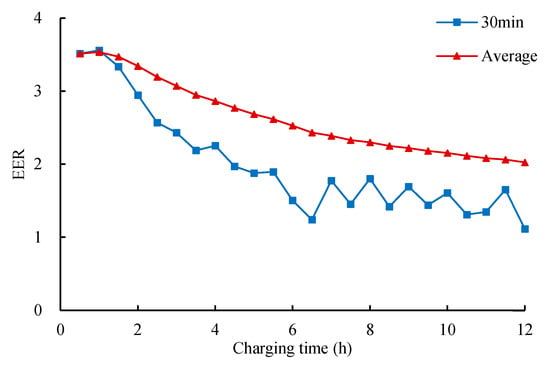
Figure 10.
Plots showing variation of energy efficiency ratio of hydrocooler with charging.
5.2. Experiment II: Litchi Spray Hydrocooling Performance
5.2.1. The Temperature of Litchi and Water
Figure 11 shows the variation curve of water temperature and litchi temperature during litchi precooling in test 2. It can be seen from the figure that the initial temperature of litchi was about 30 °C, and the final temperature of litchi after precooling was 8 °C. There were nine batches and a total of 207 kg of litchi that were precooled. The precooling water temperatures during precooling for nine batches of litchi were 2.22 °C, 3.14 °C, 3.71 °C, 4.16 °C, 4.5 °C, 4.86 °C, 5.23 °C, 5.84 °C, and 6.53 °C, and the precooling times were 6.53 min, 11.27 min, 8.3 min, 10.83 min, 9.53 min, 10.97 min, 10.97 min, 15.4 min, and 12.63 min, respectively. The average precooling time of a single batch was 11 min, which was 10% higher than the design value. During the precooling process, all the ice had melted when the water temperature reached 7 °C, and the water temperature of the TES tank rose steadily.
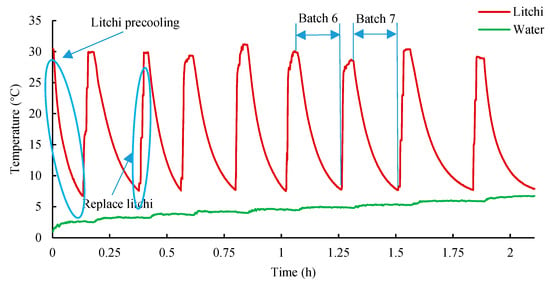
Figure 11.
The temperature curve of litchi spray hydrocooling in test 2.
5.2.2. Precooling Capacity and Precooling Rate
Figure 12a shows that the precooling capacity increased simultaneously with the charging time, while the precooling rate did not change significantly. The more ice that is stored, the more TES capacity is stored, thus resulting in a higher precooling capacity. It was evident that the precooling rate of the fifth and sixth charging tests was faster than that of the third and fourth charging tests. Since the temperature of the ice–water mixture is 0 °C, the water temperature during the precooling process is higher than 0 °C. When there is more ice stored in the storage box, the contact area between the ice and water is larger, causing the ice to melt faster, the speed of heat release to increase, and the precooling speed of fruits and vegetables to be faster. The weight of precooled litchi reached 299 kg after 6 h of charging with one-third water of the TES tank. When the TES tank was full of water, the precooling capacity of litchi could exceed 900 kg. As the TES capacity increases, the relative thermal energy loss decreases. Figure 12b shows that the precooling capacity initially increased and then decreased with an increase in litchi load. The precooling rate significantly rose until the litchi load was more than 23 kg. The maximum precooling capacity was 207 kg, and the maximum precooling rate was 94.1 kg/h when the litchi load was 23 kg. With an increase in the single precooling load, the total precooling time decreases, which reduces energy loss in the precooling process, thus increasing precooling efficiency and rate. When the litchi load was the same, the precooling capacity increased. Figure 12c shows that the precooling capacity at 30 L min−1 was higher than other spray flow rates. When the spray flow rate was 50 L min−1, it had the minimum precooling capacity. This is because the cooling capacity stored in the storage box remains constant, and when the spray flow rate is higher, the power of the water pump increases, and the water circulation becomes faster, resulting in an increase in cooling capacity loss. The precooling rate at 50 L min−1 was higher than other spray flow rates, while at 30 L min−1 it had the minimum precooling rate. The precooling capacity and precooling rate for different spray flow rates had a small difference. The higher the flow rate, the more sufficient the contact between cold water and fruits/vegetables, thus accelerating the precooling speed. Due to the small temperature difference in the cold water, the precooling rate does not increase significantly. Overall, the precooling capacity clearly increased with an increase in charging time, and the precooling rate increased along with the litchi load until it reached less than 23 kg.
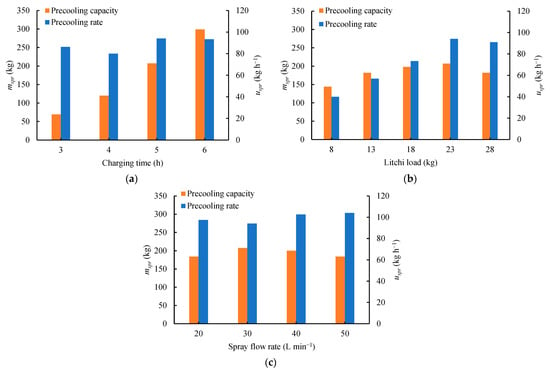
Figure 12.
Variation of precooling capacity and precooling rate under different (a) charging times, (b) litchi loads, and (c) spray flow rates.
5.2.3. Total Power Consumption and Average Power Consumption
Figure 13 shows the total power consumption and average power consumption of litchi spray precooling at different experimental conditions. Figure 13a shows that charging and precooling power consumption increases with charging time, and the power consumption during charging was significantly higher than that during precooling. In contrast, the average power consumption of litchi decreased significantly with increases in charging time. The average power consumption of litchi precooling was 437 kJ kg−1, 349 kJ kg−1, 250 kJ kg−1, and 193 kJ kg−1 for charging times of 3 h, 4 h, 5 h, and 6 h, respectively. The average power consumption can be reduced by increasing the TES capacity within the limits of the hydrocooler capacity. Figure 13b,c shows a few examples of power consumption difference during 4 h of charging in different tests. There was likely an environmental effect under natural conditions. The maximum difference in energy consumption during the charging process was 2.52 × 10⁶ J.
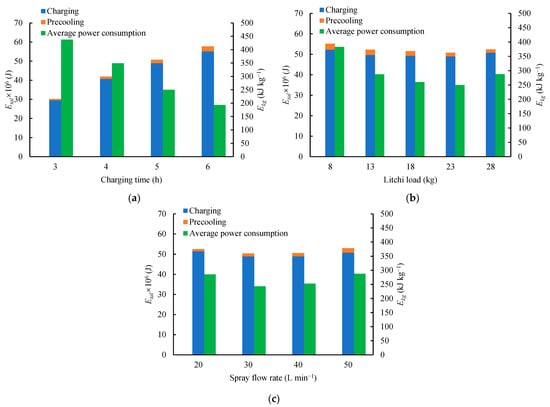
Figure 13.
Variation of total power consumption and average power consumption of spray hydrocooler under different (a) charging times, (b) litchi loads, and (c) spray flow rates.
From Figure 13b, it can be seen that the precooling energy consumption significantly increases with low litchi load and average energy consumption also significantly increases with low litchi load. When the litchi load reaches 8 kg, the maximum average energy consumption is 383 kJ kg−1. The minimum average power consumption is 250 kJ kg−1 when the litchi load is 23 kg. As seen in Figure 13c, the minimum average power consumption of litchi was at a spray flow rate of 30 L min−1, and a 40 L min−1 spray flow rate was a little higher. The average power consumption of 30 L min−1 and 40 L min−1 spray flow rates was 243 kJ kg−1 and 253 kJ kg−1, respectively. The optimal spray flow rate is 30 L min−1 in litchi spray precooling, followed by 40 L min−1.
6. Conclusions
In this study, a novel spray hydrocooler based on TES (thermal energy storage) was developed, manufactured, and tested. A simple mathematical model was used to determine the hydrocooler parameters, including TES capacity, ice-on-coil thermal resistance, and refrigeration system. Litchi spray hydrocooling experiments were conducted at different charging times (3–6 h), spray flow rates (30–60 L min−1), and litchi loads (8–28 kg) with one-third TES capacity, and the following conclusions were drawn:
(1) A theoretical model of direct evaporative ice storage heat transfer was established. The fruit and vegetable spray hydrocooler, designed based on ice coil thermal storage, can convert electrical energy into latent heat storage and release cooling capacity at specific times for precooling fruits and vegetables. The model was validated, and the cooling capacity target was achieved, thus proving the reliability of the heat transfer mathematical model.
(2) The spray precooling equipment can be transported to fruit and vegetable production areas to precool freshly harvested litchi, achieving rapid precooling within 15 min after harvesting. This significantly reduces the precooling time of litchi after harvest and reduces litchi loss. The parameters of the device, including charging times, spray flow rates, and litchi loads, can be adjusted. Different charging times, spray flow rates, and litchi loads were studied to analyse the precooling capacity and precooling rate of litchi. The results showed that charging time was the most important factor influencing precooling capacity and average power consumption. Increasing the charging time effectively increased the precooling capacity and reduced the average power consumption.
(3) The optimal precooling parameters for the device in the litchi precooling process were identified. When the litchi load is 23 kg and the spray flow rate is 30 L min−1, the spray hydrocooler achieves the largest precooling capacity and the smallest average power consumption in litchi spray precooling.
Overall, the precooler provides a feasible solution for precooling litchi in small orchards. Additionally, utilizing the valley value electricity price for TES can significantly reduce operating costs. In the future, improving the energy efficiency of ice-on-coil, the utilization rate of thermal storage tanks, and the cooling uniformity of litchi can further enhance the performance of the spray hydrocooler.
Author Contributions
Conceptualization, H.H. and E.L.; methodology, H.H. and J.G.; validation, H.H.; formal analysis, J.G.; investigation, H.H.; resources, E.L.; writing—original draft preparation, H.H.; writing—review and editing, J.G.; supervision, E.L. and H.L.; project administration, H.H.; project administration, J.G.; funding acquisition, E.L., H.L. and J.G. All authors have read and agreed to the published version of the manuscript.
Funding
This study was funded by the National Natural Science Foundation of China (Grant No. 31971806), the National industrial technology system of litchi and longan Program of China (Grant No. CARS-32-11), the Guangdong Provincial Agricultural Technology Innovation and Promotion Project in 2019 (Grant No. 2023KJ101), the Research and Development and Innovation Team of Common Key Technologies for Agricultural-Product Preservation Logistics (Grant No. 2023KJ145), and the Guangdong Province Agricultural scientific research projects and agricultural technology promotion Program (Grant No. 440000210000000086860). All of this support is gratefully acknowledged.
Data Availability Statement
The data that support the findings of this study are available from the corresponding author upon reasonable request.
Conflicts of Interest
No conflict of interest exists in the submission of this manuscript.
Abbreviation
| Nomenclature | |
| A | Area, m2 |
| c | Specific heat, J kg−1 K−1 |
| C | Latent heat, J kg−1 |
| d | Diameter, m |
| E | Energy consumption, J |
| EER | Energy efficiency ratio |
| Ekg | Average energy consumption of precooling 1 kg of litchi, kJ kg−1 |
| Etal | Power consumption of charging and precooling, J |
| h | Heat transfer coefficient, W m−2 K−1 |
| l | Length, m |
| m | Weight, kg |
| n | Number of precooling batches of litchi |
| N0 | Theoretical energy consumption, W |
| P | Heat load, W |
| P0 | Refrigerating capacity of refrigeration system, W |
| q | Heat load per unit area, W m−2 |
| q0 | Refrigeration capacity per unit mass, kJ kg−1 |
| ql | Density of heat flow rate, W m−2 |
| qm | Mass flow, kg s−1 |
| qV | Refrigeration capacity per unit volume, kJ m−3 |
| Q | Quantity of heat, J |
| Qmax | The maximum TES capacity of TES tank, J |
| Qchr | TES capacity of charging, J |
| r | Radius, m |
| R | Heat conduction resistance, m2 K W−1 |
| t | Time, s or h |
| T | Temperature, °C |
| TES | Thermal energy storage, J |
| u | Precooling rate, kg h−1 |
| vin | Inspiratory specific volume, m3 kg−1 |
| VR | Volume flow rate, m3 s−1 |
| Vth | Theoretical gas transfer volume, m3 |
| w0 | Unit theoretical work, kJ kg−1 |
| ΔT | Temperature difference, °C |
| Greek symbols | |
| α | Power coefficient of water pump |
| β | Volumetric efficiency of compressor |
| λ | Thermal conductivity, W m−1 K−1 |
| δ | Thickness, m |
| ρ | Density, kg m−3 |
| Subscripts | |
| amb | Ambient |
| chr | Charging |
| cic | The contact surface between the ice and coil |
| coi | Evaporation coil |
| com | Comprehensive |
| con | Condenser |
| ctp | The end of charging to the end of precooling |
| cwp | Circulating water pipe |
| eff | Effective TES |
| eli | Energy lost through insulation |
| eva | Evaporator |
| itw | Initial temperature of water |
| itl | Initial temperature of litchi |
| iw | Ice and water |
| ilt | Insulation layer of TES tank |
| ils | Insulation layer of spray precooling box |
| ilc | Insulation layer of circulating water pipe |
| isc | Inner surface of coil |
| iic | Inner surface of insulation layer of circulating water pipe |
| lit | Litchi |
| load | Load of litchi precooling |
| lod | Cooling loss rate caused by opening the door |
| oic | Outer surface of insulation layer of circulating water pipe |
| osc | Outer surface of coil |
| osi | Outer surface of ice |
| otp | Operation of water pump |
| siw | Contact surface between insulation layer and water |
| spr | Spray precooling |
| spb | Spray precooling box |
| src | Contact surface between refrigerant and coil |
| spa | Contact surface between spray precooling box and air |
| sta | Contact surface between TES tank and air |
| tal | Total |
| thb | Thermal bridge |
| tst | TES tank |
| ttl | Termination temperature of litchi precooling |
| ttw | Termination precooling temperature of water |
| wat | Water |
| wpp | Water pump power |
| wpw | Water pump works on water |
References
- Li, H.; Huang, D.; Ma, Q.; Qi, W.; Li, H. Factors influencing the technology adoption behaviours of litchi farmers in China. Sustainability 2020, 12, 271. [Google Scholar] [CrossRef]
- Duan, Y.; Wang, G.B.; Fawole, O.A.; Verboven, P.; Zhang, X.R.; Wu, D.; Opara, U.L.; Nicolai, B.; Chen, K. Postharvest precooling of fruit and vegetables: A review. Trends Food Sci. Technol. 2020, 100, 278–291. [Google Scholar] [CrossRef]
- Bai, X.Y.; Yang, Z.M.; Shen, W.J.; Shao, Y.Z.; Zeng, J.K.; Li, W. Polyphenol treatment delays the browning of litchi pericarps and promotes the total antioxidant capacity of litchi fruit. Sci. Hortic. 2022, 291, 110563. [Google Scholar] [CrossRef]
- Kumari, P.; Barman, K.; Patel, V.B.; Siddiqui, M.W.; Kole, B. Reducing postharvest pericarp browning and preserving health promoting compounds of litchi fruit by combination treatment of salicylic acid and chitosan. Sci. Hortic. 2015, 197, 555–563. [Google Scholar] [CrossRef]
- Makule, E.; Dimoso, N.; Tassou, S.A. Precooling and Cold Storage Methods for Fruits and Vegetables in Sub-Saharan Africa—A Review. Horticulturae 2022, 8, 776. [Google Scholar] [CrossRef]
- Wang, G.; Zhang, X. Evaluation and optimization of air-based precooling for higher postharvest quality: Literature review and interdisciplinary perspective. Food Qual. Saf. 2020, 4, 59–68. [Google Scholar] [CrossRef]
- Zhao, H.; Liu, S.; Tian, C.; Yan, G.; Wang, D. An overview of current status of cold chain in China. Int. J. Refrig. 2018, 88, 483–495. [Google Scholar] [CrossRef]
- de Oliveira Alves Sena, E.; da Silva, P.S.O.; de Araujo, H.G.S.; de Aragão Batista, M.C.; Matos, P.N.; Sargent, S.A.; de Oliveira Junior, L.F.G.; Carnelossi, M.A.G. Postharvest quality of cashew apple after hydrocooling and coold room. Postharvest Biol. Technol. 2019, 155, 65–71. [Google Scholar] [CrossRef]
- Ilknur, A.; Nezihe, K. Forced-air, vacuum, and hydro precooling of cauliflower (Brassica oleracea L. var. botrytis cv. Freemont): Part II. Determination of quality parameters during storage. Food Sci. Technol. 2015, 35, 45–50. [Google Scholar]
- O’Sullivan, J.L.; Ferrua, M.J.; Love, R.; Verboven, P.; Nicolaï, B.; East, A. Forced-air cooling of polylined horticultural produce: Optimal cooling conditions and package design. Postharvest Biol. Technol. 2017, 126, 67–75. [Google Scholar] [CrossRef]
- Zhang, Y.; Guo, M.; Mei, J.; Xie, J. Effects of Different Postharvest Precooling Treatments on Cold-Storage Quality of Yellow Peach (Amygdalus persica). Plants 2022, 11, 2334. [Google Scholar] [CrossRef]
- Zare, M.; Dehghan, H.; Yazdanirad, S.; Khoshakhlagh, A.H. Comparison of the Impact of an Optimized Ice Cooling Vest and a Paraffin Cooling Vest on Physiological and Perceptual Strain. Saf. Health Work 2019, 10, 219–223. [Google Scholar] [CrossRef]
- Yin, J.; Guo, M.; Liu, G.; Ma, Y.; Chen, S.; Jia, L.; Liu, M. Research Progress in Simultaneous Heat and Mass Transfer of Fruits and Vegetables During Precooling. Food Eng. Rev. 2022, 14, 307–327. [Google Scholar] [CrossRef]
- Zhu, Z.; Geng, Y.; Sun, D.W. Effects of Pressure Reduction Modes on Vacuum Cooling Efficiency and Quality Related Attributes of Different Parts of Pakchoi (Brassica Chinensis L.). Postharvest Biol. Technol. 2021, 173, 111409. [Google Scholar] [CrossRef]
- Aroucha, E.M.M.; Araujo, J.M.M.D.; Nunes, G.H.D.S.; Negreiros, M.Z.D.; Paiva, C.A.D.; Souza, M.S.D. Cantaloupe melon (Cucumis melo L.) conservation using hydrocooling. Rev. Ceres 2016, 63, 191–197. [Google Scholar] [CrossRef]
- Garrido, Y.; Tudela, J.A.; María, I.G. Comparison of industrial precooling systems for minimally processed baby spinach. Postharvest Biol. Technol. 2015, 102, 1–8. [Google Scholar] [CrossRef]
- Liang, Y.S.; Wongmetha, O.; Wu, P.S.; Ke, L.S. Influence of hydrocooling on browning and quality of litchi cultivar Feizixiao during storage. Int. J. Refrig. 2013, 36, 1173–1179. [Google Scholar] [CrossRef]
- Zainal, B.; Ding, P.; Ismail, I.S.; Saari, N. Physico-chemical and microstructural characteristics during postharvest storage of hydrocooled rockmelon (Cucumis melo L. reticulatus cv. Glamour). Postharvest Biol. Technol. 2019, 152, 89–99. [Google Scholar] [CrossRef]
- Zainal, B.; Ding, P.; Ismail, I.S.; Saari, N. H NMR metabolomics profiling unveils the compositional changes of hydro-cooled rockmelon (Cucumis melo L. reticulatus cv glamour) during storage related to in vitro antioxidant activity. Sci. Hortic. 2019, 246, 618–633. [Google Scholar] [CrossRef]
- Tao, Z. Difficulties and countermeasures of the circulation of litchi in Guangxi. Manag. Technol. Small Medium Sized Enterp. 2017, 11, 45–46. [Google Scholar]
- Yang, C.; Lee, F.W.; Cheng, Y.J.; Chu, Y.Y.; Chen, C.N.; Kuan, Y.C. Chitosan coating formulated with citric acid and pomelo extract retards pericarp browning and fungal decay to extend shelf life of cold-stored lychee. Sci. Hortic. 2023, 310, 111735. [Google Scholar] [CrossRef]
- Gan, L.; Chen, M.; Lv, E. Effect of different precooling methods on litchi precooling. Mod. Agric. Equip. 2020, 41, 8–13. [Google Scholar]
- Alva, G.; Lin, Y.X.; Fang, G.Y. An overview of thermal energy storage systems. Energy 2018, 144, 341–378. [Google Scholar] [CrossRef]
- McKenna, P.; Turner, W.J.N.; Finn, D.P. Thermal energy storage using phase change material: Analysis of partial tank charging and discharging on system performance in a building cooling application. Appl. Therm. Eng. 2021, 198, 117437. [Google Scholar] [CrossRef]
- Li, X.; Wu, W.; Li, K.; Ren, X.; Wang, Z. Experimental study on a wet precooling system for fruit and vegetables with ice slurry. Int. J. Refrig. 2022, 133, 9–18. [Google Scholar] [CrossRef]
- Lin, H.M.; Deng, S.G.; Huang, S.B.; Guo, H. Effects of Precooling with Slurry Ice on the Quality and Microstructure of Anglerfish (Lophius americanus) Liver. J. Food Process Eng. 2016, 39, 3–10. [Google Scholar] [CrossRef]
- Zhang, R.; Cheng, Z.; Ding, F.; Hua, L.; Fang, Y.; Han, Z.; Shi, J.; Zou, X.; Xiao, J. Improvements in chitosan-based slurry ice production and its application in precooling and storage of Pampus argenteus. Food Chem. 2022, 393. [Google Scholar] [CrossRef]
- Jia, Y.; Liu, Y.; Sun, S.; Li, H.; Jiao, L. Refrigerating characteristics of ice storage capsule for temperature control of coal mine refuge chamber. Appl. Therm. Eng. 2015, 75, 756–762. [Google Scholar] [CrossRef]
- Biosca-Taronger, J.; Payá, J.; López-Navarro, A.; Corberán, J.M. Ice formation modelling around the coils of an ice storage tank. In Proceedings of the 6th European Thermal Sciences Conference, Poitiers, France, 4–7 September 2012; Institute of Physics Publishing: Bristol, UK, 2012; Volume 395. [Google Scholar]
- Liu, R. Experiment Research and Numerical Simulation of Heat Pipe Ice Storage; East China Jiaotong University: Nanchang, China, 2011. [Google Scholar]
- Ye, S.; Chen, G.; Chen, L.; Xing, J. Influence of freezing thickness on heat transfer resistance of ice-on-coil, iceball and metal-cored iceball. Cryogenics 2001, 6, 62–65. [Google Scholar]
- Li, P. Study on the Heat Transfer Characteristics of the Refrigeration Fluoroethane (HFC-161) Flow Boiling Inside Tubes; Zhejiang University: Hangzhou, China, 2013. [Google Scholar]
- Wu, S.M.; Fang, G.Y.; Chen, Z. Discharging characteristics modeling of cool thermal energy storage system with coil pipes using n-tetradecane as phase change material. Appl. Therm. Eng. 2012, 37, 336–343. [Google Scholar] [CrossRef]
- Jin, W.; Lu, H. Refrigeration Technology; Mechanical Industry Press: Beijing, China, 2009. [Google Scholar]
- Wang, H. Estimation of Thermal Properties of Lychee. J. Shenzhen Polytech. 2006, 3, 23–26. [Google Scholar]
- Yang, S.M.; Tao, W.Q. Heat Transfer, 4th ed.; Higher Education Press: Beijing, China, 2006. [Google Scholar]
- Mehmet, A.E.; Aytunç, E. Ibrahimdincer. Energy and exergy analyses of an ice-on-coil thermal energy storage system. Energy 2011, 36, 6375–6386. [Google Scholar]
- Ogawa, N.; Kaneko, F. Experiment and mathematical model for the heat transfer in water around 4 °C. Eur. J. Phys. 2017, 38, 025102. [Google Scholar] [CrossRef]
Disclaimer/Publisher’s Note: The statements, opinions and data contained in all publications are solely those of the individual author(s) and contributor(s) and not of MDPI and/or the editor(s). MDPI and/or the editor(s) disclaim responsibility for any injury to people or property resulting from any ideas, methods, instructions or products referred to in the content. |
© 2023 by the authors. Licensee MDPI, Basel, Switzerland. This article is an open access article distributed under the terms and conditions of the Creative Commons Attribution (CC BY) license (https://creativecommons.org/licenses/by/4.0/).