Abstract
One of the primary objectives of transportation engineering is to increase the safety of road infrastructure. This study seeks to determine the relationship between geometric design parameters in relation to road accident criteria based on accident hotspots on Jordan’s Desert Highway. The road accident data (from 2016 to 2019) were collected from the Jordan Traffic Department. The spatial pattern of hotspots was identified using a GIS tool named Getis-Ord Gi* based on the severity index of road accidents. A topographic survey was conducted to investigate the road alignment and intersections at hotspot locations. The study utilized the Structural Equation Modeling (SEM) technique via SmartPLS to highlight the correlation between geometric designs in relation to road accidents. The hotspot analysis (Gits-Ord Gi) discovered 80 road accident hotspots along the highway. The study found that horizontal alignment and road intersections significantly impact road accidents in hotspot locations. Furthermore, vertical alignment has no effect on road accidents in hotspot areas. The study enhanced the comprehension of the factors associated with road geometrics and intersections that affect the occurrence of road accidents.
1. Introduction
The growing number of road accidents has a significant impact on the road safety, sustainability, and socioeconomic development of countries [1]. the World Health Organisation’s report in 2021, approximately 1.3 million individuals are involved in road accidents annually, with 90% of fatalities occurring in countries categorized as low- and middle-income [2]. Road safety analysis has emerged to assist local authorities in implementing appropriate measures to reduce the number of road accidents [3,4].
Highway 15 in Jordan (also known as the Desert Highway connecting Aqaba to Amman, 420 km) is a South–North link that receives 1,825,000 million vehicles per year. The desert highway recorded 107 fatal accidents in 2019 [5]. The alarming increase in road accident deaths and injuries in recent years has led to the identification of road accident hotspots. Therefore, accident route identification is a critical step toward total road safety improvement. This can be achieved via hazard metric assessment for accident hotspots, marking them for further investigation and improvement [6].
In the context of road safety, a cost-benefit analysis primarily examines the benefit of higher security or decreased risk [7]. Improving road safety can provide significant economic benefits to Jordanians. Several economic gains can be realized by reducing the number of road accidents, injuries, and fatalities. Here are a few ways that improved road safety can benefit the Jordanian community: lower healthcare costs, enhanced tourism and investment, increased productivity, and lower vehicle repair costs. A total of 161,511 road accidents were recorded in 2019, resulting in 633 fatalities and 17,013 injuries, with an estimated total loss equivalent to $456.99 million US dollars [8].
According to many studies [9,10,11,12,13,14], Zhao et al. (2021), AlKheder et al. (2022), Galante et al. (2022), Gargoum et al. (2022), Khedher and Yun (2022), and Macedo et al. (2022)), bettering road design is the only way to increase road safety and decrease the frequency and severity of accidents. Jordan is one of the developing countries that is facing a high number of road accidents. Furthermore, the roads in Jordan experience serious geometric design problems [15,16].
A “hotspot” (also known as a black spot) is the category assigned to a road location that has recorded high numbers of accidents compared to other locations [17,18,19,20,21,22]. Generally, accident-prone location(s) will be identified during the initial phase of the road safety management process. The identification of road accident hotspots is a systematic method for identifying road segments with a high accident risk that exceeds the standard limit of road safety [21,22]. The GIS software is a large geographic database and is a useful tool to determine hotspots. It can visualize accident locations (mapping) and run spatial analysis (spatial clustering) on traffic accidents [23,24,25,26,27].
Despite the fact that the aforementioned studies drew attention to clusters of road accidents, they did not conduct statistical significance tests to analyze their spatial distribution. In this context, very few studies have attempted to comprehend the spatial distribution of road accidents in Jordan, even though there is a great deal of accident data [28,29]. In many previous studies, road accident counts were frequently used to assess a position’s safety issues [25,30,31]. Prior studies have indicated that the absence of a severity index for road accidents poses a challenge in discerning the occurrence of a high or low cluster. There is a consensus that accidents of a more severe nature are accorded greater significance in the determination of accident hotspots, as per accident expenditures. In order to identify hotspot locations, it is recommended to assign weights based on the severity index, as suggested by [32,33].
Although previous studies highlighted the effects of geometric design and intersections on road safety, they focused on some geometric parameters; for example, the radius of horizontal alignment [34,35]. Few studies have explained the factors which influence accident occurrence at road hotspots [36]. The studies also focused on the regression model and did not use SEM to explain the relationship. Furthermore, studies have explained the methods of improving vertical alignment to increase road safety, but have not investigated the extent of their impact on road safety [37,38].
The objectives of the study are to identify the road accident hotspots on Jordan’s Desert Highway and to determine the relationship between geometric design parameters in relation to road accident criteria based on accident hotspots on Jordan’s Desert Highway.
Here, we used SEM analysis to investigate the relationship between geometric design, including horizontal alignment, vertical alignment, and intersections with road accidents, at hotspots on Jordan’s Desert Highway between 2016 and 2019. These findings lay the groundwork for geometric engineers to improve road infrastructure safety.
2. Literature Review
2.1. Road Accident Hotspots
The spatial clustering of hotspots can be mapped in point forms using statistical mapping approaches (tools or programs in the GIS), such as K-means [39], Moran I Incremental Spatial Autocorrelation Method [40,41,42] Statistics on Getis Ord Gi [43,44,45,46,47,48,49,50,51,52] and Kernel Density Estimation (KDE) [45,53,54,55,56].
In their study, Manap et al. [57] utilized Getis-Ord Gi* to detect 25 hotspots along the North–South Expressway in Kuala Lumpur. The study was based on a case analysis spanning from 2016 to 2019 which encompassed over 47,359 accidents. Sixty-four percent of the total hotspots were located at exit ramps, existing interchanges, rest areas, or slip roads, which had a total of 16 hotspot locations. The study found that accident hotspots occurred when traffic flow was disrupted. Bil et al. [39] identified the road accident hotspots using Getis-Ord Gi* from another perspective. Between 2010 and 2018, a total of 55,296 road accidents were analyzed in rural sections of the primary roads (3933 km) of the Czech road network. The road network’s length was found to be covered with identified road accident hotspots, ranging between 6.8% and 8.2%. The proportion of road accidents occurring in hotspots exhibited a consistent trend of approximately 50% over an extended period. Spatiotemporal crash patterns were examined, and three types of hotspots were discovered: those that emerge, those that persist, and those that vanish. Only 100 hotspots exhibited stability throughout the complete nine-year duration.
Choudhary et al. [58] compared statistical techniques in the town of Varanasi using five years of accident data (2009–2013). Using Getis Ord Gi*, Kernel Density Estimation, and Moran’s I, the spatial clustering of road accidents and the spatial densities of hotspots were analyzed. With a variety of severity grading systems, this approach assessed the impact of minor and property-damage-only accidents on overall outcomes. The z-value, which is associated with statistical significance, was used to rank hotspots using Gi*. Based on pixel values collected from various locations, K was used to rank hot spots. The hot spot analysis results identified specific road segments and intersections with a high concentration of hotspots. The study conducted by Rahman et al. [47] investigated the incidence of fatal road accidents in Bangladesh through the utilization of a novel newspaper-based approach that employed grids to establish a comprehensive database of road traffic fatalities. The Getis-Ord Gi* was employed to delineate spatiotemporal hotspots and trends. The results indicate discernible trends in road accident occurrences between urban and rural regions of Bangladesh, with Dhaka and Sir Ajganj in the northern part of the country exhibiting elevated incidence rates.
The study conducted by Hazaymeh et al. [29] investigated the temporal and spatial patterns of traffic accidents in Irbid Governorate over a period of five years, from 2015 to 2019, based on available data. The study utilized the Global Moran I index and hotspot analysis (Getis-Ord Gi*) techniques in ArcGIS to identify the road accident hotspots. The research findings revealed a significant rise of 38% in a year-on-year comparison. The analysis of severe road accidents led to the identification of hotspot locations. The Irbid Governorate’s internal road network, which has the area’s highest traffic volume, was found to be the primary site of minor road accidents. The research used Getis-Ord Gi* and spatial autocorrelation at 90% and 95% confidence intervals to identify a clustering trend among arterial and internal road network segments.
The National Highway (NH-66) in Alappuzha, Kerala, India, is an 8 km flat stretch. To begin, accident data from the NHAI office and the police station in the area above was gathered. The data were then analyzed using the severity index. The severity index method was used to pinpoint the location of the hotspot. Short-term and long-term measures were implemented depending on the severity of the accident. After considering short-term steps, a total of ten hotspots and estimates of their locations were discovered [59].
A recent study conducted by Al-Rousan et al. [60] aimed to investigate the characteristics of distracted-driving accidents on countryside and suburban roads in Jordan. The researchers utilized independent sample t-tests and descriptive analysis to analyze the data. However, the spatial dimension of traffic accidents was ignored in these analyses. To date, there have only been a handful of studies that have attempted to map out where exactly in Jordan car accidents tend to occur. The study conducted by Alkhadour et al. [28] employed the nearest neighbor index analysis to examine road accidents recorded in Amman, Jordan. The findings of the study suggest the existence of spatial aggregation and recurrent occurrences of vehicular collisions within the analyzed area. The findings of the study confirm that regions with a notable frequency of vehicular collisions were primarily clustered in residential, commercial, and industrial areas located within and near the central regions of the examined locality.
2.2. Road Geometric and Road Safety
Alghafli et al. [61] conducted a study with the aim of examining how conditions of geometric roads affect safety performance indicators, including severe accidents and property damage. The researchers utilized a negative binomial regression model in order to attain this objective. According to the research findings, a considerable number of collisions and incidents of disregarding traffic signals occur at intersections where minor streets intersect with three or four major roads. One potential solution to address this issue involves the expansion of the number of lanes on minor streets, thereby transforming them into major streets. Consequently, the minor street’s capacity to manage augmented traffic originating from major streets experiences a substantial enhancement. The results indicate that the velocity of traffic is a significant factor in the decline of safety outcomes observed at these intersections.
Islam et al. [62] have studied various factors that can influence the frequency of accidents. These factors include sight distance, the number of lanes, median width and type, superelevation, shoulder and lane width, gradient, horizontal and vertical alignment, and curve radius. The absence of a reliable methodology for assessing the correlation between road geometric design and safety, coupled with the interaction between geometric design components and other contributing factors, has led to an increased incidence of traffic accidents.
The study conducted by Jung et al. [63] was a quantitative investigation aimed at assessing the adequacy of Korea’s primary road safety policy and identifying additional measures necessary for freeway sections featuring combinations of vertical and horizontal curves. The severity of cluster-based crashes was determined by using binomial logic regression and K-means clustering to analyze the effects of causal factors. Consequently, six models for predicting crash severity were developed using cluster analysis. One cluster contained information on the action, driver age, traffic management parameters, and crash prevalence, which was compared to the entire data model. The results indicate that a multi-directional approach to main road safety policies is necessary, particularly with regard to curve alignment possibilities, in order to improve current policies.
Garnaik [64] studied 70 km of roads and found that geometric elements of road alignment, such as superelevation, radius, K-value, distance/visibility of sight and vertical gradient, are very significant in causing accidents on both plain and rolling roads as well as mountainous and steep terrain. Meanwhile, the horizontal arc length, deflection angle, vertical curve length, and rate of change of superelevation are insignificant to accidents on both the highway and mountainous and steep terrain. The study conducted by Lin et al. [65] employed a regression model to examine road accidents occurring at intersections during the period spanning from 2018 to 2019. It was found during the observation period that 68% of the surveyed three-way intersections had no recorded incidents of traffic accidents. Consequently, the research employs zero-inflated models to construct a framework that discerns noteworthy factors that impact the gravity of vehicular collisions at three-way intersections. The findings of the study suggest the presence of two discrete classifications of factors that impact the likelihood of vehicular collisions at three-way intersections. The initial classification pertains to the dimensions of the provincial road, encompassing the width of the dividing line, the expanse of the shoulder, and the number of lanes. The subsequent classification pertains to the availability of amenities such as convenience shops, supermarkets, petrol stations, and other points of interest, including public retail markets, at the intersection. Roshandeh et al. [31] conducted an investigation into the impact of environmental, traffic, intersectional geometric, and pavement-related factors on the total number of collisions occurring at intersections. The study utilized a Poisson model with random parameters to examine collision data collected from 357 signalized intersections located in Chicago during the period spanning from 2004 to 2010. The findings suggest that the examined variables, specifically the standard of pavement, unilluminated intersections, and the quantity of traffic during the evening rush hour, exert the most notable influence on the frequency of collisions. The results indicate that it is crucial to prioritize the adequate maintenance of pavements and appropriate illumination of intersections to effectively promote safety measures pertaining to highways at intersections.
Retallack and Ostendorf [66] demonstrated the relation by analyzing accidents at 120 intersections in Adelaide, Australia. Among more than five million hourly measurements, a dataset of 1629 accidents involving motorized vehicles was discovered. The effects of rainfall were also studied. The correlation between accident frequency and traffic volume was essentially linear for lower traffic volumes, according to the findings. Poisson and negative binomial models exhibited a robust quadratic explanatory component as accident frequency increased at a faster rate with increasing traffic volume. In Abu Dhabi, Alghafli at al. [61] carried out a study using a negative binomial regression model. The study aimed to identify the influence of geometric design conditions, such as the number of lanes in three-leg, four-leg, and other intersection types, on severe accidents, red light violations, safety performance indicators, and property damage. The study indicates that most accidents and traffic light violations take place at intersections with three or four legs where minor streets intersect. Expanding the number of lanes on the minor streets could be a potential solution to this issue, which would effectively transform them into major streets.
In order to ascertain the correlation between road alignment, road geometry, traffic conditions, and crash frequency, Kronprasert et al. [67] developed accident prediction models for two-lane rural horizontal curve segments. According to the research, lane width is more crucial than traffic volume, curve radius, and curve type in determining accident frequency. Musa et al. [68] also discovered these issues with accident severity by using databases from the public works and police departments, which contained 1067 cases of varying degrees of severity recorded on Malaysian roads between 2008 and 2015. Nine different variables were examined and developed into an ordered regression model for the severity of accidents using these records. The findings showed that poor horizontal alignment had an impact on the model’s predictions. In comparison to the absence of such factors, the probability of a more severe accident caused by bad horizontal alignment was correspondingly about 0.4 times lower.
The combination of a horizontal curve and a gentle slope on a mountain highway increases safety, whereas combinations of a horizontal curve and a steep slope or a vertical curve and a horizontal curve increase the risk of an accident. When the concave vertical curve and horizontal curve are combined, the risk is marginally lower than when horizontal curves and convex vertical curves are combined. In mountainous areas, it is advantageous to control vertical slopes and lessen the intersection of vertical curves and horizontal vertical curves [69].
The Intersection is the most prevalent location for vehicle accidents. Intersections on single-level highways are among the most hazardous locations for vehicle accidents Alghafli at al. [61]. From the traffic accident database of Harbin, 1758 valid intersection accident samples and nine categories of features were taken in order to study the spatial distribution patterns of traffic accidents at urban road intersections and identify the critical factors affecting the severity of accidents. The findings demonstrate that the severity, intersection density, and road network density all affect how intersection accidents are distributed spatially. For each of the three types of areas, significant factors include the type of accident, the time of day, and the type of intersection [70].
3. Methodology
3.1. Location
The study was carried out on Jordan’s Desert Highway, which is a rural two-way lane (as shown in Figure 1). Starting from Amman, the road heads towards the southeast and reaches Aqaba while passing through the desert located to the east of Jordan’s main settlements. The total distance covered is 420 km. This stretch of road is situated between the latitude of 30.229744° and longitude of 35.737738°, and the latitude of 31.777348° and longitude of 35.931412°. The Desert Highway has four main interchanges and no tolls.
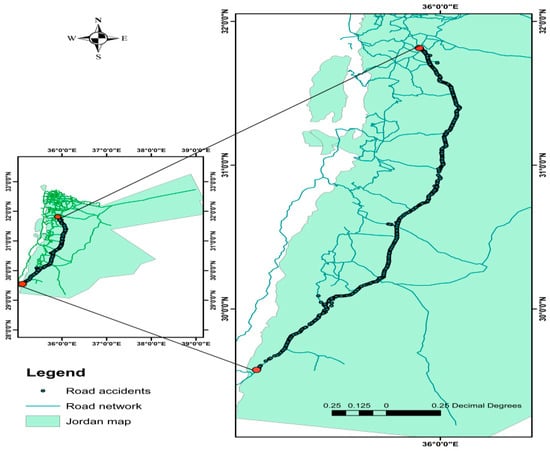
Figure 1.
Jordan’s Desert Highway.
3.2. Data Preprocessing
Figure 2 shows a flow diagram of the study process. The road accident data collected from the Jordan Traffic Department for the last four years between 2016 and 2019 are shown in Figure 3. The data contains the parameters of the accident and the coordination locations, including the latitude and longitude. Figure 3a depicts the frequencies and proportions of fatal accidents (an injury that typically results in death within one month, either directly or as a result of complications). The highest frequency was recorded in 2017 with 120 (29.85%) fatal accidents, followed by 105 (26.12%) fatal accidents in 2019. Meanwhile, the lowest frequency was recorded in 2016 with 86 (21.39%) fatal accidents, followed by 91 (22.64%) fatal accidents in 2018. Figure 3b depicts the frequencies and percentages of major injuries (injuries that necessitate specialized medical interventions, either inside or outside of the hospital, such as surgery or treatment of bone fractures or nerve injuries, which include cases of head injuries and loss of consciousness). In 2019, the highest frequency of major injuries was recorded at 114 (38.13%). This was followed by 95 (31.77%) injuries in 2018. Hence, the lowest frequency of major injuries was recorded at 36 (12.04%) in 2017, followed by 54 (18.06%) in 2016. Figure 3c shows the frequencies and percentages of minor injuries (any injury sustained in a traffic accident, including minor injuries and bruises, as well as hospitalization for less than 24 h). The highest frequency of minor injuries was recorded in 2018 with 684 (30.17%) injuries. This was followed by 566 (26.35%) injuries in 2017. Meanwhile, the lowest frequency was recorded at 386 (17.97%) in 2019, followed by 548 (25.51%) in 2016. Moreover, the lowest frequency of property damage (as physical damage to tangible property, such as car damage from a car accident) was detected with 1589 (27.36%) in 2018, as shown in Figure 3d, followed by 1482 (25.52%) in 2017. Meanwhile, the lowest frequency was recorded at 1307 (25.50%) in 2019, followed by 1430 (24.62%) in 2016.
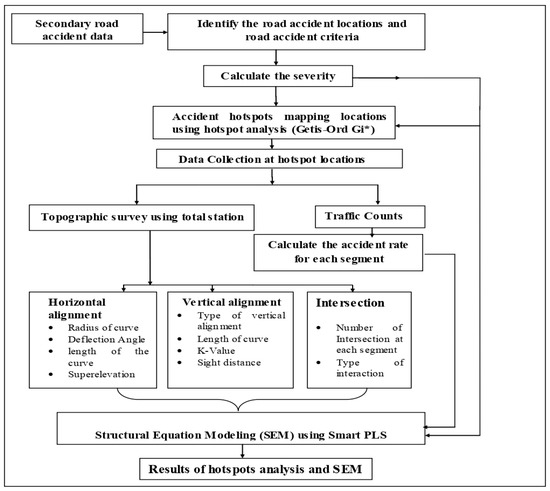
Figure 2.
A flow diagram of the study process.
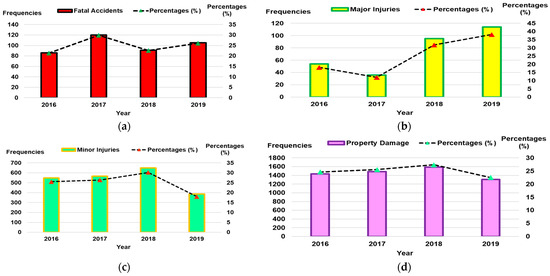
Figure 3.
Road accidents from 2016 to 2019: (a) Fatal accidents, (b) Major injuries, (c) Minor injuries, (d) Property damage.
The spatial analysis started by exporting the value of road accidents to ArcGIS. The base map tool was used to visualize the data in ArcGIS 10.7. The entire data set of the application was converted into 30 UTM-ED50 coordinates. The road accidents were represented using latitude and longitude coordinates based on their locations. The data were converted into a spatial characteristic representation using ArcCatalog’s Data Management tools. The shapefiles containing the accident data were organized for use with ArcGIS applications. As a result, the shapefile has undergone modifications. The severity index values were calculated based on the weights of severity at accident locations along Jordan’s Desert Highway from 2016 to 2019. Jordan’s Ministry of Housing and Public Works employed a weightage system that was derived from a manual for identifying accident hotspots and promoting road safety. An incident resulting in at least one fatality is assigned a value of 3 points, whereas incidents involving injury and property damage are assigned values of 1 and 0.33 points, respectively, as indicated in Equation (1) [71].
A traffic count was conducted for 48 h in March 2019 based on the hotspot locations along the Jordan Desert Highway. There were many vehicles on the sites that were difficult to count manually. The vehicles were counted using the video camera. The rate of accidents was calculated using Equation (2) from the Federal Highway Administration [72]. This calculation was based on the Average Daily Traffic (ADT) obtained from traffic count, the number of accidents that occurred between 2016 and 2019, and the length of each segment.
where; A = number of road accidents from 2016–2019
N = number of years (four years for this study)
ADT = Average Daily Traffic (from traffic count)
L = the length of the road
The collection of road geometric data includes horizontal and vertical alignments and intersections, and began with a topographic survey that was conducted using Total Station equipment. The survey was conducted at locations that were hotspots where horizontal alignments, vertical alignments, and intersections could be obtained. The 3D features for horizontal and vertical alignments include latitude, longitude, and elevation points. The data were exported to Civil 3D, from which it was extracted. The horizontal and vertical alignment elements in Figure 4 depict a section of the Jordan Desert Highway after exporting the road data to Civil 3D. The characteristics of each hotspot location’s horizontal alignment elements, including the intersection angle, the radius of the curve, superelevation, and the length of the curve, were used for future analysis. In addition, elements of vertical alignments, such as the length of the curve, K-value, sight distance, and the type curve, were used for analysis in the future.
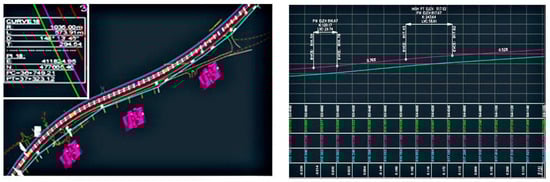
Figure 4.
An example from Civil 3D for horizontal and vertical alignment.
3.3. Hot Spot Analysis: Getis-Ord Gi*
The Getis-Ord Gi* was used to conduct hotspot analysis in order to identify the road accident hotspots’ location based on the p-value, z-value, and Gi* function. Gi* is a highly reliable geostatistical technique that can be used to map clusters and identify statistically significant hotspots. Hotspot analysis successfully sets up necessary measures in places with one or more clustering patterns, such as road accidents. It helps to comprehend the likely reasons for those clustering patterns and to visualize the cluster locations and geographic range. The tool computes the Gi* metric for each feature present in a given dataset. The spatial clustering of elements exhibiting high or low p-values and z-scores is subsequently determined.
The p-value stands for probability, meaning the probability that the observed spatial pattern resulted from a random process as determined by pattern analysis instruments. Once the p-value is extremely small, the null hypothesis is rejected because it is highly improbable that the observed spatial pattern resulted from random processes. Each feature is classified as a statistically significant hotspot if it exhibits a high value and is encompassed by other features with high values. Prior to conducting the spatial analysis, a confidence level was therefore determined. The levels of confidence in this research were 90%, 95%, or 99%. A statistically significant z-score is computed when the local sum of the characteristic and its neighbors deviates from the anticipated local sum by an amount that is not clarified by chance. Gi* is a z-score statistic; the greater the z-score (positive z-score), the denser the clustering of high values; the smaller the z-score, the reverse. The lower the z-score, the more low-value clustering (negative z-score).
The analysis utilizing Getis-Ord Gi* commenced with a null hypothesis pertaining to accident severity index and spatial distribution, and complete spatial randomness with regards to accident severity index within the study area. Thus, it is feasible to ascertain whether to reject the null hypothesis, establish the level of confidence, and compute the z-scores and p-values for the index of accident severity. The user executed a spatial join operation to consolidate the accident severity indices that were associated with individual road segments. At present, it is feasible to generate a novel attribute field for the layer of the road network. The aforementioned field denotes the severity index of accidents that occurred on a specific segment of a roadway. The input of this attribute field was subsequently used to compute the hotspot function, specifically the Getis-Ord Gi. The spatial relationship conceptualization was calculated using a fixed threshold distance of 1 km. A hotspot analysis (Getis-Ord Gi*) and detection of hotspots for road accidents was executed. The statistical formula for determining Gi* is given in Equations (3)–(5) [73]:
where, is the weight between accident features i (first location) and j (second location), xj is the attribute value of feature j (accident severity index), Gi* is a z-score statistic, is mean value, S is standard deviation, and n is the total features number.
3.4. Structural Equation Modeling (SEM)
SEM is a statistical method that is utilized for examining and evaluating multivariate causal relationships [74,75]. SEM SEM is distinct from other modeling techniques in that it explores the direct and indirect effects on causal relationships that have already been established [76,77]. SEM is becoming increasingly popular for investigating transportation and road safety issues. Some researchers have used SEM in the field of road safety [78,79].
The objective of SEM in this study is to investigate the relationship between road geometry, including horizontal alignment and vertical alignment, and the intersections with road accidents on Jordan’s Desert Highway. SEM can interpret the correlation through a structural model, demonstrating the interrelationship between the indicators and latent variables. In this study, the model is developed as a reflective–formative model because the indicators fully determine the “latent” construct. The model’s structure consists of three independent latent variables, which are: horizontal alignment, vertical alignment, and intersection. These are linked to a single dependent variable, road accidents. The theory is represented by latent variables (factors) in SEM, while data from measures (indicators) are fed into statistical studies to demonstrate the connections between latent factors. As the study focuses on forecasting, Partial Least Squares (PLS) is the ideal method for developing SEM [80].
Thirteen indicators from the evaluation were assessed for their factorability and extracted as latent variables. Next, the researchers applied Exploratory Factor Analysis (EFA). Horizontal alignment, vertical alignment, and intersections were the categories into which the latent variables were classified. Ten screened indicators were repeated as indicators for these three latent variables. All latent variables were evaluated for validity and reliability by assessing the measurement model for the model. Regarding road accidents, there exist three indicators, namely accident rate, fatalities, and severity index. The structural model evaluation was then applied to the model. Table 1 displays the constructed model’s definitions. Four measurement models with four latent variables are incorporated into the proposed model. Each latent variable contains multiple indicators. Nevertheless, the measurement model for the latent variable road accidents contains a formative construct for the indicators. The other measurement model, meanwhile, is based on a reflective construct. The Goodness of Fit of the Model (GoF) criteria were also used for determining whether values of GoF were no fit (less than 0.1), small (0.1–0.25), medium, (0.25–0.36) or large (more than 0.36) enough to be considered as a globally valid PLS model [81]. Figure 5 depicts the concept model of SEM-PLS analysis for this study.

Table 1.
Definition of the latent variables and the indicators.
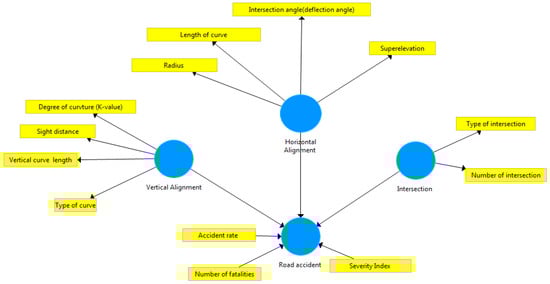
Figure 5.
Conceptual model of SEM.
In relation to the previously discussed construct definitions, the following hypotheses were proposed;
Hypothesis 1 (H1).
Horizontal alignment indicators have a significant effect on road accidents.
Hypothesis 2 (H2).
Vertical alignment indicators have a significant effect on road accidents.
Hypothesis 3 (H3).
Intersection indicators have a significant effect on road accidents.
4. Results and Discussions
4.1. Hotspots Analysis Results
Hotspot analysis (Getis Ord Gi*) was used based on the severity index related to each place where road accidents occurred. Gits-Ord Gi* was utilized for identifying spatial clusters of high (hotspots) that are statistically significant. The map of road accident hotspots was generated using the results of the hotspot analysis. For each accident severity index, Gits-Ord Gi* generates a new output feature class that includes a z-score, p-value, and confidence level bin field (Gi Bin).
The analysis discovered 80 hotspots for road accidents along the Desert Highway. Table 2 shows Gits-Ord Gi* output and severity index for the most severe road accident hotspots on the Jordan Desert Highway. The results showed that accident hotspots were with a severity significant impact on the occurrence of accidents, with p-value > 0.001, p-value > 0.05, and p-value 0.10 for each hotspot, z-value < 2.58, z-value < 1.96, and z-value < 1.65, and G-bin were 1 (90% confidence level), 2 (95% confidence level), and 3 (99% confidence level). The severity index between 10 and 79 is shown in the table, and all points within the range have statistical significance in causing road accidents at a confidence level ranging from 90 to 99%. The severity index was classified into three categories: low (1–30), medium (31–60), and high (>60).
Table 2.
Gits-Ord Gi* output, and locations of the most severe road accident hotspots on Jordan’s Desert Highway.
Figure 6 shows a spatial map of road accident hotspots created with Getis Ord Gi. The analysis identifies 80 accident hotspots along the Jordan Desert Highway. The map identifies the points on the map that are statistically significant for causing accidents as hotspots with a confidence level of 99% (Gi-bin = 3), 95% (Gi-bin = 2), and 90% (Gi-bin = 1).
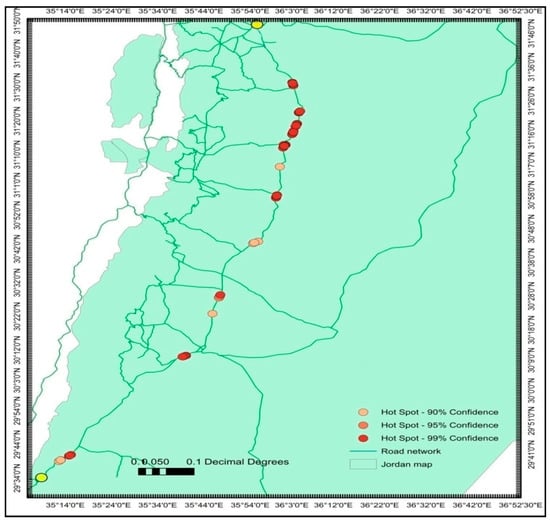
Figure 6.
The spatial map of road accident hotspots along the Jordan Desert Highway.
4.2. SEM
The study used the SEM analysis method, employing partial least square (PLS) techniques through smartPLS. The aim was to highlight the correlation between alignment and intersection with road safety. The study was conducted on 80 hotspot locations along Jordan’s Desert Highway.
4.2.1. Exploratory Factor Analysis (EFA)
The present section outlines the outcomes of the factor analysis conducted prior to the formulation of the Structural Equation Model. Exploratory Factor Analysis (EFA) was used to extract the relationships observed between the variables. Removing indicators with unacceptable loadings that have an impact on the SEM model’s fitness is a crucial step. Items that had a factor loading of less than 0.6 were eliminated.
Initially, the factorability of the four horizontal alignment indicators was investigated. Based on Table 3, the Kaiser–Meyer–Olkin (KMO) measure of adequacy for horizontal alignment was 0.767, which exceeded the threshold value of 0.6. This indicates that all indicators of horizontal alignment were suitable for analysis. The value of the KMO measure of sampling adequacy for vertical alignment indicators was mediocre, but still acceptable since it exceeded the minimum value of 0.6 (0.610). The KMO measure of the sampling adequacy for intersection indicators was high (0.828), exceeding the acceptable value of 0.6. Furthermore, the KMO measure of sampling adequacy for road accident indicators was high, with a value of 0.782, exceeding the acceptable threshold of 0.6.
Table 3.
KMO test for all latent variables.
Four factors were generated based on Table 3 to represent four important variables: horizontal alignment, vertical alignment, intersection, and road accident. Based on the results of EFA as shown in Table 4, one indicator was removed for the horizontal alignment variable, and three indicators were retained. Indicators with factor loadings lower than 0.6 were discarded due to weak relationships with the extracted factors. The discarded indicators were the length of the curve and the intersection angle of the curve. Indicators that had factor loadings greater than 0.6 were deemed to have a significant correlation with the extracted factors. Therefore, these three indicators were used to test the reliability and validity of the construct. To achieve vertical alignment, it is necessary to follow the required factor loading value of more than 0.6. One indicator was removed, and three indicators were retained. Indicators with factor loadings lower than 0.6 were discarded due to weak relationships with the extracted factors. Of the various indicators, the type of curve was discarded. Indicators that had factor loadings greater than 0.6 were deemed to have a significant correlation with the extracted factors. Therefore, these three indicators were used to conduct tests for the reliability and validity of the construct.
Table 4.
EFA results of Latent Variables.
The intersection indicators’ factor loadings were greater than 0.6, indicating a significant correlation with the extracted factors. These indicators, including the type of intersection, were used to proceed with the construction of reliability and validity tests. Three indicators were retained for road accidents, based on the required factor loading value of more than 0.6. Indicators that had factor loadings greater than 0.6 were deemed to have significant correlations with the extracted factors. Therefore, these three indicators were used to conduct reliability and validity tests.
4.2.2. Measurement Model for Reflective Construct
Table 5 presents the outcomes of the measurement model pertaining to the reflective constructs of horizontal alignment, vertical alignment, and intersections. As per the findings of Sarstedt et al. [80], it is widely acknowledged that the standardised outer loadings should meet or exceed the threshold of 0.70. It is recommended to consider removing indicators from a scale if their outer loadings fall within the range of 0.40 to 0.70. According to Sarstedt et al. [80], the elimination of the indicator should only be carried out if it leads to an enhancement in the composite reliability.
Table 5.
The results of the measurement model for reflective construct.
A loading factor of more than 0.7 was recorded by the superelevation, radius, and horizontal alignment indicators. In the meantime, loading factors ranging from 0.4 to 0.7 were recorded for the intersection angle. Deleting the intersection angle resulted in a decrease in composite reliability, which is why this indicator was not removed. If the loading factor is more than 0.7, the K-value, sight distance, and vertical alignment indicators should be recorded. The intersection indicators, which included the number and type of intersection, had a loading factor greater than 0.7. The Average Variance Extracted (AVE) is a frequently used metric for assessing convergent validity at the construct level. Applying analogous reasoning to the individual indicators, an AVE value equal to or exceeding 0.50 signifies that the construct, on average, accounts for over 50% of the variance observed in its indicators.
Table 5 shows that the AVE for horizontal alignment was 0.60, indicating that the construct explains over half of the variance of its indicators. Furthermore, the AVE for vertical alignment and intersections was 0.501 and 1, respectively. Additionally, the CRA valve for horizontal alignment was 0.747, indicating a high level of reliability for the indicators. The CRA value for vertical alignment was 0.703, meanwhile. The intersection of the CRA was 1. Cronbach’s alpha is a measure of reliability that is conservative. The values of Cronbach’s alpha for horizontal alignment, vertical alignment, and intersections were 0.502, 0.501, and 1, respectively.
4.2.3. Measurement Model for Formative Construct
Table 6 displays the outcomes of the measurement model for the formative construct pertaining to road accidents. The indicators of road accidents are the accident rate, severity index, and number of fatalities. These indicators have a loading factor of more than 0.7.
Table 6.
The results of the measurement model for formative construct.
In this stage, the multicollinearity of indicators was evaluated through collinearity statistics (VIF), parameter estimates of indicator weights, and the significance of weights. The findings of the path analysis indicated that every indicator had a noteworthy outer weight value, which demonstrated their relevance and significance. The T-values for each variable are also greater than 1.0. It was proven that all determinants were free of multicollinearity as all variables had VIF values above the recommended minimum of less than 3.3. The satisfactory results produced by the overall evaluation allowed the evaluation of the structural model to proceed.
4.2.4. Path Coefficient
Upon execution of the PLS-SEM algorithm, estimations were derived for the associations within the structural model, specifically the path coefficients. The hypothesized relationships between the constructs are represented by these links. Based on Table 7, road accident statistics were shown to be significantly correlated with horizontal alignment at hotspot segments (β = −0.316, t = 2.922, p < 0.01), supporting Hypothesis 1 (H1): Horizontal alignment indicators are significantly related to traffic accidents. The statistical research revealed that vertical alignment had no discernible impact on traffic accidents at hotspot segments (β = −0.118, t = 1.311, p = 0.19). Therefore, H2 is unsupported. In Hypothesis 3, a significant effect is shown by H3 (β = 0.594, t = 10.570, p < 0.001), which provides support for H3.
Table 7.
Path coefficients of research hypotheses.
4.3. Goodness of Fit of Model (GoF)
GoF was devised as a comprehensive indicator of the adequacy of model fit for SEM. Nevertheless, the GoF is unable to accurately differentiate between valid and invalid models and its applicability to specific model configurations is restricted. A very good model fit was demonstrated by the calculation, which yielded a GoF index value of 0.628. It can be concluded that both the measurement and structural models were in agreement. The structural model results for this study are shown in Figure 7.
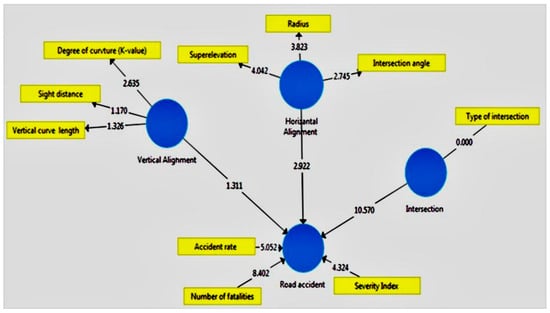
Figure 7.
Structural model result.
4.4. Normed Fit Index
The Normed Fit Index (NFI) calculates the proposed model’s Chi2 value and compares it to a relevant standard. NFI has a range of 0 to 1, with values close to 1. The calculation revealed a good model fit, with an NFI value of 0.791. It is possible to conclude that both the measurement and structural models agreed.
5. Discussion
This study identifies 80 road hotspots that are statistically significant for causing accidents with a confidence level of 99% (Gi-bin = 3), 95% (Gi-bin = 2), and 90% (Gi-bin = 1) along Jordan’s Desert Highway that indicate the road is a hazard and causes fatalities. A similar application also was reported by Li and Liang [32], and Le et al. [82] who found that the accident severity index should be considered when determining road accident hotspots because it produces more precise results and more accurate rankings of hotspots. Subsequently, the traffic authorities can readily comprehend the causative factors of each accident and provide viable solutions to mitigate the riskiest hotspots, given their constrained budgets and resources, thereby supporting the findings of this study.
The findings indicate that horizontal alignments with a high risk on the road and a high severity index have been recorded. This means that an increase in the radius, superelevation, and deflection angle of horizontal curves decreases road accidents at hotspot locations. These findings support previous studies that indicate a significant effect of horizontal alignment on road accidents [44,67]. In addition, the intersection has a significant effect on road accidents, which is in line with previous research conducted by Briz et al. [83], Cheng et al. [84], Sajed et al. [30], and Billah et al. [85]). It is possible to find road accident hotspots at vertical alignments. However, the vertical alignment does not have a significant effect on road accidents. This finding has received less attention in previous studies, as most studies have focused on horizontal alignments and intersections and their effects on road safety. Limited studies have focused on vertical alignment.
Some solutions, such as improving the geometrics of intersections and horizontal alignment, adding a climbing lane at vertical alignment, and adding speed limit signs, have been proposed to reduce the number and severity of traffic accidents in the study area. These solutions are strongly recommended in places where there are a lot of deaths and serious injuries. These places were found through statistical and mapping analysis.
6. Conclusions
Road accidents are a significant social and economic problem as they cause a large number of fatalities and injuries. Identifying road accident hotspots and the factors that affect them can significantly improve road safety. This can allow traffic managers to develop targeted improvement measures and recommendations. Getis-Ord Gi* and the severity index were used in this study with ArcGIS to identify statistically significant hotspots. These hotspots are characterized as high-value areas that are surrounded by neighbors with similar values. The preview studies used accident accounts for the purpose of demonstrating the locations of road accident hotspots, whereas this study employed an accident severity index. The study discovered that there are 80 locations along Jordan’s Desert Highway where a significant number of road accidents occur.
According to the SEM, horizontal alignment significantly affects road accidents at hotspot locations. There are four indicators for horizontal alignments, which are the curve radius, length of the curve, deflection angle, and superelevation. The increase in radius, superelevation, and deflection angle of a horizontal curve resulted in a decrease in road accidents at hotspot locations. The lack of a significant effect of vertical alignment on road accidents supports null Hypothesis 2: vertical alignment indicators do not have a significant impact on road accidents at hotspot segments. The road intersection has a significant effect on road accidents at hotspot locations. This means that more intersections are proportional to more road accidents.
This research endeavor is expected to assist traffic engineers in mitigating the occurrence of accidents at the aforementioned sites. Geographical information systems and contemporary methodologies are considered essential instruments for investigating road accidents owing to their capacity to produce and evaluate pertinent spatial data, as well as spatial patterns of the distribution of phenomena that are pertinent to road accident hotspots. These tools offer scientific insights regarding how to comprehend intricate international and social phenomena. This study has the potential to facilitate the identification of factors that impact the safety of these areas, allowing planners, traffic engineers, and researchers to classify them as hazardous.
Future studies could apply SEM to other factors that influence road safety at road hotspots, such as social and environmental factors. Understanding the factors that influence the distribution of road hotspots could help researchers build more effective countermeasures.
Author Contributions
S.A.A.: Conceptualization, Methodology. S.A.A.: Data curation, Writing—Original draft preparation. S.A.A.: Visualization, Investigation. N.S.A.S.: Supervision. S.A.A.: Software, Validation. N.S.A.S., M.T.O. and T.S.B.A.M.: Writing—Reviewing and Editing. All authors have read and agreed to the published version of the manuscript.
Funding
This research received no external funding.
Institutional Review Board Statement
Not applicable.
Informed Consent Statement
Not applicable.
Data Availability Statement
The data used to support the findings of this study are available from the corresponding author upon request.
Acknowledgments
The authors would like to thank TP2 (Train to publish for second batch under USM) for providing the reviewing and editing in this research.
Conflicts of Interest
The authors declare no conflict of interest.
References
- Wijnen, W. Socio-economic costs of road crashes in middle-income countries: Applying a hybrid approach to Kazakhstan. IATSS Res. 2021, 45, 293–302. [Google Scholar] [CrossRef]
- Global Status Report on Road Safety 2018. WHO. 2019. Available online: https://www.who.int/violence_injury_prevention/road_safety_status/2018/en/ (accessed on 18 July 2022).
- Li, M.; Xie, H.; Shu, P. Study on the Impact of Traffic Accidents in Key Areas of Rural Roads. Sustainability 2021, 13, 7802. [Google Scholar] [CrossRef]
- Tola, A.M.; Demissie, T.A.; Saathoff, F.; Gebissa, A. Severity, Spatial Pattern and Statistical Analysis of Road Traffic Crash Hot Spots in Ethiopia. Appl. Sci. 2021, 11, 8828. [Google Scholar] [CrossRef]
- Traffic Department. Yearly Statistical Report of Traffic Accidents. 2019. Available online: https://www.psd.gov.jo/images/docs/TrafficRep2019.pdf (accessed on 18 July 2022).
- Mitchell, A. The ESRI Guide to GIS Analysis Volume 3: Modeling Sustainability, Movement, and Interaction. ESRI Press, 2012; p. 419. Available online: https://books.google.jo/books?id=2VDogixBFA4C&q=The+Esri+Guide+to+GIS+Analysis,+Volume+3:+Modeling+Suitability,+Movement,+and+Interaction&dq=The+Esri+Guide+to+GIS+Analysis,+Volume+3:+Modeling+Suitability,+Movement,+and+Interaction&hl=ar&sa=X&ved=2ahUKEwjM (accessed on 18 July 2022).
- Mekonnen, A.A.; Beza, A.D.; Sipos, T. Estimating the Value of Statistical Life in a Road Safety Context Based on the Contingent Valuation Method. J. Adv. Transp. 2022, 2022, 3047794. [Google Scholar] [CrossRef]
- Ghadi, M.; Török, Á.; Tánczos, K. Study of the Economic Cost of Road Accidents in Jordan. Period. Polytech. Transp. Eng. 2018, 46, 129–134. [Google Scholar] [CrossRef]
- Zhao, J.; Guo, Y.; Liu, P. Safety impacts of geometric design on freeway segments with closely spaced entrance and exit ramps. Accid. Anal. Prev. 2021, 163, 106461. [Google Scholar] [CrossRef]
- AlKheder, S.; Al Gharabally, H.; Al Mutairi, S.; Al Mansour, R. An Impact study of highway design on casualty and non-casualty traffic accidents. Injury 2022, 53, 463–474. [Google Scholar] [CrossRef]
- Galante, F.; Mauriello, F.; Pernetti, M.; Rella Riccardi, M.; Montella, A. Effects of Traffic Control Devices on Rural Curve Lateral Position. Transp. Res. Rec. J. Transp. Res. Board 2022, 2676, 162–180. [Google Scholar] [CrossRef]
- Gargoum, S.; Karsten, L.; El-Basyouny, K.; Chen, X. Enriching Roadside Safety Assessments Using LiDAR Technology: Disaggregate Collision-Level Data Fusion and Analysis. Infrastructures 2022, 7, 7. [Google Scholar] [CrossRef]
- Khedher, M.B.B.; Yun, D. Generalized Linear Models to Identify the Impact of Road Geometric Design Features on Crash Frequency in Rural Roads. KSCE J. Civ. Eng. 2022, 26, 1388–1395. [Google Scholar] [CrossRef]
- Macedo, M.R.O.B.C.; Maia, M.L.A.; Kohlman Rabbani, E.R.; Lima Neto, O.C.C.; Andrade, M. Traffic accident prediction model for rural highways in Pernambuco. Case Stud. Transp. Policy 2022, 10, 278–286. [Google Scholar] [CrossRef]
- Al-omari, B.; Ghuzlan, K.; Hasan, H. Traffic Accidents Trends and Characteristics in Jordan. 2013. Available online: https://pdfs.semanticscholar.org/db9e/73c8a37e2837b927eb24b2be79de5efe945f.pdf (accessed on 18 July 2022).
- Miqdady, T.; de Oña, J. Identifying the Factors That Increase the Probability of an Injury or Fatal Traffic Crash in an Urban Context in Jordan. Sustainability 2020, 12, 7464. [Google Scholar] [CrossRef]
- Cheng, W.; Gill, G.S.; Zhang, Y.; Vo, T.; Wen, F.; Li, Y. Exploring the modeling and site-ranking performance of Bayesian spatiotemporal crash frequency models with mixture components. Accid. Anal. Prev. 2020, 135, 105357. [Google Scholar] [CrossRef] [PubMed]
- Dereli, M.A.; Erdogan, S. A new model for determining the traffic accident black spots using GIS-aided spatial statistical methods. Transp. Res. Part A Policy Pract. 2017, 103, 106–117. [Google Scholar] [CrossRef]
- Ryder, B.; Gahr, B.; Dahlinger, A. An in-Vehicle Information System Providing Accident hotspot Warnings|Semantic Scholar. ECIS. 2016. Available online: https://www.semanticscholar.org/paper/An-in-Vehicle-Information-System-Providing-Accident-Ryder-Gahr/662134792653ae830a96c8da33a2b19c45a9d95b (accessed on 22 July 2021).
- W/Yohannes, A.Y.; Minale, A.S. Identifying the Hot Spot Areas of Road Traffic Accidents. Jordan J. Civ. Eng. 2015, 9, 358–370. [Google Scholar] [CrossRef]
- Thakali, L.; Kwon, T.J.; Fu, L. Identification of crash hotspots using kernel density estimation and kriging methods: A comparison. J. Mod. Transp. 2015, 23, 93–106. [Google Scholar] [CrossRef]
- Feng, M.; Wang, X.; Lee, J.; Abdel-Aty, M.; Mao, S. Transferability of safety performance functions and hotspot identification for freeways of the United States and China. Accid. Anal. Prev. 2020, 139, 105493. [Google Scholar] [CrossRef]
- Vemulapalli, S.S.; Ulak, M.B.; Ozguven, E.E.; Sando, T.; Horner, M.W.; Abdelrazig, Y.; Moses, R. GIS-based Spatial and Temporal Analysis of Aging-Involved Accidents: A Case Study of Three Counties in Florida. Appl. Spat. Anal. Policy 2017, 10, 537–563. [Google Scholar] [CrossRef]
- Saha, D.; Alluri, P.; Gan, A.; Wu, W. Spatial analysis of macro-level bicycle crashes using the class of conditional autoregressive models. Accid. Anal. Prev. 2018, 118, 166–177. [Google Scholar] [CrossRef]
- Srikanth, L.; Srikanth, I.; Arockiasamy, M. Identification of Traffic Accident Hotspots using Geographical Information System (GIS). Int. J. Eng. Adv. Technol. 2019, 9, 4429–4438. [Google Scholar] [CrossRef]
- Hashtarkhani, S.; Kiani, B.; Bergquist, R.; Bagheri, N.; VafaeiNejad, R.; Tara, M. An age-integrated approach to improve measurement of potential spatial accessibility to emergency medical services for urban areas. Int. J. Health Plan. Manag. 2020, 35, 788–798. [Google Scholar] [CrossRef] [PubMed]
- Nazneen, S.; Rezapour, M.; Ksaibati, K. Application of Geographical Information System Techniques to Determine High Crash-Prone Areas in the Fort Peck Indian Reservation. Open Transp. J. 2020, 14, 174–185. [Google Scholar] [CrossRef]
- Alkhadour, W.; Zraqou, J.; Al-Helali, A.; Al-Ghananeem, S. Traffic Accidents Detection using Geographic Information Systems (GIS). Int. J. Adv. Comput. Sci. Appl. 2021, 12, 484–494. [Google Scholar] [CrossRef]
- Hazaymeh, K.; Almagbile, A.; Alomari, A.H. Spatiotemporal Analysis of Traffic Accidents Hotspots Based on Geospatial Techniques. ISPRS Int. J. Geo-Inf. 2022, 11, 260. [Google Scholar] [CrossRef]
- Sajed, Y.; Shafabakhsh, G.; Bagheri, M. Hotspot location identification using accident data, traffic and geometric characteristics. Eng. J. 2019, 23, 191–207. [Google Scholar] [CrossRef]
- Srikanth, L.; Srikanth, I. A Case Study on Kernel Density Estimation and Hotspot Analysis Methods in Traffic Safety Management. In Proceedings of the 2020 International Conference on COMmunication Systems and NETworkS, COMSNETS 2020, Bengaluru, India, 7–11 January 2020; Institute of Electrical and Electronics Engineers Inc.: Trondheim, Norway, 2020; pp. 99–104. [Google Scholar] [CrossRef]
- Le, K.G.; Liu, P.; Lin, L.-T. Determining the road traffic accident hotspots using GIS-based temporal-spatial statistical analytic techniques in Hanoi, Vietnam. Geo-Spat. Inf. Sci. 2020, 23, 153–164. [Google Scholar] [CrossRef]
- Manap, N.; Borhan, M.N.; Yazid, M.R.M.; Hambali, M.K.A.; Rohan, A. Identification of Hotspot Segments with a Risk of Heavy-Vehicle Accidents Based on Spatial Analysis at Controlled-Access Highway. Sustainability 2021, 13, 1487. [Google Scholar] [CrossRef]
- Gooch, J.P.; Gayah, V.V.; Donnell, E.T. Safety performance functions for horizontal curves and tangents on two lane, two way rural roads. Accid. Anal. Prev. 2018, 120, 28–37. [Google Scholar] [CrossRef]
- Wang, X.; Qu, X.; Jin, S. Hotspot identification considering daily variability of traffic flow and crash record: A case study. J. Transp. Saf. Secur. 2020, 12, 75–91. [Google Scholar] [CrossRef]
- Obaidat, M.; Ramadan, T. Traffic Accidents at Hazardous Locations of Urban Roads. Jordan J. Civ. Eng. 2012, 6, 436–447. [Google Scholar]
- Submitted, A.T.; Partial, I.N.; Of, F.; Requirements, T.H.E.; The, F.O.R.; Of, D.; Science, M.O.F. Simultaneous Optimization of Vertical and Horizontal Road Alignments. Ph.D. Thesis, University of British Columbia, Vancouver, BC, Canada, 2014. [Google Scholar]
- Kobryń, A. Optimization of Vertical Alignment using General Transition Curves. KSCE J. Civ. Eng. 2017, 22, 2549–2559. [Google Scholar] [CrossRef]
- Bíl, M.; Andrášik, R.; Sedoník, J. A detailed spatiotemporal analysis of traffic crash hotspots. Appl. Geogr. 2019, 107, 82–90. [Google Scholar] [CrossRef]
- Abdulhafedh, A. A Novel Hybrid Method for Measuring the Spatial Autocorrelation of Vehicular Crashes: Combining Moran’s Index and Getis-Ord Gi* Statistic. Open J. Civ. Eng. 2017, 7, 208–221. [Google Scholar] [CrossRef]
- Soltani, A.; Askari, S. Exploring spatial autocorrelation of traffic crashes based on severity. Injury 2017, 48, 637–647. [Google Scholar] [CrossRef]
- Abdulhafedh, A. Identifying Vehicular Crash High Risk Locations along Highways via Spatial Autocorrelation Indices and Kernel Density Estimation. World J. Eng. Technol. 2017, 5, 198–215. [Google Scholar] [CrossRef]
- Achu, A.L.; Aju, C.D.; Suresh, V.; Manoharan, T.P.; Reghunath, R. Spatio-Temporal Analysis of Road Accident Incidents and Delineation of Hotspots Using Geospatial Tools in Thrissur District, Kerala, India. KN—J. Cartogr. Geogr. Inf. 2019, 69, 255–265. [Google Scholar] [CrossRef]
- Bassan, S. Modeling and evaluating the relationship between the radius superelevation and comfort speed in horizontal curves. Adv. Transp. Stud. 2013, 30, 23–42. Available online: https://web.b.ebscohost.com/abstract?direct=true&profile=ehost&scope=site&authtype=crawler&jrnl=18245463&AN=89642255&h=g4rXcks6vGkS%2FekxvhGTCgafF88k1fkCM0b5BjjedxgiTI6GtZ0Muyfvmf388E%2FLdD9A0DJPKZ3F25O%2B8PwCnw%3D%3D&crl=c&resultNs=AdminWebAuth&resultLoc (accessed on 23 April 2022).
- Colak, H.E.; Memisoglu, T.; Erbas, Y.S.; Bediroglu, S. Hot spot analysis based on network spatial weights to determine spatial statistics of traffic accidents in Rize, Turkey. Arab. J. Geosci. 2018, 11, 151. [Google Scholar] [CrossRef]
- Kara, C.; Akçit, N. Traffic accident analysis using GIS: A case study of Kyrenia City. In Third International Conference on Remote Sensing and Geoinformation of the Environment (RSCy2015); SPIE: Philadelphia, PA, USA, 2015; Volume 9535, p. 953514. [Google Scholar] [CrossRef]
- Kavousi, A.; Moradi, A.; Rahmani, K.; Zeini, S.; Ameri, P. Geographical distribution of at fault drivers involved in fatal traffic collisions in Tehran, Iran. Epidemiol. Health 2020, 42, e2020002. [Google Scholar] [CrossRef] [PubMed]
- Moradi, A.; Soori, H.; Kavousi, A.; Eshghabadi, F.; Jamshidi, E.; Zeini, S. Spatial Analysis to Identify High Risk Areas for Traffic Crashes Resulting in Death of Pedestrians in Tehran. Med. J. Islam. Repub. Iran 2016, 30, 450. [Google Scholar] [PubMed]
- Rahman, M.K.; Crawford, T.; Schmidlin, T.W. Spatio-temporal analysis of road traffic accident fatality in Bangladesh integrating newspaper accounts and gridded population data. GeoJournal 2018, 83, 645–661. [Google Scholar] [CrossRef]
- Satria, R.; Castro, M. GIS Tools for Analyzing Accidents and Road Design: A Review. In Transportation Research Procedia; Elsevier B.V: Amsterdam, The Netherland, 2016; Volume 18, pp. 242–247. [Google Scholar] [CrossRef]
- Shaaban, K.; Shakeel, K.; Rashidi, T.H.; Kim, I. Measuring users’ satisfaction of the road network using structural equation modeling. Int. J. Sustain. Transp. 2021, 16, 792–803. [Google Scholar] [CrossRef]
- Tortum, A.; Atalay, A. Spatial analysis of road mortality rates in Turkey. Proc. Inst. Civ. Eng. Transp. 2015, 168, 532–542. [Google Scholar] [CrossRef]
- Harirforoush, H.; Bellalite, L. A new integrated GIS-based analysis to detect hotspots: A case study of the city of Sherbrooke. Accid. Anal. Prev. 2019, 130, 62–74. [Google Scholar] [CrossRef] [PubMed]
- Hashimoto, S.; Yoshiki, S.; Saeki, R.; Mimura, Y.; Ando, R.; Nanba, S. Development and application of traffic accident density estimation models using kernel density estimation. J. Traffic Transp. Eng. 2016, 3, 262–270. [Google Scholar] [CrossRef]
- Mestri, R.A.; Rathod, R.R.; Garg, R.D. Identification and Removal of Accident-Prone Locations Using Spatial Data Mining. In Lecture Notes in Civil Engineering; Springer: Berlin/Heidelberg, Germany, 2020; Volume 33, pp. 383–394. [Google Scholar] [CrossRef]
- Pleerux, N. Geographic information system-based analysis to identify the spatiotemporal patterns of road accidents in sri racha, chon buri, Thailand. Curr. Appl. Sci. Technol. 2020, 20, 59–70. [Google Scholar] [CrossRef]
- Manap, N.; Brhan, M.; Yazid, M.; Hambali, M.; Rohan, A. Determining Spatial Patterns of Road Accidents at Expressway by Applying Getis-Ord Gi* Spatial Statistic. Int. J. Recent Technol. Eng. 2019, 8, 345–350. [Google Scholar] [CrossRef]
- Choudhary, J.; Ohri, A.; Kumar, B. Spatial and Statistical Analysis of Road Accidents Hot Spots Using GIS. 2015. Available online: https://www.researchgate.net/publication/291973317_Spatial_and_statistical_analysis_of_road_accidents_hot_spots_using_GIS (accessed on 11 December 2020).
- Yadav, D.K.; Ghodmare, S.D.; Naveen Kumar, N. Mitigation of Blackspots on Highways by the Application of Safe System Approach. Mater. Today Proc. 2022, 52, 1228–1235. [Google Scholar] [CrossRef]
- Al-Rousan, T.M.; Umar, A.A.; Al-Omari, A.A.; Goniewicz, K.; Czerski, R.; Kustra, M. Characteristics of Crashes Caused by Distracted Driving on Rural and Suburban Roadways in Jordan. Infrastructures 2021, 6, 107. [Google Scholar] [CrossRef]
- Alghafli, A.; Mohamad, E.; Ahmed, A.Z. The effect of geometric road conditions on safety performance of abu dhabi road intersections. Safety 2021, 7, 73. [Google Scholar] [CrossRef]
- Islam, M.H.; Teik Hua, L.; Hamid, H.; Azarkerdar, A. Relationship of Accident Rates and Road Geometric Design. IOP Conf. Ser. Earth Environ. Sci. 2019, 357, 012040. [Google Scholar] [CrossRef]
- Jung, S.; Wang, K.; Oh, C.; Chang, J. Development of Highway Safety Policies by Discriminating Freeway Curve Alignment Features. KSCE J. Civ. Eng. 2018, 22, 1418–1426. [Google Scholar] [CrossRef]
- Garnaik, M.M. Effects of Highway Geometric Elements on Accident Modelling. Ph.D. Thesis, Department of Civil Engineering National Institute of Technology Rourkela, Odisha, India, 2014. [Google Scholar]
- Lin, D.J.; Yang, J.R.; Liu, H.H.; Chiang, H.-S.; Wang, L.Y. Analysis of Environmental Factors on Intersection Accidents. Sustainability 2022, 14, 1764. [Google Scholar] [CrossRef]
- Retallack, A.E.; Ostendorf, B. Relationship Between Traffic Volume and Accident Frequency at Intersections. Int. J. Environ. Res. Public Health 2020, 17, 1393. [Google Scholar] [CrossRef] [PubMed]
- Kronprasert, N.; Boontan, K.; Kanha, P. Crash prediction models for horizontal curve segments on two-lane rural roads in Thailand. Sustainability 2021, 13, 9011. [Google Scholar] [CrossRef]
- Musa, M.F.; Hassan, S.A.; Mashros, N. The impact of roadway conditions towards accident severity on federal roads in Malaysia. PLoS ONE 2020, 15, e0235564. [Google Scholar] [CrossRef]
- Wang, X.; Yao, J.; Li, Z.; Liu, Y.; Cai, J. Identification of the Impact of Radius Ratio of Horizontal to Vertical Curves on Highway Safety. In Proceedings of the CICTP 2020, Xi’an, China, 14–16 August 2020; pp. 4762–4775. [Google Scholar] [CrossRef]
- Zhang, W.; Wang, M.; Qiang, T. Spatial distribution of traffic accident density at urban road intersection considering severity. Jiangsu Daxue Xuebao (Ziran Kexue Ban)/J. Jiangsu Univ. (Nat. Sci. Ed.) 2023, 44, 133–141. [Google Scholar] [CrossRef]
- Abuaddous, M.; Al-Hares, A.; Faten Albtoush, A.M.; Aldiabat Al-Btoosh, J.A. Identification and Ranking of Accident Black Spots in Jordan. Civ. Eng. Archit. 2022, 10, 1661–1674. [Google Scholar] [CrossRef]
- FHWA (Federal Highway Administration). Roadway Departure Safety—Safety|Federal Highway Administration. 2011. Available online: https://safety.fhwa.dot.gov/local_rural/training/fhwasa1109/app_c.cfm (accessed on 22 July 2020).
- Mitchell, A. The ESRI Guide to GIS Analysis, Volume 2|Spatial Measurements and Statistics (Volume 1). 2005. Available online: https://esripress.esri.com/display/index.cfm?fuseaction=display&websiteID=86&moduleID=0 (accessed on 22 July 2022).
- Fan, Y.; Chen, J.; Shirkey, G.; John, R.; Wu, S.R.; Park, H.; Shao, C. Applications of structural equation modeling (SEM) in ecological studies: An updated review. Ecol. Process. 2016, 5, 19. [Google Scholar] [CrossRef]
- Hair, J.F.; Hult, G.T.M.; Ringle, C.M.; Sarstedt, M.; Danks, N.P.; Ray, S. An Introduction to Structural Equation Modeling; SAGE Publications: London, UK, 2021; pp. 1–29. [Google Scholar] [CrossRef]
- Tarka, P. An overview of structural equation modeling: Its beginnings, historical development, usefulness and controversies in the social sciences. Qual. Quant. 2017, 52, 313–354. [Google Scholar] [CrossRef]
- Kang, H.; Ahn, J.W. Model Setting and Interpretation of Results in Research Using Structural Equation Modeling: A Checklist with Guiding Questions for Reporting. Asian Nurs. Res. 2021, 15, 157–162. [Google Scholar] [CrossRef]
- Sayed, I.; Abdelgawad, H.; Said, D. Studying driving behavior and risk perception: A road safety perspective in Egypt. J. Eng. Appl. Sci. 2022, 69, 22. [Google Scholar] [CrossRef]
- Shah, S.A.R.; Ahmad, N.; Shen, Y.; Pirdavani, A.; Basheer, M.A.; Brijs, T. Road safety risk assessment: An analysis of transport policy and management for low-, middle-, and high-income Asian countries. Sustainability 2018, 10, 389. [Google Scholar] [CrossRef]
- Sarstedt, M.; Ringle, C.M.; Hair, J.F.; Sarstedt, M.; Ringle, C.M.; Hair, J.F. Partial Least Squares Structural Equation Modeling. In Handbook of Market Research; Springer International Publishing: Cham, Switzerland, 2017; pp. 1–40. [Google Scholar] [CrossRef]
- Hayakawa, K. Corrected goodness-of-fit test in covariance structure analysis. Psychol. Methods 2019, 24, 371–389. [Google Scholar] [CrossRef] [PubMed]
- Li, Y.; Liang, C. The Analysis of Spatial Pattern and Hotspots of Aviation Accident and Ranking the Potential Risk Airports Based on GIS Platform. J. Adv. Transp. 2018, 2018, 4027498. [Google Scholar] [CrossRef]
- Briz-Redón, Á.; Martínez-Ruiz, F.; Montes, F. Spatial analysis of traffic accidents near and between road intersections in a directed linear network. Accid. Anal. Prev. 2019, 132, 105252. [Google Scholar] [CrossRef]
- Tian, Z.; Zhang, S.R. Identification and ranking of accident black spots using advanced empirical Bayes method. Chang’an Daxue Xuebao (Ziran Kexue Ban)/J. Chang’an Univ. (Nat. Sci. Ed.) 2019, 39, 115–126. [Google Scholar]
- Billah, K.; Adegbite, Q.; Sharif, H.O.; Dessouky, S.; Simcic, L. Analysis of Intersection Traffic Safety in the City of San Antonio, 2013–2017. Sustainability 2021, 13, 5296. [Google Scholar] [CrossRef]


Disclaimer/Publisher’s Note: The statements, opinions and data contained in all publications are solely those of the individual author(s) and contributor(s) and not of MDPI and/or the editor(s). MDPI and/or the editor(s) disclaim responsibility for any injury to people or property resulting from any ideas, methods, instructions or products referred to in the content. |
© 2023 by the authors. Licensee MDPI, Basel, Switzerland. This article is an open access article distributed under the terms and conditions of the Creative Commons Attribution (CC BY) license (https://creativecommons.org/licenses/by/4.0/).