Article

Biochar Improved Sugarcane Growth and Physiology under Salinity Stress

1
Faculty of Agronomy, Vietnam National University of Agriculture, Hanoi 131000, Vietnam
2
Plant Clinic, Vietnam National University of Agriculture, Hanoi 131000, Vietnam
3
Faculty of Agriculture, Forestry and Fisheries, Hong Duc University, Thanh Hoa 440000, Vietnam
4
Institute of Agro-Biology, Vietnam National University of Agriculture, Hanoi 131000, Vietnam
5
Department of Interdisciplinary Program in Smart Agriculture, Kangwon National University, Chuncheon 24341, Republic of Korea
6
Department of Horticulture, Kangwon National University, Chuncheon 24341, Republic of Korea
*
Authors to whom correspondence should be addressed.
These authors contribute equally to this paper.
Appl. Sci. 2023, 13(13), 7708; https://doi.org/10.3390/app13137708
Submission received: 1 June 2023 / Revised: 23 June 2023 / Accepted: 28 June 2023 / Published: 29 June 2023
(This article belongs to the Section Agricultural Science and Technology)

Abstract

:
Biochar is suggested as a conditioner for salt-affected soils for various crops. This study aimed to evaluate the effects of biochar on the growth and physiology of sugarcane under saline and non-saline conditions at an early growth stage. The experiment was conducted in pots in the greenhouses with three replications. Three biochar rates (0, 5, and 10 tons ha−1) were applied before transplanting sugarcane seedlings into the pots. Four weeks after transplanting, plants were irrigated with 300 mL of 100 mM NaCl every two days for 2 weeks. Salinity significantly affected the growth and physiology of sugarcanes. The application of biochar increased plant height, shoot dry weight, root volume, root dry weight, Fv/Fm, and chlorophyll content while decreasing the water saturation deficit and the relative ion leakage in the leaves under both saline and non-saline conditions. Thus, biochar application has positive effects on the growth and physiology of sugarcane at an early growth stage under both saline and non-saline conditions. However, further study is suggested to investigate the effects of biochar on sugarcane under saline stress in the field at different growth stages.

1. Introduction

Salinity stress is one of the major determinants leading to the loss of crop productivity worldwide [1]. With the increase in both frequency and intensity of agricultural land salinization caused by climate change and poor land management [2], the effects of soil salinity are becoming more critical. Of note, almost 20% of the world’s cultivated land is affected by salt stress [3], and the salt-affected soils were extensively found in arid and semi-arid regions [4]. Salinity negatively affects physiological and biochemical processes in plants as it triggers osmotic stress and ion toxicity [5]. Additionally, this condition also accelerates the generation of reactive oxygen species (ROS) leading to oxidative damage in cellular components and, thus, severely interrupting plant cell functions. Salt stress decreases crop dry matter yield, chlorophyll content, and gas exchange variables [6,7]. Furthermore, Netondo et al. [8] reported that photosynthetic activity decreased in sorghum growing under saline conditions, owing to a conspicuous decline in plant growth and productivity. High severity and long duration of salt stress cause significant yield loss or even plant death [9]. As the effects of salinity are adverse and increasing, sustainable strategies and proper techniques for mitigating its impacts are critically important.
As a glycophyte plant, sugarcane’s growth is adversely inhibited by soil salinity [10,11]. Sugarcane is moderately sensitive to salinity stress as indicated by the decrease in stem diameter, stalk population, leaf area, and dry matter accumulation. Zhao et al. [12] also noted that plant height and node number of sugarcane plants were sensitive to soil salinity. Yunita et al. [13] observed root length, shoot, and root fresh weight decreased by salinity, and the damage symptoms were more pronounced at salt levels above 100 mM. Watanabe et al. [14] reported that the growth and physiological parameters of sugarcane were inhibited by increasing salt concentration in irrigation water. Climate change with the rising of salinization constrains sugarcane production in coastal lands in Southeast Asia, Taiwan, Japan islands, the Amazon basin, etc. Zhao and Li [15] reported the same status in Australia and South Florida (USA).
Biochar is a carbon-rich product obtained from the pyrolysis of charred organic materials under high temperatures and oxygen-deficient conditions [16]. Therefore, the properties of biochar mainly depend on the pyrolysis temperature and pyrolyzed matrix. High pyrolysis temperature promotes the biochars with strongly developed specific surface area, high porosity, pH, ash, and carbon contents, but with low cation exchange capacity (CEC) and volatile matter [17]. In addition, the quality of biochar is highly influenced by the type of feedstocks [18]. Until now, two common types of feedstocks for biochar were plant residue and manure sources [19]. While plant-derived (crop residue and wood biomass) biochars exhibited higher surface areas, carbon content, and volatile matter, manure-derived biochars produced higher CEC even at higher pyrolysis temperatures [17]. The potential of utilizing biochar to improve soil health has received considerable attention in recent years [4]. Application of biochar enriches soil physicochemical properties, biological properties, and soil enzymatic activity, hence contributing to a favorable plant–soil interaction platform. Several studies have revealed that biochar application may substantially improve soil fertility and crop productivity. As a direct mechanism, biochar acts to reduce sodium uptake by plants as it retains the sodium amount (transient binding of Na+), reduces the osmotic stress by maintaining soil moisture content, and releases mineral nutrients (particularly K+, Ca++, Mg++) into the soil environment [20,21]. Additionally, biochar greatly increased the water-holding capacity of the soil, therefore enhancing leaf chlorophyll content, stomatal conductance, photosynthetic rate, and relative water content [22,23]. Therefore, according to recently published papers, biochar is suggested as a conditioner for salt-affected soils for various crops [24,25]. For instance, Usman et al. [26] used biochar to improve soil nutrient availability and growth of tomatoes under saline water irrigation, while Lashari et al. [27] concluded that biochar improved wheat’s growth, physiological responses, yield, and nutrient uptake under salt stress.
Sugarcane, with a total area of 129,000 ha planted over the country, is among the most important industrial crops in Vietnam [28]. Sugarcane is cultivated across Vietnam and its cropping area can be divided into six main regions, namely Midlands and North Mountain, North Central, South Central Coast, Highlands, Western South, and Mekong Delta [29]. Mekong Delta, with 20% of the area and 30% of the productivity of the nation, is one of the largest sugarcane production regions in Vietnam. Sugarcane cultivated in the Me-kong Delta region also has the highest crop yield (87 tons/ha) and sugar quality [29]. However, like many other coastal areas in the world such as Australia, America [15], and Japan [14], sugarcane production in the Mekong Delta region has been decreasing as a result of salinity stress. In the dry season, salinity in agricultural canals and ditches was reported to reach 4–6‰ in the region [30]. To make matters worse, the increasing impacts of sea level rises resulted in increasing soil salinity (both in frequency and intensity), thereby threatening sustainable sugarcane production in the region. Since then, several sugar processing factories have been closed due to a lack of raw materials, hence adversely affecting the livelihood of local farmers. Previous studies demonstrated the positive effects of biochar on growth, photosynthesis, soil parameters, and nutrient distribution in sugarcane [31,32]. However, to date, there is no information on applying biochar to improve sugarcane growth under salinity stress. Our study was conducted to obtain a better understanding of the effectiveness of biochar in minimizing the negative impact of salinity stress on the growth and physiology of sugarcane. The information from this study will be useful for using biochar as a soil amendment to ameliorate sugarcane production in Mekong Delta and other regions with similar climatic problems.

2. Materials and Methods

2.1. Materials

Twenty-five-day-old sugarcane seedlings propagated from the six-month-old sugarcane plant of Cao Phong–Hoa Binh variety were used in this experiment. Oakwood biochar at 400 °C was purchased from the Gangwon Charmsoot Company, Hoengseong-gun, Gangwon Province, Republic of Korea. The characteristics of biochar were reported by Rajapaksha et al. [33]. Briefly, the biochar had a pH of 10.17, an EC of 2.15 dSm−1 with a mobile matter of 31.42% and a fixed matter of 56.04%, an organic carbon (DOC) of 14.6 mg L−1, and an ash content of 5.03%. The C, H, N, and O contents were 88.71%, 1.21%, 0.36%, and 9.72%, respectively. Furthermore, its molar O/C was 0.08, with a specific surface area of 270.76 m2 g−1, a pore volume of 0.12 cm3 g−1, and a pore diameter of 1.10 mm.

2.2. Experimental Procedure

A pot experiment was laid out following a split-plot design with biochar as a main factor consisting of three application rates (0, 5, and 10 tons∙ha−1) and saline conditions as a sub-factor (non-saline and saline conditions). Non-saline conditions are achieved by irrigating with full tap water during the growth of sugarcane plants. The saline condition was carried out by irrigating with saline solution after 4 weeks of transplanting to plastic pots. Specifically, the sugarcane seedling in each pot was watered with 300 mL of 100 mM NaCl every two days for 2 weeks with a total of 2100 mL NaCl solution. Each of the 180 plastic pots (300 mm diameter × 250 mm height, a surface area of 0.071 m2) was filled with an old alluvial soil obtained from the experimental field at the Vietnam National University of Agriculture, Hanoi, Vietnam. The initial chemical properties of the experimental soil used in this study are shown in Table 1. Each pot contained 10 kg of dry soil. The biochar was applied at 0, 5, and 10 tons ha−1, respectively (equivalent to 0; 35.33 and 70.65 g, respectively, per pot) before transplanting. One week after transplanting, plants in each pot were fertilized weekly with 200 mL of a modified Hoagland’s nutrient solution with a composition of 0.3125 mM KNO3, 0.45 mM Ca(NO3), 0.0625 mM KH2PO4, 0.125 mM MgSO4·7H2O, 11.92 µM H3BO3, 4.57 µM MnCl2·4H2O, 0.191 µM ZnSO4·7H2O, 0.08 µM CuSO4·5H2O, 0.024 µM (NH4)6MO7O24·4H2O, 15.02 µM FeSO4·7H2O, and 23.04 µM Na2EDTA·5H2O.

2.3. Data Collection

Plant height, stem diameter, and chlorophyll content were measured weekly. In addition, dry biomasses of roots, shoots, and leaves; root volume; relative ion leakage; and water saturation deficit in the leaf were measured on the final salinity treatment day and 4 weeks after the final salinity treatment day. The quantum efficiency of photosystem II (Fv/Fm) was recorded from week 4 (pre-treating period) to week 13 (after the treating period).

2.4. Plant Growth and Physiological Responses

2.4.1. Growth Parameters

Plant height; stem diameter; root volume; dry biomasses of shoot, leaves, and root were determined. Root volume was determined using the volume displacement technique of Burdett [34]. The fresh shoot, leaves, and root samples were dried at 80 °C for 72 h in an oven (MOV-212F, Sanyo Electric Co., Ltd., Osaka, Japan) for measuring the dry matter content.

2.4.2. Physiological Parameters

Leaf chlorophyll values (SPAD values) were measured by a chlorophyll meter (SPAD-502 Plus, Konica Minolta Sensing Inc., Osaka, Japan). To allow consistent data in different treatments, the SPAD values were measured in a fully developed leaf with the same position among plants.
The methods used for the measurement of the quantum efficiency of photosystem II (Fv/Fm) and the relative ion leakage were carried out following our previous work [35]. Briefly, the chlorophyll fluorescence emission was evaluated using a modulated fluorometer (Opti-Sciences, OS30p+, Hudson, NH, USA). The initial fluorescence (F0), the maximum fluorescence (Fm), and the maximum quantum efficiency of photosystem II (Fv/Fm) were measured after 30 min of dark adaptation (using a leaf-clip holder) on a fully developed leaf. The measurements were performed between 8:00 to 11:00 in all of the treatments.
On the last day of saline treatments, the relative ion leakages were measured as the leakages of electrolytes from leaves of nine plants of similar size using a conductivity meter (AG 8603, SevenEasy, Mettler Toledo, Switzerland). The segments of the leaf (1 cm2) were harvested, washed, blotted dry, weighted, and then placed in stopped vials filled with an exact volume of deionized water. The stopped vials were then subjected to incubation for 2 h (in darkness, with continuous shaking) to measure the conduction (C1). After this, these vials were heated at 80 °C for 2 h to measure the conduction (C2). The relative ion leakage (%), measured as the percentage of the ion leakage, was then calculated as follows:
Relative   ion   leakage   % = C 1 C 2 × 100 .
Water saturation deficit (WSD) was determined in 1 cm leaf segments according to the method described in Slavík [36] and calculated as follows:
WSD   % = FM 1   FM 0 FM 1 DM × 100
where FM1 is the mass of fully water-saturated leaf segments, FM0 is the initial fresh mass of leaf segments sampled under the experimental conditions, and DM is the dry mass of the same segments.

2.5. Data Analysis and Statistics

Growth and physiological parameters (e.g., plant height, stem diameter, Fv/Fm, chlorophyll content) were gathered from randomly selected 12 plants per treatment to be used for the statistical analysis. Nine plants per treatment were randomly selected for the statistical analysis of remaining growth and physiology parameters (e.g., root volume, dry biomasses of roots, shoots, and leaves, relative ion leakage, and water saturation deficit in the leaf). Data were statistically analyzed using CropStat version 7.2. Mean separations were estimated using Duncan’s multiple range tests and t-test at p ≤ 0.05.

3. Results

3.1. Effects of Salinity and Biochar Application on Sugarcane Growth Responses

Salinity and biochar application significantly affected sugarcane plant growth characteristics including plant height and stem diameter (Figure 1). Although plant height and stem diameter still increased by week, those under salinity conditions were smaller than those under non-salinity. Applying biochar showed an effect in reducing the impact of saline stress on the growth of sugarcane. The differences in plant height and stem diameter of plants between control (non-salinity) and salinity were found to be smallest when applying biochar with 10 tons∙ha−1, followed by 5 tons∙ha−1. Plants without biochar application were recorded with the most severe impact of the salinity condition, as shown by the largest reduction in both plant height and stem diameter (Figure 1).
The saline stress decreased the dry biomasses of stems, leaves, and roots of sugarcane (Table 2). On the final salinity treatment day, the dry biomasses of leaves and roots did not significantly vary among plants growing under non-saline and saline conditions (6.43 and 6.11 g plant−1 for leaf dry biomass, respectively; 1.92 and 1.82 g plant−1 for root dry biomass, respectively). However, significant differences with non-salinity were observed for all dry biomass measurements at 4 weeks after the salinity treatment day. Biochar had significantly positive effects on dry biomasses of stems, leaves, and roots of sugarcane, with the highest values observed in plants applied with 10 tons of biochar ha−1 (Table 2). On the final salinity treatment day, dry biomasses of stems, leaves, and roots of sugarcane without salinity at 10 tons ha−1 of biochar were 4.39, 7.45, and 2.40 g plant−1, respectively, while those at 5 tons ha−1 were 3.81, 6.29, and 1.72 g plant−1, respectively. Similarly, after 4 weeks of final salinity treatment day, dry biomasses of stems, leaves, and roots of sugarcane were also highest with values of 7.33, 8.23, and 2.63 g plant−1, respectively, at the application rate of 10 tons of biochar ha−1. There was no significant interaction between saline and biochar application for the growth parameters of sugarcane plants.
Biochar application also increased root volume with the highest values recorded at the rate of 10 tons ha−1 under both non-saline and saline conditions (Figure 2). There was no significant difference in root volume on the final day of salinity treatment (14 days) between non-salinity and salinity at the same biochar application level (Figure 2A). However, the effects of salinity were seen after 4 weeks of final salinity treatment as a significant decrease in root volume was observed in the salinity treatment compared with non-salinity treatment (Figure 2B).

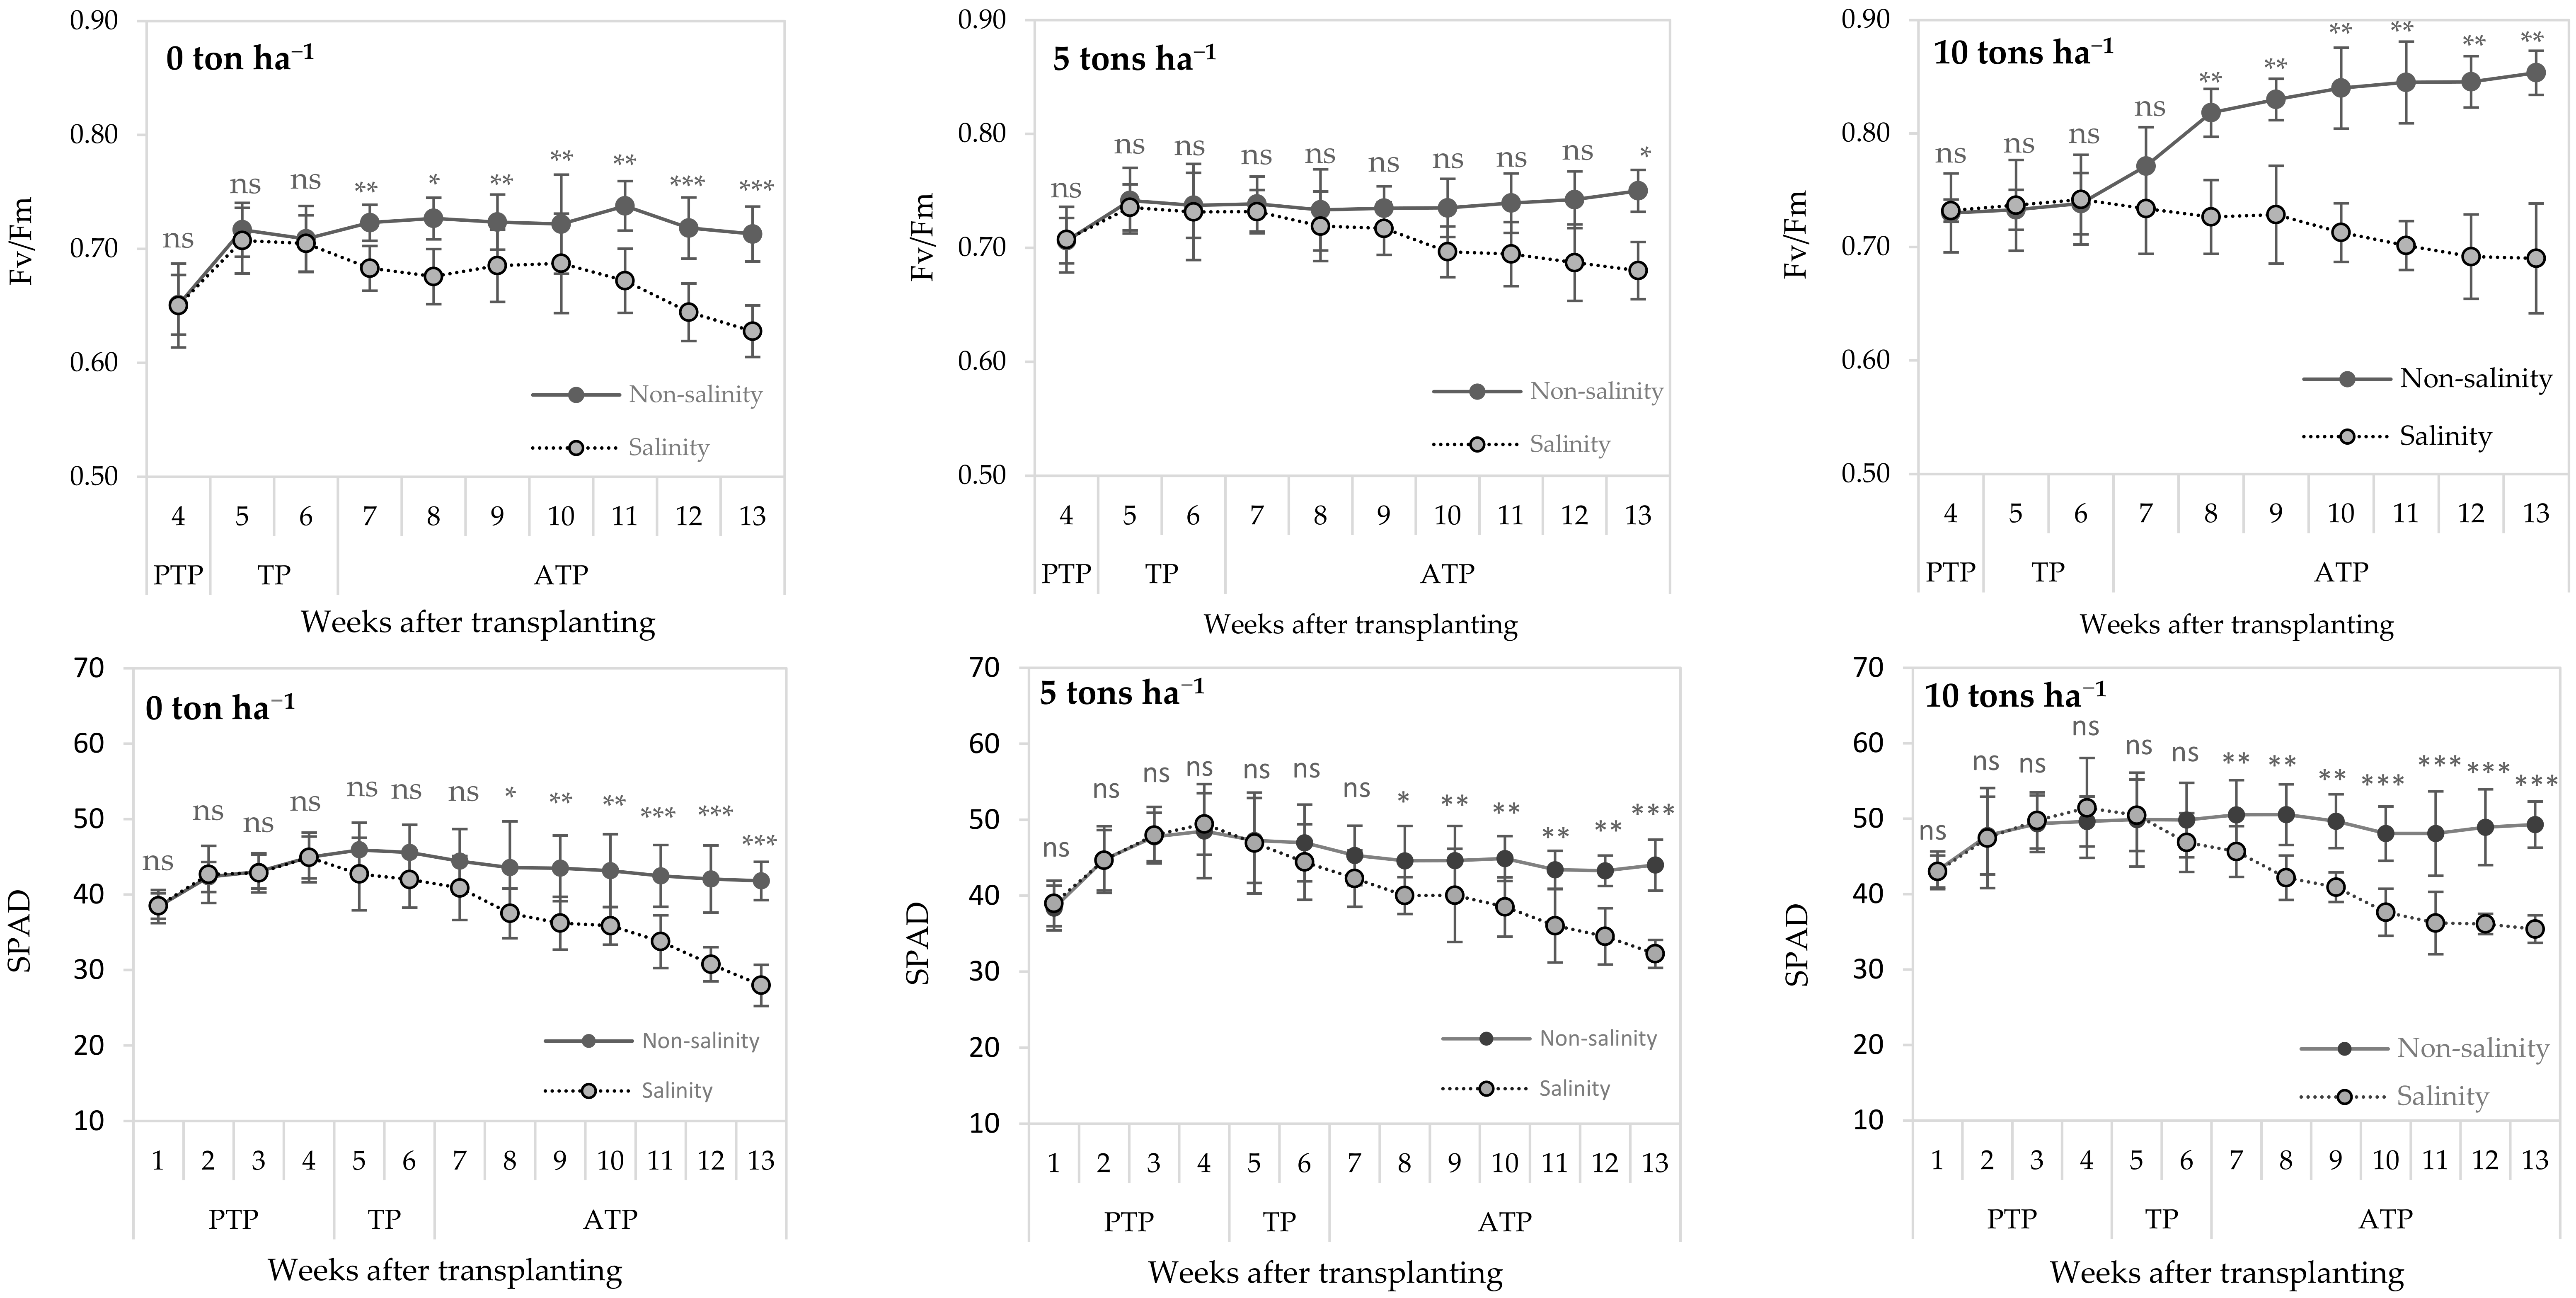
3.2. Effects of Salinity and Biochar Application on Physiological Responses of Sugarcane

Generally, photosynthetic efficiency (Fv/Fm) and chlorophyll content (SPAD) of sugarcane were significantly affected by salinity and decreased over time (Figure 3). Photosynthetic efficiency (Fv/Fm) decreased from week 8 while the chlorophyll content decreased as soon as the salinity treatment was applied. Biochar application also increased photosynthetic efficiency (Fv/Fm) and chlorophyll content with the highest values recorded at the rate of 10 tons ha−1 under both non-saline and saline conditions.
On the final day of salinity treatment, no significant difference in the relative ion leakage was found among three levels of biochar application under non-salinity treatment (Figure 4A). However, the addition of 10 ton ha−1 resulted in significantly lower relative ion leakages compared with that of 0 and 5 tons ha−1 in salinity. In addition, the influences of biochar application were clearly seen at 4 weeks after the salinity treatment (Figure 4B). Biochar significantly reduced the relative ion leakages of sugarcane. This was observed under both salinity and non-salinity conditions. An increase in the level of applied biochar led to a larger reduction in the relative ion leakages with the smallest values of this parameter recorded in plants with 10 tons∙ha−1 of biochar (Figure 4B). Salinity stress had a significant effect on relative ion leakage with higher values at salinity treatment. However, applying biochar minimized the impact of salinity stress which was shown by smaller differences in relative ion leakage values between non-salinity and salinity treatments at biochar-applied treatments compared with non-biochar-applied treatments.
Salinity increased the water saturation deficit in sugarcane leaves (Figure 5). Applying biochar helped reduce the water saturation deficit compared with the control (without biochar). On the final salinity treatment day, an increase in the level of biochar application resulted in a decrease in the water saturation deficit, with the lowest values of this parameter recorded at plants applied with 10 tons∙ha−1 under both saline and non-saline conditions. However, in four weeks after the final salinity treatment day, an increase in biochar from 5 to 10 tons∙ha−1 only helped to decrease the water saturation deficit of plants under saline conditions. The effects of different rates of biochar were not significantly observed in plants in control conditions (non-saline).

4. Discussion

Soil salinity is one of the most widespread forms of environmental stress that results in the reduction in crop productivity [37]. Here, we revealed that salt stress diminished growth characteristics like plant height, stem diameter, and plant dry biomasses of sugarcane plants. These results are in line with previous studies which reported that saline conditions reduced the growth of plants [38], and compromised root and shoot growth. This was probably due to a reduction in the ability of plants to take up water under salinity stress, causing an imbalance in osmotic potential, ionic equilibrium, and nutrient uptake [39]. Furthermore, the saline condition declined the Fv/Fm value and chlorophyll content, but it heightened the water deficit. This was not in keeping with previous studies which concluded that the maximum photochemical efficiency of PSII (Fv/Fm) remained unaffected by salinity [21,40]. This inconsistency might be due to the differences in the severity and duration of the salinity exposed to plants in different experiments. Of note, the significant decrease in Fv/Fm values was only recorded after 8 days with high salinity levels [41]. The decrease in the photosynthetic capacity of plants under salt stress could be linked to a lower stomatal conductance, an impairment in carbon uptake and metabolism, the inhibition of photochemical ability, or the combined effects of all of the above [42,43]. Furthermore, Netondo et al. [8] described that photosynthetic activity decreases when plants are grown up under saline conditions, leading to reduced growth and productivity. The reduction in photosynthesis under salinity was attributed to a decrease in chlorophyll content [44] and the activity of photosystem ΙΙ [45]. Salinity can affect chlorophyll content by inhibiting chlorophyll synthesis or accelerating its degradation [46].
In this study, we found that biochar significantly improved plant growth performances including stem diameter, plant height, and plant dry biomasses. Additionally, the positive influences on the physiological characteristics of sugarcane derived from biochar application were also observed. Application of biochar, specifically with the rate of 10 tons ha−1, had the most significant influence for mitigating the impacts of salinity. Our results agree with the mainstream of the previous reports. The effects of biochar on crop growth and physiology have been well documented [21,41,47] in wheat, watermelon, and lettuce. In sugarcane, Yang et al. [48] confirmed that biochar promoted the root system at the seedling stage. Biochar addition decreased the transpiration rate but increased the net photosynthetic rate during all growth stages and the uptake of macronutrient elements including nitrogen, phosphorus, and potassium at the elongating stage [32]. Chen et al. [31] reported that biochar application reduced soil dry density and increased available moisture, resulting in higher yield and sugar content. Similarly, Tafti revealed that, by applying biochar, crop yield increased in both light- and heavy-texture soil and reduced nutrient losses in subtropical sugarcane production [49]. Under saline stress conditions, Farhangi-Abriz and Torabian [50] also indicated that biochar modifies the oxidative stress in plant tissues of bean seedlings and thereby enhances plant growth. Biochar improved soil nutrient availability, the growth of tomatoes [26], and the growth, yield, and nutrient uptake of wheat [27] under saline water irrigation. In sugarcane, this is the first report on the efficacy of biochar as a practical approach for mitigating the impacts of salinity.
In addition to the above-ground parts, the application of biochar here also increased the root volume of sugarcane plants under both saline and non-saline conditions. Since root volume is a key root trait and was reported to be highly correlated with other root system architecture traits including root length, root surface, and root tip number [51], this suggests that the growth and architecture of the root was improved with biochar. This result was in agreement with previous studies on several crops including maize [52], rice [53], and cotton [54]. The induced improvement of root growth and architecture by biochar can be associated with the improved root–soil interaction environment caused by the changes in soil physicochemical properties. Biochar enriches the soils with nutrients, increases soil water-holding capacity, and promotes soil microbial activity [55].
The positive effects of biochar on sugarcane under salinity can be attributed firstly to the ability of this material to transiently absorb Na+ in the soil [21], thereby lowering the Na+ equilibrium in the soil [56]. This prevents the excessive uptake of Na+ in the soil in sugarcane plants which could lead to ion disequilibrium and ion toxicity. Additionally, biochar helps to dilute the salt content in the soil as it increases the water-holding capacity and soil moisture [21,57]. Last but not least, biochar contains a high amount of plant essential elements such as K, P, and Ca (depending on organic materials and thermal conditions in biochar manufacturing). The increase in the content of these elements in the soil possibly leads to the reduction of Na+ in plants [21]. One of the limitations of our study is that we were unable to evaluate the effects of biochar at the latter growth stages in sugarcane. Thus, future studies aiming at investigating the mitigation effects of biochar for sugarcane under salinity stress are highly recommended, especially in field conditions.

5. Conclusions

Saline stress significantly decreased the growth and photosynthetic efficiency of sugarcane. Applying biochar significantly increased plant height, stem diameter, root volume, dry biomasses of the root, shoot, and leaf, Fv/Fm, and chlorophyll content. Additionally, treatments of biochar decreased the leaf water saturation deficit and the relative ion leakage under both saline and non-saline conditions. Biochar addition also mitigated the negative effect of saline stress on sugarcane growth and physiology. The use of 10 tons ha−1 is suggested for the optimal biochar application for sugarcane in saline-affected soil. However, further study is required to investigate the effects of biochar on sugarcane under saline stress in the field at different growth stages.

Author Contributions

Conceptualization, N.-T.V., T.-K.B. and T.-T.-C.L.; methodology, N.-T.V., T.-K.B., T.-T.-C.L. and D.-C.J.; software, N.-T.V., T.-K.B., T.-T.-C.L. and D.-C.J.; validation, N.-T.V., T.-K.B., T.-T.-C.L., H.-C.Y. and D.-C.J.; formal analysis, N.-T.V., X.-T.N., S.-J.H., T.-T.-C.L. and D.-C.J.; investigation, N.-T.V., T.-K.B., S.-J.L., T.-T.-C.L. and D.-C.J.; resources, N.-T.V. and T.-T.-C.L.; data curation, N.-T.V., T.-K.B., T.-T.-C.L., Y.-H.B., T.-H.D. and D.-C.J.; writing—original draft preparation, N.-T.V., T.-K.B., T.-T.-H.V., T.-H.N., A.-T.T., T.-H.D., N.-L.V., V.-Q.T., V.-G.T., T.-T.-C.L. and D.-C.J.; writing—review and editing, N.-T.V., T.-K.B., T.-T.-H.V., Y.-H.K., T.-H.D., T.-H.D. and D.-C.J.; project administration, N.-T.V. All authors have read and agreed to the published version of the manuscript.

Funding

This research was funded by grants from the key project of the Vietnam National University of Agriculture (T2021-01-02 TÐ) and Basic Science Research Program through the National Research Foundation of Korea (NRF) funded by the Ministry of Education (grant number) (NRF-2022R1I1A1A01054769).

Institutional Review Board Statement

Not applicable.

Informed Consent Statement

Not applicable.

Data Availability Statement

The data presented in this study are available from the corresponding author upon request.

Conflicts of Interest

The authors declare no conflict of interest.

References

  1. Hang, R.; Wang, Y.; Hussain, S.; Yang, S.; Li, R.; Liu, S.; Chen, Y.; Wei, H.; Dai, Q.; Hou, H. Study on the effect of salt stress on yield and grain quality among different rice varieties. Front. Plant Sci. 2022, 13, 918460. [Google Scholar] [CrossRef]
  2. Takeda, S.; Matsuoka, M. Genetic approaches to crop improvement: Responding to environmental and population changes. Nat. Rev. Genet. 2008, 9, 444–457. [Google Scholar] [CrossRef] [PubMed]
  3. Kumar, P.; Sharma, P.K. Soil salinity and food security in India. Front. Sustain. Food Syst. 2020, 4, 533781. [Google Scholar] [CrossRef]
  4. Saifullah; Dahlawi, S.; Naeem, A.; Rengel, Z.; Naidu, R. Biochar application for the remediation of salt-affected soils: Challenges and opportunities. Sci. Total Envion. 2018, 625, 320–335. [Google Scholar] [CrossRef]
  5. Gupta, B.; Huang, B. Mechanism of salinity tolerance in plants: Physiological, biochemical, and molecular characterization. Int. J. Genom. 2014, 2014, 701596. [Google Scholar] [CrossRef] [Green Version]
  6. Demiral, T.; Turkan, I. Exogenous glycinebetaine affects growth and proline accumulation and retards senescence in two rice cultivars under NaCl stress. Environ. Exp. Bot. 2006, 56, 72–79. [Google Scholar] [CrossRef]
  7. Maggio, A.; Raimondi, G.; Martino, A.; Pascale, S.D. Salt stress response in tomato beyond the salinity tolerance threshold. Environ. Exp. Bot. 2007, 59, 276–282. [Google Scholar] [CrossRef]
  8. Netondo, G.W.; Onyango, J.C.; Beck, E. Sorghum and salinity: II. Gas exchange and chlorophyll fluorescence of sorghum under salt stress. Crop Sci. 2004, 44, 806–811. [Google Scholar] [CrossRef]
  9. James, R.A.; Blake, C.; Byrt, C.S.; Munns, R. Major genes for Na+ exclusion, Nax1 and Nax2 (wheat HKT1; 4 and HKT1; 5), decrease Na+ accumulation in bread wheat leaves under saline and waterlogged conditions. J. Exp. Bot. 2011, 62, 2939–2947. [Google Scholar] [CrossRef] [Green Version]
  10. Patade, V.Y.; Suprasanna, P.; Bapat, V.A. Effects of salt stress in relation to osmotic adjustment on sugarcane (Saccharum officinarum L.) callus cultures. Plant Growth Regul. 2008, 55, 169–173. [Google Scholar] [CrossRef]
  11. Simões, W.L.; Calgaro, M.; Coelho, D.S.; Santos, D.B.D.; Souza, M.A.D. Growth of sugar cane varieties under salinity. Rev. Ceres 2016, 63, 265–271. [Google Scholar] [CrossRef] [Green Version]
  12. Zhao, D.; Zhu, K.; Momotaz, A.; Gao, X. Sugarcane plant growth and physiological responses to soil salinity during tillering and stalk elongation. Agriculture 2020, 10, 608. [Google Scholar] [CrossRef]
  13. Yunita, R.; Hartati, S.R.; Suhesti, S.; Syafaruddin. Response of bululawang sugarcane variety to salt stress. In IOP Conference Series: Earth and Environmental Science; IOP Publishing: Chiyoda, Tokyo, 2020. [Google Scholar] [CrossRef]
  14. Watanabe, K.; Takaragawa, H.; Ueno, M.; Kawamitsu, Y. Changes in agronomic and physiological traits of sugarcane grown with saline irrigation water. Agronomy 2020, 10, 722. [Google Scholar] [CrossRef]
  15. Zhao, D.; Li, Y.R. Climate change and sugarcane production: Potential impact and mitigation strategies. Int. J. Agron. 2015, 2015, 547386. [Google Scholar] [CrossRef] [Green Version]
  16. Joseph, S.D.; Camps-Arbestain, M.; Lin, Y.; Munroe, P.; Chia, C.H.; Hook, J.; Van Zwieten, L.; Kimber, S.; Cowie, A.; Singh, B.P.; et al. An investigation into the reactions of biochar in soil. Aust. J. Soil. Res. 2010, 48, 501–515. [Google Scholar] [CrossRef]
  17. Tomczyk, A.; Sokolowska, Z.; Boguta, P. Biochar physicochemical properties: Pyrolysis temperature and feedstock kind effects. Rev. Environ. Sci. Biotechnol. 2020, 19, 191–215. [Google Scholar] [CrossRef] [Green Version]
  18. Ippolito, J.A.; Cui, L.; Kammann, C.; Wrage-Mönnig, N.; Estavillo, J.M.; Fuertes-Mendizabal, T.; Cayuela, M.L.; Sigua, G.; Novak, J.; Spokas, K.; et al. Feedstock choice, pyrolysis temperature and type influence biochar characteristics: A comprehensive meta-data analysis review. Biochar 2020, 2, 421–438. [Google Scholar] [CrossRef]
  19. Qiu, M.; Sun, K.; Jin, J.; Gao, B.; Yan, Y.; Han, L.; Wu, F.; Xing, B. Properties of the plant-and manure-derived biochars and their sorption of dibutyl phthalate and phenanthrene. Sci. Rep. 2014, 4, 5295. [Google Scholar] [CrossRef] [Green Version]
  20. Awan, S.; Ippolito, J.A.; Ullman, J.L.; Ansari, K.; Cui, L.; Siyal, A.A. Biochars reduce irrigation water sodium adsorption ratio. Biochar 2021, 3, 77–87. [Google Scholar] [CrossRef]
  21. Akhtar, S.S.; Andersen, M.N.; Liu, F. Residual effects of biochar on improving growth, physiology and yield of wheat under salt stress. Agric. Water Manag. 2015, 158, 61–68. [Google Scholar] [CrossRef]
  22. Chintala, R.; Mollinedo, J.; Schumacher, T.E.; Malo, D.D.; Julson, J.L. Effect of biochar on chemical properties of acidic soil. Arch. Agron. Soil Sci. 2014, 60, 393–404. [Google Scholar] [CrossRef]
  23. Akhtar, S.S.; Li, G.; Andersen, M.N.; Liu, F. Biochar enhances yield and quality of tomato under reduced irrigation. Agric. Water Manag. 2014, 138, 37–44. [Google Scholar] [CrossRef]
  24. Elshaikh, N.A.; Zhipeng, L.; Dongli, S.; Timm, L.C. Increasing the okra salt threshold value with biochar amendments. J. Plant Interact. 2017, 3, 51–63. [Google Scholar] [CrossRef] [Green Version]
  25. Sappor, D.K.; Osei, B.A.; Ahmed, M.R. Reclaiming sodium affected soil: The potential of organic amendments. Int. J. Plant Soil Sci. 2017, 16, 1–11. [Google Scholar] [CrossRef] [Green Version]
  26. Usman, A.R.A.; AL-Wabel, M.I.; OK, Y.S.; Al-Harbi, A.; Wahb-Allah, M.; El-Naggar, A.H.; Ahmad, M.; Al-Faraj, A.; Al-Omran, A. Conocarpus biochar induces changes in soil nutrient availability and tomato growth under saline irrigation. Pedosphere 2016, 26, 27–38. [Google Scholar] [CrossRef]
  27. Lashari, M.S.; Liu, Y.M.; Li, L.Q.; Pan, W.N.; Fu, J.Y.; Pan, G.X.; Zheng, J.F.; Zheng, J.W.; Zhang, X.H.; Yu, X.Y. Effects of amendment of biochar–manure compost in conjunction with pyroligneous solution on soil quality and wheat yield of a salt-stressed cropland from central China Great Plain. Field Crops Res. 2013, 144, 113–118. [Google Scholar] [CrossRef]
  28. VSSA. Annual Report of Sugar Production of Season 2020–2021 and Production Plan for Season 2021–2022; Vietnam Sugarcane and Sugar Association: Ho Chi Minh City, Vietnam, 2021. [Google Scholar]
  29. MARD. Reviewing and Adjusting the Sugarcane Development Plan to 2020, with a Vision to 2030; The Final Report of the Ministerial Project; Ministry of Agriculture and Rural Development of Vietnam: Hanoi, Vietnam, 2016; p. 305.
  30. Van Tan, L.; Thanh, T. The effects of salinity on changes in characteristics of soils collected in a saline region of the Mekong Delta, Vietnam. Open Chem. 2021, 19, 471–480. [Google Scholar] [CrossRef]
  31. Chen, Y.; Shinogi, Y.; Taira, M. Influence of biochar use on sugarcane growth, soil parameters, and groundwater quality. Aust. J. Soil Res. 2010, 48, 526–530. [Google Scholar] [CrossRef]
  32. Liao, F.; Yang, L.; Li, Q.; Xue, J.; Li, Y.; Huang, D.; Yang, L. Effect of biochar on growth, photosynthetic characteristics and nutrient distribution in sugarcane. Sugar Tech. 2019, 21, 289–295. [Google Scholar] [CrossRef]
  33. Rajapaksha, A.U.; Ok, Y.S.; El-Naggar, A.; Kim, H.; Song, F.; Kang, S.; Tsang, Y.F. Dissolved organic matter characterization of biochars produced from different feedstock materials. J. Environ. Manag. 2019, 233, 393–399. [Google Scholar] [CrossRef]
  34. Burdett, A.N. A non-destructive method for measuring the volume of intact plant parts. Can. J. For. Res. 1979, 9, 120–122. [Google Scholar] [CrossRef]
  35. Hoang, T.L.H.; Jang, D.C.; Nguyen, Q.T.; Na, W.H.; Kim, I.S.; Vu, N.T. Biochar-improved growth and physiology of Ehretia asperula under water-deficit condition. Appl. Sci. 2021, 11, 10685. [Google Scholar] [CrossRef]
  36. Slavík, B. Relationship between the osmotic potential of cell sap and the water saturation deficit during the wilting of leaf tissue. Biol. Plant. 1963, 5, 258–264. [Google Scholar] [CrossRef]
  37. Pitman, M.G.; Lauchi, A. Global impact of salinity and agricultural ecosystems. In Salinity: Environment-Plants–Molecules; Läuchli, A., Lüttge, U., Eds.; Springer: Amsterdam, The Netherlands, 2002; pp. 3–20. [Google Scholar]
  38. Ghoulam, C.; Foursy, A.; Fares, K. Effects of salt stress on growth, inorganic ions and proline accumulation in relation to osmotic adjustment in five sugar beet cultivars. Environ. Exp. Bot. 2002, 47, 39–50. [Google Scholar] [CrossRef]
  39. Niu, X.; Bressan, R.A.; Hasegwa, P.M.; Pardo, J.M. Ion homeostasis in NaCl stress environments. Plant Physiol. 1995, 109, 735–742. [Google Scholar] [CrossRef] [Green Version]
  40. Jimenez, M.S.; Gonzalez-Rodriguez, A.M.; Morales, D.; Cid, M.C.; Socorro, A.R.; Caballero, M. Evaluation of chlorophyll fluorescence as a tool for salt stress detection in roses. Photosynthetica 1997, 33, 291–301. [Google Scholar] [CrossRef]
  41. Shin, Y.K.; Bhandari, S.R.; Lee, J.G. Monitoring of salinity, temperature, and drought stress in grafted watermelon seedlings using chlorophyll fluorescence. Front. Plant Sci. 2021, 12, 2913. [Google Scholar] [CrossRef]
  42. Seemann, J.R.; Critchley, C. Effects of salt stress on the growth, ion content, stomatal behaviour and photosynthetic capacity of a salt-sensitive species, Phaseolus vulgaris L. Planta 1985, 164, 151–162. [Google Scholar] [CrossRef]
  43. Dubey, R.S. Photosynthesis in plants under stressful conditions. In Handbook of Photosynthesis; Pessarakli, M., Ed.; Marcel Dekker: New York, NY, USA, 1997; pp. 859–875. [Google Scholar]
  44. Jamil, M.; Rehman, S.; Lee, K.J.; Kim, J.M.; Kim, H.S.; Rha, E.S. Salinity reduced growth PS II photochemistry and chlorophyll content in radish. Sci. Agric. 2007, 64, 1–10. [Google Scholar] [CrossRef] [Green Version]
  45. Ganivea, R.A.; Allahverdiyev, S.R.; Guseinova, N.B.; Kavakli, H.I.; Nafisi, S. Effect of salt stress and synthetic hormone polystimuline K on the photosynthetic activity of cotton (Gossypium hirsutum). Turk. J. Bot. 1998, 22, 217–221. [Google Scholar]
  46. Reddy, M.P.; Vora, A.B. Changes in pigment composition, hill reaction activity and saccharides metabolism in bajra (Pennisetum typhoides S&H) leaves under NaCl salinity. Photosynthetica 1986, 20, 50–55. [Google Scholar]
  47. Bonanomi, G.; Ippolito, F.; Cesarano, G.; Nanni, B.; Lombardi, N.; Rita, A.; Saracino, A.; Scala, F. Biochar as plant growth promoter: Better off alone or mixed with organic amendments? Front. Plant Sci. 2017, 8, 1570. [Google Scholar] [CrossRef] [PubMed] [Green Version]
  48. Yang, L.; Liao, F.; Huang, M.; Yang, L.T.; Li, Y.R. Biochar improves sugarcane seedling root and soil properties under a pot experiment. Sugar Tech. 2015, 17, 36–40. [Google Scholar] [CrossRef]
  49. Tafti, N.; Wang, J.; Gaston, L.; Park, J.H.; Wang, M.; Pensky, S. Agronomic and environmental performance of biochar amendment in alluvial soils under subtropical sugarcane production. Agrosyst. Geosci. Environ. 2021, 4, e20209. [Google Scholar] [CrossRef]
  50. Farhangi-Abriz, S.; Torabian, S. Antioxidant enzyme and osmotic adjustment changes in bean seedlings as affected by biochar under salt stress. Ecotoxicol. Environ. Saf. 2017, 137, 64–70. [Google Scholar] [CrossRef]
  51. Bui, K.T.; Naruse, T.; Yoshida, H.; Toda, Y.; Omori, Y.; Tsuda, M.; Kaga, A.; Yamasaki, Y.; Tsujimoto, H.; Ichihashi, Y.; et al. Effects of irrigation on root growth and development of soybean: A 3-year sandy field experiment. Front. Plant Sci. 2022, 13, 5012. [Google Scholar] [CrossRef]
  52. Abiven, S.; Hund, A.; Martinsen, V.; Cornelissen, G. Biochar amendment increases maize root surface areas and branching: A shovelomics study in Zambia. Plant Soil 2015, 395, 45–55. [Google Scholar] [CrossRef] [Green Version]
  53. Liu, B.; Li, H.; Li, H.; Zhang, A.; Rengel, Z. Long-term biochar application promotes rice productivity by regulating root dynamic development and reducing nitrogen leaching. Glob. Chang. Biol. Bioenergy 2021, 13, 257–268. [Google Scholar] [CrossRef]
  54. Feng, L.; Xu, W.; Tang, G.; Gu, M.; Geng, Z. Biochar induced improvement in root system architecture enhances nutrient assimilation by cotton plant seedlings. BMC Plant Biol. 2021, 21, 269. [Google Scholar] [CrossRef]
  55. Chang, Y.; Rossi, L.; Zotarelli, L.; Gao, B.; Shahid, M.A.; Sarkhosh, A. Biochar improves soil physical characteristics and strengthens root architecture in Muscadine grape (Vitis rotundifolia L.). Chem. Biol. Technol. Agric. 2021, 8, 7. [Google Scholar] [CrossRef]
  56. Liang, B.; Lehmann, J.; Solomon, D.; Kinyangi, J.; Grossman, J.; O’Neill, B.; Skjemstad, J.O.; Thies, J.; Luizão, F.J.; Petersen, J.; et al. Black carbon increases cation exchange capacity in soils. Soil Sci. Soc. Am. J. 2006, 70, 1719–1730. [Google Scholar] [CrossRef] [Green Version]
  57. Wang, S.J.; Zheng, J.L.; Wang, Y.J.; Yang, Q.F.; Chen, T.T.; Chen, Y.L.; Chi, D.C.; Xia, G.M.; Siddique, K.H.M.; Wang, T.L. Photosynthesis, chlorophyll fluorescence, and yield of peanut in response to biochar application. Front. Plant Sci. 2021, 12, 650432. [Google Scholar] [CrossRef]
Figure 1. Plant height and stem diameter of sugarcane in response to salinity treatments under 0, 5, and 10 tons of biochar ha−1. Vertical bars represent mean ± SD, n = 12. Significance levels (t-test): ns: non-significant; *: p < 0.05; **: p < 0.01; ***: p < 0.001.
Applsci 13 07708 g001
Figure 2. Root volume of sugarcane in response to biochar treatments of 0, 5, and 10 tons ha−1 under non-saline and saline conditions on the final treatment day (A) and 4 weeks after the final treatment day (B). Vertical bars represent ± SD, n = 9. Different letters showed significance among biochar rates under non-salinity (capital letters) and salinity (lowercase letters), respectively, by Duncan’s multiple range tests at p ≤ 0.05. For salinity treatment, significance levels (t-test) are demonstrated as follows: ns: non-significant; *: p < 0.05.
Applsci 13 07708 g002
Figure 3. The quantum efficiency of photosystem II (Fv/Fm) and chlorophyll content (SPAD) of sugarcane in response to salinity treatments under 0, 5, and 10 tons of biochar ha−1. Vertical bars represent mean ± SD, n = 12. PTP: Pre-treating period, TP: Treating period, ATP: After treating period. Significance levels (t-test): ns: non-significant; *: p < 0.05; **: p < 0.01; ***: p < 0.001.
Applsci 13 07708 g003
Figure 4. Relative ion leakage of sugarcane in response to biochar treatments of 0, 5, and 10 tons ha−1 under non-saline and saline conditions on the final treatment day (A) and 4 weeks after the final treatment day (B). Vertical bars represent ± SD, n = 9. Different letters showed significance among biochar rates under non-salinity (capital letters) and salinity (lowercase letters), respectively, by Duncan’s multiple range tests at p ≤ 0.05. For salinity treatment, significance levels (t-test) are demonstrated as follows: ns: non-significant; *: p < 0.05.
Applsci 13 07708 g004
Figure 5. Water saturation deficit of sugarcane leaves in response to biochar treatments of 0, 5, and 10 tons ha−1 under non-saline and saline conditions on the final treatment day (A) and 4 weeks after the final treatment day (B). Vertical bars represent ± SD, n = 9. Different letters showed significance among biochar rates under non-salinity (capital letters) and salinity (lowercase letters), respectively, by Duncan’s multiple range tests at p ≤ 0.05. For salinity treatment, significance levels (t-test) are demonstrated as follows: ns: non-significant; *: p < 0.05; **: p < 0.01; ***: p < 0.001.
Applsci 13 07708 g005
Table 1. The initial chemical properties of the experimental soil.
ParametersValues
Total N (%)0.09
Total P (%)0.18
Total K (%)1.33
Exchangeable N (mg/100 g)4.25
Exchangeable P (mg/100 g)50.05
Exchangeable K (mg/100 g)11.75
Organic matter (%)1.65
pH6.35
Table 2. Dry biomasses of roots, stems, and leaves of sugarcane in response to biochar treatments of 0, 5, and 10 tons ha−1 under non-saline and saline conditions.
Salinity TreatmentBiochar Application Rates
(tons ha−1)
Final Salinity Treatment Day4 Weeks after the Final Salinity Treatment Day
Stem
(g plant−1)
Leaves
(g plant−1)
Root
(g plant−1)
Stem
(g plant−1)
Leaves
(g plant−1)
Root
(g plant−1)
Non-salinity03.76 b Z5.39 c1.60 b6.14 b7.93 b2.20 c
53.86 b6.36 b1.75 b7.82 a8.41 a2.70 b
104.51 a7.53 a2.42 a8.43 a8.99 a2.98 a
Salinity03.16 c4.74 c1.41 c4.38 c6.66 c1.64 d
53.76 b6.21 b1.68 b5.35 bc7.35 bc2.17 c
104.26 a7.37 a2.37 a6.23 b7.47 b2.27 c
CV% Y5.46.56.18.45.43.0
LSD X 0.05 T W B V0.380.750.210.970.760.13
Average of treating conditionNon-salinity4.04 A U6.43 A1.92 A7.46 A8.44 A2.63 A
Salinity3.73 B6.11 A1.82 A5.32 B7.16 B2.03 B
LSD 0.05 T0.220.430.120.560.440.52
Average of biochar rates03.46 C5.07 C1.51 C5.26 C7.29 B1.92 B
53.81 B6.29 B1.72 B6.58 B7.88 A2.44 A
104.39 A7.45 A2.40 A7.33 A8.23 A2.63 A
LSD 0.05 B0.260.530.150.690.540.69
Z Different lowercase letters show interaction significance among biochar rates and treating conditions at p ≤ 0.05. Y CV: Coefficient of variation. X LSD: Least significant difference. W T: Treating condition (non-saline condition and saline condition). V B: Biochar rates. U Different capital letters show significance among biochar rates or significance between treating conditions by Duncan’s multiple range tests at p ≤ 0.05.
Disclaimer/Publisher’s Note: The statements, opinions and data contained in all publications are solely those of the individual author(s) and contributor(s) and not of MDPI and/or the editor(s). MDPI and/or the editor(s) disclaim responsibility for any injury to people or property resulting from any ideas, methods, instructions or products referred to in the content.

