Abstract
The accurate prediction and evaluation of stress and displacement fields of surrounding rock is the fundamental premise for the deformation control of soft rock tunnels under high geo-stress condition. However, due to the complicated mechanical characteristics of soft rock with confining pressure influence, the current numerical simulation method usually regards the mechanical parameters of surrounding rock as constant and ignores the variation of these parameters in the simulation process, which leads to results that cannot accurately reflect the mechanical behavior of surrounding rock. Therefore, this paper firstly investigates the effect of confining pressure on deformation and strength parameters for soft rock and proposes corresponding variable models for mechanical parameters with the confining pressure influence. Secondly, a transversal loop discriminant update procedure is proposed and introduced into the iteration calculation process of FLAC3D, thus forming an improved numerical simulation method. This improved method can integrally consider the mechanical parameter variation of surrounding rock with variable confining pressure and realize the automatic update for such a parameter with its variable stress state. Finally, as an application example, an improved expression of longitudinal deformation profile (LDP) for tunnels considering the confining pressure influence is proposed based on numerous simulation results for a soft rock tunnel obtained by this proposed method.
1. Introduction
Large deformations in tunnels frequently occur in soft rock strata under high geo-stress conditions. Large deformations in tunnels easily cause support structure failure and endanger the safety of construction personnel [1,2,3]. To effectively address the large deformation problem of tunnels, there are two fundamental problems to solve in advance: the confining pressure influence on the soft rock mechanical characteristics and the displacement field prediction and evaluation of surrounding rock considering the confining pressure influence [4,5]. These two problems are the current research hotspots, which have significant meaning for the large deformation problem of tunnels [6,7]. Therefore, numerous scholars have focused on the abovementioned problems and have had many achievements in recent decades.
Regarding the mechanical characteristic variation of soft rock with confining pressure influence, the stress–strain curves of soft rock under different confining pressure conditions are obtained by triaxial experiments, and the confining pressure influence on the mechanical characteristics for soft rock has been investigated, including peak strength, failure pattern, and stress–strain curve pattern [8,9,10,11,12]. Moreover, a series of strength criteria have been proposed according to experimental results, such as the generalized Zhang–Zhu strength criterion (GZZ strength criterion), uniform strength criterion, etc. [10,13,14]. However, most previous studies only focus on the strength aspect of soft rock but neglect the deformation aspect. Therefore, the first purpose of this study is investigating the effect of confining pressure on the strength and deformation of soft rock.
For the displacement field prediction and evaluation of surrounding rock considering the confining pressure influence, many scholars have proposed many new analytical solutions to calculate such a field [15,16,17]. However, there are two defects in these analytical solutions: (1) the assumptions of the analytical solutions are usually for circular tunnels, and the initial stress state is a hydrostatic stress state, and (2) the analytical solutions hardly consider the complex construction process of tunnels, which leads to solutions that are difficult to apply widely in practical soft rock tunnels. As an alternative, the numerical simulation method has been widely adopted in all aspects of engineering, with its advantages of low cost, time saving and repeatability [18,19]. However, for tunnel engineering, the current conventional numerical simulation method for the displacement field of surrounding rock usually inputs mechanical parameters prior to calculation, and these parameters are regarded as constant during the calculation process, which leads the numerical simulation process not reflecting the confining pressure influence on mechanical characteristics and leads the numerical simulation results to clearly deviate from the in situ soft rock tunnel. Therefore, a series of new constitutive models have been established in numerical simulation methods to describe the confining pressure influence on the mechanical characteristics of soft rock; these models include the strain-hardening, Mohr–Coulomb, plastic-hardening, and Hoek–Brown constitutive models [20]. However, these constitutive models mostly focus on the confining pressure effect on strength aspects but neglect the deformation aspect. Meanwhile, the parameters of some new constitutive models are too complex to be generated widely. Therefore, another purpose of this study is proposing a numerical simulation method which can integrally consider the confining pressure effect on the strength and deformation aspects of soft rock, so that results of such a simulation can more realistically reflect the practical displacement field of surrounding rock for soft rock.
Therefore, this paper first investigates the mechanical parameter variation of soft rock with variable confining pressure and proposes corresponding variable models for the mechanical parameters (elasticity modulus (E), Poisson ratio (v), cohesion (c) and friction angle (φ)) of soft rock with variable confining pressure. Second, by combining variable models for the mechanical parameter of soft rock, the traversal loop discriminant update procedure is proposed to improve the numerical simulation method. Finally, to demonstrate the application of the improved numerical simulation method, an improved expression of the longitudinal deformation profile (LDP) for soft rock is proposed based on numerous numerical simulation results for soft rock tunnels obtained by this method.
2. Variable Model for Mechanical Parameter of Phyllite with Confining Pressure Influence
2.1. Variable Model for Elasticity Modulus of Phyllite
According to triaxial experimental results from previous references (the triaxial experimental information and reference source is listed in Table 1), the elasticity modulus variation of phyllite with variable confining pressure is shown in Figure 1.

Table 1.
Triaxial experimental result sources for elasticity modulus of phyllite.
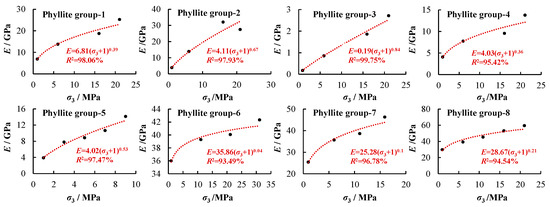
Figure 1.
Elasticity modulus variation with the confining pressure influence for phyllite.
As shown in Figure 1, the elasticity modulus (E) gradually increases with increasing confining pressure (σ3) and does not remain constant. In order to propose the nondimensional variable model to describe the elasticity modulus variation, the dimensionless process is carried out with the result data. In the nondimensional variable model, the stress–strength ratio () is regarded as the X-axis, and is the uniaxial compression strength of rock; is regarded as the Y-axis, and is the elasticity modulus under the 0 MPa confining pressure condition. By the mathematical statistics method, the nondimensional variable model for the elasticity modulus is proposed in Figure 2, whose form is a power function. Additionally, in the variable model for the elasticity modulus, AE and BE are undetermined parameters, which can be obtained by experimental test.
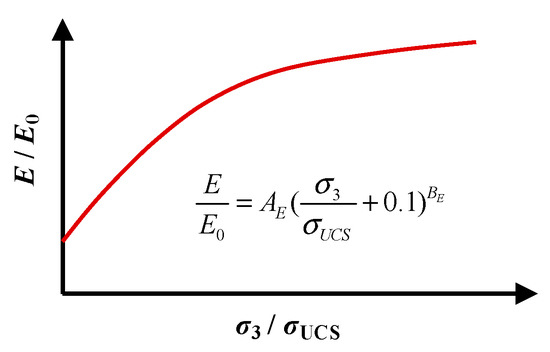
Figure 2.
The nondimensional variable model for elasticity modulus.
2.2. Variable Model for Poisson Ratio of Phyllite
According to triaxial experimental results from previous references (the triaxial experimental information and reference source is listed in Table 2), the Poisson ratio variation of phyllite with variable confining pressure is shown in Figure 3.
Table 2.
Triaxial experimental result sources for Poisson ratio of phyllite.
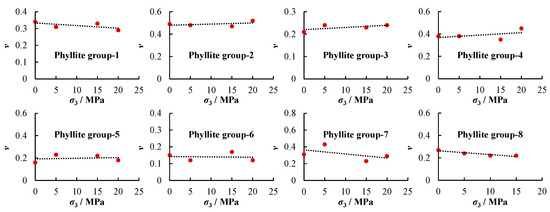
Figure 3.
Poisson ratio variation with the confining pressure influence for phyllite.
As shown in Figure 3, the Poisson ratio of soft rock has poor sensitivity to the confining pressure, and the value of the Poisson ratio under different confining pressure conditions is basically equal to that with 0 MPa confining pressure. In order to propose the nondimensional variable model to describe the Poisson ratio variation, the dimensionless process is carried out with the result data. In the nondimensional variable model, the stress–strength ratio () is regarded as the X-axis, and the Poisson ratio is regarded as the Y-axis. By the mathematical statistics method, the nondimensional variable model for the Poisson ratio is proposed in Figure 4, whose form is a constant function. Additionally, in the variable model for the Poisson ratio, v0 is the undetermined parameters, which equals the Poisson ratio under the 0 MPa confining pressure condition and can be obtained by experimental test.
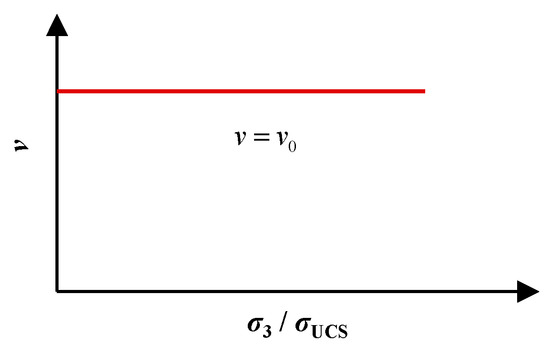
Figure 4.
The nondimensional variable model for Poisson ratio.
2.3. Variable Model for Friction Angle of Phyllite
According to triaxial experimental results from previous references (the triaxial experimental information and reference source is listed in Table 3), the friction angle variation of phyllite with variable confining pressure is shown in Figure 5.
Table 3.
Triaxial experimental result sources for friction angle and cohesion.
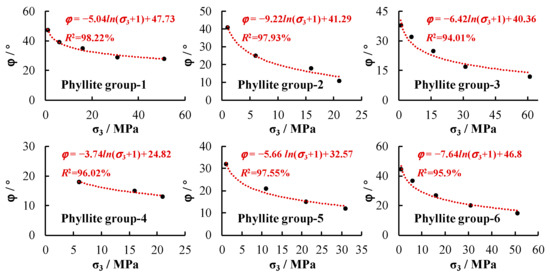
Figure 5.
Friction angle variation with the confining pressure influence for phyllite.
As shown in Figure 5, the friction angle (φ) gradually decreases with increasing confining pressure (σ3) and does not remain constant. In order to propose the nondimensional variable model to describe the friction angle variation, the dimensionless process is carried out with the result data. In the nondimensional variable model, the stress–strength ratio () is regarded as the X-axis, is regarded as the Y-axis and is the friction angle under the 0 MPa confining pressure condition. By the mathematical statistics method, the nondimensional variable model for the friction angle is proposed in Figure 6, whose form is a logarithmic function. Additionally, in the variable model for the friction angle, Aφ and Bφ are undetermined parameters, which can be obtained by experimental test.
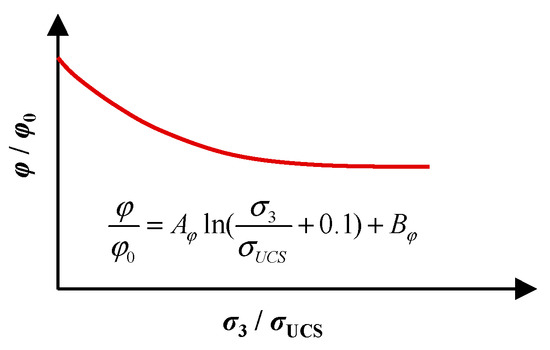
Figure 6.
The nondimensional variable model for friction angle.
2.4. Variable Model for Cohesion of Phyllite
According to triaxial experimental results from previous references (the triaxial experimental information and reference source is listed in Table 3), the cohesion variation of phyllite with variable confining pressure is shown in Figure 7.
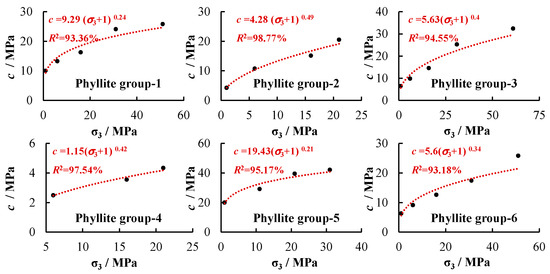
Figure 7.
Cohesion variation with the confining pressure influence for phyllite.
As shown in Figure 7, the cohesion gradually increases with increasing confining pressure and does not remain constant. In order to propose the nondimensional variable model to describe the friction angle variation, the dimensionless process is carried out with the result data. In the nondimensional variable model, the stress–strength ratio () is regarded as the X-axis, is regarded as the Y-axis and is the cohesion under the 0 MPa confining pressure condition. By the mathematical statistics method, the nondimensional variable model for cohesion is proposed in Figure 8, whose form is a power function. Additionally, in the variable model for cohesion, Ac and Bc are undetermined parameters, which can be obtained by experimental test.
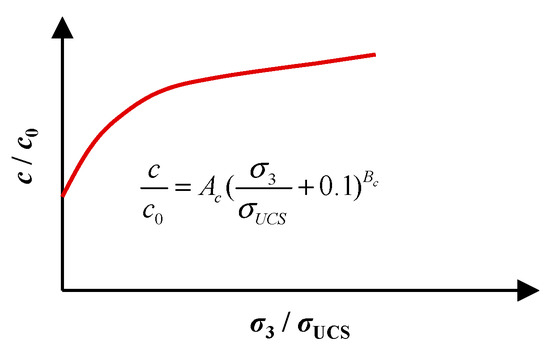
Figure 8.
The nondimensional variable model for cohesion.
3. Numerical Simulation Method of FLAC3D Considering Mechanical Characteristic Variation of Soft Rock with Confining Pressure Influence
After tunnel excavation, according to the secondary stress state of the surrounding rock and the mechanical characteristic variations for soft rock, the mechanical parameters of the surrounding rock vary with the variable radial stress in Figure 9a.
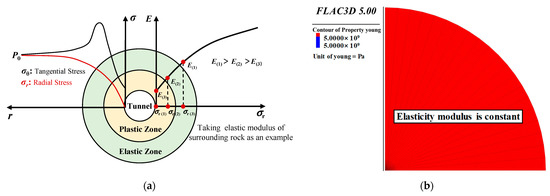
Figure 9.
(a) Mechanical parameter variation of surrounding rock and (b) elasticity modulus contour from the conventional numerical simulation method of FLAC3D.
However, the conventional numerical simulation method of FLAC3D for tunnel excavation usually inputs the parameters of the surrounding rock prior to calculation, and such parameters are regarded as constant during the calculation process, which leads the conventional numerical simulation method to ignore the confining pressure influence on the mechanical characteristics of the surrounding rock in Figure 9b and leads the numerical simulation result to deviate greatly from the practical soft rock tunnel.
Therefore, to realize the numerical simulation method of FLAC3D to integrally consider the confining pressure influence on the mechanical characteristics of surrounding rock, this paper proposes the traversal loop discriminant update procedure with the FISH language and improves the numerical simulation method of FLAC3D by this procedure; this can realize the automatic update for mechanical parameters of surrounding rock according to its stress state. The numerical simulation method of FLAC3D considering the mechanical characteristic variations of soft rock with the confining pressure influence is shown in Figure 10.
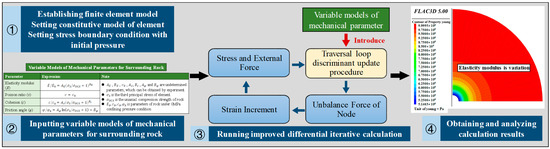
Figure 10.
Numerical simulation method of FLAC3D considering the mechanical characteristic variations of soft rock with confining pressure influence.
3.1. Improved Iteration Calculation Process of FLAC3D
To make all zones representing the surrounding rock automatically update their mechanical parameters according to their stress state in the calculation process of FLAC3D, this paper proposes the traversal loop discriminant update procedure with the FISH language and zone functions of FLAC3D.
The implementation process of the traversal loop discriminant update procedure is described as follows:
Taking the m step of the iteration calculation of FLAC3D as an example, the implementation process of the traversal loop discriminant update procedure is shown in Figure 11.
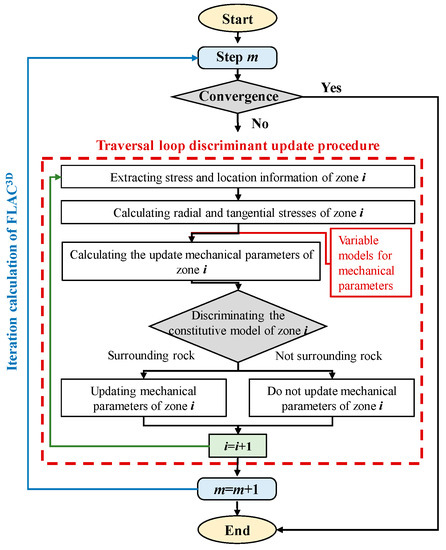
Figure 11.
Traversal loop discriminant update procedure.
At step m of the iteration calculation of FLAC3D, it is first judged whether the iteration calculation process converges with the convergence criterion of the maximum unbalance force ratio of the system through the FISH language (loop while) and zone function (zone.mech.ratio). If the calculation process converges, the traversal loop discriminant update procedure immediately terminates, if not, proceed to step 1 of the traversal loop discriminant update procedure.
(1) Step 1: Setting the traversal loop environment. Setting the traversal loop environment for all zones of the finite element model through the FISH language (loop) and zone function (zone.head, zone.next(zone_int)). In the traversal loop environment, from the first zone to the last zone, execute step 2~step 6.
(2) Step 2: Extracting stress and location information of zone i. The stress component and barycentric coordinate for zone i are extracted with zone functions (zone.stress(zone_pnt,int,int), zone.pos(zone_pnt,int)) in the finite element model and stored in computer memory.
(3) Step 3: Calculating radial and tangential stresses of zone i. Firstly, according to the relationship between the tunnel center and the barycentric coordinate of zone i, the overall coordinate system can be transformed into the polar coordinate system. Secondly, in the polar coordinate system, the radial and tangential stresses of zone i can be calculated by all stress components of zone i obtained from Step 1 with the following equations, which are introduced into FLAC3D through the FISH language.
(4) Step 4: Calculating the update mechanical parameters of zone i. Firstly, through the FISH language, variable models for mechanical parameters of soft rock with confining pressure influence are introduced into FLAC3D. Secondly, the radial and tangential stresses of zone i are substituted for the variable models, in which tangential stress is the first principal stress and radial stress is the third principal stress. Then, the updated mechanical parameters of zone i can be obtained and stored in computer memory.
(5) Step 5: Discriminating the constitutive model of zone i. Firstly, the constitutive model information can be extracted with the zone function (zone.model(zone_pnt)). Secondly, through the FISH language, discriminate the constitutive model of zone i. If its constitutive model represents the surrounding rock, then its mechanical parameters for zone i are updated with the updated mechanical parameters from step 3 through the zone command (zone property), if not, no mechanical parameters of zone i are updated.
(6) Step 6: Executing step 2~step 5 for the next zone (i + 1). Until all zones of the finite element model are executing step 2~step 5, exiting of the traversal loop environment and traversal loop discriminant update procedure is completed.
After the traversal loop discriminant update procedure is completed, step 1 of the iterative calculation of FLAC3D is executed. Then, at the (m + 1) step of the iteration calculation of FLAC3D, repeat the above convergence judgment and traversal loop discriminant update procedure until the iteration calculation of FLAC3D converges.
3.2. Verification Example
To validate the improved numerical simulation method reasonably and accurately, this paper carries out two verification examples (an experimental example and a tunnel engineering example). In the experimental example, the stress–strain curve of the rock specimen obtained by the proposed simulation method is compared with the experimental result to validate that the proposed simulation method can simulate the mechanical behavior of soft rock at the rock specimen scale. In the tunnel engineering example, the stress and displacement fields of the surrounding rock around the tunnel obtained by the improved numerical simulation method are compared with the results of the elastoplastic solution to validate that the improved numerical simulation method can be applied in the mechanical behavior analysis of surrounding rock at the tunnel engineering scale.
3.2.1. Experimental Example
In the experimental example, the stress–strain curve of carbon phyllite under 20 MPa confining pressure conditions was obtained from the triaxial compression experimental test [21]. Based on the triaxial compression experimental results, variable models for the mechanical parameters of phyllite are established and listed in Table 4. In the numerical simulation, the cylindrical rock specimen model is generated, and the sizes of the model and element are shown in Figure 12.
Table 4.
Variable models for mechanical parameters of rock specimen.
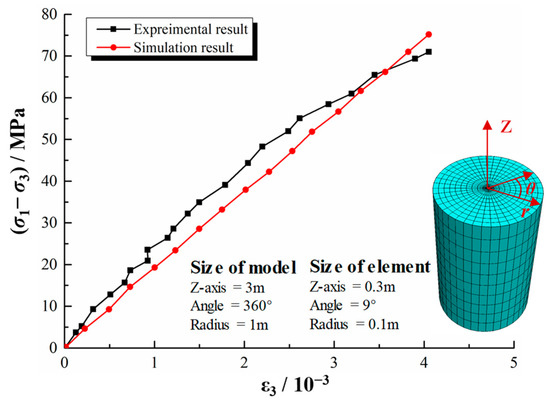
Figure 12.
Stress–strain curves of the rock specimen from the experiment test and numerical simulation.
Taking the triaxial compression experimental test of the phyllite rock specimen under the 20 MPa confining pressure condition as an example, it carries out the triaxial compression experimental test by the proposed simulation method. In numerical simulation, the stress–strain curve of the rock specimen model in the prepeak stage is obtained due to the Mohr–Coulomb constitutive model of the element. The comparison results between the experimental test and numerical simulation are shown in Figure 12. At the end of the triaxial compression experiment in numerical simulation (the maximum strain of the rock specimen model is equal to that of the experimental test), the mechanical parameter comparison results between the experimental test and numerical simulation are listed in Table 5.
Table 5.
Mechanical parameter of the rock specimen from the experimental test and numerical simulation.
As shown in Figure 12 and Table 5, the stress–strain curve of the rock specimen model is generally in good agreement with that of the experimental test. The mechanical parameters of the rock specimen model are also highly consistent with those of the experimental test. Although there are errors between the experimental test and numerical simulation, these errors are small and are acceptable. The reason for the errors is that the Mohr–Coulomb constitutive model of the element cannot simulate the actual yield phase of the stress–strain curve in the experimental test. Therefore, the experimental example validates that the improved numerical simulation method is accurate and reasonable at the rock specimen scale.
3.2.2. Tunnel Engineering Example
To validate the accuracy of the improved numerical simulation method at the tunnel engineering scale, the stress and displacement fields of surrounding rock by the proposed numerical simulation method are compared with the elastoplastic solution from results [25]. To save the computing time and memory of FLAC3D, only the elasticity modulus variation of the surrounding rock in the tunnel engineering example is considered. The parameters for the tunnel and surrounding rock of the tunnel engineering are listed in Table 6.
Table 6.
Parameters for the tunnel and surrounding rock of the tunnel engineering example.
Moreover, because tunnels are circular and axisymmetric structures, a quarter-finite element model is established as shown in Figure 13. The dimensions of the finite element model in the cylindrical coordinate system are 45 m in the radius (r) direction, 90° in angle (θ) direction and 1 m in Z-axis direction. The left and bottom boundaries of the model are the fixed boundary, and the outer circular boundary of the model is the stress boundary with initial pressure. All elements of the finite element model can be divided into two groups: the tunnel group (blue element) and the surrounding rock group (green element). In the surrounding rock group, the size of each element is shown in Figure 13. In the tunnel group, the size of each element in the angle (θ) direction and Z-axis direction are the same as the elements of the surrounding rock group. For the size of each element in the radius direction, the “tunnel” group is divided into 50 parts, the size of the element is amplified in equal proportion with a ratio of 1.05 and the radial size of the outer element in the tunnel group is 0.15 m. Additionally the “surrounding rock” group is divided into 90 parts in the radial direction; the size of the element is 0.46 m.
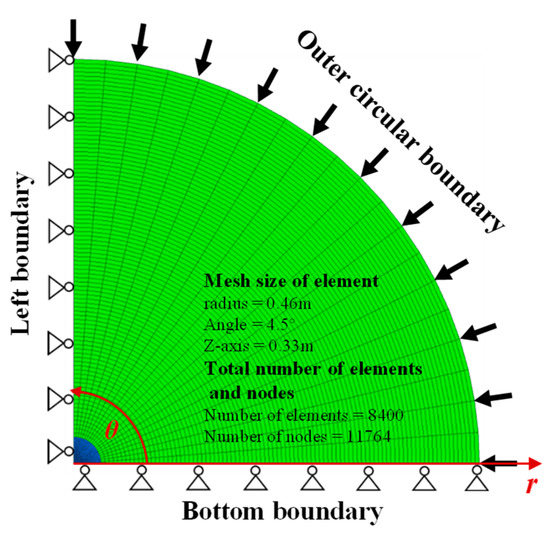
Figure 13.
Finite element model of the tunnel engineering example.
The comparison results between the two methods are shown in Figure 11. In Figure 14a, the plastic zone radius and displacement around the tunnel from the simulation are both in good agreement with those of the elastoplastic solution, and the error between the two methods is small. As shown in Figure 14b, the stress distribution trend of surrounding rock from the simulation is highly consistent with that of the analytical solution, and the radial and tangential stresses of surrounding rock from the numerical simulation method are basically equal to those of the analytical solution at the same radial distance. In Figure 14c, the elasticity modulus of the surrounding rock increases with increasing radial stress, which means that the proposed numerical simulation method can realize the automatic update process of the mechanical parameters for surrounding rock according to its stress state. Moreover, as shown in Figure 14d, the fitting expression of the elasticity modulus variation with variable radial stress from the numerical simulation result equals the factored-in variable model for the elasticity modulus before the calculation begins.
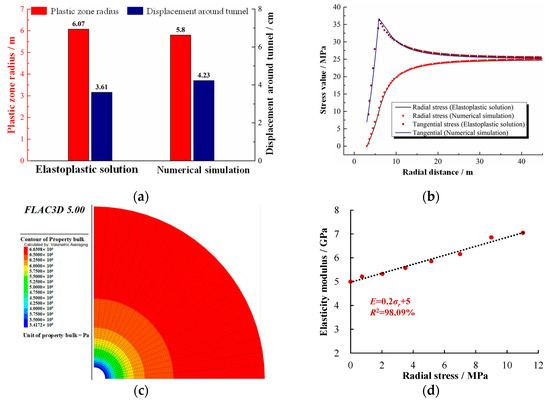
Figure 14.
Comparison results between two methods: (a) plastic zone radius and displacement around the tunnel of surrounding rock, (b) stress distribution of surrounding rock, (c) elasticity modulus contour and (d) elasticity modulus variation with variable radial stress.
Therefore, the abovementioned comparison results validate that the improved numerical simulation method is reasonable and accurate at the tunnel engineering scale and can be applied in the mechanical behavior analysis of surrounding rock around tunnel.
Moreover, to compare the computational efficiency between the improved and conventional numerical simulation methods, the computational efficiency results between the improved and conventional numerical simulation methods are listed in Table 7.
Table 7.
Computational efficiency of improved and conventional numerical simulation methods.
As shown in Table 7, compared with the conventional simulation method, the calculation step and time of the improved method increase, and the computational efficiency is indeed reduced to a certain extent. The main reason for computational efficiency reduction is the mechanical parameter update process of the element representing surrounding rock in the calculation. However, compared with the inaccurate results obtained by the conventional method, the reduced computational efficiency of the improved method is acceptable.
3.3. Comparison Example
To compare the stress and displacement field result around the tunnel with the influence of the confining pressure (by proposed simulation method) and without the influence of the confining pressure (by conventional simulation method), the stress field distribution and displacement around the tunnel with different initial pressure conditions (5 MPa, 15 MPa, 25 MPa and 35 MPa) are obtained. Stress and displacement fields of surrounding rock with confining pressure influence are obtained by the proposed numerical simulation method with variable models for mechanical parameters of soft rock, and stress and displacement fields around tunnels without confining pressure influence are obtained by the conventional simulation method with the mechanical parameter of surrounding rock under the 0 MPa confining pressure condition.
In the comparison example, the tunnel radius is 3 m, the supporting force is 0 kPa and the variable models for the mechanical parameters of soft rock from the experimental results of the Muzhailing tunnel [26] are listed in Table 8. The finite element model and size of the element in the comparison example are the same as those of the tunnel engineering example.
Table 8.
Mechanical parameter of surrounding rock in the comparison example.
The stress and displacement field around the tunnel comparison results with and without confining pressure influence under different initial pressure conditions are shown in Figure 15.
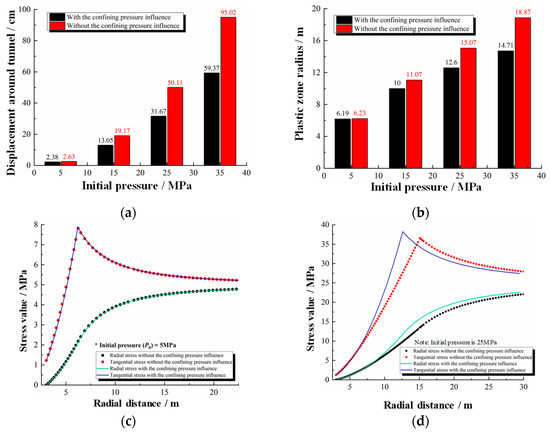
Figure 15.
Stress and displacement fields around the tunnel comparison result with and without the confining pressure influence: (a) displacement of surrounding rock around tunnel, (b) plastic zone radius of surrounding rock, (c) stress field distribution around the tunnel with 5 MPa initial pressure and (d) stress field distribution around the tunnel with 25 MPa initial pressure.
In Figure 15a,b, the displacement around the tunnel and the plastic zone radius of the surrounding rock with the confining pressure influence are basically consistent with those without the confining pressure influence under the lower initial pressure condition. However, the influence of the confining pressure on the mechanical characteristics is more prominent, and the difference between the two conditions is more obvious for the displacement around tunnel and plastic zone radius of the surrounding rock with increasing initial pressure.
The main reason for the abovementioned phenomenon is the strengthening effect of the confining pressure on the surrounding rock, and this effect of the confining pressure is increasingly significant with increasing initial pressure. Therefore, after soft rock tunnel excavation under high geo-stress conditions, due to the strengthening effect of the confining pressure on the surrounding rock, the practical displacement around the tunnel and the plastic zone radius of the surrounding rock are smaller than those obtained by the conventional method (without the confining pressure influence). Similarly, as shown in Figure 15c,d, due to the strengthening effect of the confining pressure on the surrounding rock, the stress level of the surrounding rock with the confining pressure influence is higher, and the disturbance range is smaller than those without the confining pressure influence.
Therefore, the abovementioned comparison results prove that the improved numerical simulation method can perfectly reflect the influence of the confining pressure on surrounding rock and that the simulation results are more consistent with practical soft rock tunnels.
4. Improved Expression of Longitudinal Deformation Profile (LDP) for Soft Rock Tunnel
To demonstrate the application of the improved numerical simulation method, an improved expression of the longitudinal deformation profile (LDP) for soft rock tunnels considering confining pressure influence is proposed according to many numerical simulation results for soft rock tunnels obtained by the improved numerical simulation method. Therefore, this section first obtains many longitudinal deformation profile (LDP) results for soft rock tunnels with different initial pressure conditions by an improved numerical simulation method. Furthermore, an improved expression of the LDP is proposed by a mathematical fitting method based on many numerical simulation results of the LDP under different pressure conditions.
Longitudinal deformation profiles for soft rock tunnels under 1~20 MPa initial pressure conditions (interval of condition is 1 MPa) are obtained by an improved numerical simulation method. The tunnel radius is 3 m, the supporting force is 0 kPa, the excavation footage is 0.5 m and the constitutive model of the surrounding rock element is the Mohr–Coulomb model. Variable models for the mechanical parameters of surrounding rock are listed in Table 8.
Because tunnels are circular and axisymmetric structures, a quarter numerical finite element model is established as shown in Figure 16a. The left and bottom boundaries of the model are fixed boundaries, and the outer surface of the model is the stress boundary with the value of the initial pressure. Meanwhile, the longitudinal deformation profile (LDP) of the surrounding rock is represented by the normalized release coefficient of displacement and the normalized distance from the tunnel face [27,28], as shown in Figure 16b.
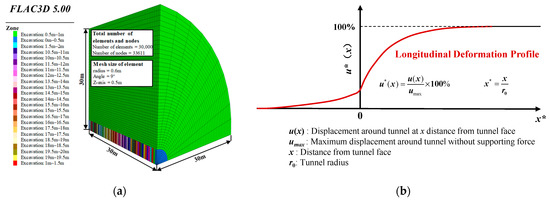
Figure 16.
(a) Finite element model and (b) normalized longitudinal deformation profile of surrounding rock.
Figure 17 shows the numerical simulation results of the LDP under 1~20 MPa initial pressure conditions. For a better display, the complete LDP is divided into two parts, with the tunnel face as the discontinuity point: (a) LDP in front of the tunnel face and (b) LDP behind the tunnel face.
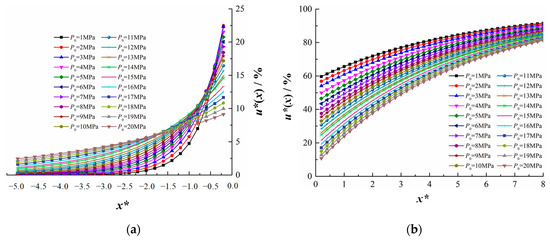
Figure 17.
Numerical simulation results of the LDP with different initial pressure conditions: (a) LDP in front of tunnel face and (b) LDP behind tunnel face.
According to the influence analysis of multiple factors on the LDP from previous scholars [28,29], the initial pressure, tunnel radius and mechanical parameters of surrounding rock all have a significant influence on the LDP; however, the mechanical parameters of surrounding rock for soft rock tunnels are variable, resulting in the mechanical parameters of surrounding rock not acting as independent variables to fit the expression of the LDP. Therefore, R* is introduced into the improved expression of the LDP and R* = Rmax/r0 (Rmax is the maximum plastic zone radius of surrounding rock without support, and r0 is the tunnel radius). R* can implicitly reflect the comprehensive effect of the initial pressure, mechanical parameters of surrounding rock and tunnel radius [28]. The Levenberg–Marquardt and universal global optimization methods are applied in the fitting process for the expression of the LDP for soft rock tunnels. The improved expressions of the LDP for soft rock tunnels are listed in Table 9.
Table 9.
Improved expression of the LDP for soft rock tunnels considering confining pressure influence.
Where ,, , x is the longitudinal distance from the tunnel face, r0 is the tunnel radius, u is the displacement around the tunnel at x distance from the tunnel face and Rmax is the maximum plastic zone radius of the surrounding rock without support.
5. Conclusions
This paper firstly investigates the mechanical characteristic variation of soft rock with variable confining pressure and establishes the corresponding variable models for mechanical parameters of soft rock. Secondly, an improved numerical simulation method including these variable models is proposed to solve this current defect of the conventional simulation method, which cannot consider the confining pressure influence on the mechanical parameters of soft rock during the calculation process. Finally, for exhibiting the application of the improved numerical simulation method, an improved expression of the LDP for soft rock tunnels considering confining pressure influence is proposed. The conclusions can be summarized as follows:
- Mechanical parameter variation of soft rock with variable confining pressure is investigated by triaxial experiments. The experimental results indicate that with increasing confining pressure, the elasticity modulus and cohesion obviously increase, and the friction angle gradually decreases, but the Poisson ratio remains basically constant. Furthermore, variable models for mechanical parameters (E, v, c and φ) are established with confining pressure influence.
- A transversal loop discriminant update procedure including variable models for the mechanical parameters of soft rock is proposed with the FISH language and introduced into the iteration calculation process of FLAC3D, thus forming an improved numerical simulation method for soft rock tunnels. The improved simulation method can integrally consider the mechanical parameter variation of surrounding rock with variable confining pressure and realize the automatic update for the mechanical parameter of surrounding rock with its variable stress state during the calculation process. Moreover, the improved numerical simulation method is validated as accurate and correct with the experiment and elastoplastic results, and the comparison results between the improved and conventional simulation methods indicate that the results of the improved simulation method are more consistent with practical soft rock tunnel engineering.
- As an application example for the improved simulation method, based on many displacement field results of surrounding rock obtained by the improved simulation method, an improved expression of the LDP for soft rock tunnels is proposed, which can consider the comprehensive influence of multiple factors, including the initial pressure, tunnel radius and mechanical parameter variation of surrounding rock.
In this study, we investigated the mechanical characteristic variation of phyllite with confining pressure influence and established variable models; meanwhile, a numerical simulation method for tunnel excavation, which can consider this variation of surrounding rock, was proposed. In reality, natural phyllite is the joint rock, and its mechanical characteristic variations are affected by joint and confining pressure; however, this paper only considers the confining pressure influence. In future research, the effect of joints on the mechanical characteristics of phyllite can be further studied, and the numerical simulation method can be further improved, which can consider the comprehensive influence of joints and confining pressure on the mechanical characteristic of phyllite.
Author Contributions
Y.Z. proposed the idea of this paper, established the framework, and revised the writing process; Y.D. also proposed the idea for this paper. Meanwhile, he mainly wrote the original draft of this paper; H.Z. is responsible for the improved simulation method section; Z.Z. is responsible for the validation section of the improved simulation method and the improved LDP. All authors have read and agreed to the published version of the manuscript.
Funding
This research and the APC of this paper were supported by Major Science and Technology project (2019-A05) of China Railway Construction Co., Ltd. Opening research project (KF2021-09).
Institutional Review Board Statement
Not applicable.
Informed Consent Statement
Not applicable.
Data Availability Statement
All data are available from the author.
Acknowledgments
We appreciated Liu Li and Ruikuo Zhu from China Railway 18th Bureau Group Corporation Limited for providing support for this research.
Conflicts of Interest
The authors declare no conflict of interest.
References
- Chen, J.; Liu, W.; Chen, L.; Luo, Y.; Li, Y.; Gao, H.; Zhong, D. Failure Mechanisms and Modes of Tunnels in Monoclinic and Soft-Hard Interbedded Rocks: A Case Study. KSCE J. Civ. Eng. 2020, 24, 1357–1373. [Google Scholar] [CrossRef]
- Li, Y.; Yang, S.; Tang, X.; Ding, Y.; Zhang, Q. Experimental Investigation of the Deformation and Failure Behavior of a Tunnel Excavated in Mixed Strata Using Transparent Soft Rock. KSCE J. Civ. Eng. 2020, 24, 962–974. [Google Scholar] [CrossRef]
- Liu, Y.; Zheng, P.; Xu, L.; Li, W.; Sun, Y.; Sun, W.; Yuan, Z. Mechanism of Roof Deformation and Support Optimization of Deeply Buried Roadway under Mining Conditions. Appl. Sci. 2022, 12, 2090. [Google Scholar] [CrossRef]
- Liang, Y.; Zha, W.; Liu, Z.; Liu, X. Research on the Prediction of the Time of Initial Support of Soft Rock Tunnel Based on the Optimized Longitudinal Deformation Profile. Appl. Sci. 2022, 12, 7221. [Google Scholar] [CrossRef]
- Wu, Y.; Tian, C.; Xu, P.; Zhao, Z.; Zhang, J.; Wang, S. Design Optimization Method of Feet-Lock Steel Pipe for Soft-Rock Tunnel Based on Load-Deformation Coordination. Appl. Sci. 2022, 12, 3866. [Google Scholar] [CrossRef]
- Xu, J.; Wen, H.; Sun, C.; Yang, C.; Rui, G. Numerical Simulation of Non-Stationary Parameter Creep Large Deformation Mechanism of Deep Soft Rock Tunnel. Appl. Sci. 2022, 12, 5311. [Google Scholar] [CrossRef]
- Li, C.; Zheng, H.; Hu, Z.; Liu, X.; Huang, Z. Analysis of Loose Surrounding Rock Deformation and Slope Stability at Shallow Double-Track Tunnel Portal: A Case Study. Appl. Sci. 2023, 13, 5024. [Google Scholar] [CrossRef]
- Chen, Y.-F.; Wei, K.; Liu, W.; Hu, S.-H.; Hu, R.; Zhou, C.-B. Experimental Characterization and Micromechanical Modelling of Anisotropic Slates. Rock Mech. Rock Eng. 2016, 49, 3541–3557. [Google Scholar] [CrossRef]
- Fu, H.; Zhang, J.; Huang, Z.; Shi, Y.; Chen, W. A statistical model for predicting the triaxial compressive strength of transversely isotropic rocks subjected to freeze–thaw cycling. Cold Reg. Sci. Technol. 2018, 145, 237–248. [Google Scholar] [CrossRef]
- Gholami, R.; Rasouli, V. Mechanical and Elastic Properties of Transversely Isotropic Slate. Rock Mech. Rock Eng. 2013, 47, 1763–1773. [Google Scholar] [CrossRef]
- Hu, K.; Feng, Q.; Wang, X. Experimental Research on Mechanical Property of Phyllite Tunnel Surrounding Rock Under Different Moisture State. Geotech. Geol. Eng. 2016, 35, 303–311. [Google Scholar] [CrossRef]
- Xu, G.; He, C.; Su, A.; Chen, Z. Experimental investigation of the anisotropic mechanical behavior of phyllite under triaxial compression. Int. J. Rock Mech. Min. Sci. 2018, 104, 100–112. [Google Scholar] [CrossRef]
- Saeidi, O.; Vaneghi, R.G.; Rasouli, V.; Gholami, R. A modified empirical criterion for strength of transversely anisotropic rocks with metamorphic origin. Bull. Eng. Geol. Environ. 2013, 72, 257–269. [Google Scholar] [CrossRef]
- Singh, M.; Samadhiya, N.K.; Kumar, A.; Kumar, V.; Singh, B. A nonlinear criterion for triaxial strength of inherently anisotropic rocks. Rock Mech. Rock Eng. 2015, 48, 1387–1405. [Google Scholar] [CrossRef]
- Chen, W.; Zhang, D.; Fang, Q.; Chen, X.; Xu, T. A New Numerical Finite Strain Procedure for a Circular Tunnel Excavated in Strain-Softening Rock Masses and Its Engineering Application. Appl. Sci. 2022, 12, 2706. [Google Scholar] [CrossRef]
- Yi, K.; Kang, H.; Ju, W.; Liu, Y.; Lu, Z. Synergistic effect of strain softening and dilatancy in deep tunnel analysis. Tunn. Undergr. Space Technol. 2020, 97, 103280. [Google Scholar] [CrossRef]
- Zhang, Q.; Quan, X.-W.; Wang, H.-Y.; Jiang, B.-S.; Liu, R.-C. A numerical solution of a circular tunnel in a confining pressure-dependent strain-softening rock mass. Comput. Geotech. 2020, 121, 103473. [Google Scholar] [CrossRef]
- Al-Asad, M.F.; Alam, M.N.; Tunç, C.; Sarker, M.M. Heat Transport Exploration of Free Convection Flow inside Enclosure Having Vertical Wavy Walls. J. Appl. Comput. Mech. 2021, 7, 520–527. [Google Scholar] [CrossRef]
- Shariful Islam, M.M.N.A. Fayz-Al-Asad, Cemil Tunç. An analytical Technique for Solving New Computational Solutions of the Modified Zakharov-Kuznetsov Equation Arising in Electrical Engineering. J. Appl. Comput. Mech. 2021, 7, 715–726. [Google Scholar] [CrossRef]
- Yuan, W.; Wang, X.; Wang, X.-B. Numerical investigation on effect of confining pressure on the dynamic deformation of sandstone. Eur. J. Environ. Civ. Eng. 2020, 26, 3744–3761. [Google Scholar] [CrossRef]
- Wu, Y.; Tan, Z.; Yu, Y.; Jiang, B.; Yu, X. Anisotropically mechanical chracteristics of Maoxian Group Phyllite in Northwest of Sichuan Province. Rock Soil Mech. 2018, 39, 207–215. [Google Scholar] [CrossRef]
- Zhou, Y.; Su, S.; Li, P.; Ma, H.; Zhang, X. Microstructure and Mechanical Properties of Broken Phyllite. J. Jilin Univ. (Earth Sci. Ed.) 2019, 49, 504–513. [Google Scholar]
- Yu, Q. Research on Deformation Features and Support Technology of Surrounding Rock in Pinal Schist Tunnel During Construction. Ph.D. Thesis, China University of Geosciences, Wuhan, China, 2016. [Google Scholar]
- Ramamurthy, T.; Rao, G.V.; Sign, J. Engineering Behaviour of Phyllite. Eng. Geol. 1993, 33, 209–225. [Google Scholar] [CrossRef]
- Dong, Y.; Zhang, H.; Wang, M.; Yu, L.; Zhu, Y. Variable model for mechanical parameters of soft rock and elastoplastic solutions for tunnels considering the influence of confining pressure. Front. Earth Sci. 2023, 11, 3003. [Google Scholar] [CrossRef]
- Li, F.; Jiang, A.; Zheng, S. Anchoring Parameters Optimization of Tunnel Surrounding Rock Based on Particle Swarm Optimization. Geotech. Geol. Eng. 2021, 39, 4533–4543. [Google Scholar] [CrossRef]
- Carranza-Torres, C.; Rysdahl, B.; Kasim, M. On the elastic analysis of a circular lined tunnel considering the delayed installation of the support. Int. J. Rock Mech. Min. Sci. 2013, 61, 57–85. [Google Scholar] [CrossRef]
- Oke, J.; Vlachopoulos, N.; Diederichs, M. Improvement to the Convergence-Confinement Method: Inclusion of Support Installation Proximity and Stiffness. Rock Mech. Rock Eng. 2018, 51, 1495–1519. [Google Scholar] [CrossRef]
- Park, K.-H.; Tontavanich, B.; Lee, J.-G. A simple procedure for ground response curve of circular tunnel in elastic-strain softening rock masses. Tunn. Undergr. Space Technol. 2008, 23, 151–159. [Google Scholar] [CrossRef]


Disclaimer/Publisher’s Note: The statements, opinions and data contained in all publications are solely those of the individual author(s) and contributor(s) and not of MDPI and/or the editor(s). MDPI and/or the editor(s) disclaim responsibility for any injury to people or property resulting from any ideas, methods, instructions or products referred to in the content. |
© 2023 by the authors. Licensee MDPI, Basel, Switzerland. This article is an open access article distributed under the terms and conditions of the Creative Commons Attribution (CC BY) license (https://creativecommons.org/licenses/by/4.0/).