Abstract
This study discusses the choice of dehumidification systems for high-moisture indoor environments, such as indoor swimming pools, supported by an eco-energetic performance comparison. Initially, the causes of the high relative humidity and condensation in these spaces are reported, as well as the available dehumidification technologies. Two different solutions are described: desiccant wheel dehumidification and re-cooling. The energy demand required by a refrigeration system is lower than the desiccant wheel; however, the former system requires less maintenance and does not require refrigerant fluid. An eco-energetic comparison is performed between the two systems in two countries with different energy matrices (Brazil and USA). In Brazil, the desiccant wheel is the best choice for the past 10 years, with a predicted 351,520 kgCO2 of CO2 emissions, which is 38% lower than the refrigeration system. In the USA, the best option is the refrigeration system (1,463,350 kgCO2), a 12% more efficient option than desiccant wheels. This model can be considered for energy and CO2 emissions assessment, predicting which system has better energy efficiency and lower environmental impact, depending on the refrigerant type, location and environmental conditions.
1. Introduction
Due to the health, physical preparation, survival, and leisure needs of the human body, swimming is the best for physical conditioning and regardless of age. Brazil has some of the highest IHD-M index (Municipal Human Development Index) in certain states. They are, in order: 0.844—Federal District, 0.814—São Paulo, 0.809—Rio Grande do Sul, 0.806—Santa Catarina, and 0.802—Rio de Janeiro. Four of these five states have well-defined winters for the Brazilian climate, and therefore, require artificially heated indoor pools. Indoor pools require condensation control, among other technologies, which can be achieved by dehumidification, refrigeration (with an evaporator and a condenser in series), or by silica desiccant wheel systems with resistive reactivation [1]. Public swimming pools and recreational activities involving water in general have a great potential for biological contamination and disease transmission, if not treated [2]. Due to the excessive amount of water evaporating, sometimes without proper treatment, the existence of bacteria, such as Staphylococcus aureus and other pathogens is verified [3].
This article presents a scientific bibliography analysis of data collected and surveys on dehumidification and ventilation of indoor swimming pools and compares refrigeration drying systems with desiccant wheels as an option to dehumidify the air to prevent mold growth and condensation.
The TEWI (Total Equivalent Warming Impact) indicator is used for this comparison. The TEWI metric of the global warming impact of equipment is supported by the production of greenhouse gases (GHG)—emissions produced during the operation of equipment and fluid emissions produced at the end of life [4,5,6,7,8].
One reason for the demand for dehumidification in indoor pools is water evaporation, which naturally occurs during this process, since it is an analytical energy standard for the planning and handling system of the pool.
A dehumidification system is used (desiccant wheels or conventional dehumidification by refrigeration) to remove the steam produced by heating water and to reduce condensation in cold areas of the pools. [9]. A comparison was made between these dehumidification equipment both with the same purposes—dehumidifying the pool area. There are differences between the systems: in the refrigeration dehumidification equipment, there is the direct expansion of the refrigerant fluids, and in the desiccant wheels, a rotor is used, which is composed of a set of resistors and uses silica. When designing air conditioning, desiccant wheels are essential components for reducing electricity consumption [10]. These two systems (refrigeration system and desiccant wheel) have their particularities. The refrigeration system has a refrigerant load that can provide a COP (coefficient of performance) from 3 to 9 W/W. The desiccant wheel system generally works with a resistive system in the reactivation area but does not have a refrigeration gas charge.
In this study, the emission of kgCO2 will be compared over the lifecycle of both systems. The TEWI indicator will be used to compare these two systems in Brazil and the USA, showing what environmental impact each solution offers in each country [11]. This model can be considered for energy and CO2 emissions assessment prediction, providing a simple and expeditious decision support tool concerning the energy efficiency and environmental impact of dehumidification systems, depending on the location and environmental conditions.
2. Materials and Methods
The city used for the simulation is Curitiba, with a climate classification, Cfa, according to Köppen subtropical, in the coldest month the average air temperature is 18 °C, and in the hottest month, the average air temperature is above 22 °C [12]. Table 1 shows the climate data for Curitiba, Brazil, while Table 2 shows the average values of conditions measured indoors.

Table 1.
Climate data for Curitiba [13].
Table 2.
Indoor data for Curitiba [14,15,16].
In an indoor pool environment, the water temperatures are measured. The air temperature is set to be from 0 to 4 K or higher than the water temperature. Still, the relative humidity of the air must be from 40% to 80%, a value below 60% serves as a reference, and for the airspeed, the reference value would be equal to or less than 0.10 m/s in the proximity to users. [17].
The quality of the air can be altered due to the high humidity, allowing the growth of fungi, bacteria, and viruses in this environment. Keeping the relative humidity between 50% and 60% will reduce the number and activity of these organisms [18]. High humidity values are what affect comfort, productivity and human health the most, so ASHRAE [19] proposed a table of growth of bacteria, viruses, fungi, mites and other situations derived from pathogens according to relative humidity. Figure 1 shows the importance of maintaining relative humidity control in indoor swimming pools. Values outside of the green bar (optimal zone) indicates a decrease in effect. There is evidence on how particular ranges of humidity may act to decrease the amount of infectious disease particles [20].
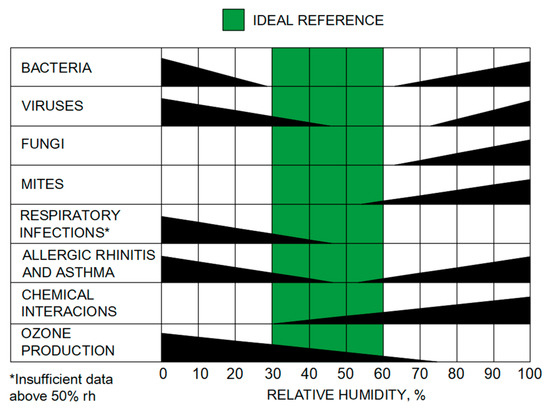
Figure 1.
Importance of maintaining control of relative humidity in indoor swimming pools (Adapted from [19]).
Using ASHRAE 62.1, assuming 4 to 6 changes per hour, airflow is calculated for the entirety covered pool area. This pool is located in the city of Curitiba and has a volume of 600 m3; the necessary airflow as shown in Equation (1) [15].
Air renewal was used in this environment. An exhaust fan is used to ensure air renovation. For a comfortable temperature to be guaranteed for people, this equipment utilizes external air as an input for temperature control.
Controlling the humidity of the pool enclosure is required to reduce and/or eliminate condensation on the walls and glass surfaces. The reference environmental conditions should be a dew point of 19.1 °C; relative humidity of 60%; and an internal temperature of 28 °C (ASHRAE Psychrometric Chart application). Condensation will occur if the outside air temperature is below the 12 °C dew point while there is a relative humidity of 40%. This difference of 20% in relative humidity represents a condensation problem in 60% to 12.5% of hours annually. According to Figure 2, in the 60% relative indoor humidity condition the outdoor air is a major problem for condensation on the walls of the closed pool environment in 60% of the annual hours. At a relative humidity of 40%, the outside air would promote air condensation in the indoor pool in only 12.5% of the annual hours.
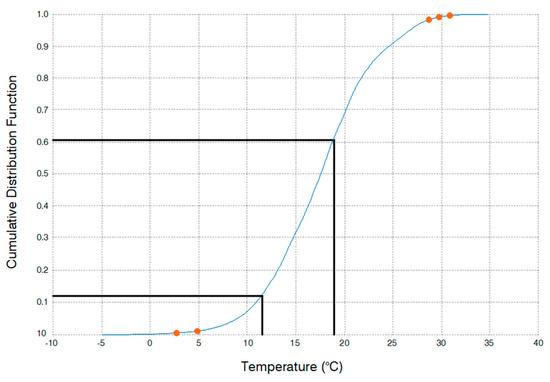
Figure 2.
Cumulative dry-bulb temperature per year (Curitiba, Brazil) (Adapted from [21]).
A 40% relative humidity value eases the minimum R-value requirement (a significant issue for fenestration, less so for insulated walls and ceilings). On the other hand, a 60% relative humidity value reduces the dehumidification load (smaller equipment) [22]. Figure 3 shows the essential components of an indoor pool cover [21].
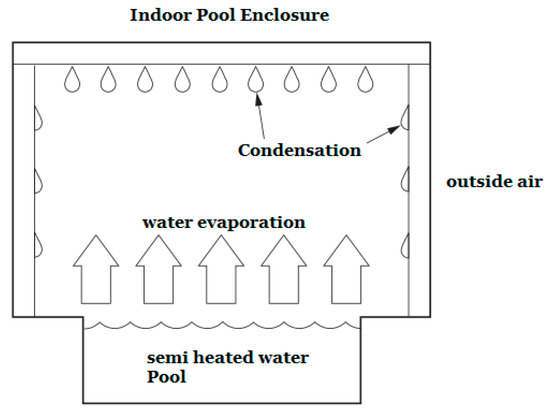
Figure 3.
Schematic section of the indoor pool (Adapted from [15]).
To find the amount of water, several factors must be considered:
- Water activities.
- Indoor air temperature.
- Speed of air movement on the surface of the pool water.
- Relative indoor air humidity.
- Water heating temperature in the pool. The question of the type of activity is related to the intensity of water carried over the pool (drag force), the temperature, air velocity and relative humidity with the level of water evaporation [22]. The standard AHRI 911-2014 recommends a simulation with pool dehumidification equipment with an internal temperature of 28 °C and a wet bulb of 22 °C, that is, relative humidity of 60% (at sea level) [23], water temperature of 27 °C, and setting the condenser air temperature to 28 or 35 °C. ANSI/ASHRAE Standard 190-2013 does not include parameters for desiccant wheels [24], while AHRI 1061 defines parameters for enthalpy wheels and enthalpy cubes but also lacks a specific AHRI for desiccant wheels [25].
For a water temperature of 27 °C and an indoor air temperature of 28 °C, with an air velocity of 0.125 m/s and assuming the swimming pool closed for public use, the usage factor is equal to 1. For these conditions, evaporation is 0.2142 kgwater/m2 for a closed swimming pool of 40 m2 with a water surface of 5 m2 [26,27]. The dehumidification index is given by Equation (2).
Thus, for this simulation, 231.33 kg of humidity is removed from the environment per day. With this value, the dehumidification systems, with either refrigeration or desiccant wheel, are compared, and the more efficient of the two will be determined through the results.
3. Comparative Study of Systems
3.1. Refrigeration Dehumidifier
Dehumidification using a refrigeration system recovers all the latent and sensible heat from the environment. Latent heat (moist air) is condensed and cooled via a dehumidifying coil. All energy is transferred to a refrigerant fluid. Almost all the energy recovered by it is returned to the airflow as sensible heat in the reheat coil. This heat is delivered to the pool’s internal environment, changing the air temperature setting. Additional heating is provided on-site to compensate for the heat loss by conduction through the windows and walls of the room.
Initially, the air filtration system captures airborne contaminants and particles in the indoor air that passes through the first (G4 efficiency) and second stage (F5 efficiency). Excess moisture is reduced by passing the partially filtered air through the direct expansion dehumidifier system. The remaining moisture in the air condenses and turns into water. The drain pan captures the water that is expelled due to the positive pressure of the filtered air renovation system.
The final stage of the filter serves to remove micron-sized elements and airborne bacteria from the dry air. The final air outlet is dry and clean. This process continues until the ambient air reaches the desired humidity level.
Refrigeration dehumidification equipment works with direct expansion, with the refrigerant fluid coil. These coils, made of copper, are strongly corroded by chlorine.
The simulation was performed with a 4Pool brand equipment [18], model 240C, which dehumidifies 120 kg/day. To meet a 231 kg/day demand, two pieces of equipment are required; each one has an electrical power of 3.9 kW and an HFC 410A refrigerant gas load of 5 kg. A scheme of the airflow through the dehumidification system by refrigeration is shown in Figure 4.
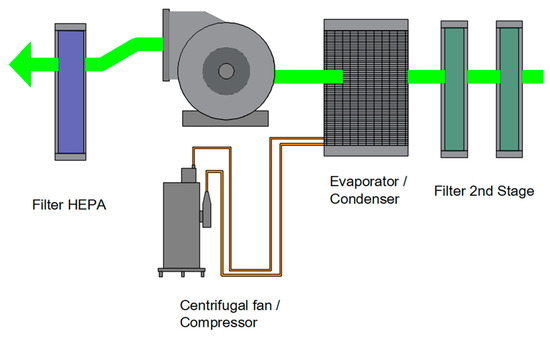
Figure 4.
Air flow equipment 4Pool (Adapted from [18]).
3.2. Dehumidifier with Desiccant Wheel
Dehumidifiers with adsorption systems, or desiccant systems, are coated with materials of high absorption (hygroscopic) that remove moisture from the air as needed, as shown in Figure 5.
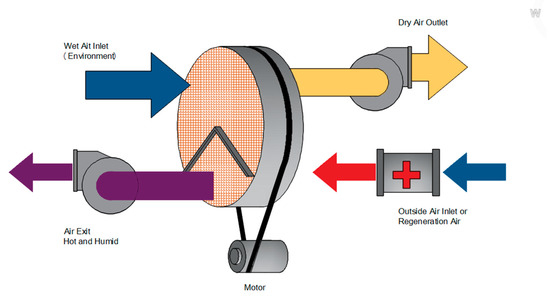
Figure 5.
Schematic of a desiccant wheel (adapted from [22]).
The advantages of desiccant wheels are [22]:
- Long lifespan;
- Digital and accurate control according to application needs;
- Automatic adjustment of relative humidity according to indoor environmental situations;
- Performance is not reduced in environments with a temperature range from 0 °C to 45 °C;
- High performance in critical situations when precision is required;
- No accumulation of liquid (water) in the compartment;
- A good investment;
- Very low maintenance.
The dehumidifier must be able to operate even without energizing the reactivation heater for long periods, and without damaging the desiccant cylinders. In this study, the dehumidifier model FFB 300 Ecodry [22] is used and consists of three high-efficiency desiccant cylinders with a dehumidification capacity of 80 kg/day and electrical power of 3.8 kW each, thus totaling 11.4 kW of electricity consumed. Figure 6 shows an inside view of a desiccant wheel [22].
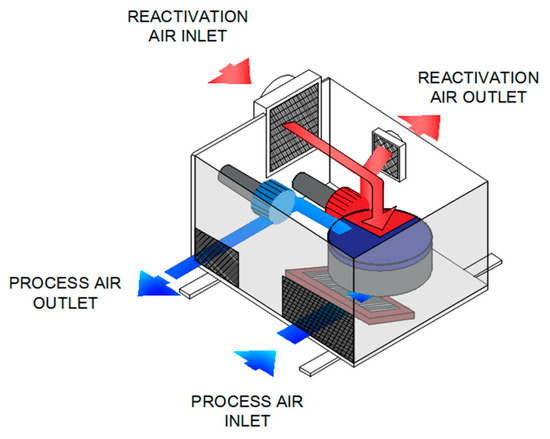
Figure 6.
Internal content of a desiccant wheel (adapted from [22]).
In the first instance, refrigeration dehumidification seems more advantageous because, for the same capacity (240 kg/day), it has an energy demand of 7.8 kW. Regarding environmental sustainability, the TEWI (Total Equivalent Warming Impact) considers indirect and direct emissions produced through energy consumption in the equipment’s operation. The TEWI index measures, in kg, the chemical compound carbon dioxide (CO2) equivalents. The TEWI is calculated as the sum of the two parts:
- Direct emission—This includes part of the refrigerant fluids available during the equipment’s useful life, including until the end of its life, all unrecovered losses.
- Indirect emission—There is a huge impact on CO2 emissions from the use of fossil fuels, which generates the electricity used to operate equipment over its lifetime.
The TEWI calculation is given by Equations (3) and (4) [28]):
where:
TEWI = Total Equivalent Warming Impact.
GWP = Global Warning Potential of refrigerant, relative to CO2 (GWP CO2 = 1).
EOLC = End-of-life cycle.
Lannual = Leakage rate (leakage) p.a. (kg).
n = System operating life (years).
m = Refrigerant charge (kg).
αrecovery = Recovery/recycling factor, from 0 to 1.
Eannual = Energy consumption per year (kWh pa. a.).
β = Indirect emission factor (kgCO2/kWh) [29].
The GWP (Global Warming Potential) is essential information for calculating the TEWI, but it is a more complete indicator, as it addresses the demand for gas leaks and indirect emissions from energy matrices.
The cost of the dehumidification system is very important, but the most integral indicator for deciding is the environmental operation, which has a life cycle cost.
The result of the TEWI is the formula that gives total CO2 emissions and life cycle energy. The effect and impact of these variables show that refrigerants have a greater consequence in Brazil than in other important world markets.
Emissions by sources (indirect emission factor, β, given in kg CO2/kWh, varies according to the energy available to be transformed (energy matrix). For example, in Brazil, the electricity system matrix is divided into the same transmission throughout the country, from north to south; therefore, with the National Energy Balance of Brazil (BEN) [30], Brazil emits 0.088 kg (CO2)/kWh. In the United States of America, they emit 0.417 kg (CO2), based on data from the Energy Information Administration (EIA) [31].
4. Analysis and Discussion
To compare the systems, a lifecycle of ten years was considered because swimming pools use chlorine, which is corrosive. Even though ASHRAE recommends 15 years for heat pumps, the 10-year value is based on the ASHRAE Equipment Life Expectancy chart for self-contained machine [32]. Specific information about swimming pools is not found in the ASHRAE standards, so in the simulation performed, an equipment use factor of 40%/year was used, due to temperature variations and possible openings of mobile roofs in the summer.
Equation (5) shows a 10-year interpretation of the TEWI indicator for dehumidification [24,28]:
TEWIDehumidification = GWP (direct, refrigerant leaks including EOLC) +
Power input·Use factor·8760·β·10
Power input·Use factor·8760·β·10
The classified variables are indirect emissions, which are the fluid used is fluid R 410A with GWP = 2088, with a refrigerant weight of 5 kg per equipment (10 kg for a total of 2 machines) [33]. A useful life of 10 years was the considered with a leakage rate of 12.5% per year (Lannual) and a recovery rate of 70% (αrecovery) of the refrigerant fluid [34]. The values are the same regardless of the countries in question. By applying Equation (2), the direct emissions component was 323,640 kg (CO2) [33,34,35,36].
The annual energy emissions in Brazil were 240,510 kg (CO2) for the refrigeration de-humidification system and 351,520 kg (CO2) for the desiccant wheel system. In the USA, it is 1,139,710 kg (CO2) for the dehumidification system refrigeration and 166,573 kg CO2 for the desiccant wheel system, as shown in Figure 7. The total emission values are shown in Figure 8 for both countries.
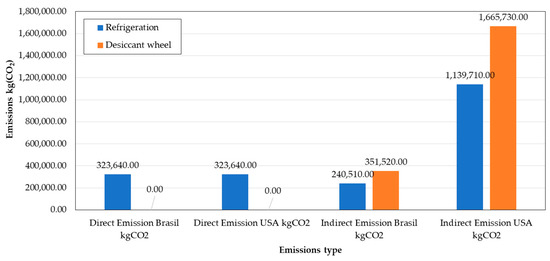
Figure 7.
CO2 emissions for 10 years [4].
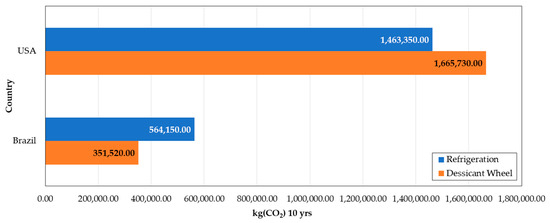
Figure 8.
Refrigeration vs. desiccant wheel emissions for Brazil vs. the USA.
It is possible to verify that the best eco-energy option for Brazil is the desiccant wheel, while for the USA it is the refrigeration system. This difference is due to a more sustainable energy matrix. The weight of the GWP of the refrigerant fluid is very high, specifically in a refrigeration dehumidification system in Brazil. Throughout the life of the equipment, the refrigerant gas is responsible for 57.5% of kgCO2 emissions, while in the USA, the refrigerant fluid only contributes 22%.
Another important observation is that the two options have a difference of 38% in Brazil and 12% in the USA, that is, the desiccant wheel option in Brazil is much better than the refrigeration option in the USA.
Since the difference is small in the USA, it must be considered that the desiccant wheel has a lower noise level and also fewer moving parts; therefore, it can be an advantage to use such technology, but it is worth remembering that the corrosion of copper coil is greater than that of silica wheels. Although they are not yet highly commercial, there are refrigerants, such as HFO (based on hydrofluoroolefin), with a low GWP value of 466 that may be strong alternatives in the near future. The simulation is extended to the comparison with this new alternative refrigerant [36,37,38], as shown in Figure 9.
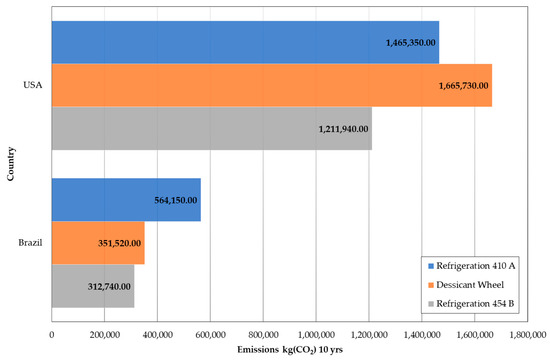
Figure 9.
Systems in Brazil and USA vs. Emissions CO2 kg 10 years.
Using low GWP refrigerant such as R454-B, the best option for dehumidifying swimming pools is refrigeration, but even so in countries with more sustainable energy matrices such as Brazil, the refrigeration system was only 12% more efficient in terms of emissions, that is, even with HFO the refrigerant gas it has a large environmental impact.
5. Conclusions
Sustainability and quality of life are topics of great importance today, but the important scientific question is how to measure them.
One of the most participated sports is swimming, which, in countries and locations with cold and temperate climates, is only viable with indoor pools. One of the major problems of indoor pools is condensation on windows and walls. The technological solutions to reduce or eliminate condensation are dehumidifiers with refrigeration systems or desiccant wheels. A pool area of 45 m2 was used as a base, and ASHRAE methodologies were used to determine the required dehumidification.
In places with a less polluting energy matrix, the option of a desiccant wheel will generate a lower level of emissions (for example, Brazil) even when using more energy. Having a source such as green hydrogen [39] could even enable resistive systems with a desiccant wheel for dehumidification due to the absence of refrigerant fluid.
Emissions from the energy matrix have a great influence on the TEWI value, but an important factor is the impact of the refrigerant gas inserted in the equipment. Environmental policies, such as green carbon, can help reduce these emissions, but also the use of low-GWP refrigerants should be a parallel measure to reduce emissions in HVAC-R (heating, ventilation, air conditioning, and refrigeration) applications.
Future work considers the simulation of a desiccant system using solar energy in the reactivation, so the energy would be considerably reduced during the day. A desiccant solar system consists of a combination of solar energy for the reactivation system and a desiccant wheel and an evaporative system, which can be a solution in places with high solar irradiation [40], but the difficulty is that in these places the pools generally do not need to be covered [37]. Another alternative is to use natural refrigerant fluids (propane, carbon dioxide or ammonia) in refrigeration dehumidification systems that have extremely low GWPs, but in contrast, they either work at high pressure (CO2), or are combustible (propane) or toxic (ammonia) [38]. This methodology for measuring energy and CO2 emissions through TEWI can be a way for institutions, such as AHRI and Eurovent, to create a standard to measure efficiency in desiccant wheel equipment, as there are Eurovent standards for regenerative air-air heat exchangers [41]. There are also standards available from AHRI [25], but they lack a procedure for desiccant wheels. In addition, this research work emphasizes the association of energy efficiency with CO2 emissions that should guide future energy efficiency decisions [8].
Author Contributions
Conceptualization, A.F.S. and P.D.G.; validation, A.F.S. and H.J.L.d.S.; methodology, A.F.S.; investigation, A.F.S. and H.J.L.d.S.; formal analysis, A.F.S. and P.D.G.; resources, A.F.S. and H.J.L.d.S.; data curation, A.F.S. and P.D.G.; writing—original draft preparation, A.F.S., H.J.L.d.S.; writing—review and editing, P.D.G., V.N.G.J.S., J.M.L.P.C.; visualization, H.J.L.d.S.; supervision: P.D.G.; project administration, A.F.S.; funding acquisition, P.D.G., V.N.G.J.S. and J.M.L.P.C. All authors have read and agreed to the published version of the manuscript.
Funding
This research received no external funding.
Data Availability Statement
Data can be found in the references cited in the manuscript.
Acknowledgments
P.D.G. acknowledges the Fundação para a Ciência e a Tecnologia (FCT—MCTES) for its financial support via project UIDB/00151/2020 (C-MAST). V.N.G.J.S. and J.M.L.P.C. acknowledge that this work is funded by FCT/MCTES through national funds and, when applicable, co-funded EU funds under the project UIDB/50008/2020.
Conflicts of Interest
The authors declare no conflict of interest.
References
- DHNET. Novo Atlas do Desenvolvimento Humano No Brasil—IDH dos Estados da Federação. Available online: http://www.dhnet.org.br/dados/idh/idh/idh_estados_br.pdf (accessed on 20 April 2022).
- Rezaei, N.; Dabiri, S.; Getso, M.I.; Damani, E.; Modrek, M.J.; Parandin, F.; Raissi, V.; Yarahmadi, M.; Shamsaei, S.; Soleimani, A.; et al. Fungal contamination of indoor public swimming pools and their dominant physical and chemical properties. J. Prev. Med. Hyg. 2022, 62, E879–E884. [Google Scholar] [CrossRef] [PubMed]
- Yousefi, Z. Study of the pollution condition of swimming pools in Sari City for the Staphylococcus Aureus. Iran. J. Health Environ. 2009, 2, 178–187. [Google Scholar]
- Santos, A.F.; Gaspar, P.D.; de Souza, H.J.L. Evaluation of the heat and energy performance of a datacenter by a new efficiency index: Energy Usage Effectiveness Design—EUED. In Proceedings of the 25th IIR International Congress of Refrigeration (ICR 2019), Montreal, QC, Canada, 24–30 August 2019. [Google Scholar] [CrossRef]
- Santos, A.F.; Gaspar, P.D.; de Souza, H.J.L. Evaluation of the heat and energy performance of a datacenter for a new efficiency index: Energy Usage Effectiveness Design—EUED. Braz. Arch. Biol. Technol. 2019, 62, 1–15. [Google Scholar] [CrossRef]
- Santos, A.F.; Gaspar, P.D.; de Souza, H.J.L. New datacenter performance indicator: Perfect Design Datacenter—PDD. Climate 2020, 8, 110. [Google Scholar] [CrossRef]
- Santos, A.F.; Gaspar, P.D.; Souza, H.J.L. New index for Sustainability—TWI (Total Water Impact). Energies 2020, 13, 1590. [Google Scholar] [CrossRef]
- Santos, A.F.; Gaspar, P.D.; de Souza, H.J.L. Ecoenergetic simulation of HVAC systems in Data Centers. Climate 2021, 9, 42. [Google Scholar] [CrossRef]
- Turza, R.; Füri, B.B. Experimental measurements of the water evaporation rate of a physical model. Slovak J. Civ. Eng. 2017, 25, 19–24. [Google Scholar] [CrossRef]
- Antonellis, S.; Joppolo, C.M.; Molinaroli, L. Simulation, performance analysis and optimization of desiccant wheels. Energy Build. 2010, 42, 1386–1393. [Google Scholar] [CrossRef]
- Standard 90.1-2019 (I-P Edition); Energy Standard for Buildings Except Low-Rise Residential Buildings. (ANSI Approved; IES Cosponsored). American Society of Heating, Refrigerating and Air-Conditioning Engineers (ASHRAE): Atlanta, GA, USA, 2019.
- CLIMATE. Clima de São José dos Pinhais—Brasil. Available online: https://pt.climate-data.org/america-do-sul/brasil/parana/sao-jose-dos-pinhais-4495/ (accessed on 20 April 2022).
- ABNT. Instalações de Ar Condicionado—Sistemas Centrais e Unitários, Qualidade do Ar Interior; ABNT: Rio de Janeiro, Brasil, 2008. (In Portuguese) [Google Scholar]
- ASHRAE. ASHRAE Handbook—HVAC Applications; American Society of Heating, Refrigerating and Air-Conditioning Engineers, Inc.: Atlanta, GA, USA, 2011; pp. 5.6–5.9. [Google Scholar]
- ASHRAE. Ventilation for Acceptable Indoor Air Quality Table 6.2.2.1 Minimum Ventilation Rates in Breathing Zone; ASHRAE: Corners, GA, USA, 2016. [Google Scholar]
- Kim, M.; Dahl, K.; Steffen, P. Peak Load reduction of district heating by control of in-door public swimming pool. In Proceedings of the Building Performance Analysis Conference and SimBuild Co-Organized by ASHRAE and IBPSA, Chicago, IL, USA, 26–28 September 2018. [Google Scholar]
- EN 15288-1:2018; Swimming Pools for Public Use—Part 1: Safety Requirements for Design. ICS 97.220.10—Sports Facilities: London, UK, 2018.
- Desert Aire. Swimming Pool Dehumidifier Sizing. Application Note 10. Optimizing Solutions through Superior Dehumidification Technology; Desert Aire: Germantown, WI, USA, 2019. [Google Scholar]
- ASHRAE. ASHRAE Handbook—HVAC Systems and Equipment (SI); American Society of Heating, Refrigerating and Air-Conditioning Engineers (ASHRAE): Atlanta, GA, USA, 2016. [Google Scholar]
- ASHRAE. ASHRAE Position Document on Air-borne Infectious Diseases; American Society of Heating, Refrigerating and Air-Conditioning Engineers (ASHRAE): Atlanta, GA, USA, 2014. [Google Scholar]
- ASHRAE. Psychrometric Chart. Available online: https://www.ashrae.org/technical-resources/bookstore/psychrometrics (accessed on 20 July 2022).
- Rutkowski, H. HVAC Design for Swimming Pools and SPAS, 1st ed.; Air Conditioning Contractors of America: Alexandria, VA, USA, 2010; ISBN 978-1892765-54-3. [Google Scholar]
- AHRI. Standard for Performance Rating of Indoor Pool Dehumidifiers; The Air-Conditioning, Heating, and Refrigeration Institute (AHRI): Arlington, TX, USA, 2014; (Reaffirmed 2023); Available online: https://www.ahrinet.org/sites/default/files/2023-03/AHRI%20Standard%20911-014%20%28Reaffirmed%202023%29%20%28SI%29.pdf (accessed on 25 May 2023).
- ANSI/ASHRAE. Method of Testing For Rating Indoor Pool Dehumidifiers; ANSI/ASHRAE Standard 190-2013; American Society of Heating, Refrigerating and Air-Conditioning Engineers (ASHRAE): Atlanta, GA, USA, 2013. [Google Scholar]
- AHRI. 2018 Standard for Performance Rating of Air-to-Air Exchangers for Energy Recovery Ventilation Equipment; The Air-Conditioning, Heating, and Refrigeration Institute (AHRI): Arlington, TX, USA, 2014; Available online: https://www.ahrinet.org/sites/default/files/2022-06/AHRI_Standard_1061_SI_2018.pdf (accessed on 25 May 2023).
- ASHRAE. ASHRAE Weather Data Viewer: WDVIEW v5; American Society of Heating, Refrigerating and Air-Conditioning Engineers (ASHRAE): Atlanta, GA, USA, 2020. [Google Scholar]
- Hourahan, G. SPS Manual HVAC Design for Swimming Pools and Spas; Air Conditioning Contractors of America (ACCA): Alexandria, VA, USA, 2010. [Google Scholar]
- AIRAH. Methods of Calculating Total Equivalent Warming Impact (TEWI) 2012. Melbourne, Australia. Available online: https://www.airahfiles.org.au/Resources/Best_Practice_Guideline/Best_Practice_Tewi_June2012.pdf (accessed on 15 March 2023).
- AIRAH. Best Practice Guideline—The Australian Institute of Refrigeration, Air Conditioning and Heating (AIRAH): Melbourne, Australia. Available online: https://www.airah.org.au/Content_Files/BestPracticeGuides/Best_Practice_Tewi_June2012.pdf (accessed on 12 January 2021).
- EPE. Balanço Energético Nacional 2019. Relatório Síntese/Ano Base 2018. Ministério de Minas e Energia—MME/Empresa de Pesquisa Energética—EPE. 2019. Available online: https://www.epe.gov.br/sites-pt/publicacoes-dados-abertos/publicacoes/PublicacoesArquivos/publicacao-377/topico-470/Relat%C3%B3rio%20S%C3%ADntese%20BEN%202019%20Ano%20Base%202018.pdf (accessed on 14 February 2021).
- ASHRAE. Equipment Life Expectancy Chart. Available online: Ttps://www.naturalhandyman.com/iip/infhvac/ASHRAE_Chart_HVAC_Life_Expectancy.pdf (accessed on 14 February 2022).
- EIA. Quanto Dióxido de Carbono é Produzido por Quilowatt-Hora de Geração de Eletricidade dos EUA? US Energy Information Administration (EIA): Washington, DC, USA, 2020. Available online: https://www.eia.gov/tools/faqs/faq.php?id=74&t=11 (accessed on 12 January 2021).
- IPCC. Four Assessment Report. Intergovernmental Panel on Climate Change (IPCC): Geneva, Switzerland. Available online: https://www.ipcc.ch/site/assets/uploads/2018/05/ar4_wg1_full_report-1.pdf (accessed on 16 February 2023).
- AIRHA. Best Practice Guideline: Methods of Calculating Total Equivalent Warming Impact (TEWI); The Australian Institute of Refrigeration, air conditioning and Heating (AIRHA): Melbourne, Australia, 2012. [Google Scholar]
- ASHRAE. Thermal Guidelines for Data Processing Environments. In ASHRAE Technical Committee (TC) 9.9—Mission Critical Facilities, Technology Spaces, and Electronic Equipment, 3rd ed.; ASHRAE Datacom Series; American Society of Heating, Refrigerating and Air-Conditioning Engineers Inc.: Atlanta, GA, USA, 2011. [Google Scholar]
- OPTION. Um Substituto de Refrigerante r-410a de alto Desempenho e Ambientalmente Sustentável para AC e Chillers. Available online: https://www.opteon.com/en/products/refrigerants/xl41 (accessed on 14 February 2023).
- Ahmed, M.H.; Katta, N.M.; Fouad, M. Evaluation and optimization of solar desiccant wheel performance. Renew. Energy 2005, 30, 305–325. [Google Scholar] [CrossRef]
- Emani, M.S.; Mandal, B.K. The use of natural refrigerants in refrigeration and air conditioning systems: A review. IOP Conf. Ser. Mater. Sci. Eng. 2018, 377, 012064. [Google Scholar] [CrossRef]
- Raman, R.; Nair, V.K.; Prakash, V.; Patwardhan, A.; Nedungadi, P. Green-hydrogen research: What have we achieved, and where are we going? Bibliometrics analysis. Energy Rep. 2022, 8, 9242–9260. Available online: https://www.sciencedirect.com/science/article/pii/S235248472201321X (accessed on 14 February 2023). [CrossRef]
- Narayanan, R.; Al Anazi, A.A.; Pippia, R.; Rasul, M.G. Solar Desiccant Cooling System for a Commercial Building in Kuwait’s Climatic Condition. Energies 2022, 15, 4102. [Google Scholar] [CrossRef]
- EUROVENT. Air to Air Regenerative Heat Exchangers; Identification: ECP 10 Revision; EUROVENT: Brussels, Belgium, 2020. [Google Scholar]
Disclaimer/Publisher’s Note: The statements, opinions and data contained in all publications are solely those of the individual author(s) and contributor(s) and not of MDPI and/or the editor(s). MDPI and/or the editor(s) disclaim responsibility for any injury to people or property resulting from any ideas, methods, instructions or products referred to in the content. |
© 2023 by the authors. Licensee MDPI, Basel, Switzerland. This article is an open access article distributed under the terms and conditions of the Creative Commons Attribution (CC BY) license (https://creativecommons.org/licenses/by/4.0/).