


High Gain Improved Planar Yagi Uda Antenna for 2.4 GHz Applications and Its Influence on Human Tissues

 ,
,  ,
,  and
and
Abstract
:1. Introduction

| Reference | Antenna | Dimensions (mm × mm × mm) | Bandwidth (%) | Peak Gain (dBi) |
|---|---|---|---|---|
| [3] |  | 55 × 48 × 1.6 | 8% | 4.34 |
| [8] |  | 76 × 86 | 53.5% | 4.65 |
| [9] |  | 100 × 98 × 0.6 | 7.4% | 7.09 |
| [13] |  | 68 × 68 × 0.8 | 15% | 3.05 |
| [17] |  | 83.63 × 184 × 1.5 | 28.6% | 5.7 |
| [18] | 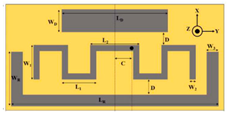 | 42 × 20 × 0.25 | 13% | 4.1 |
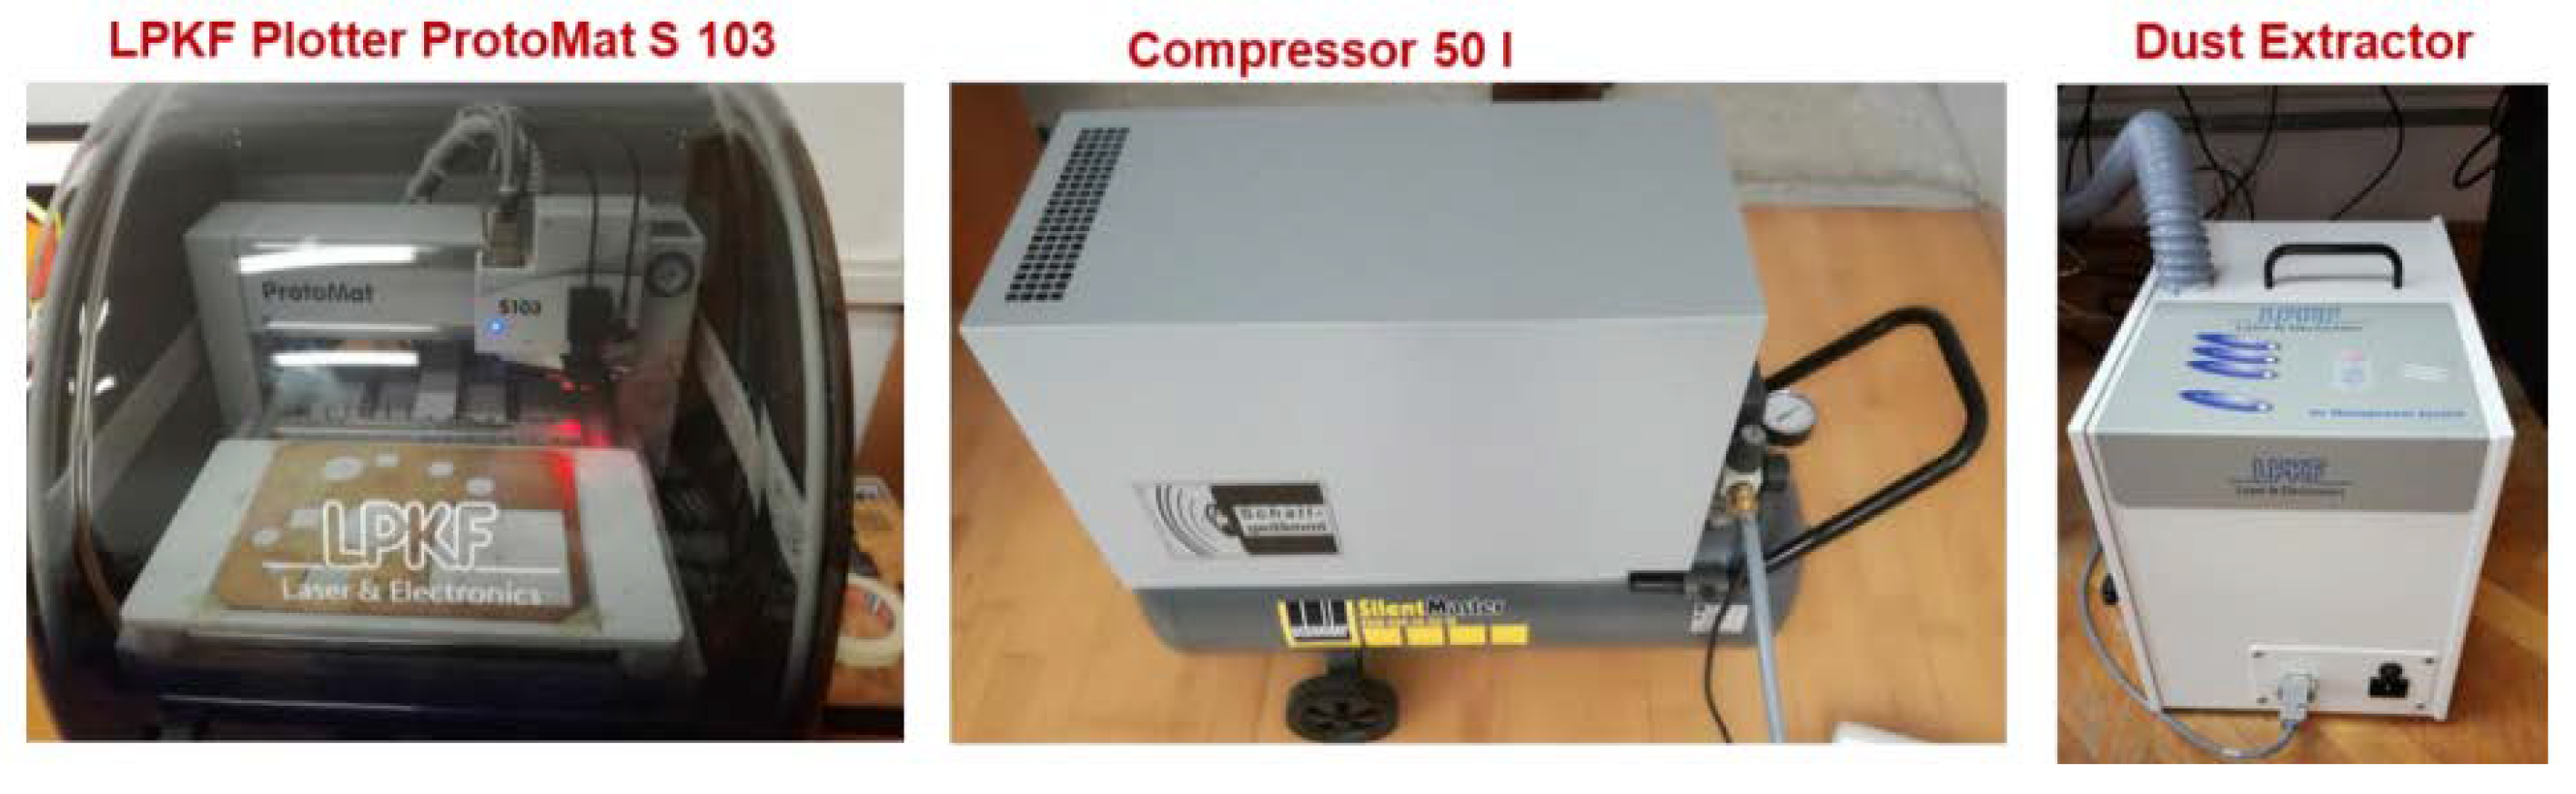
2. Materials and Methods
2.1. Influence of the Dielectric Material on the Antenna Characteristics
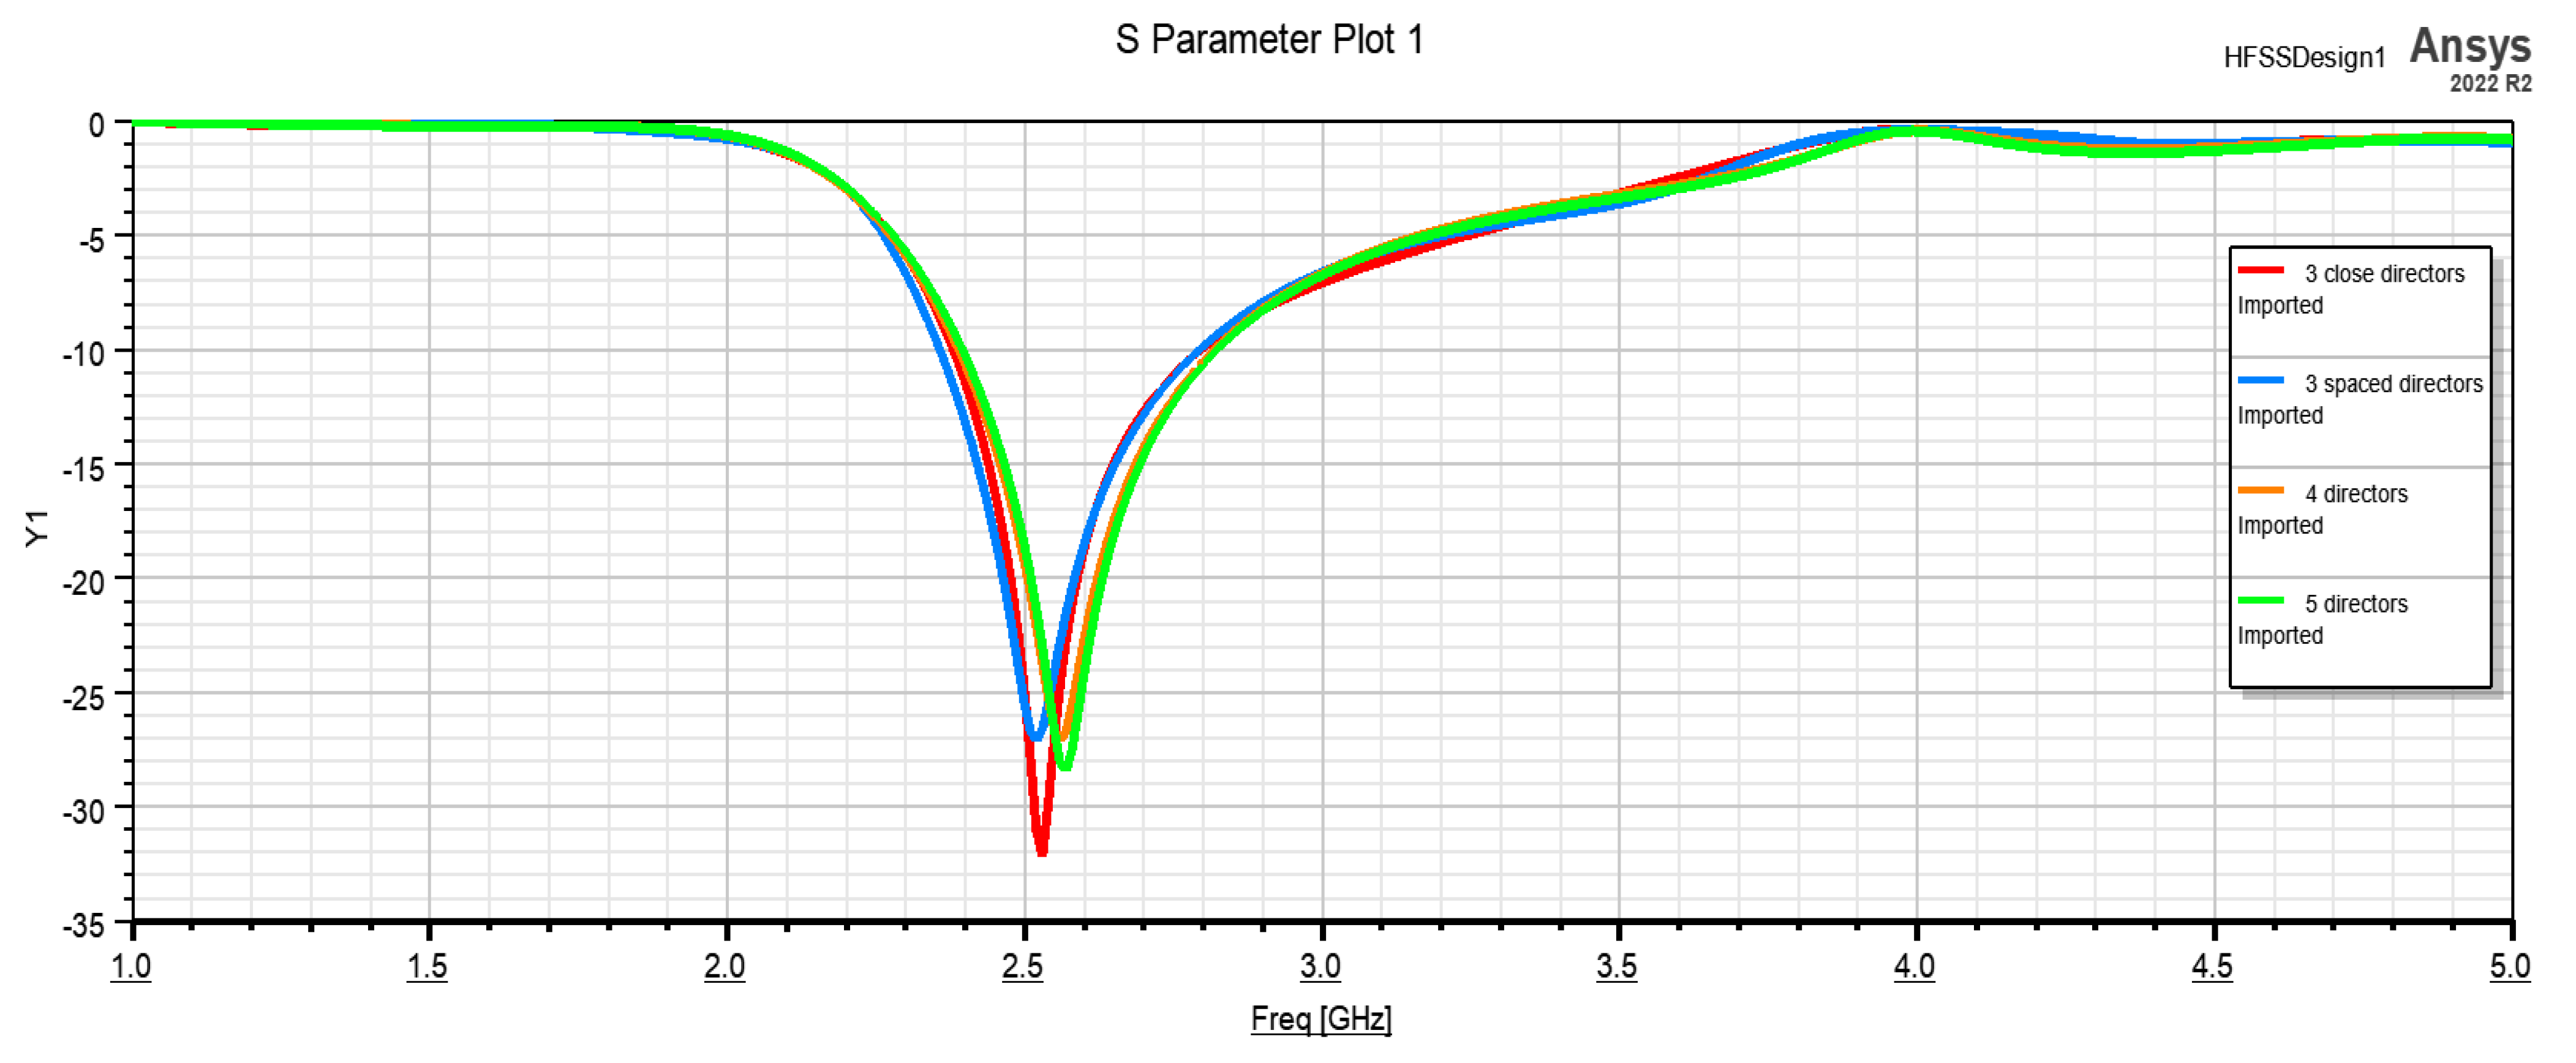
2.2. Different Number of Directors
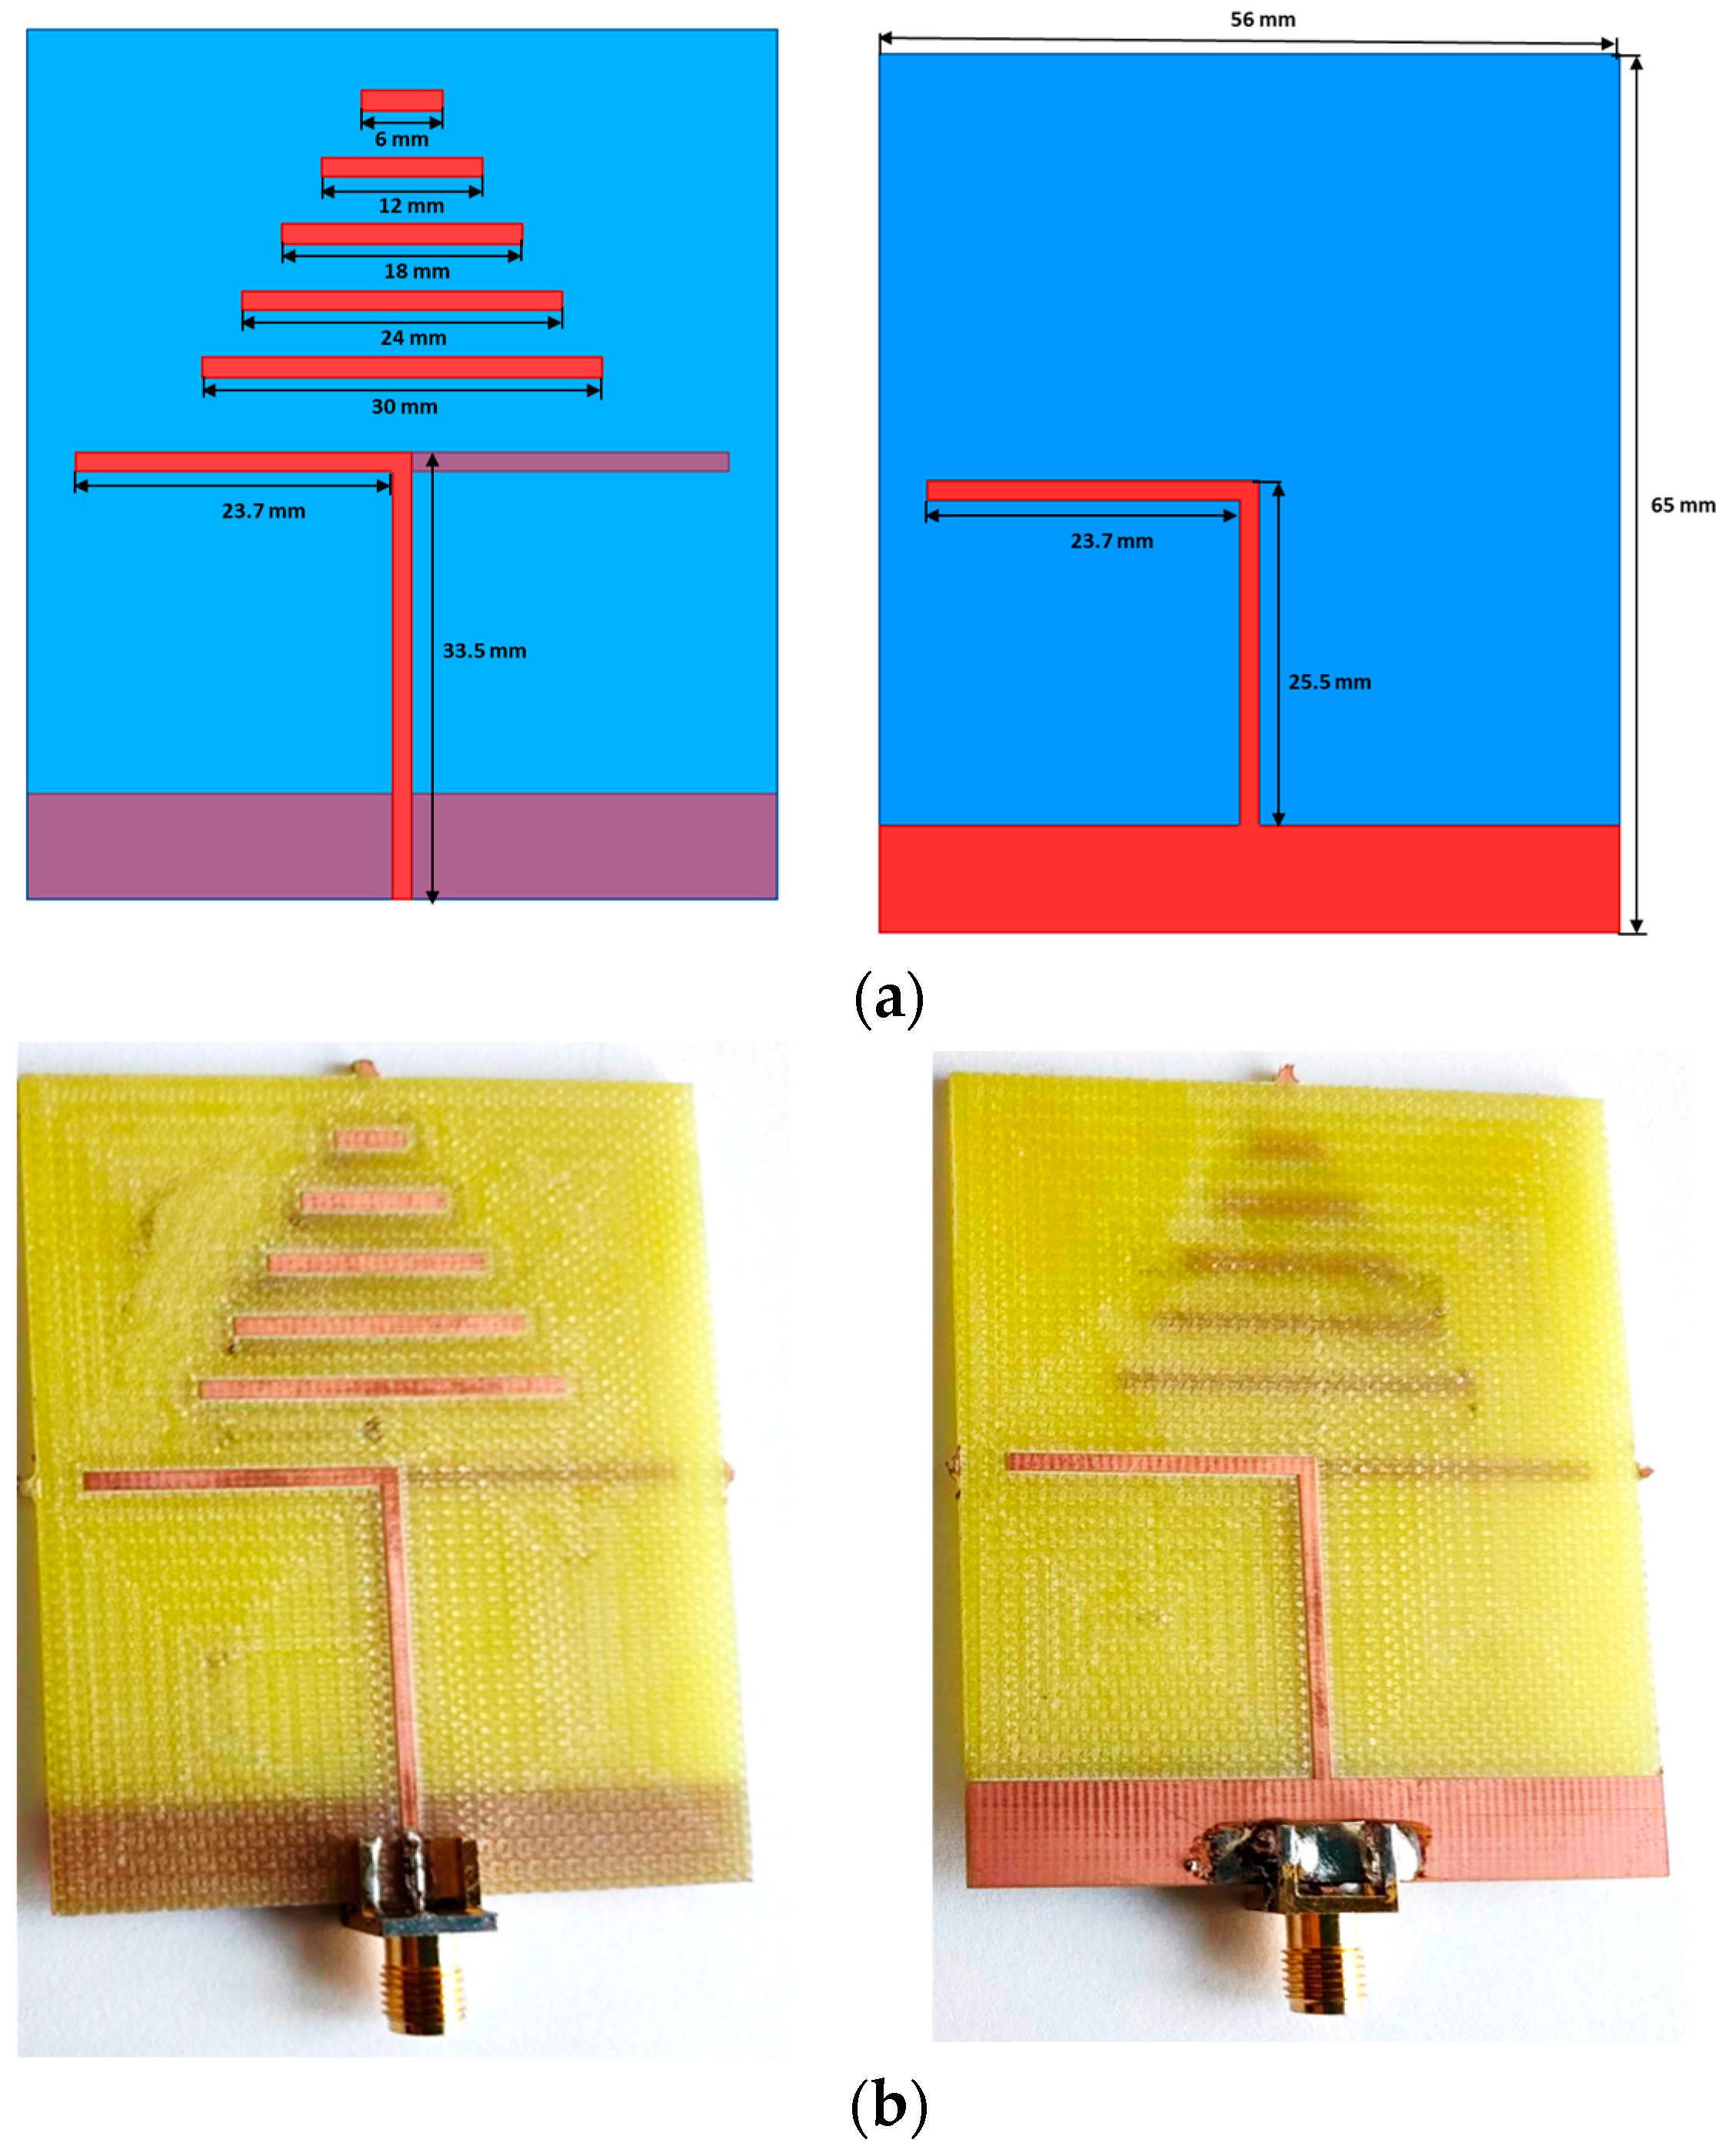
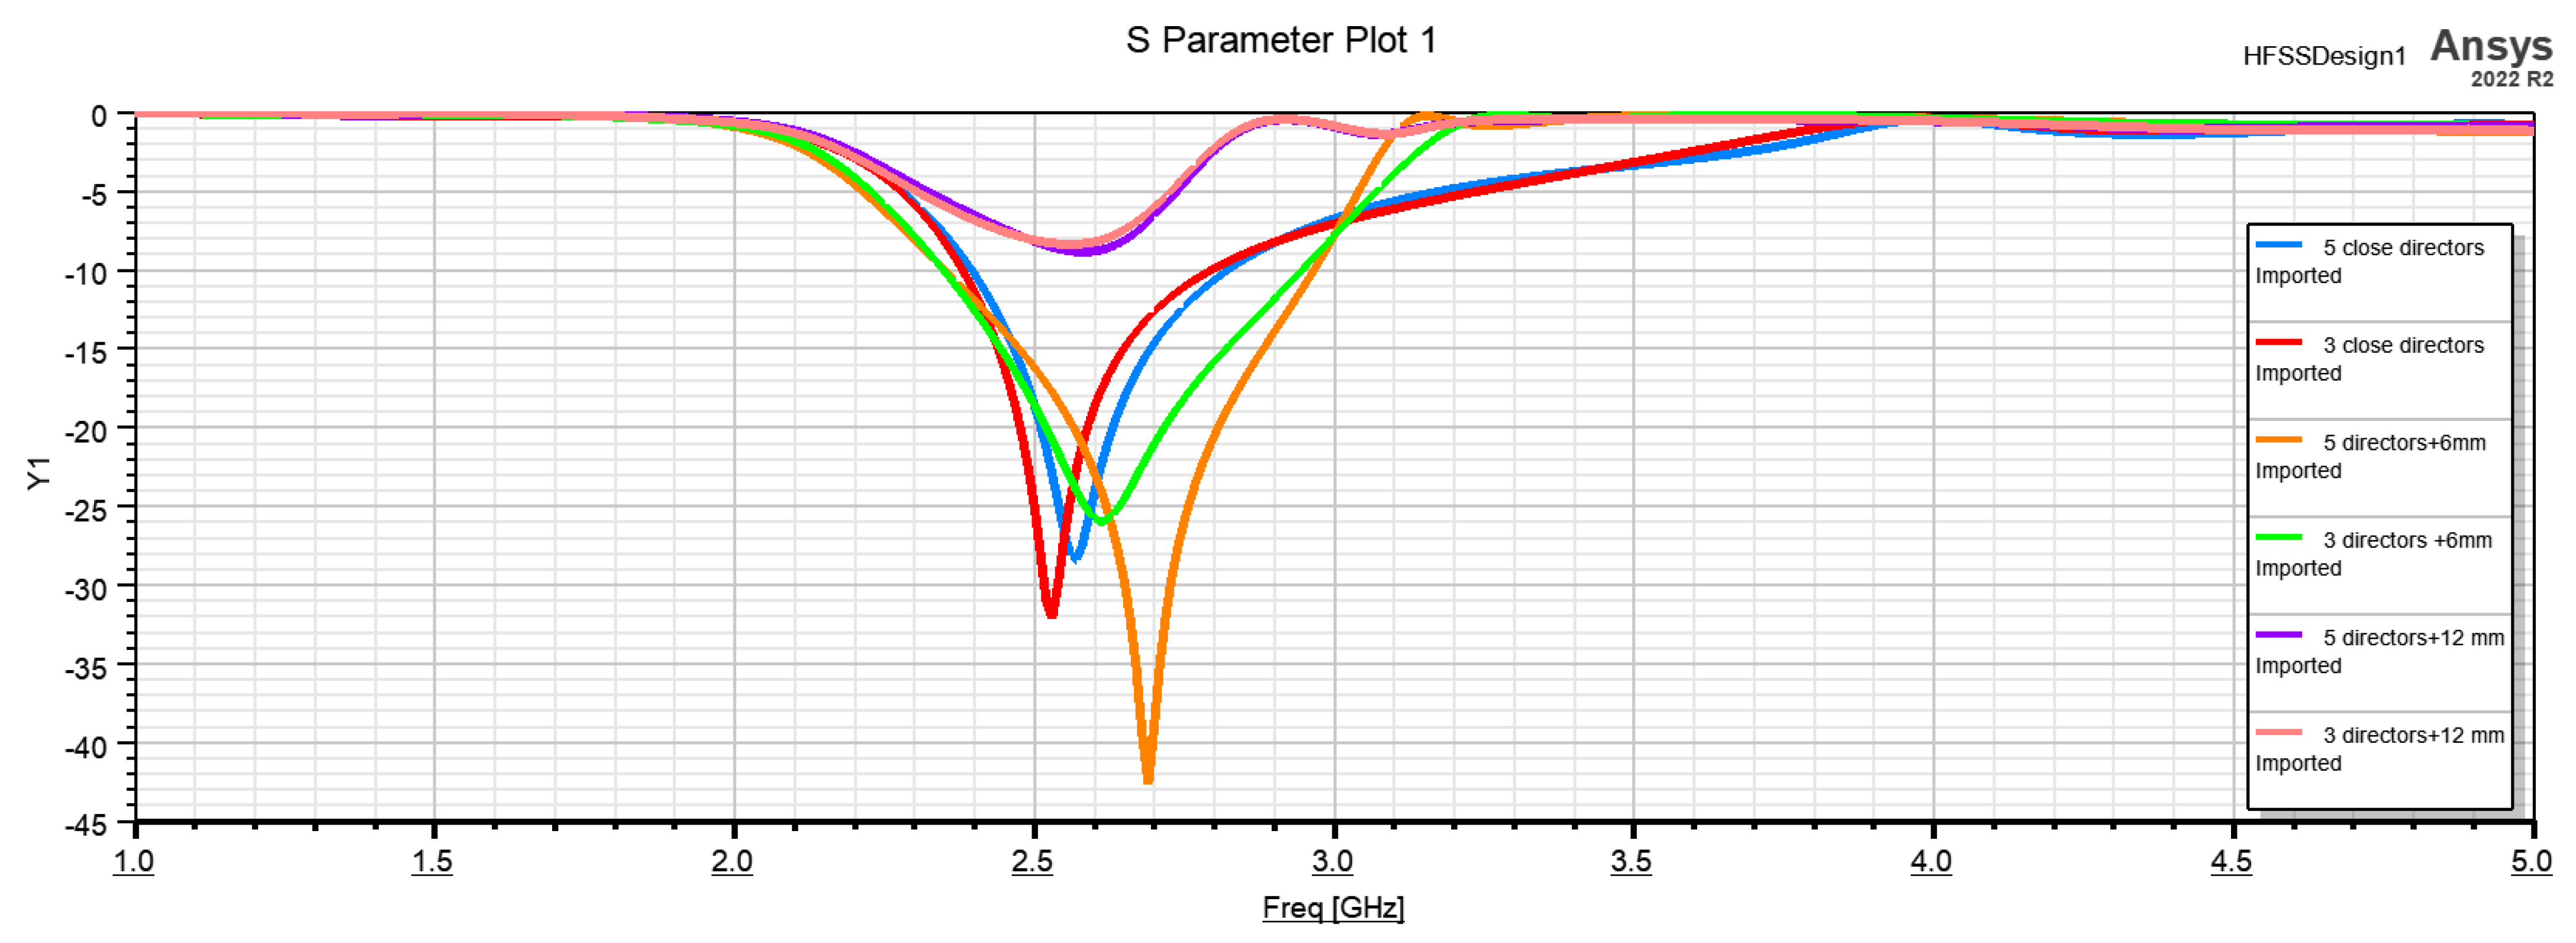
2.3. Different Dimensions of the Directors
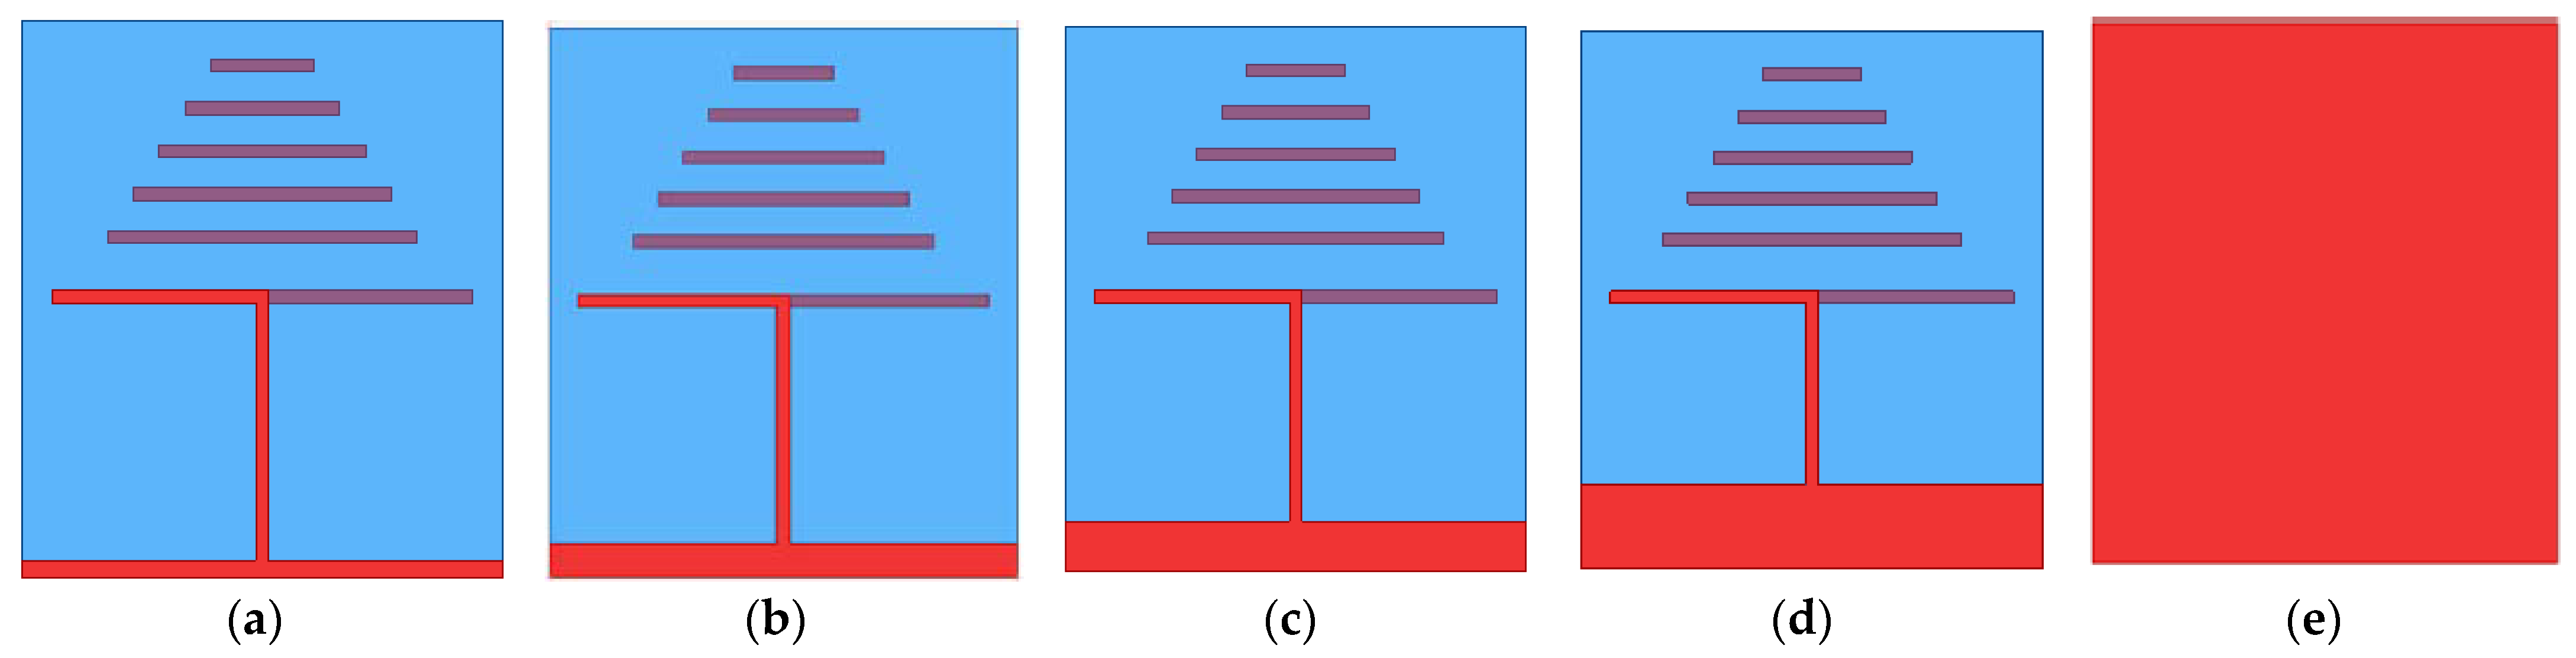
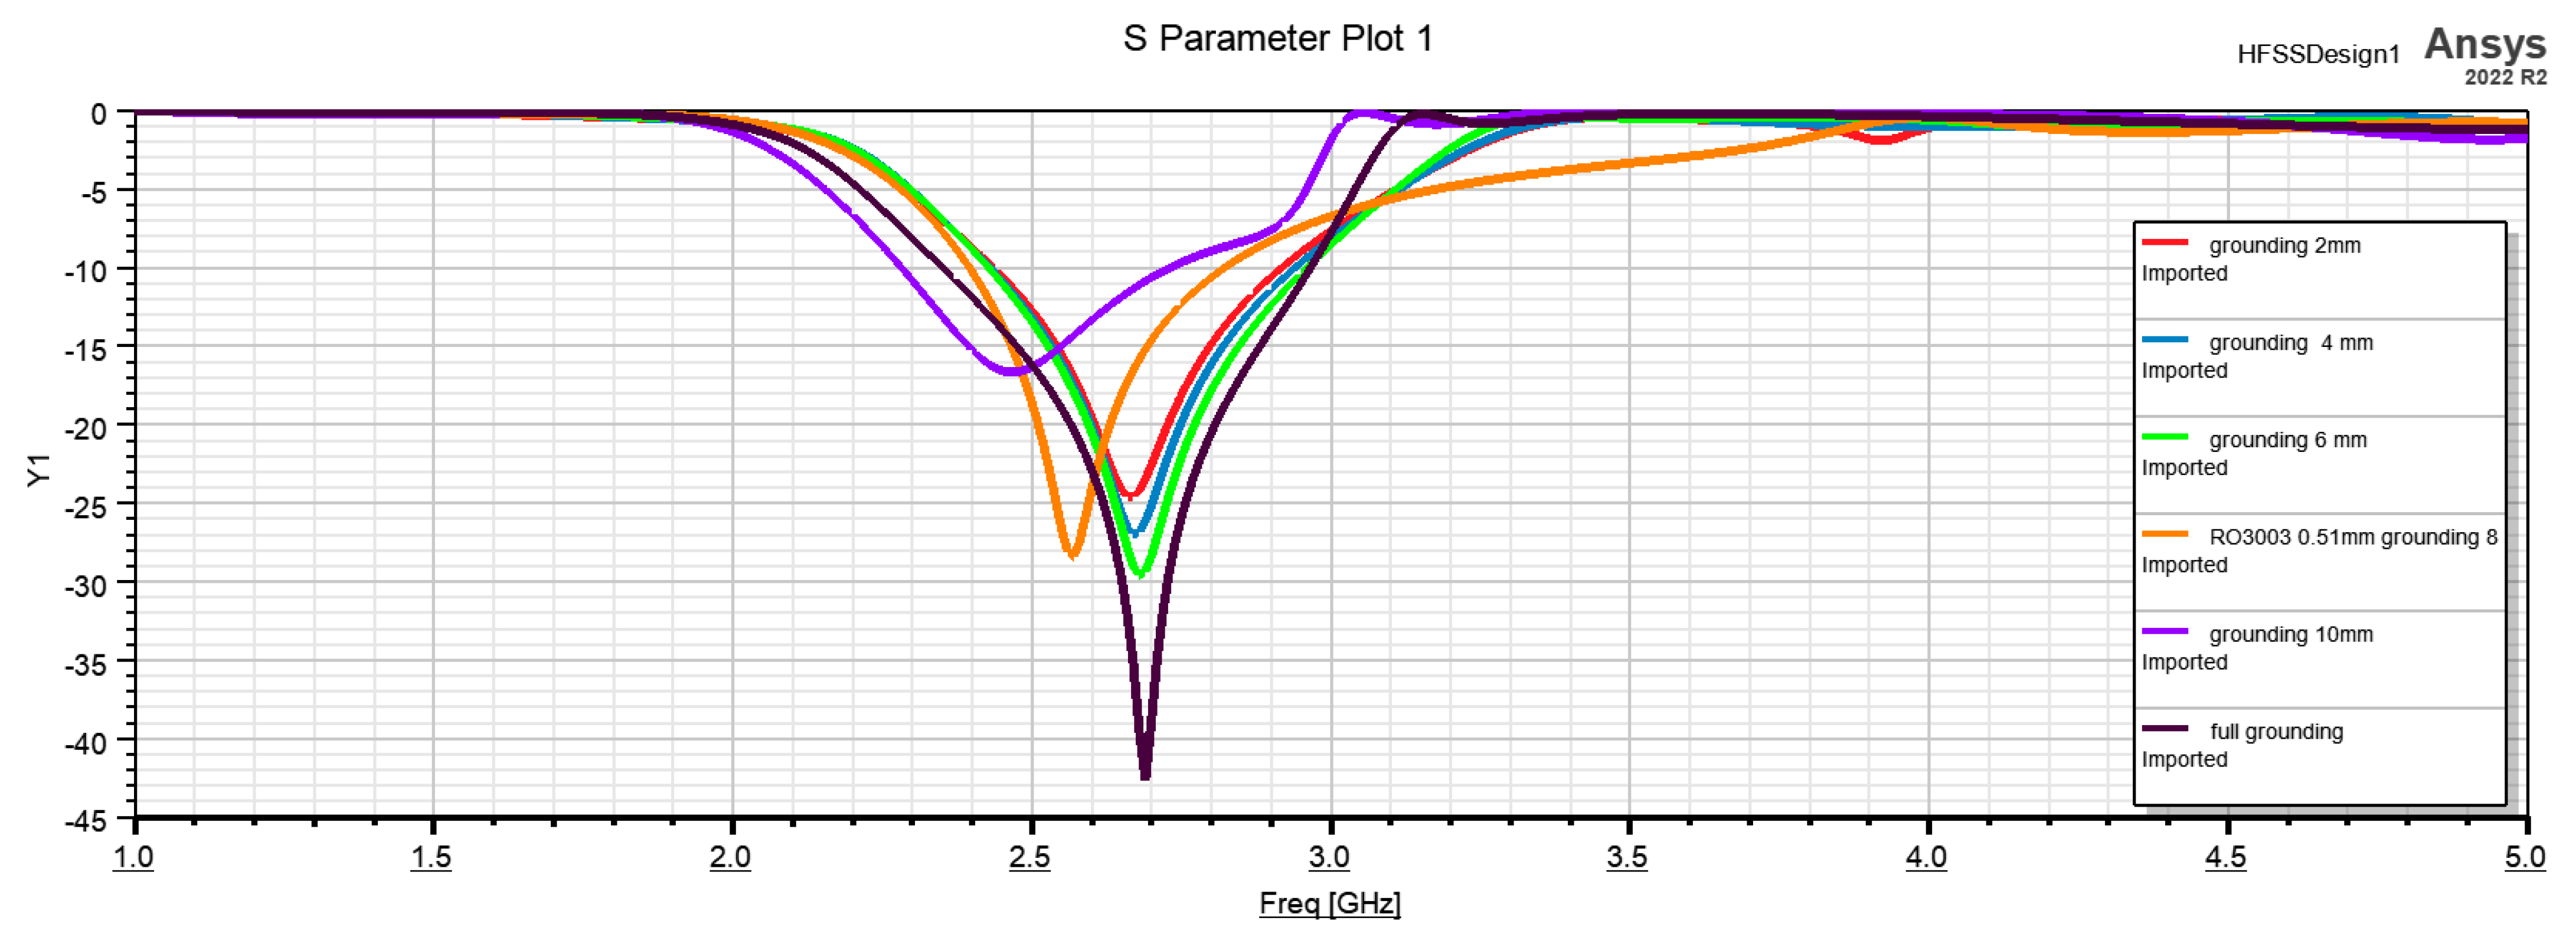
2.4. Different Grounding Dimensions for the Antenna
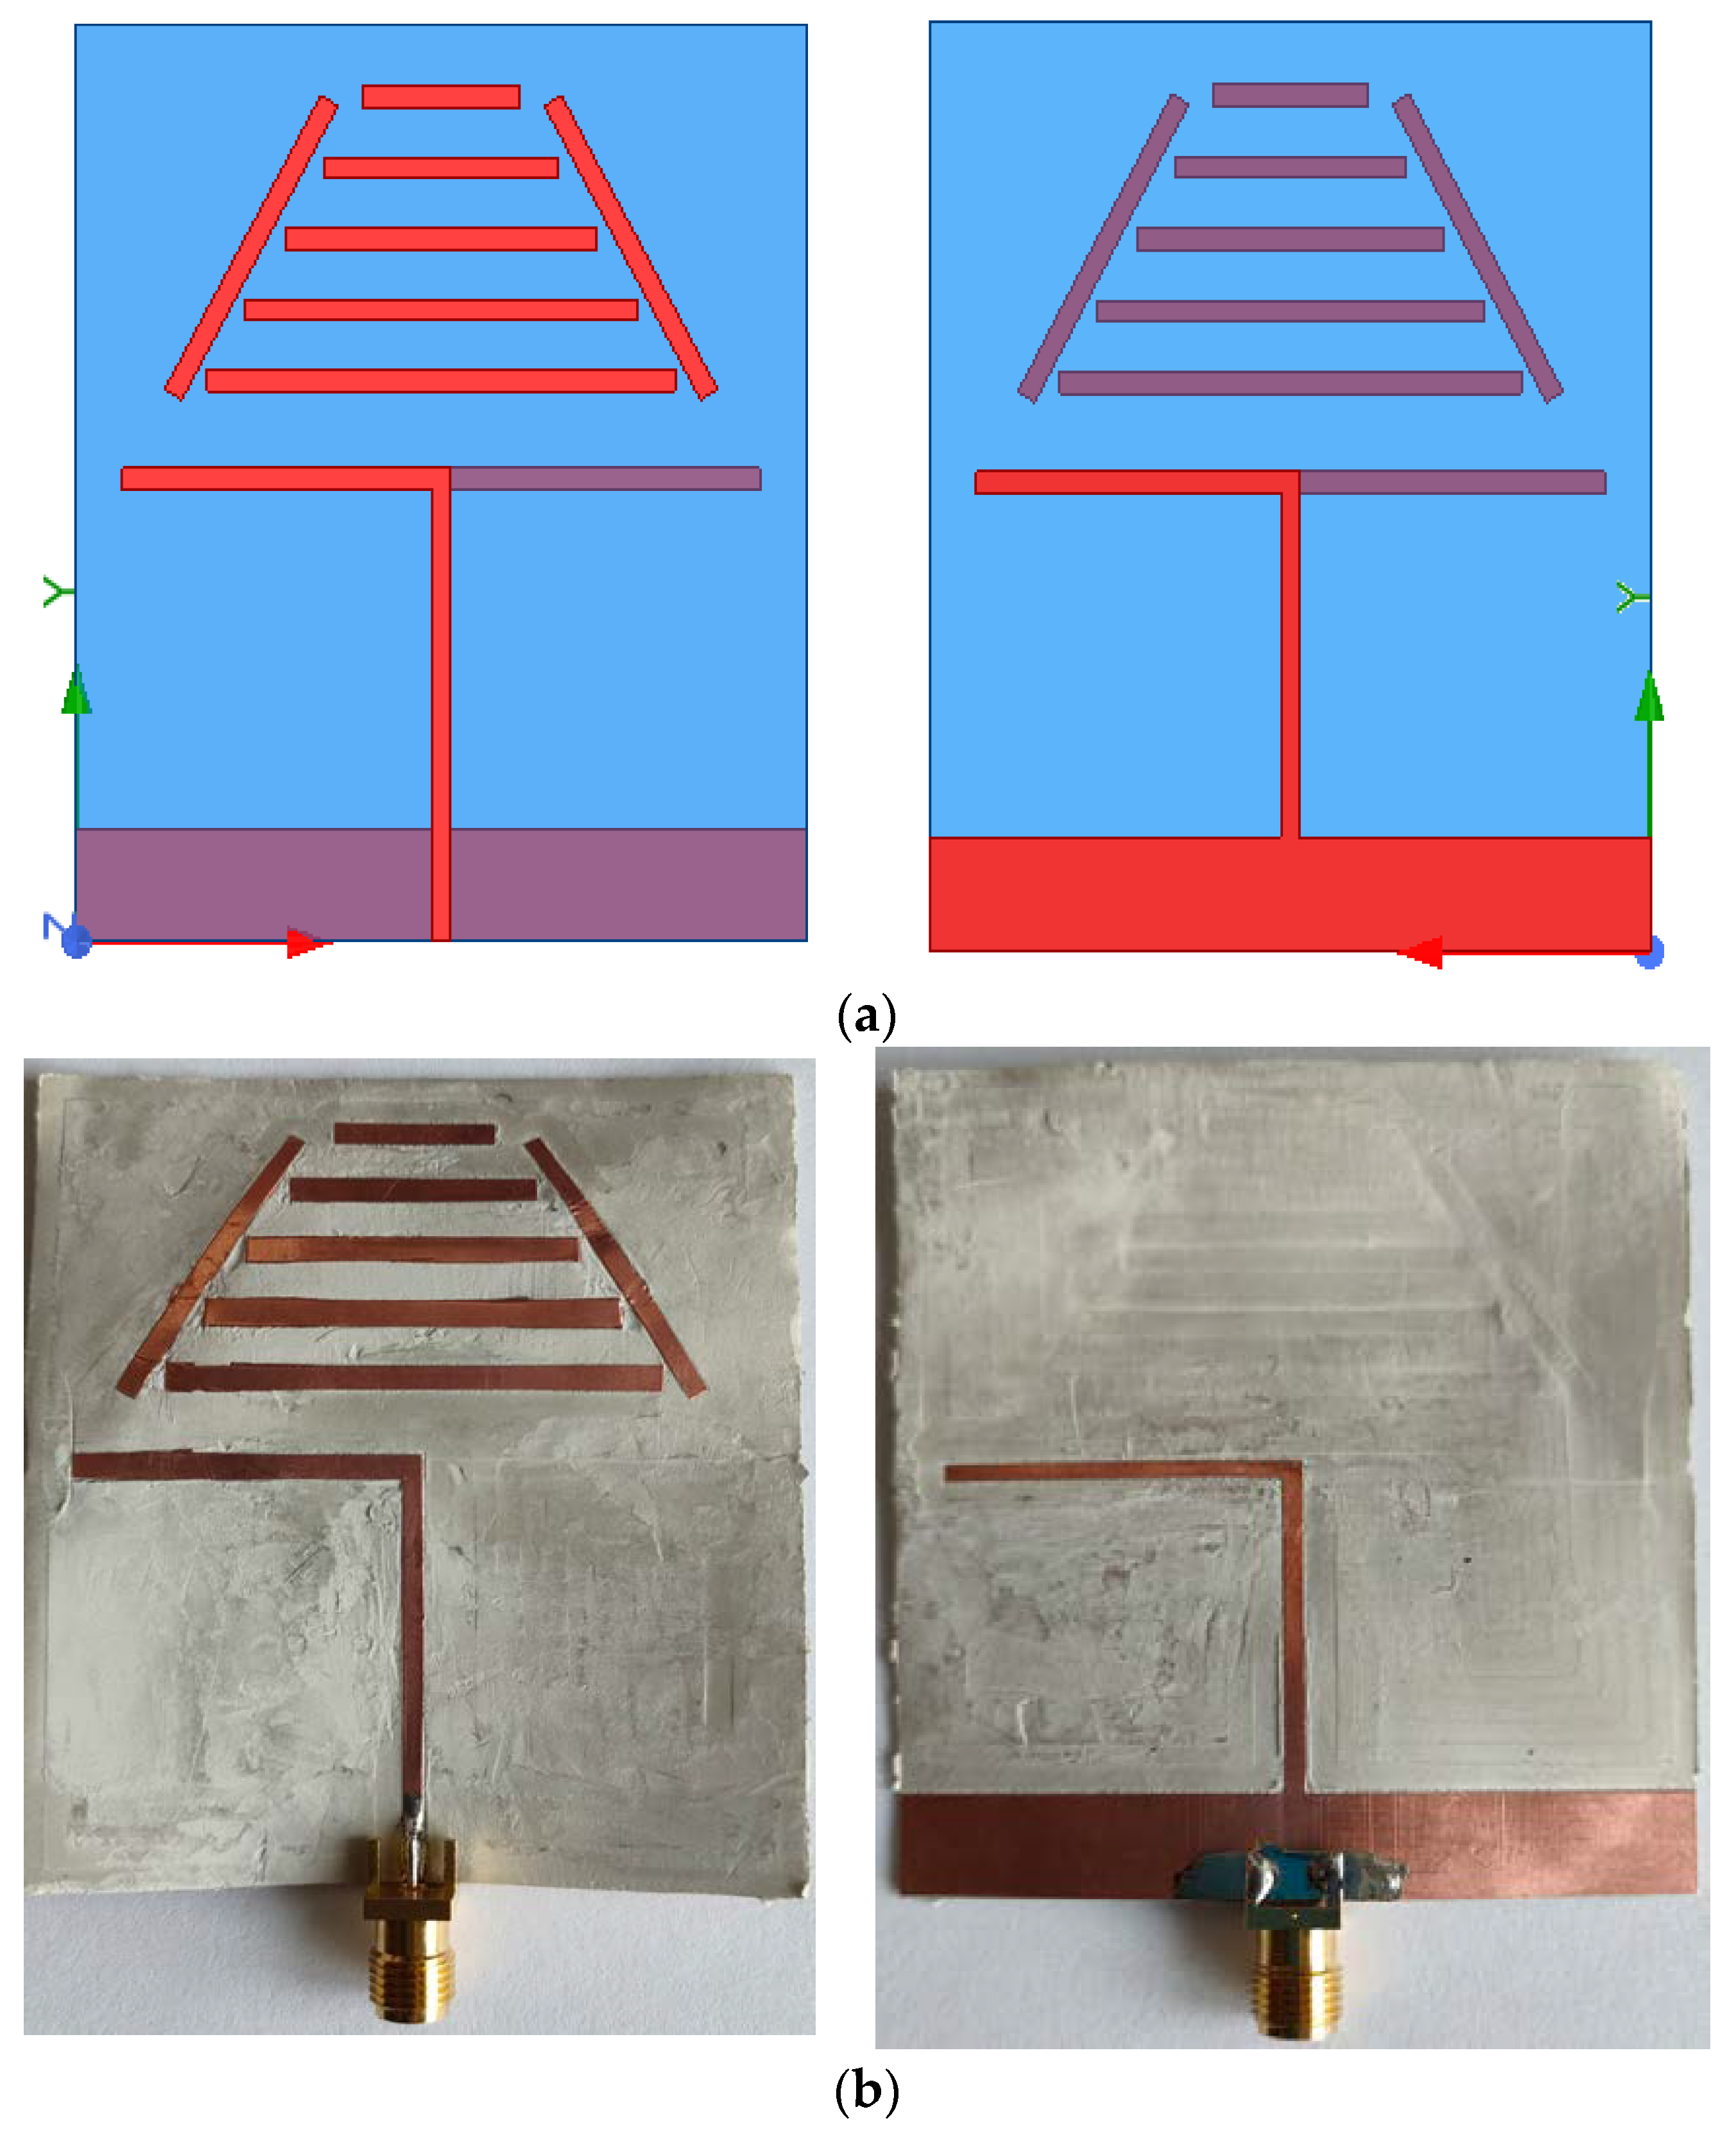
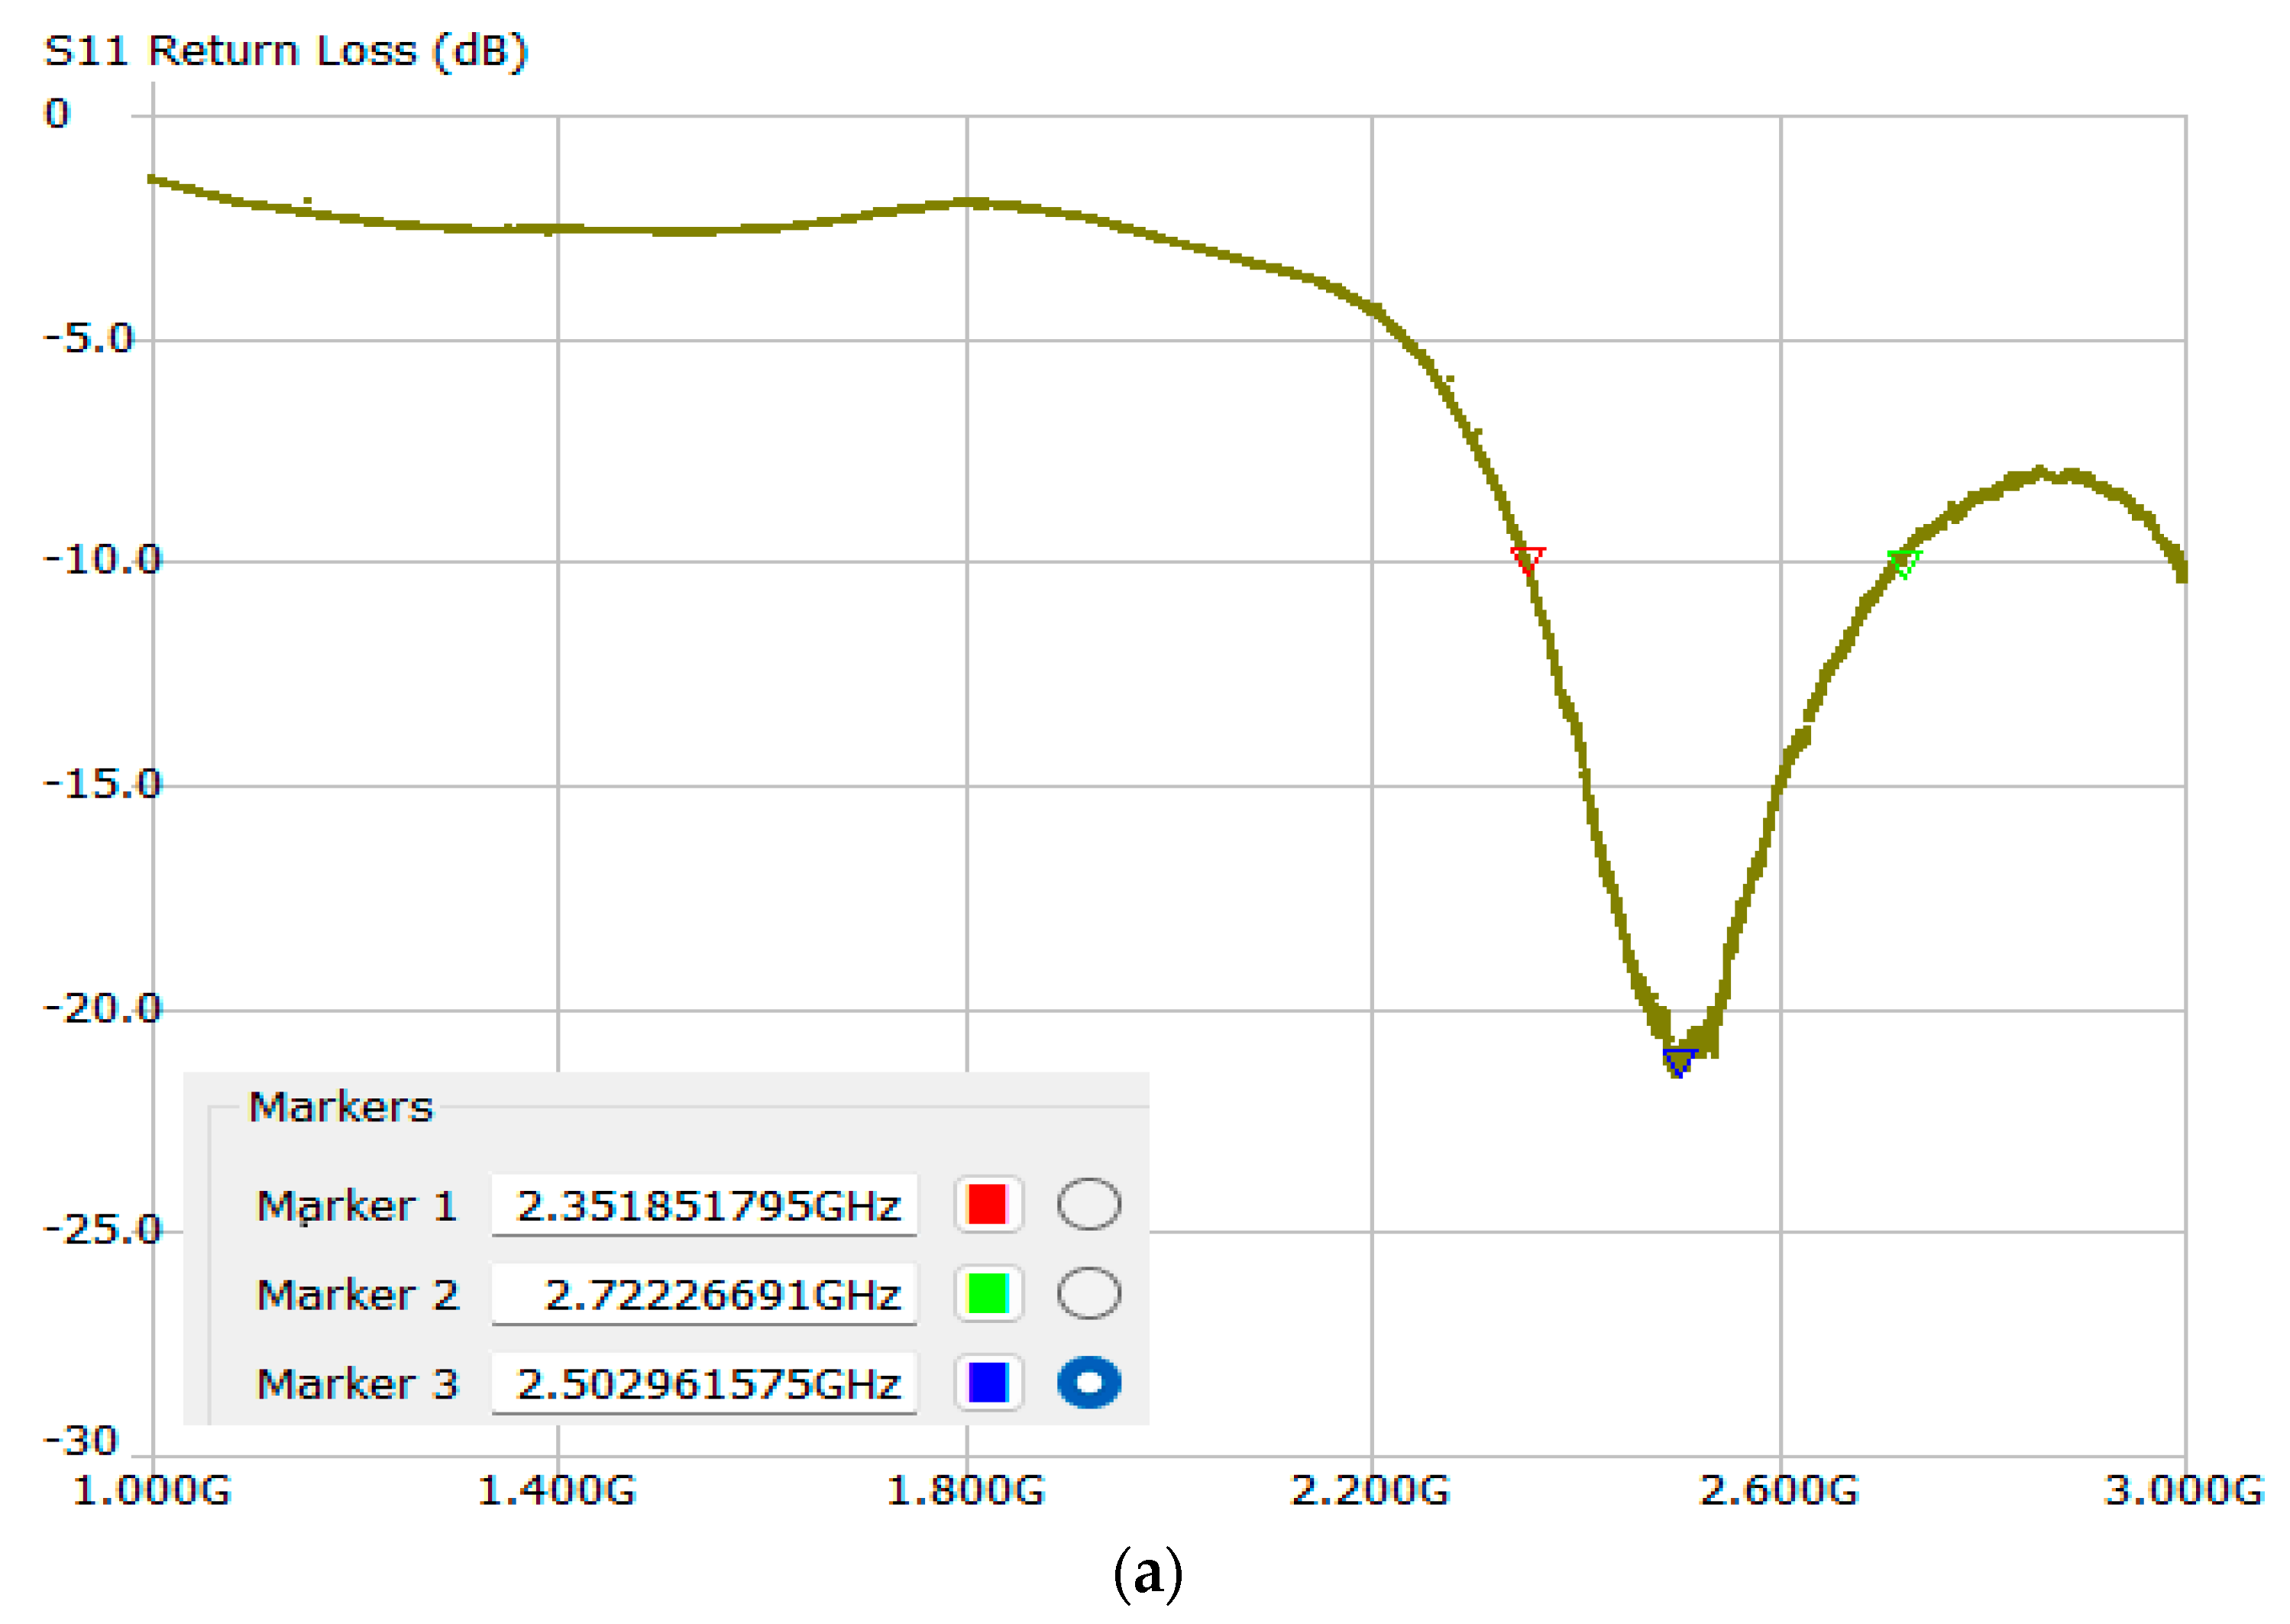
2.5. Improvement of the Optimized Structures Gain
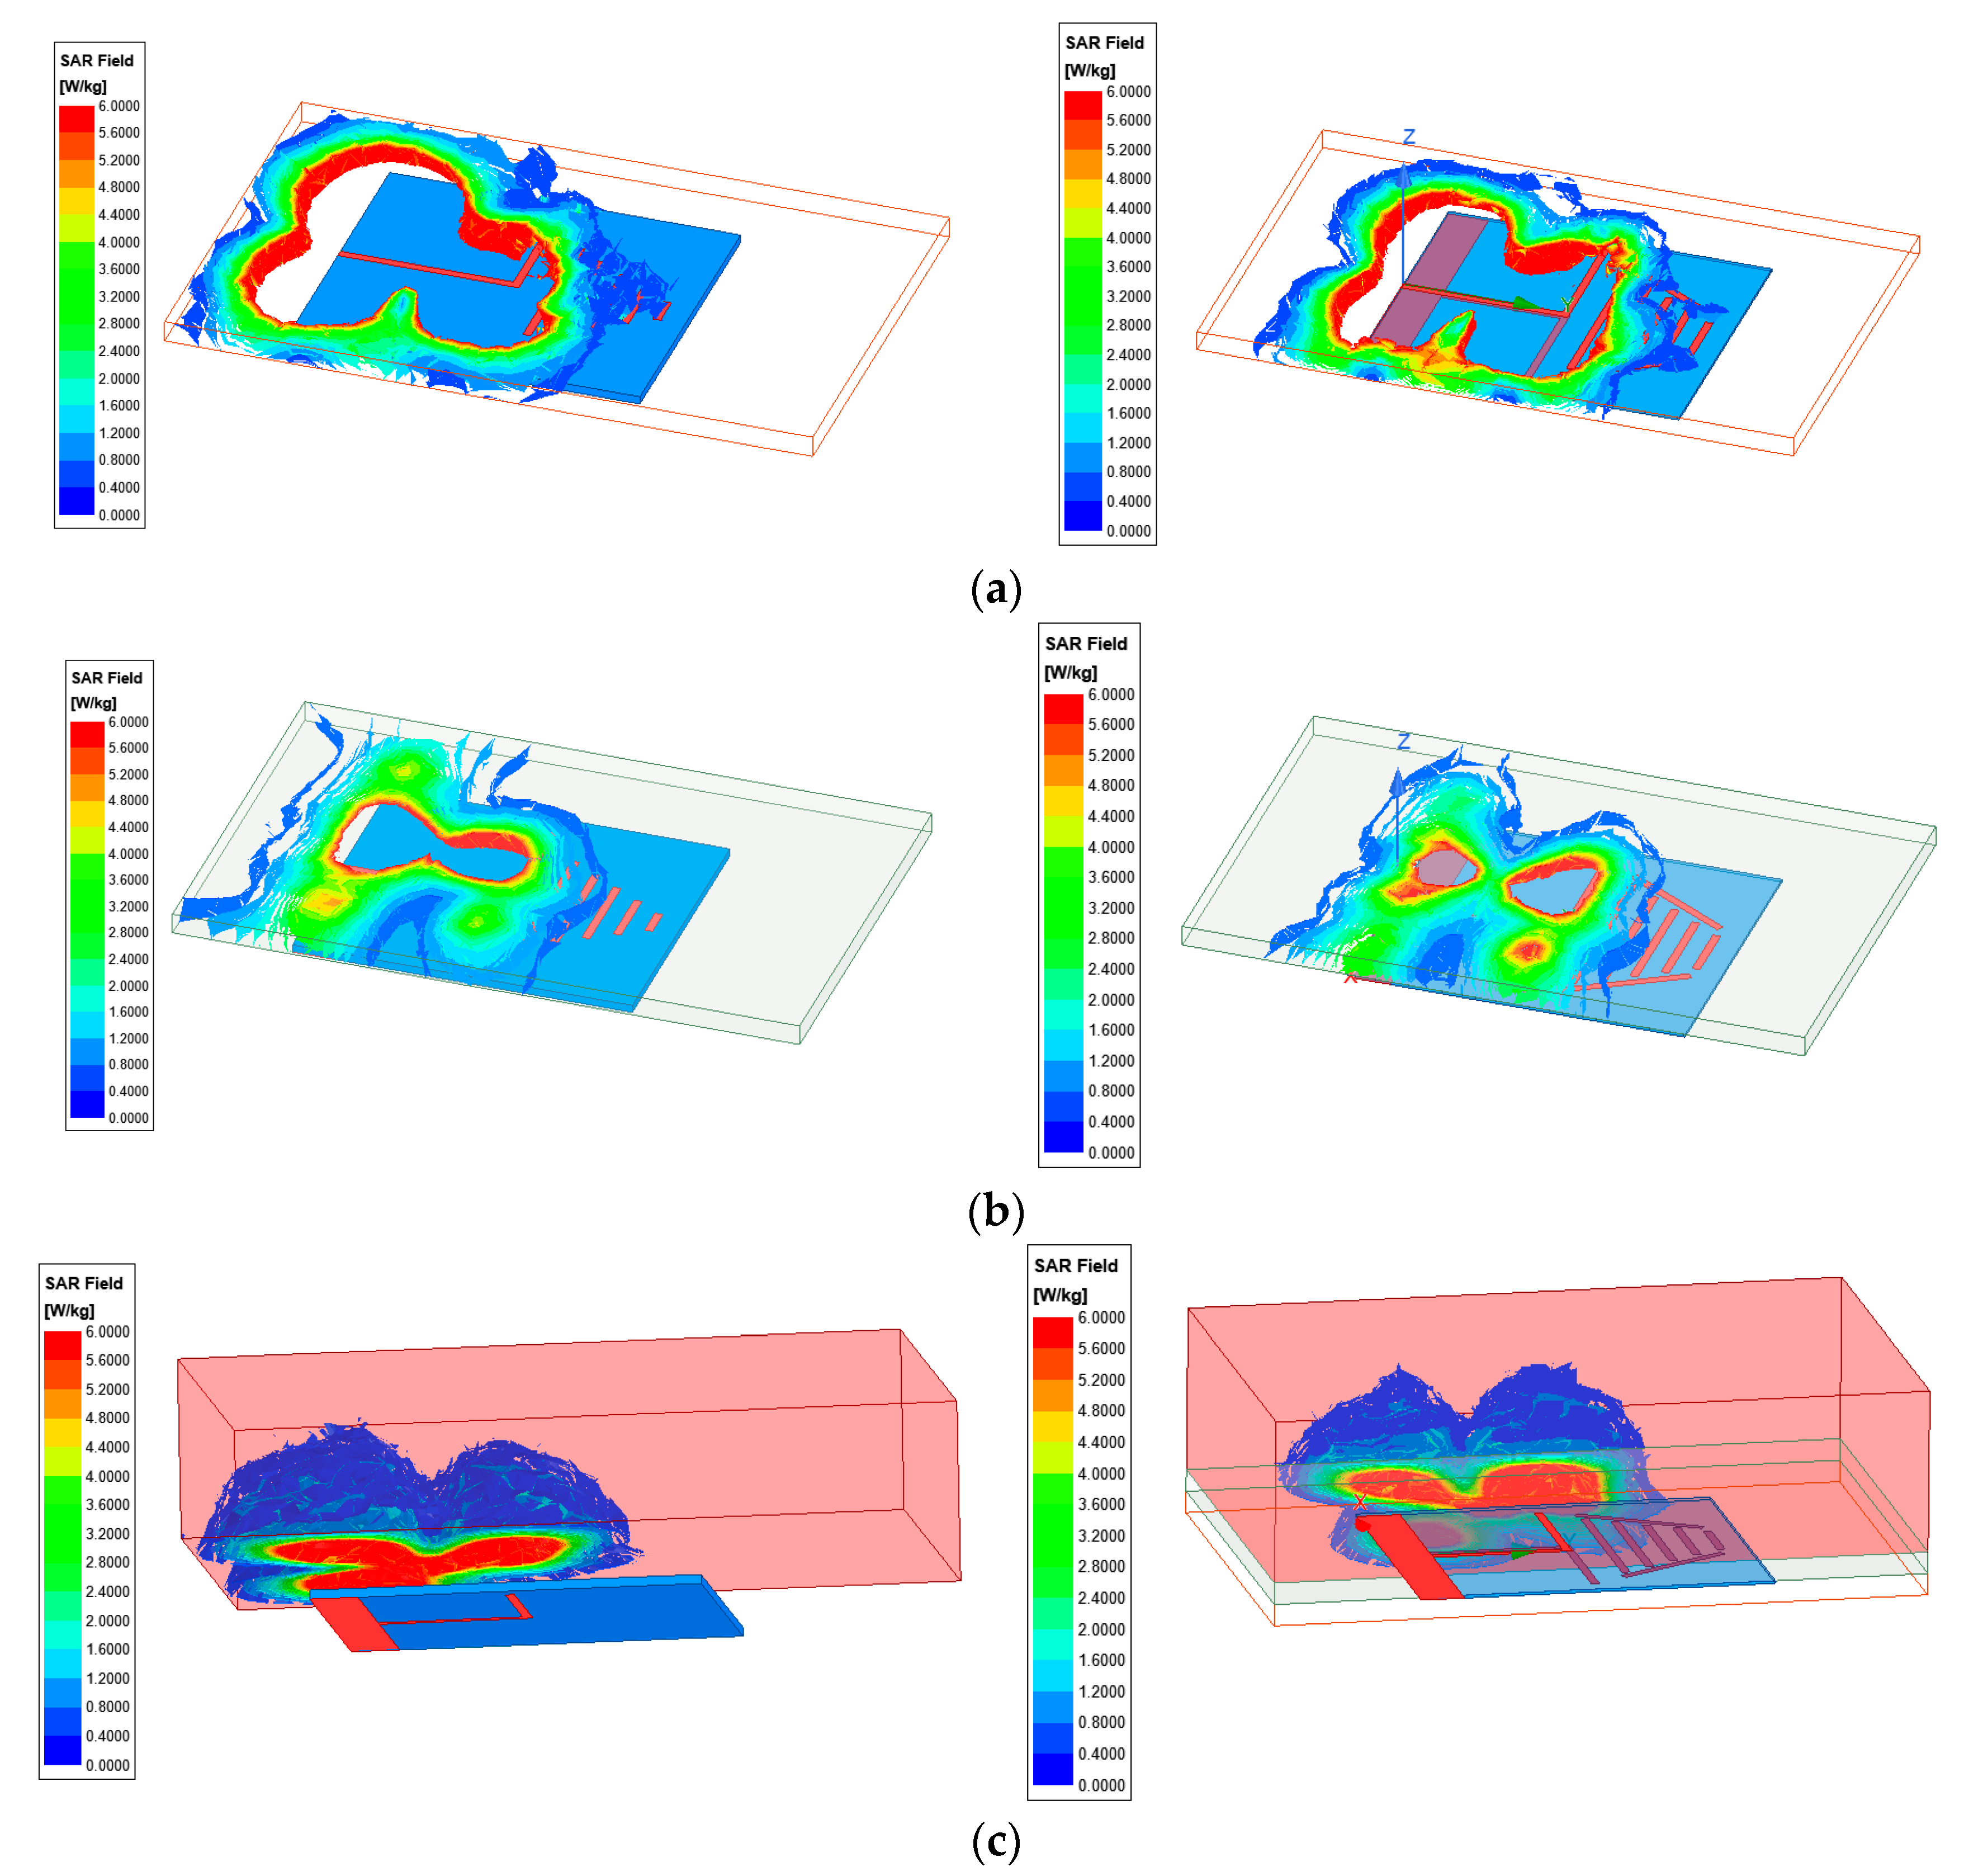
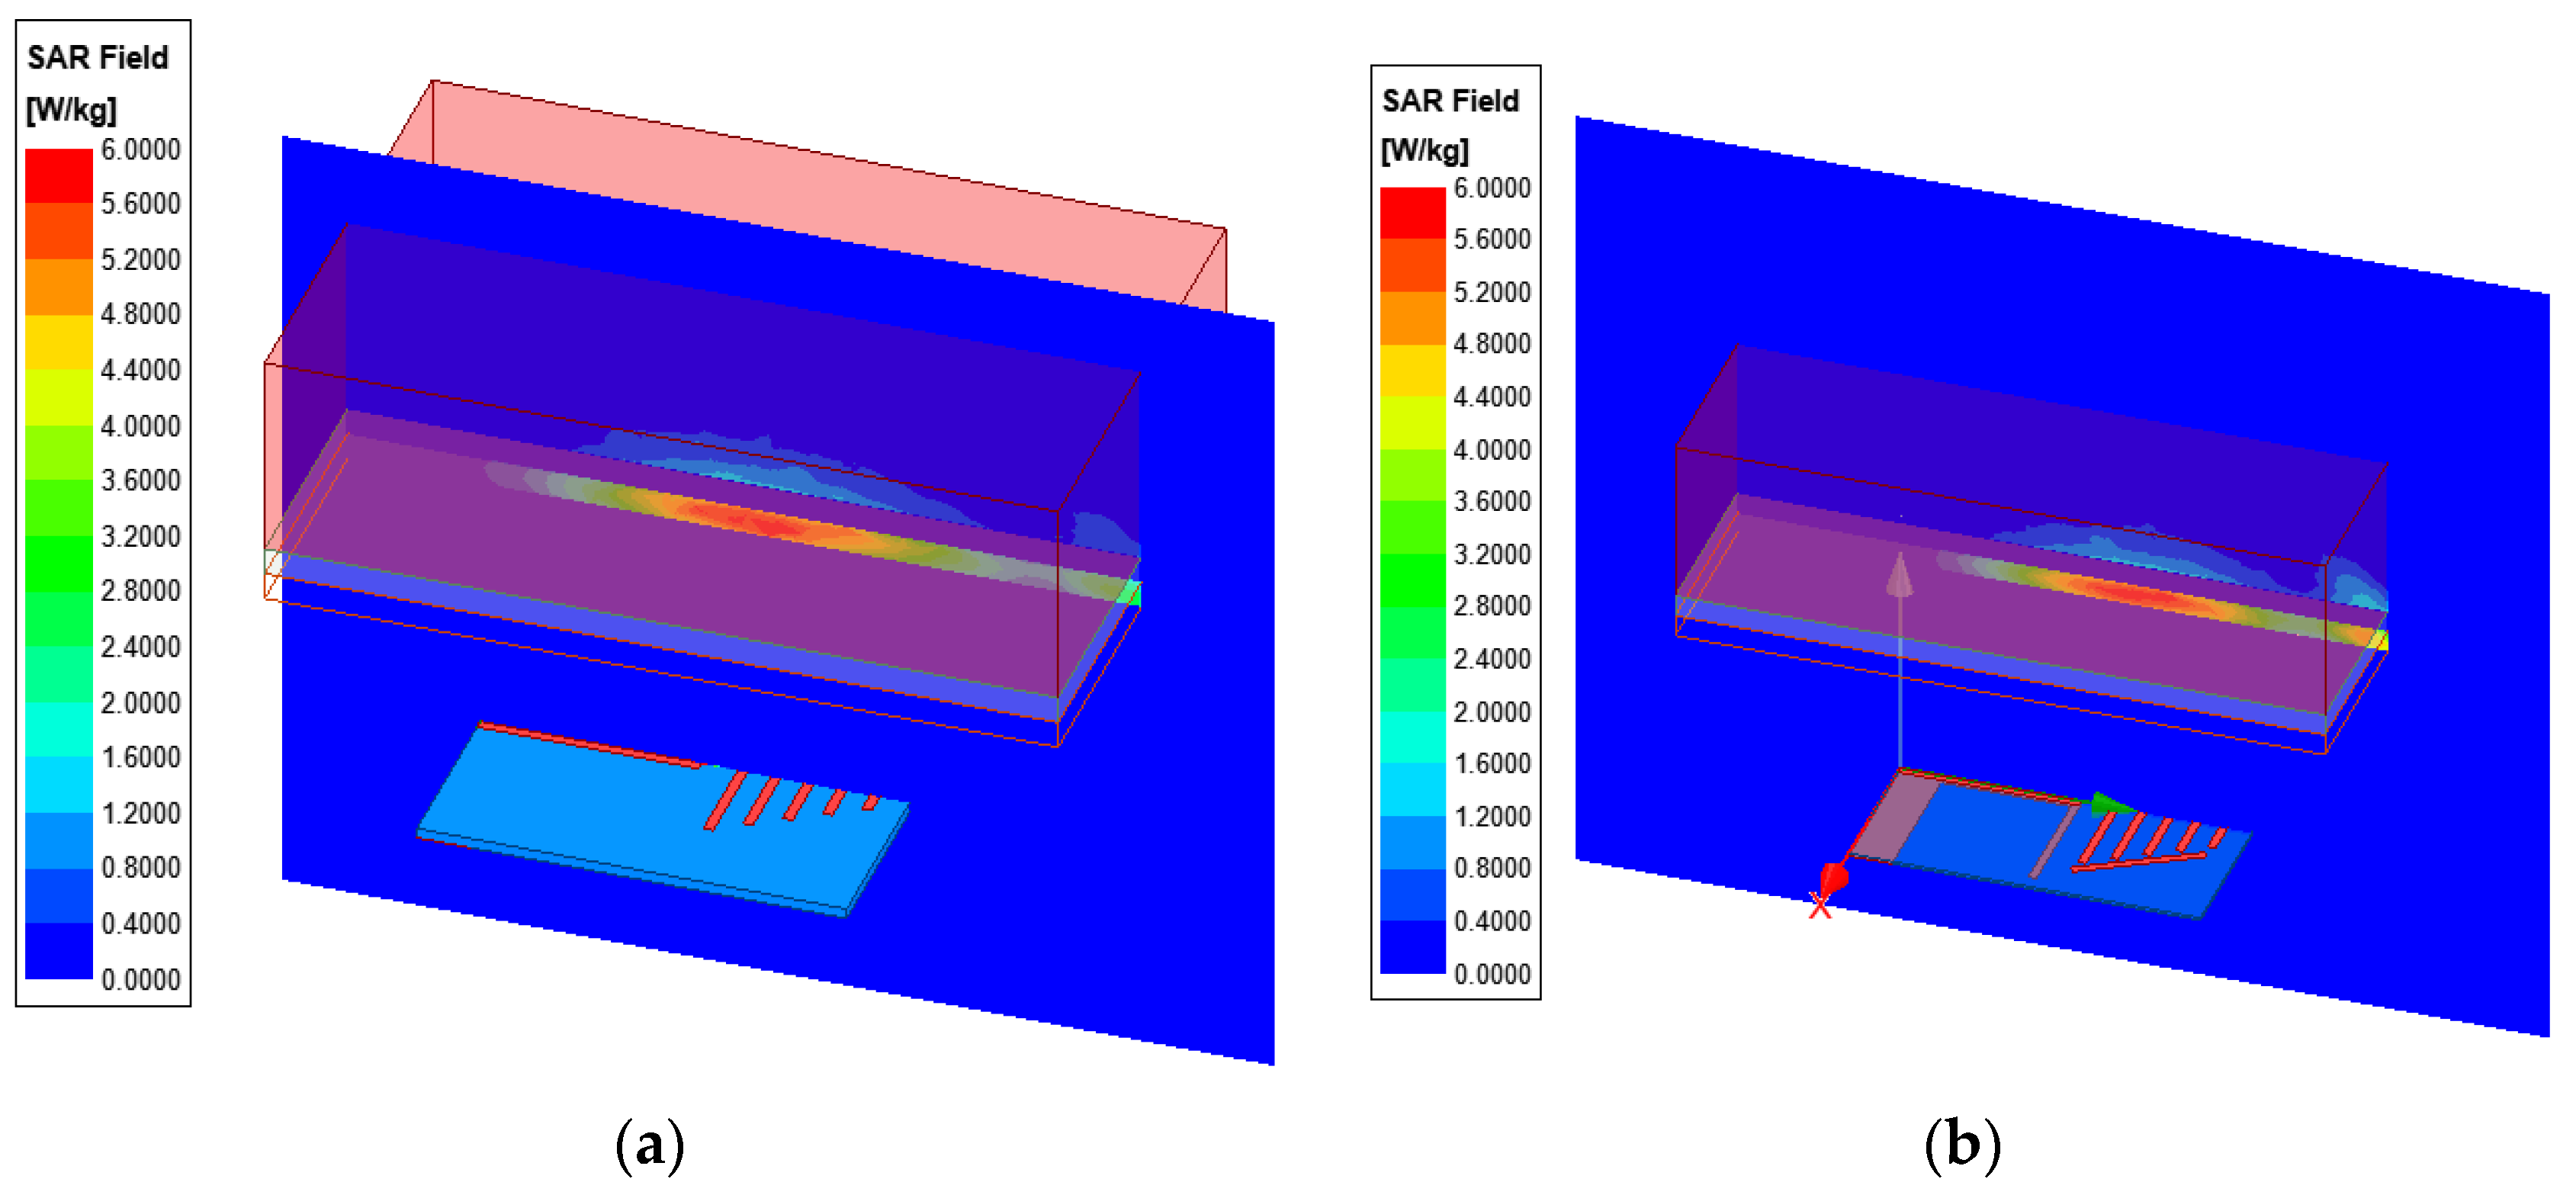
3. Specific Absorption Rates and Radiated Power Density in the Vicinity of the Structures Analyzed
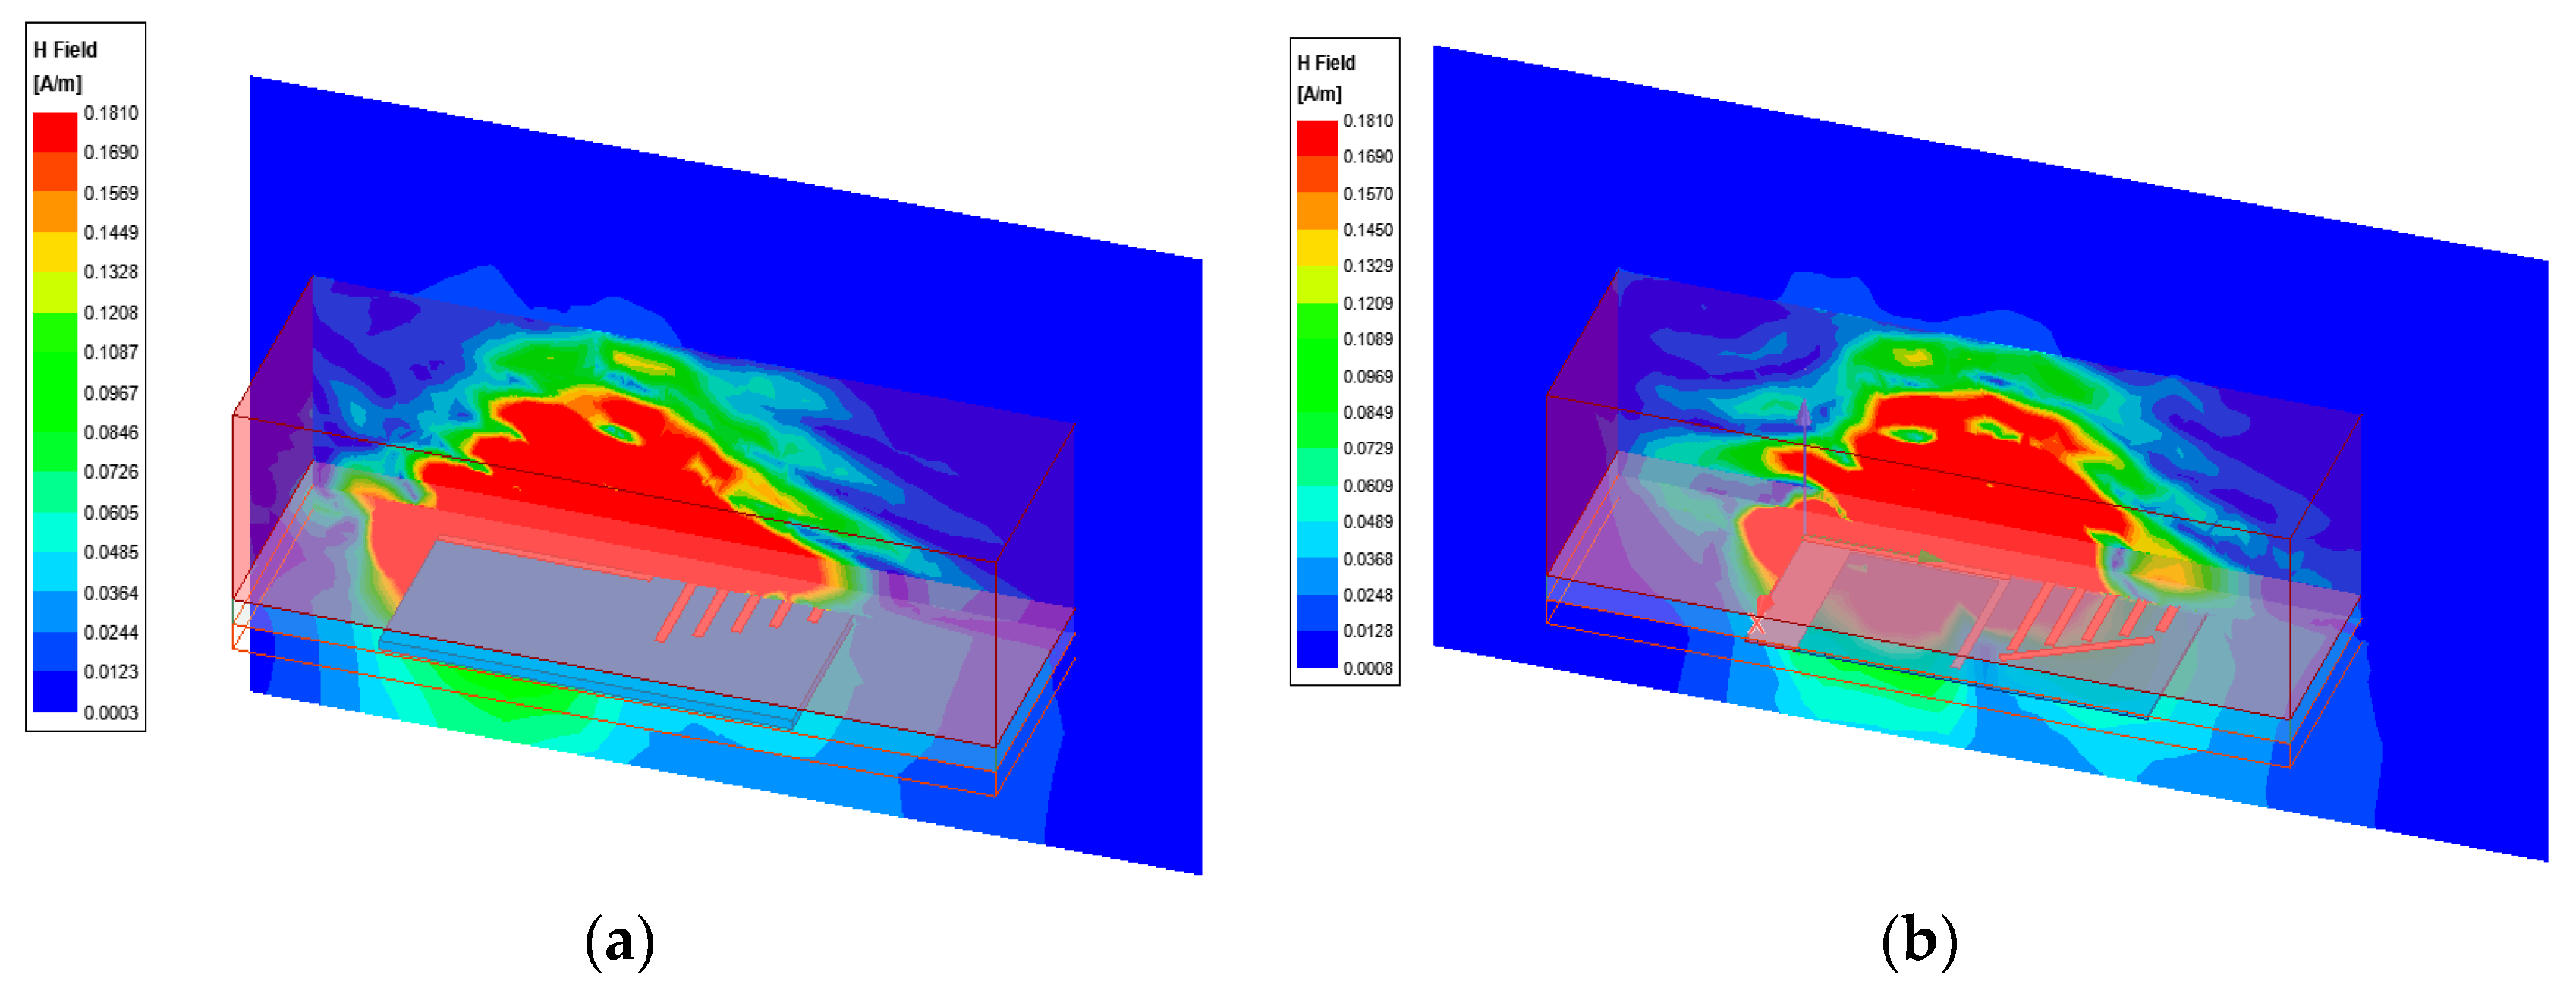
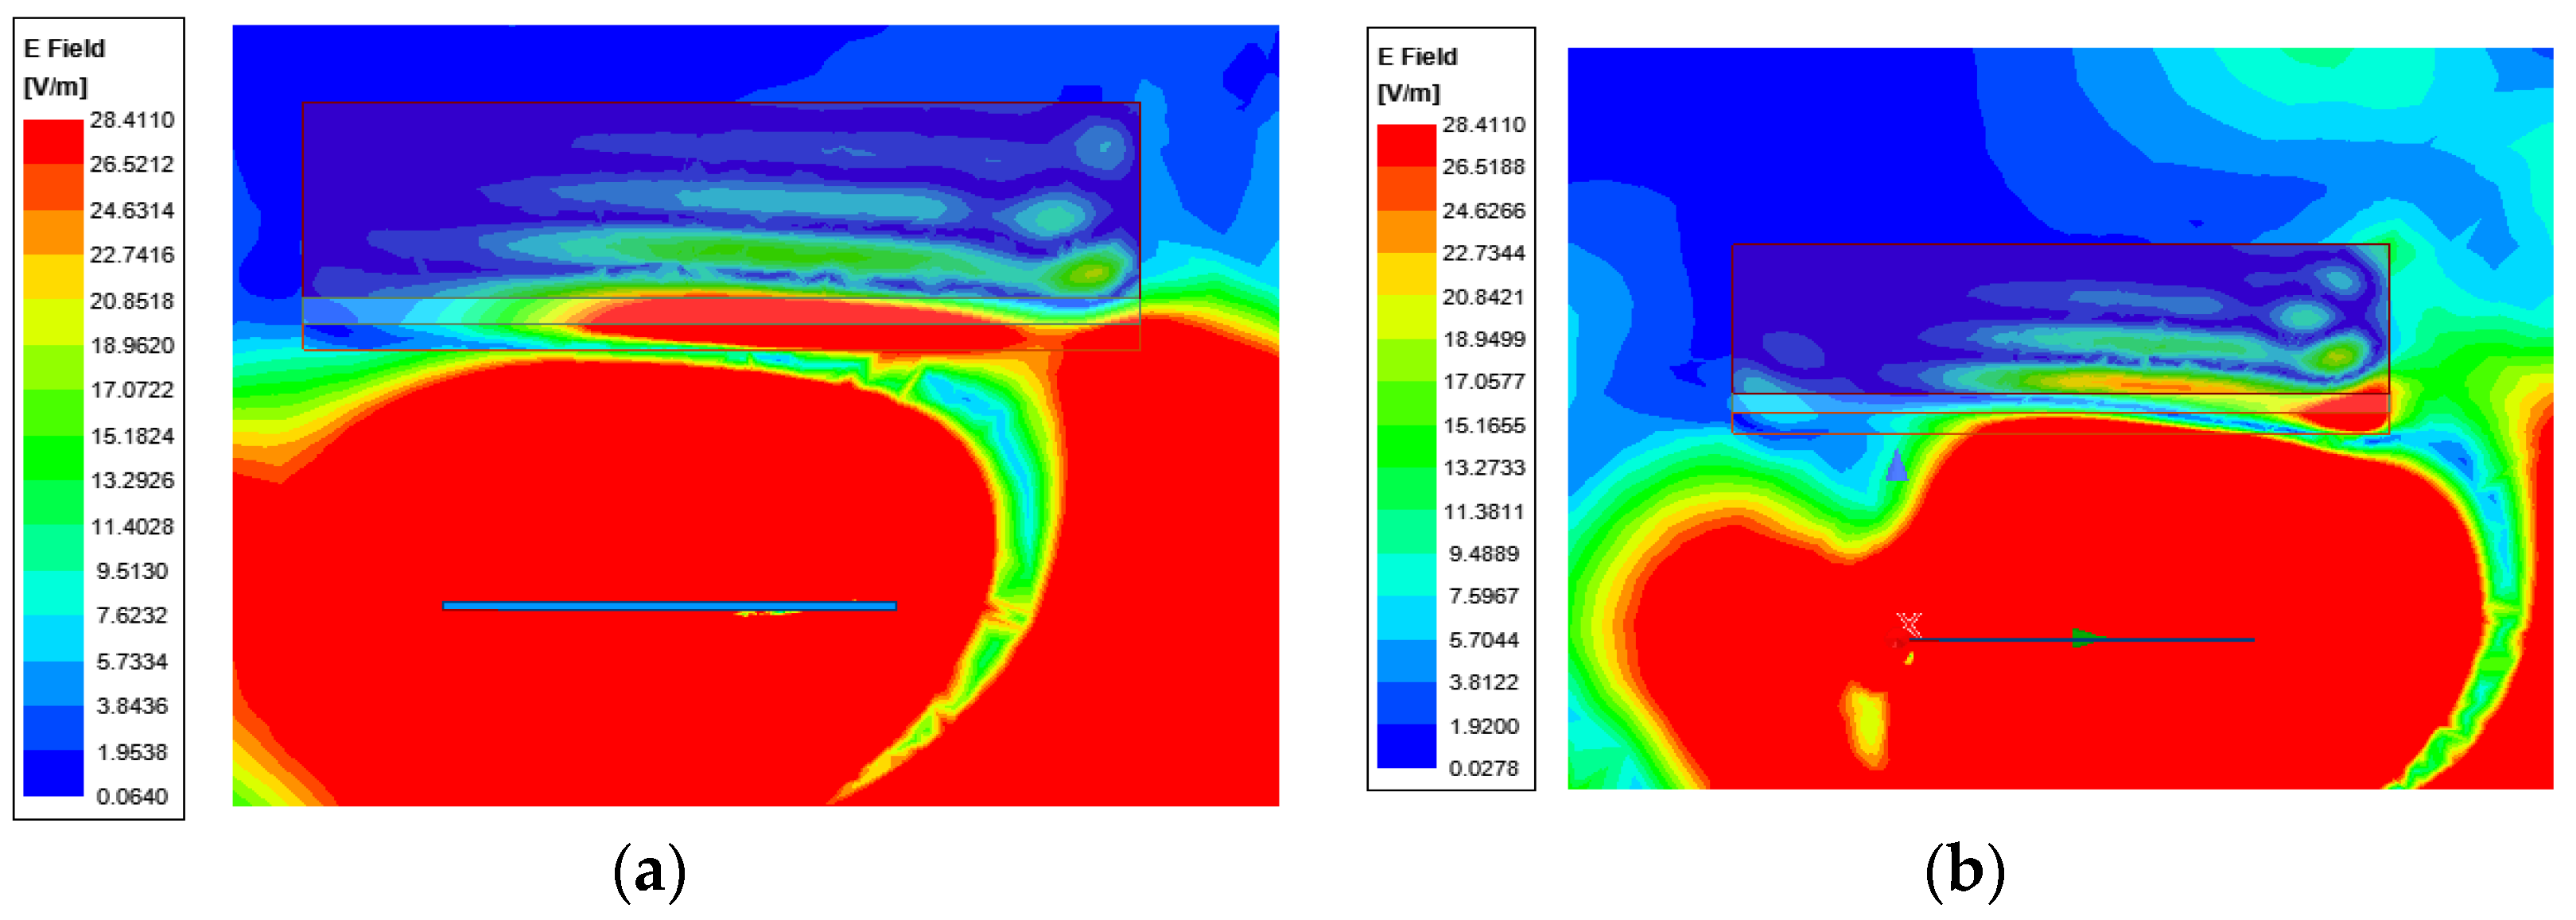
4. Electric and Magnetic Field Determination in the Vicinity of the Antennas Analyzed
5. Conclusions
Author Contributions
Funding
Institutional Review Board Statement
Informed Consent Statement
Data Availability Statement
Conflicts of Interest
References
- Bahrouni, M.; Houzet, G.; Vuong, T.P.; Mendes, P.M.; Dinis, H.; Silva, R.; Trabelsi, H. Modeling of a Compact, Implantable, Dual-Band Antenna for Biomedical Applications. Electronics 2023, 12, 1475. [Google Scholar] [CrossRef]
- Abdulkawi, W.M.; Masood, A.; Nizam-Uddin, N.; Alnakhi, M. A Simulation Study of Triband Low SAR Wearable Antenna. Micromachines 2023, 14, 819. [Google Scholar] [CrossRef]
- Tanti, R.K.; Warathe, S.; Anveshkumar, N. Planar Yagi-Uda Antenna with Mirrored Ground Plane for WLAN. In Proceedings of the 2020 11th International Conference on Computing, Communication and Networking Technologies (ICCCNT), Kharagpur, India, 1–3 July 2020; pp. 1–5. [Google Scholar] [CrossRef]
- Salas-Sánchez, A.A.; Rauch, J.; López-Martín, M.E.; Rodríguez-González, J.A.; Franceschetti, G.; Ares-Pena, F.J. Feasibility Study on Measuring the Particulate Matter Level in the Atmosphere by Means of Yagi–Uda-Like Antennas. Sensors 2020, 20, 3225. [Google Scholar] [CrossRef] [PubMed]
- Cardillo, E.; Cananzi, R.; Vita, P. Wideband Versatile Receiver for CubeSat Microwave Front-Ends. Sensors 2022, 22, 9004. [Google Scholar] [CrossRef] [PubMed]
- Sethi, W.T.; De Sagazan, O.; Himdi, M.; Vettikalladi, H.; Alshebeili, S.A. Thermoelectric Sensor Coupled Yagi–Uda Nanoantenna for Infrared Detection. Electronics 2021, 10, 527. [Google Scholar] [CrossRef]
- Constantinescu, C.; Păcurar, C.; Munteanu, C.; Giurgiuman, A.; Andreica, S.; Gliga, M. Influence of the Geometrical Parameters of a Planar Yagi-Uda Antenna on its Performances. IOP Conf. Ser. Mater. Sci. Eng. 2022, 1254, 012017. [Google Scholar] [CrossRef]
- Chaudhari, A.D.; Ray, K.P. Printed broadband Quasi-Yagi antenna with monopole elements. IET Microw. Antennas Propag. 2020, 14, 468–473. [Google Scholar] [CrossRef]
- Liu, S.; Raad, R.; Theoharis, P.I.; Tubbal, F.E. A Printed Yagi Antenna for CubeSat with Multi-Frequency Tilt Operation. Electronics 2020, 9, 986. [Google Scholar] [CrossRef]
- Kafizov, A.; Hashmi, M.; Rano, D.; Kupreyev, D. End-fire Yagi Antenna with DGS for WBAN Applications. In Proceedings of the 2019 8th Asia-Pacific Conference on Antennas and Propagation (APCAP), Incheon, Republic of Korea, 4–7 August 2019; pp. 426–427. [Google Scholar] [CrossRef]
- Islam, T.; Roy, S. Low-Profile Meander Line Multiband Antenna for Wireless Body Area Network (WBAN) Applications with SAR Analysis. Electronics 2023, 12, 1416. [Google Scholar] [CrossRef]
- Levy, B.; Levine, E.; Pinhasi, Y. Super Directional Antenna—3D Phased Array Antenna Based on Directional Elements. Electronics 2022, 11, 2233. [Google Scholar] [CrossRef]
- Cheggour, S.; Santamaria, L.; Lizzi, L. Compact Beam Steering Antenna based on Multiple Yagi-Uda Elements. In Proceedings of the 2021 IEEE Conference on Antenna Measurements & Applications (CAMA), Antibes Juan-les-Pins, France, 15–17 November 2021; pp. 600–601. [Google Scholar] [CrossRef]
- Wang, D.; Nickel, M.; Schumacher, P.; Polat, E.; Tesmer, H.; Jakoby, R.; Maune, H. A Planar Quasi Yagi-Uda Antenna Designed For Liquid Crystal Based End-Fire Phased Arrays. In Proceedings of the 2021 IEEE Radio and Wireless Symposium (RWS), San Diego, CA, USA, 17–22 January 2021; pp. 164–167. [Google Scholar] [CrossRef]
- Portosi, V.; Loconsole, A.M.; Campana, A.; Anelli, F.; Prudenzano, F. A Novel L-Shaped Metalens for Ultra-Wide Band (UWB) Antenna Gain Improvement. Appl. Sci. 2023, 13, 4802. [Google Scholar] [CrossRef]
- Keriee, H.H.; Rahim, M.K.A.; Nayyef, N.A.; Zakaria, Z.; Al-Gburi, A.J.A.; Al-Dhief, F.T.; Jawad, M.M. High gain antenna at 915 MHz for off-grid wireless networks. Bull. Electr. Eng. Inform. (BEEI) 2020, 9, 2449–2454. [Google Scholar] [CrossRef]
- Elkhosht, R.; Hammad, H. A Dualband Rectenna Design for RF Energy Scavenging using a Modified Yagi-Uda Antenna. In Proceedings of the 2023 International Microwave and Antenna Symposium (IMAS), Cairo, Egypt, 7–9 February 2023; pp. 154–157. [Google Scholar] [CrossRef]
- Gupta, M.; George, J.M.; Kumar, A.; Kumar, A. Electrically Compact Quasi Yagi-Uda Antenna for S-Band Applications. In Proceedings of the 2022 IEEE Microwaves, Antennas, and Propagation Conference (MAPCON), Bangalore, India, 12–16 December 2022; pp. 2019–2023. [Google Scholar] [CrossRef]
- ICNIRP. Guidelines for Limiting Exposure to Electromagnetic Fields (100 kHz to 300 GHz). Health Phys. 2020, 118, 483–524. [Google Scholar] [CrossRef] [PubMed]
- Bottiglieri, A.; Ruvio, G.; O’Halloran, M.; Farina, L. Exploiting Tissue Dielectric Properties to Shape Microwave Thermal Ablation Zones. Sensors 2020, 20, 3960. [Google Scholar] [CrossRef] [PubMed]
- Pacurar, C.; Giurgiuman, A.; Constantinescu, C.; Topa, V.; Munteanu, C.; Andreica, S.; Gliga, M. High Frequency Analysis of The Influence of Yagi-Uda Antenna on The Human Head. In Proceedings of the 11th International Conference and Exposition on Electrical and Power Engineering—EPE 2020, Iași, Romania, 22–23 October 2020. [Google Scholar]
- Constantinescu, C.; Pacurar, C.; Giurgiuman, A.; Munteanu, C.; Andreica, S.; Gliga, R. The Influence of Electromagnetic Waves Emitted by PIFA Antennas on the Human Head; Springer: Berlin/Heidelberg, Germany, 2022. [Google Scholar]
- Khraisat, Y.S.H.; Al-Zoubi, A.S.; Al-Ahmadi, A.; Mbaideen, O.A. Design Implantable Antennas with Human Body Effect. Int. J. Innov. Technol. Explor. Eng. (IJITEE) 2020, 9, 2285–2292. [Google Scholar] [CrossRef]
- Parthasarathy, N.; Abhari, R. A Compact 2 by 2 Printed Yagi-Uda Antenna Array with Enhanced Isolation and Gain. In Proceedings of the 2019 IEEE International Symposium on Antennas and Propagation and USNC-URSI Radio Science Meeting, Atlanta, GA, USA, 7–12 July 2019; pp. 1761–1762. [Google Scholar] [CrossRef]
- Awais, M.; Hamza, M.; Khan, W.T. A Compact Ultra-wideband Single Element Planar Yagi Antenna. In Proceedings of the 2018 IEEE International Symposium on Antennas and Propagation & USNC/URSI National Radio Science Meeting, Boston, MA, USA, 8–13 July 2018; pp. 1939–1940. [Google Scholar] [CrossRef]
- Páez, C.I.; Estrada, J.G.; Fajardo, A. Design equations for the Quasi Yagi-Uda antenna operating in the UHF band. IEEE Lat. Am. Trans. 2016, 14, 1122–1128. [Google Scholar] [CrossRef]
- Kundu, S.; Patra, K. Design of Reconfigurable Planar Yagi-Uda Antenna for Dual Frequency Wireless Communication. In Proceedings of the 2020 IEEE Calcutta Conference (CALCON), Kolkata, India, 28–29 February 2020; pp. 439–443. [Google Scholar] [CrossRef]
- Kumar, G.; Kumar, N. Report on Cell Tower Radiation; LAP LAMBERT Academic Publishing: Saarbruecken, Germany, 2016. [Google Scholar]
- Muhuri, A.; Manickam, S.; Bhattacharya, A. Snow Cover Mapping Using Polarization Fraction Variation with Temporal RADARSAT-2 C-Band Full-Polarimetric SAR Data Over the Indian Himalayas. IEEE J. Sel. Top. Appl. Earth Obs. Remote Sens. 2018, 11, 2192–2209. [Google Scholar] [CrossRef]
- Xu, L.; Zhang, H.; Wang, C.; Zhang, B.; Liu, M. Corn mapping uisng multi-temporal fully and compact SAR data. In Proceedings of the 2017 SAR in Big Data Era: Models, Methods and Applications (BIGSARDATA), Beijing, China, 13–14 November 2017; pp. 1–4. [Google Scholar] [CrossRef]
- Wei, S.; Zhang, H.; Wang, C.; Xu, L.; Wu, F.; Zhang, B. Large-Scale Rice Mapping of Thailand using Sentinel-1 Multi-Temporal SAR Data. In Proceedings of the 2019 SAR in Big Data Era (BIGSARDATA), Beijing, China, 5–6 August 2019; pp. 1–4. [Google Scholar] [CrossRef]
- Chini, M.; Papastergios, A.; Pulvirenti, L.; Pierdicca, N.; Matgen, P.; Parcharidis, I. SAR coherence and polarimetric information for improving flood mapping. In Proceedings of the 2016 IEEE International Geoscience and Remote Sensing Symposium (IGARSS), Beijing, China, 10–15 July 2016; pp. 7577–7580. [Google Scholar] [CrossRef]
- Rui, G.; Zhao, Z.; Rui, G.; Guobin, J.; Mengdao, X.; Yongfeng, Z. Ocean Target Investigation Using Spaceborne SAR under Dual-Polarization Strip-map Mode. In Proceedings of the 2021 2nd China International SAR Symposium (CISS), Shanghai, China, 3–5 November 2021; pp. 1–5. [Google Scholar] [CrossRef]
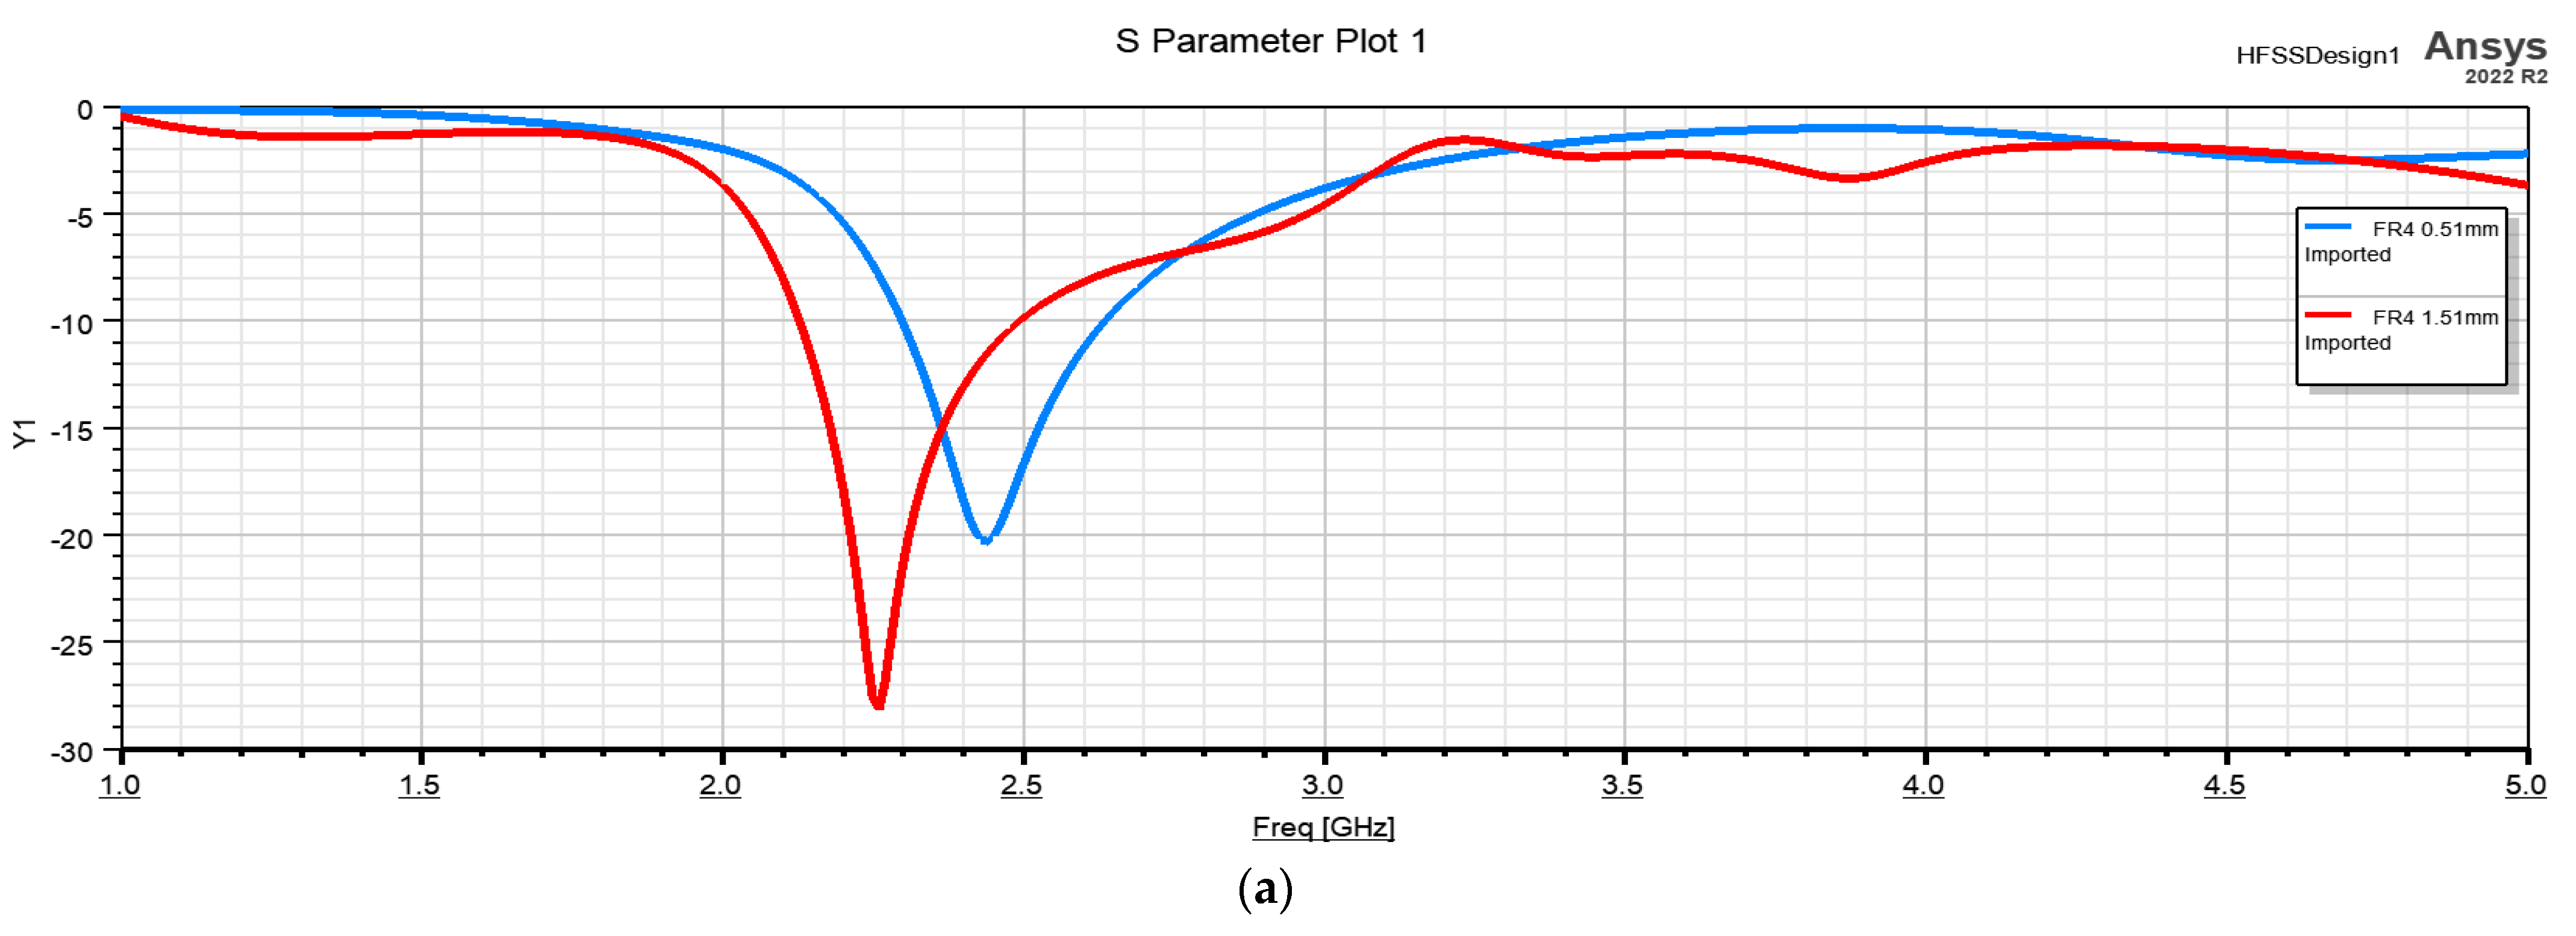
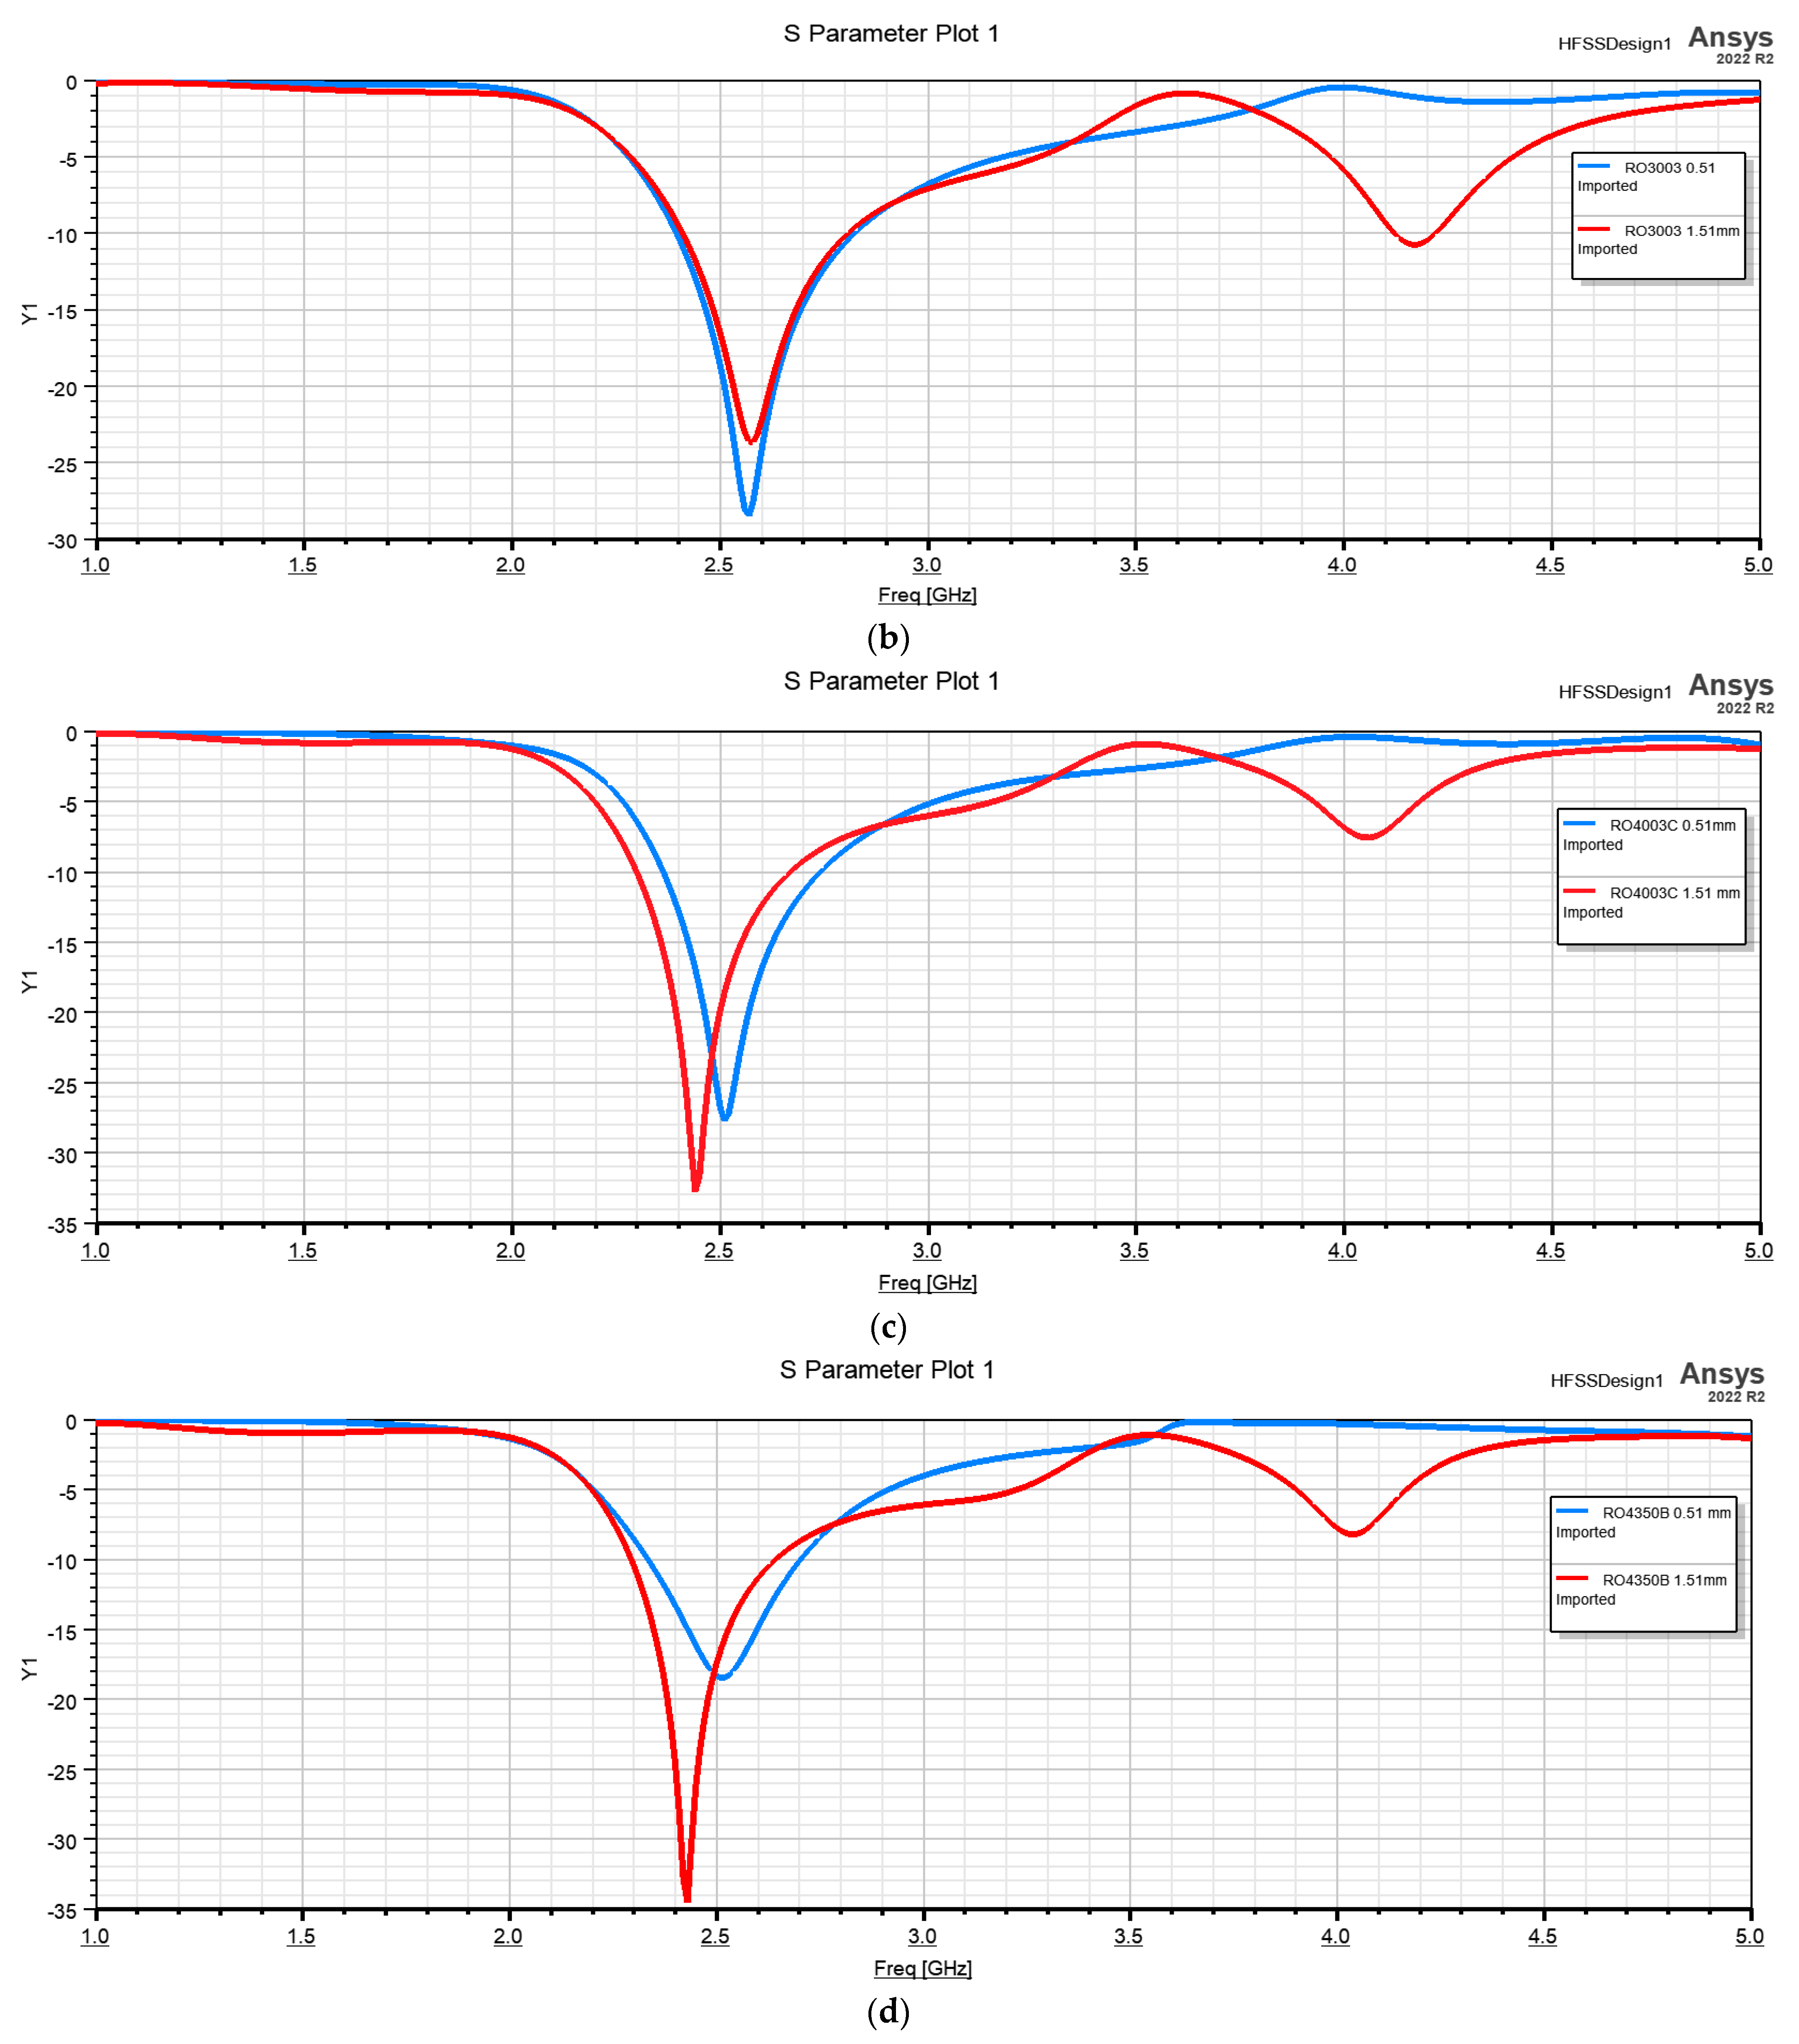


| Dielectric | ||||
|---|---|---|---|---|
| Dimension | FR4 | RO3003 | RO4003C | RO4350B |
| 0.51 mm | 4.0542 | 4.5328 | 4.46 | 4.37 |
| 1.51 mm | 3.6917 | 4.2514 | 4.2152 | 4.1446 |
| Dielectric | ||||
|---|---|---|---|---|
| Dimension | FR4 | RO3003 | RO4003C | RO4350B |
| 0.51 mm | 13.75% | 16.5% | 14.9% | 14.7% |
| 1.51 mm | 15.98% | 15.32% | 14.9% | 14.2% |
| 5 Directors | 5 Directors + 6 mm | 3 Directors | 3 Directors + 6 mm |
|---|---|---|---|
| 16.51% | 23.31% | 16.22% | 22.64% |
| 2 mm | 4 mm | 6 mm | 8 mm | 10 mm | Total Grounding |
|---|---|---|---|---|---|
| 4.3219 | 4.587 | 4.673 | 4.5551 | 4.4713 | 0.576 |
| 2 mm | 4 mm | 6 mm | 8 mm | 10 mm |
|---|---|---|---|---|
| 18.32% | 18.99% | 19.66% | 23.31% | 17.96% |
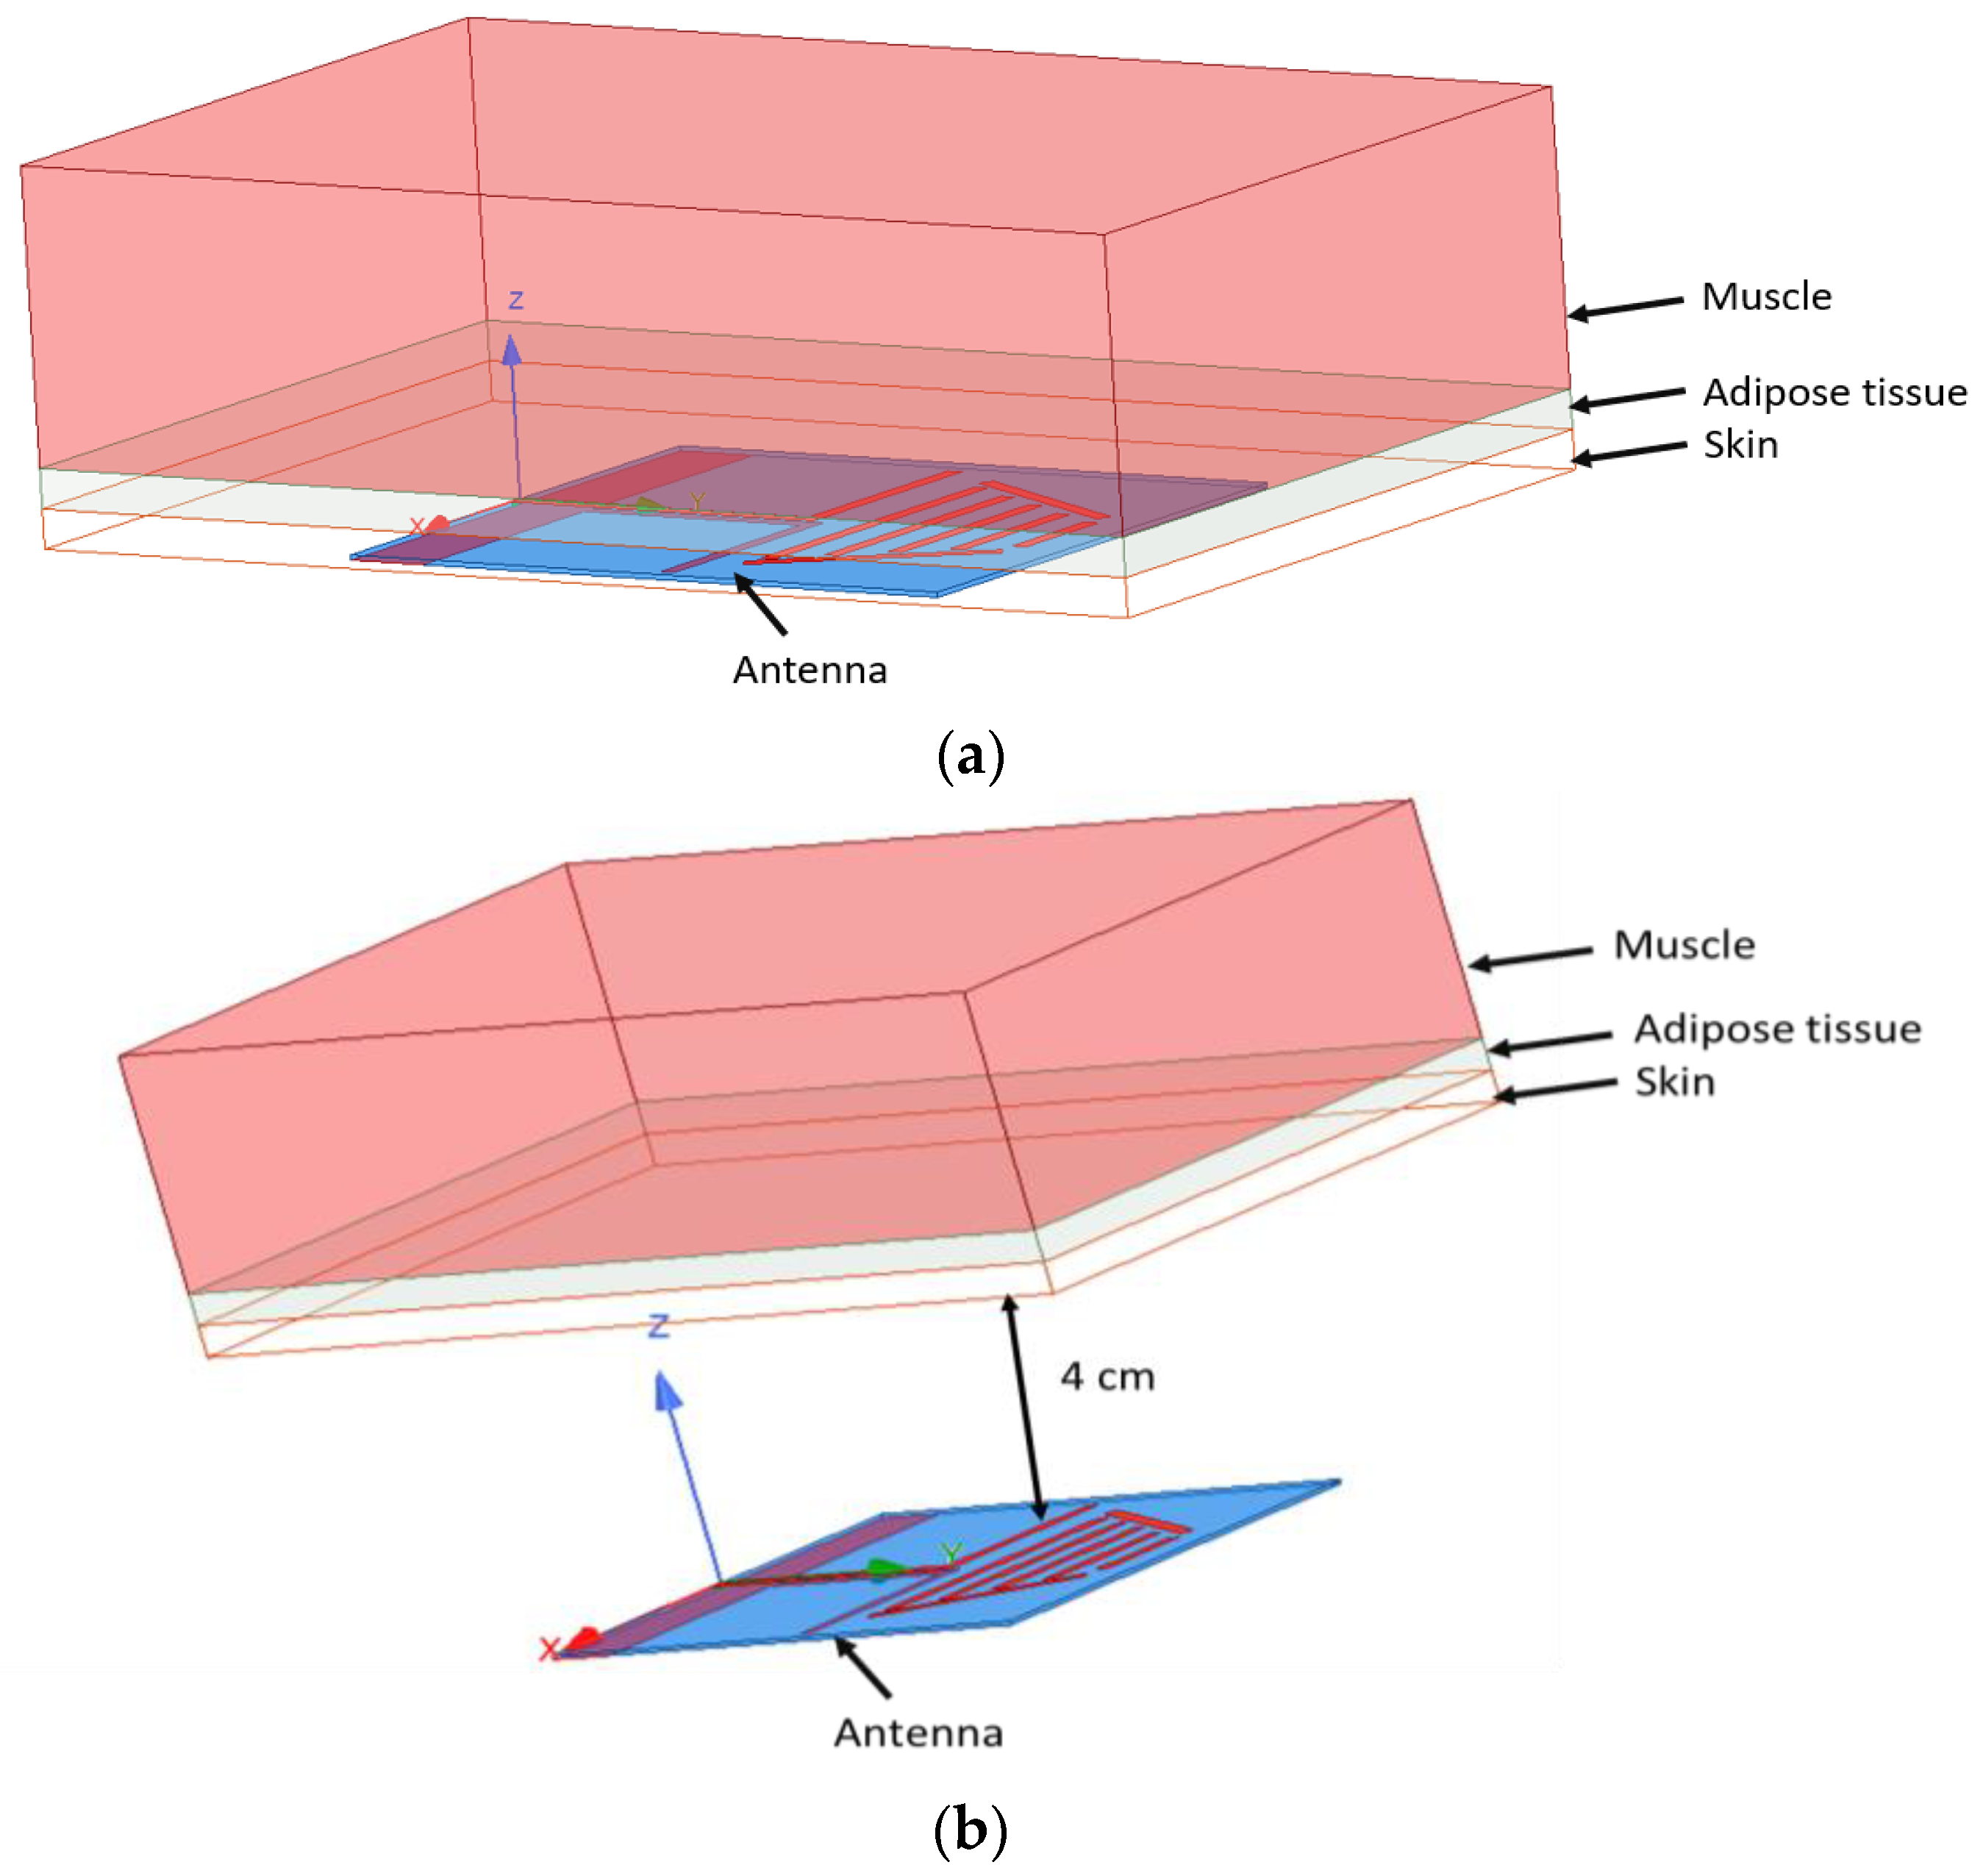
| Types of Tissue | |||
|---|---|---|---|
| Relative Permittivity | Conductivity | Loss Tangent | |
| Skin | 38 | 1.46 | 0.283 |
| Fat | 5.28 | 0.1 | 0.145 |
| Muscle | 52.7 | 1.74 | 0.242 |
| R (m) | for the Initial Antenna (W/m2) | for the Optimized Antenna (W/m2) |
|---|---|---|
| 0.01 | 2937.754647 | 3851.540616 |
| 0.05 | 117.5101859 | 154.0616246 |
| 0.1 | 29.37754647 | 38.51540616 |
| 0.5 | 1.175101859 | 1.540616246 |
| 1 | 0.293775465 | 0.385154062 |
| Exposure over 30 min | Exposure between 6 and 30 min | ||
|---|---|---|---|
| E | H | E | H |
| 67.36 | 0.181 | 28.411 | 0.349 |
Disclaimer/Publisher’s Note: The statements, opinions and data contained in all publications are solely those of the individual author(s) and contributor(s) and not of MDPI and/or the editor(s). MDPI and/or the editor(s) disclaim responsibility for any injury to people or property resulting from any ideas, methods, instructions or products referred to in the content. |
© 2023 by the authors. Licensee MDPI, Basel, Switzerland. This article is an open access article distributed under the terms and conditions of the Creative Commons Attribution (CC BY) license (https://creativecommons.org/licenses/by/4.0/).
Share and Cite
Constantinescu, C.; Pacurar, C.; Giurgiuman, A.; Munteanu, C.; Andreica, S.; Gliga, M. High Gain Improved Planar Yagi Uda Antenna for 2.4 GHz Applications and Its Influence on Human Tissues. Appl. Sci. 2023, 13, 6678. https://doi.org/10.3390/app13116678
Constantinescu C, Pacurar C, Giurgiuman A, Munteanu C, Andreica S, Gliga M. High Gain Improved Planar Yagi Uda Antenna for 2.4 GHz Applications and Its Influence on Human Tissues. Applied Sciences. 2023; 13(11):6678. https://doi.org/10.3390/app13116678
Chicago/Turabian StyleConstantinescu, Claudia, Claudia Pacurar, Adina Giurgiuman, Calin Munteanu, Sergiu Andreica, and Marian Gliga. 2023. "High Gain Improved Planar Yagi Uda Antenna for 2.4 GHz Applications and Its Influence on Human Tissues" Applied Sciences 13, no. 11: 6678. https://doi.org/10.3390/app13116678
APA StyleConstantinescu, C., Pacurar, C., Giurgiuman, A., Munteanu, C., Andreica, S., & Gliga, M. (2023). High Gain Improved Planar Yagi Uda Antenna for 2.4 GHz Applications and Its Influence on Human Tissues. Applied Sciences, 13(11), 6678. https://doi.org/10.3390/app13116678