Abstract
Based on the complex network theory, we established a topological network of the Beijing subway under Space L, Space P, and Space C. Then, we analyzed the complex characteristics of the subway network under each topological network, proposed the global impact indexes (including aggregation impact coefficient, path length impact coefficient, network efficiency impact coefficient, and connectivity impact coefficient), and interline impact indexes (including degree centrality impact coefficient, near-centrality impact coefficient and intermediate centrality impact coefficient, the higher the value, the more obvious the effect on other lines; degree centrality sensitivity coefficient, near-centrality sensitivity coefficient and intermediate centrality sensitivity coefficient, the higher the value, the more vulnerable to the impact of other lines). At the global and local levels, it is possible to analyze the effect of different lines on the global situation and other lines. The concept of the “line importance index” is proposed to identify the key lines in the Beijing subway network. The network is characterized by scale-free and small-world characteristics under Space P, and scale-free network characteristics but no small-world characteristics under Space L and Space C. Subway Line 10, Line 9, Line 1, Line 2, and Line 5 are the five subway lines with the highest importance. Subway Line S1, Changping Line, Xijiao Line, Capital Airport Line, and Daxing International Airport Line are the five subway lines with the lowest importance.
1. Introduction
Public transportation has become an important means to relieve traffic congestion and achieve green travel. With sufficient capacity and punctuality advantages, subway transport is the backbone of a multi-modal bus network. When there is an unexpected event such as a sharp increase in passenger flow or a natural disaster, station closures or line shutdowns will affect the overall network. Therefore, analyzing the characteristics of subway networks and identifying the key lines in subway networks are practical guidelines to improve the reliability of transportation networks. Research on transportation networks based on complex network theory has become mainstream nowadays [1]. Many real-world systems, such as transportation, social, biological, and communication systems, can be described by complex networks [2]. It provides important insights to understand the structure, function, and complexity of transportation networks [3], and it is a common approach to abstract a transportation network into a simple network composed of nodes and edges [4].
In recent years, with the rapid development of network science, especially the proposal of “small-world characteristics” [5] and “scale-free characteristics” [6] of complex networks, a new wave of network science research has been initiated worldwide. With the continuous research on urban road networks, their complex network properties have also received more and more attention. Ye and Kim presented a comprehensive set of measures in the form of a node connectivity index and derived four local and global network vulnerability indicators from the index to assess the vulnerability of major U.S. heavy rail networks [7]. They then identified and evaluated the key components of the flow-based network in terms of the shortest path problem [8]. Public transportation is a very important means to reduce traffic congestion and improve environmental conditions in cities, thus affecting people’s social life [9]. Owais et al. increased the efficiency of the entire transportation network by proposing new circular routes to increase the connections between transportation modes [10] and proposed two models to design a subway transportation network based on the best cost–benefit ratio [11]. Latora first conducted a preliminary study on the characteristics of small-world networks in the Boston subway and then analyzed both the effectiveness and fault tolerance of the Boston subway through network efficiency [12]. Sienkiewicz and Hołyst [13] investigated the node degree distribution of bus networks in several Polish cities and concluded that it conforms to a power function distribution. Zhang et al. [14] studied the complex characteristics of the Beijing subway topology network under Space L and Space P. This was followed by a study of subway networks in 52 typical cities around the world, which concluded that they have small-world characteristics with high aggregation coefficients and low network diameters [15,16]. Wang et al. [17] proposed 10 indexes to comprehensively evaluate the robustness of subway networks under deliberate and random attacks, and compared several cities, the Tokyo subway network has the best robustness.
Different nodes have different roles in the network [18], as do traffic routes. A failure of a transportation hub has little impact on macroscopic traffic. However, at the macro level, the probability of the failure of the whole line is small, but the impact once it occurs is difficult to estimate. How to find key lines and improve their robustness under unexpected situations has theoretical significance and practical value for transportation network reliability analysis.
Existing studies mostly focus on the identification of network key stations, but study of the importance of key lines is relatively lacking. Meanwhile, the association discovery theory in social network analysis can be applied to subway network analysis. In this study, we analyzed the network characteristics under Space L, Space P, and Space C based on the latest Beijing subway lines operations. We proposed the key lines’ evaluation index system and established the key lines’ identification method. For subway networks, it can provide support to improve reliability and provide a theoretical basis for in-depth research.
2. Complex Network Model and Related Indexes
2.1. Establishment of Subway Complex Network Model
The urban subway system is a complex network system [19], the Space L and Space P models abstract the subway network as a graph G = (W, E) consisting of stations V and line intervals E. N = |V| and M = |E| represent the number of stations and interval lines of the subway network, respectively, to describe the scale of the subway network. The Space C model regards the lines as nodes, the relationships such as overlap and crossover between the lines as connected edges [20,21].
Comparing the original network in Figure 1a and the Space P network in Figure 1c, when two nodes can be directly reached through any line, there is a connection between two points, otherwise, there is no connection. As shown in Figure 1b, under Space L, when two nodes are adjacent stations on any line, there is a connection between the two points, otherwise, there is no connection. The network under Space L is more inclined to the representation of the actual state of the subway network. As shown in Figure 1d, under Space C, when two subway lines have common stations, they can be transferred, and the connection of two nodes is generated.
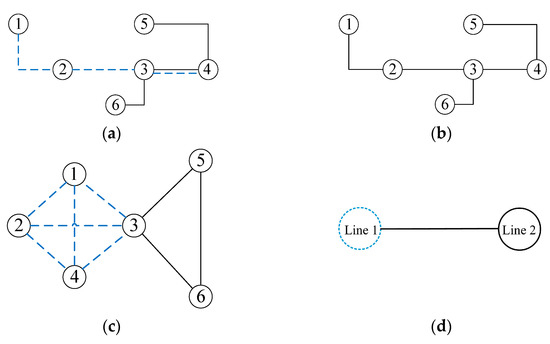
Figure 1.
Representations of some subway networks. (a) Original network. (b) Space L network. (c) Space P network. (d) Space C network.
2.2. Statistical Indexes of Complex Network Characteristics
Small-world characteristics and scale-free characteristics are the basis for distinguishing general networks from complex networks. The moderate, clustering coefficient, network efficiency, centrality, path length, etc., are the metrics they commonly use.
The degree is an index that can measure the importance of node i in a complex network. It represents the number of edges connected with point i, as shown in Table 1 Formula (1).

Table 1.
Formulas for calculating static indexes.
The clustering coefficient of node i is a proportion, which is the number of adjacent nodes’ connected edges in the maximum possible number of connected edges. It can reflect the connectivity efficiency of the local network around node i, as shown in Table 1 Formula (2). The mean value of all node clustering coefficients of all node sets V in the network is the global clustering coefficient C, as shown in Table 1 Formula (3).
There are m paths between two nodes i and j in a network, is the minimum of all path lengths, then is called the shortest path length between nodes i and j, as shown in Table 1 Formula (4). Network efficiency is a measure of connectivity efficiency between nodes, the reciprocal of the path length between nodes i and j is the node pair efficiency, and in a network, the average of all node pairs efficiency is the network efficiency, as shown in Table 1 Formula (5).
The more prominent the “central position” of a node is, the more important its position in a network is. Degree centrality , near-centrality and intermediate centrality are three important indexes of node centrality. Degree centrality is the number of nodes connected to it in a network. Near-centrality is the average shortest distance between a node and all other nodes in a network. Intermediate centrality is the number of shortest paths between nodes passing through that node, as shown in Table 1 Formulas (6) to (8).
The connectivity is an index to measure the degree of network development, and the ratio of the actual number of edges to the maximum possible number of edges, as shown in Table 1 Formula (9). is the shortest path length between two points, the network diameter L is the maximum value in , as shown in Table 1 Formula (10). The relevant parameters described above are shown in Table 2.
Table 2.
Description of formula parameters.
3. Complex Characteristics Analysis of Beijing Subway Network
As of 20 May 2021, Beijing rail transit operated a total of 24 lines and 397 stations, including 64 transfer stations. The Beijing subway line network is shown in Figure 2. Based on the open-source data of Gaode API to crawl each line in turn stations, we establish the adjacency matrices of Space L, Space P, and Space C. The topological network visualization imported into Gephi is shown in Figure 3a–c.
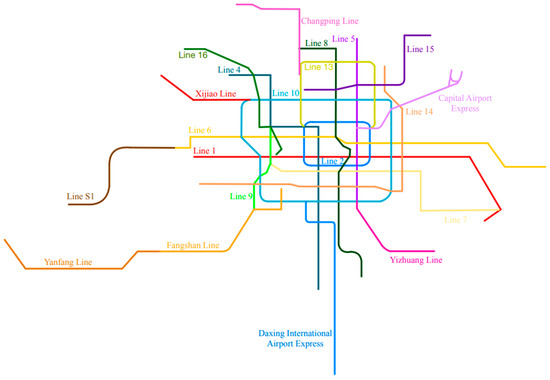
Figure 2.
Beijing subway line network.
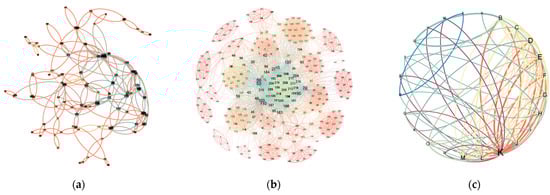
Figure 3.
Topological network visualization diagrams. (a) Space L network. (b) Space P network. (c) Space C network.
3.1. Complex Characteristics Analysis of the Beijing Subway Network
The above indexes for Space L, Space P, and Space C networks are calculated by Gephi(0.9.7) software, and the results are shown in Table 3.
Table 3.
Index parameter statistics of complex networks.
Under Space L, the diameter L of the Beijing subway network is 54, and the connectivity is 0.007, which means that the network is relatively large, with distant nodes and poor connectivity between nodes. The average degree of the network is 2.252, and the top three stations with degree centrality are Xizhimen Station, Chegongzhuang Station, and Baishiqiaonan Station which have relatively high connectivity with the surrounding stations. Chegongzhuang Station, Ping’anli Station, and Dongsi Station have high near-centrality, indicating that they are more accessible in the global network. Xizhimen Station, Chegongzhuang Station, and Baishiqiaonan Station have the characteristics of strong intermediate centrality. The proportion of the shortest path of each node in the network passing through them is relatively high, which means that these stations are key nodes of the network.
Under Space P, the diameter L of the Beijing subway network is 6, and the connectivity is 0.917. Compared with Space L, the connection strength between network nodes is relatively high, and the distance between nodes is closer. The average degree of the network is 25.79, and the top three stations with degree centrality are Songjiazhuang Station, Haidian Huangzhuang Station, and Jiaomenxi Station, meanwhile, the near-centrality is high. These three stations have high a connection strength with their surrounding stations and have obvious accessibility advantages in the global situation. The intermediate centrality of Guojiazhuang Station, Songjiazhuang Station, and Shuangjing Station is high, and the central role of Guojiazhuang and Shuangjing is reflected.
Under Space C, the diameter L of the Beijing subway network is 5, and the average path length is 2.214, which indicates that node I needs to make 1.214 transfer arrivals on average to reach node j, and the maximum number of transfers is 4. Line 10 ranks 1st in global degree centrality, near-centrality, and intermediate centrality, which indicates that Line 10 has the highest intensity of connection with other subway lines and the highest degree of overall connection, as well as being a central line for interline transfer, followed by Line 4, which has a similar role to Line 10.
3.2. Characteristic Analysis of Scale-Free Network and Small-World Network
We fitted the cumulative degree distribution of Space L, Space P, and Space C networks. Under the logarithmic function, as shown in Figure 4, the goodness of fit R2 are 0.8531, 0.9391, and 0.9166, which means that they all exhibit scale-free network characteristic. The small-world network characteristic needs to satisfy the random network of the network average path length region, while the clustering coefficients converge to the regular network. In Table 3, the global clustering coefficient C of the Beijing subway network under Space L is 0.002, and the network average path length is 16.632, which does not have the small-world network characteristics. The global clustering coefficient C of the Beijing subway network under Space P is 0.917, and the network average path length is 2.652, showing the small-world network characteristic with high clustering and short distance. The global clustering coefficient C of the Beijing subway network under Space C is 0.395, and the network average path length is 4.75, which is similar to the Beijing subway network under Space L, with no small-world network characteristic.
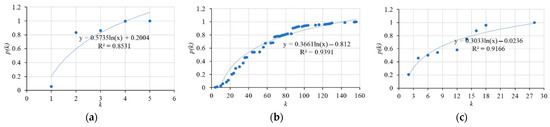
Figure 4.
Fitting curve of cumulative distribution for the degree of Beijing subway networks. (a) Space L network. (b) Space P network. (c) Space C network.
4. Key Lines’ Identification of Subway Network
4.1. Line Importance Indexes
There are many ways to determine the importance of nodes in related studies. Previous studies usually used and single centrality to rank nodes, such as degree centrality, intermediate centrality, near-centrality, eigenvector centrality, k-shell, etc. However, single indexes have their advantages and disadvantages and are not applicable in the identification of key nodes. Some related studies have established critical node identification methods that consider both local and global metrics [22,23]. The main subway network of this study is an organic whole. When a line is out of service, on the one hand, the global clustering coefficient, average path length, network efficiency, and connectivity of the network will change accordingly, on the other hand, the centrality of other line stations and the status of each station will also change.
Given the above analysis, based on the existing methods, combined with the characteristics and functions of the subway transportation network, we established key lines’ evaluation indexes from two aspects: global impact indexes and interline impact indexes.
4.1.1. Global Impact Indexes
The aggregation influence coefficient is the ratio of the initial global aggregation coefficient to the global aggregation coefficient after the deletion of Line a. The same method can be used to obtain the path length influence coefficient , the network efficiency influence coefficient and the connectivity influence coefficient , as shown in Table 4 Formulas (11) to (14), and the specific parameters are explained in Table 5.
Table 4.
Global impact indexes.
Table 5.
Description of Formula parameters.
4.1.2. Interline Impact Indexes
In the degree centrality mentioned above, the degree centrality of all stations of Line a is defined as the station expected degree centrality of Line a. Similarly, the station expected near-centrality and station expected intermediate centrality of the corresponding lines can be obtained. The above indexes are shown in Formulas (15) to (17) in Table 6, and the specific parameters are explained in Table 7.
Table 6.
Expected centrality of line nodes.
Table 7.
Description of formula parameters.
Based on the above three lines node expected centrality indexes, the interline impact indexes are established. The initially expected degree centrality of Line b is . When Line a is deleted, the expected degree centrality of Line b is , then the degree centrality influence coefficient of Line a on Line b is . Similarly, the near-centrality influence coefficient of Line a on Line b is , and the intermediate centrality influence coefficient is . In turn, the global degree centrality influence matrix is obtained, as shown in Formula (18). Similarly, the near-centrality influence matrix and the intermediate centrality influence matrix are obtained.
From the matrix , and , the degree centrality influence coefficient , near-centrality influence coefficient , and intermediate centrality influence coefficient of Line I can be extracted. The larger the value of these influence coefficients, the greater influence of the line on other lines, as shown in Table 8 Formula (19) to (21), and the parameters are explained above. At the same time, the indexes of degree centrality sensitivity coefficient , near-centrality sensitivity coefficient and intermediate centrality sensitivity coefficient are proposed to determine the sensitivity of lines in the network affected by other lines. The larger value of these sensitivity coefficients indicates that the line is more susceptible to the influence of other lines, as shown in Table 8 Formula (22) to (24). In summary, the line importance index system as shown in Table 9 is established.
Table 8.
Central influence coefficient.
Table 9.
Index system of line importance.
4.2. Design of Key Lines’ Identification Experiment
In this study, starting from the line failure on the network as a whole and the mutual influence between lines, we established a subway key lines’ identification method, taking the Beijing subway network as an example, and gave the importance ranking of each line, the assumes as follows:
- (1)
- The possibility that only one of the subway lines will be out of service and not multiple lines at the same time; and
- (2)
- When a line is out of service, the non-crossing nodes and connecting edges of the line are deleted. Other interchange stations are retained as shown in Figure 5. Set up the operation flow as shown in Figure 6 below according to the above ideas.
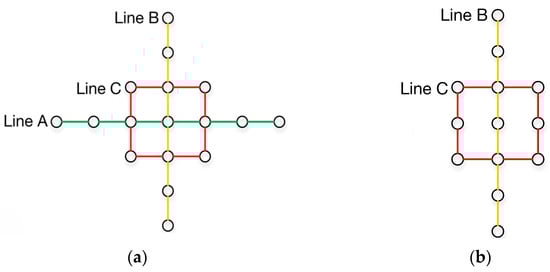 Figure 5. Deleting method of nodes connection after line shutdown. (a) Line A before shutdown. (b) Line A after shutdown.
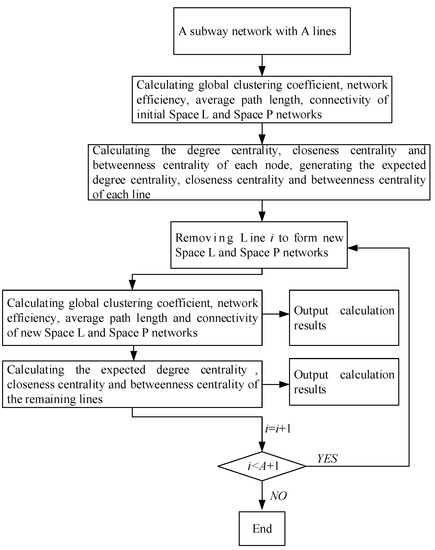 Figure 6. Key lines’ identification algorithm.
4.3. Experimental Result Analysis
4.3.1. Global Influence Analysis
Based on Space L and Space P, the key lines’ identification experiment of the Beijing subway network is conducted, and the aggregation influence coefficient , path length influence coefficient , network efficiency influence coefficient and connectivity influence coefficient of each Beijing subway network are calculated as shown in Table 10. Compared with the complete subway network, the clustering coefficient, path length, connectivity and network efficiency of the Beijing subway complex network under two spaces have different changes.
Table 10.
Calculation results of the global impact index.
The comparison of global impact indexes is shown in Figure 7. As shown in Figure 7a, under Space L, Line 9, Line 10, Line 14 West, Line 4, and Line 7 are the five lines with the largest aggregation influence coefficient. The five subway lines at the edge of the network, Daxing International Airport Express, Capital Airport Express, S1 Line, Xijiao Line, and Yanfang Line have the smallest aggregation influence coefficient. Under Space P, Line 1, Line 2, Line 5, Line 9, and Line 10 are the five lines with the largest aggregation influence coefficient. The five subway lines at the edge of the network, Changping Line, Daxing International Airport Express, Capital Airport Express, Line 8 North, and Line 14 West have the smallest aggregation influence coefficient. Combining the comprehensive effect of the two spaces, the aggregation influence of Daxing International Airport Express and Capital Airport Express is poor, and the aggregation influence of Line 9 and Line 10 is the most significant.
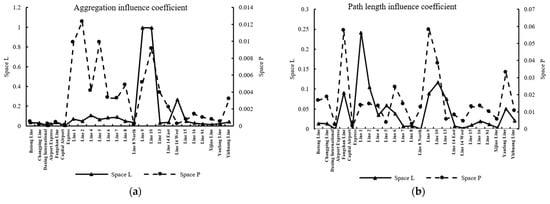
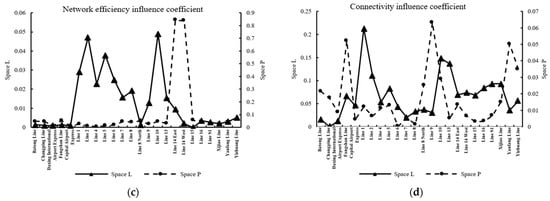
Figure 7.
Comparison of global impact indexes. (a) Aggregation influence coefficient. (b) Path length influence coefficient. (c) Network efficiency influence coefficient. (d) Connectivity influence coefficient.
As shown in Figure 7b, under Space L, Fangshan Line, Line 1, Line 2, Line 9, and Line 10 are the five lines with the largest path length influence coefficient, and have a significant influence on the distance between stations in the network. Daxing International Airport Express, Capital Airport Express, Line 8 North, Line 14 West, and Xijiao Line are the five lines with the smallest path length influence coefficient, and the lines located at the edge of the network have a poor influence effect. Under Space P, Fangshan Line, Line 6, Yanfang Line, Line 9, and Line 10 are the five lines with the largest path length influence coefficient. Daxing International Airport Express, Capital Airport Express, Line 5, Line 14 West, and Line 8 are the five lines with the smallest path length influence coefficient. Combining the comprehensive effects under the two spaces, the path length influence of the Daxing International Airport Express, Capital Airport Express, and 14 West has the worst effect, and the path length influence of Line 9, Line 10, and the Fangshan Line are the most significant.
As shown in Figure 7c, under Space L, Batong Line, Changping Line, Daxing International Airport Express, Fangshan Line, and Capital Airport Express are the five lines with the smallest connectivity influence coefficient, and they are located at the edge of the network. Line 1, Line 2, Line 5, Line 6, and Line 10 are the five lines with the largest connectivity influence coefficient. The lack of these five subway lines will greatly weaken the overall connectivity efficiency of the network. There are some differences between the conclusions under Space P and Space L. Fangshan Line, Line 14 East and West, Yizhuang Line, and Line 15 are the five lines with the largest connectivity influence coefficient. Daxing International Airport Express, Capital Airport Express, Line 2, Line 14 West, and Line 5 are the five lines with the smallest connectivity influence coefficient. Combining the comprehensive effects under the two spaces, the Daxing International Airport Express and Capital Airport Express have the worst connectivity influence effect.
As shown in Figure 7d, under Space L, Line 1, Line 2, Line 10 West, Line 13, and Xijiao Line are the five lines with the largest network efficiency influence coefficient. The five subway lines at the edge of the network, Daxing International Airport Express, Batong Line, Changping Line, Line 7, and Line 9, have the smallest network efficiency influence coefficient. Under Space P, Fangshan Line, Yizhuang Line, Yanfang Line, Line 9, and Line 10 are the five lines with the largest network efficiency influence coefficient. Line 6, Line 15, Capital Airport Express, Line 8 North, and Line 16 are the five lines with the smallest network efficiency influence coefficient. Combining the comprehensive effects under the two spaces, the network efficiency influence of Line 10 is the most significant.
4.3.2. Local Influence Analysis
Based on Space L and Space P, the key lines’ identification experiment of the Beijing subway network is conducted, the calculation results of the degree centrality influence coefficient , near-centrality influence coefficient and intermediate centrality influence coefficient , degree centrality sensitivity coefficient , near-centrality sensitivity coefficient and intermediate centrality sensitivity coefficient of each line are shown in Table 11.
Table 11.
Calculation results of interline impact index.
The results of the interaction analysis between subway lines are shown in Figure 8. From Figure 8a,b, under Space L, Line 2 has a significant influence on the degree centrality of other subway line stations; among them, Daxing International Airport Express and Capital Airport Express are the most obvious lines, followed by Line 4, Line 16 and Xijiao Line. Line 1 has a significant influence on Line 8 North and Line 7, the same for Line 8 North on Line 1, Line 4 and Line 10, Line 14 West on Changping Line, and Line 16 on Line 6. Under Space P, Line 10 significantly influences Daxing International Airport Express, Line 1, Line 14 West, Line 9, and Xijiao Line. The same for Line 1 on Batong Line, Line 2 on Capital International Airport Express, Line 4 on Line 2, and Line 9 on Line 14 West. Under the analysis of Space L and Space P, the comparison results are shown in Figure 8c: Under Space L, Line 10, Line 5, and Line 2 have the highest degree centrality influence coefficient, and Line 10, Line 6, and Line 2 have the highest degree centrality sensitivity coefficient. Under Space P, Line 13, Line 2, and Line 10 have the highest degree centrality influence coefficient, and Capital Airport Express, Line 5, and Line 2 have the highest degree centrality sensitivity coefficient.
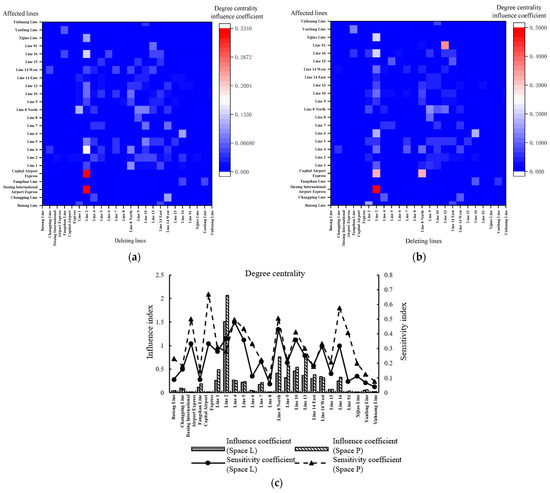
Figure 8.
Degree centrality influence and sensitivity coefficient. (a) Degree centrality influence coefficient between lines (Space L). (b) Degree centrality influence coefficient between lines (Space P). (c) Degree centrality influence and sensitivity coefficient.
From Figure 9a,b, under Space L, Line 10 has a significant influence on the near-centrality of other subway line stations, among them, Daxing International Airport Express, Line 1, and Xijiao Line are the most obvious. Line 14 West has a significant influence on Line 16, and the same for Line 5 and Fangshan Line on Yanfang Line. Under Space P, Line 10 significantly influences Daxing International Airport Express, the same for Fangshan Line on Yanfang Line, Line 4 on Line 16, Line 5 on Yizhuang Line, and Line 9 on Yanfang Line. Under the analysis of the Space L and Space P, the comparison results are shown in Figure 9c: Line 10, Line 9, and Line 2 have the highest near-centrality influence coefficient under the Space L and Space P. Daxing International Airport Express and Yanfang Line have the highest near-centrality sensitivity coefficient.
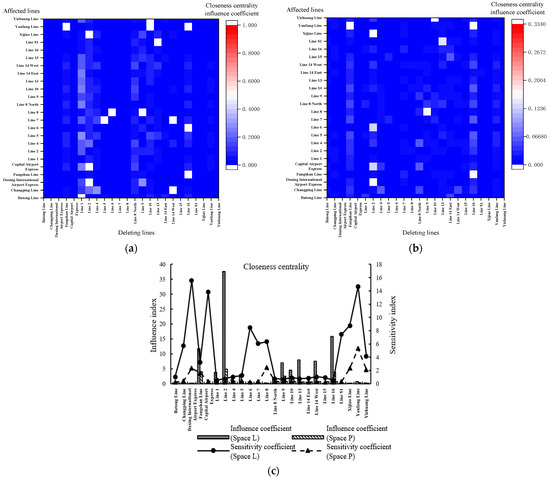
Figure 9.
Near-centrality influence and sensitivity coefficient. (a) Near-centrality influence coefficient between lines (Space L). (b) Centrality influence coefficient between lines (Space P). (c) Near-centrality influence and sensitivity coefficient.
From Figure 10a,b, under Space L, Line 10 has a significant influence on the intermediate centrality of other subway line stations, among them, Daxing International Airport Express, Line 1, and Line 7 are the most obvious. Line 10 has a significant influence on Xijiao Line, the same for Line 6 on Line S1, and Line 9 on Line 14 West. Under Space P, Line 13 has a significant influence on Changping Line, the same for Line 14 East on Line 15, Line 8 on Line 13, and Line 9 on Yanfang Line. Under the analysis of the Space L and Space P, the comparison results as shown in Figure 10c: Line 9 has the highest intermediate centrality influence coefficient under the Space L and Space P. Line 14 West has the highest intermediate centrality sensitivity coefficient.
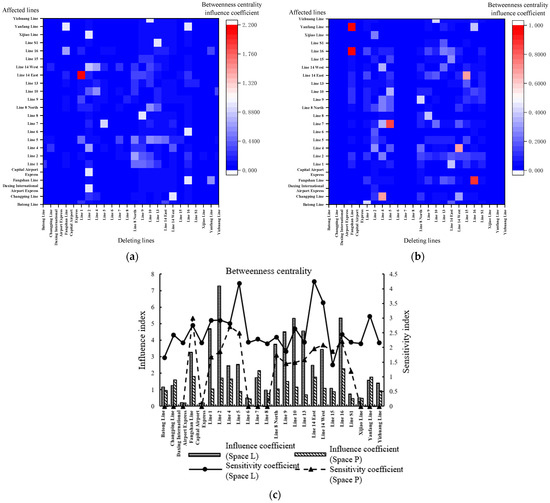
Figure 10.
Intermediate centrality influence and sensitivity coefficient between lines. (a) Intermediate centrality influence coefficient between lines (Space L). (b) Betweenness influence coefficient between lines (Space P). (c) Intermediate centrality influence and sensitivity coefficient.
In summary, it can be concluded that regardless of the global and local factors, different influence indexes at different levels can be derived from the importance of the line, and the unit difference between the indexes is large. Considering the comprehensive level, the indexes mentioned above are normalized and continue to be summed to obtain the line importance index . The calculation is shown in Formula (25), where is the value normalized by the aggregation influence coefficient of line a under Space L, and the other parameters are obtained in the same way.
The importance index of each subway line in Beijing is shown in Table 12, so it can be concluded that considering only the level of complex network characteristics, Line 10, Line 9, Line 1, Line 2 and Line 5 are the five subway lines with the highest importance, and Line S1, Changping Line, Xijiao Line, Capital Airport Express and Daxing International Airport Express are the five subway lines with the lowest importance.
Table 12.
Line importance index of Beijing subway.
5. Conclusions and Prospect
Based on the complex network theory, we analyzed the characteristics of the Beijing subway network and gave the method of key lines’ identification. The main conclusions and research outlook are as follows.
- (1)
- The current Beijing subway network under Space L, the cumulative distribution of degree conforms to the logarithmic function distribution, and the goodness of fit R2 = 0.8531, which is a scale-free network, but with low aggregation coefficient and no small-world characteristics. Under Space P, the goodness of fit R2 = 0.9391 for the logarithmic function, and with high clustering coefficient, low network diameter, strong small-world characteristics, and scale-free network. Under Space C, the goodness of fit R2 = 0.9166 for the logarithmic function, with scale-free network characteristics and similar to Space L network, it has low aggregation but long distance and no small-world network characteristics;
- (2)
- By establishing the line importance index system and giving the key lines’ identification method, based on the Matlab simulation experiment, we obtained the criticality of each line, which Line 1, Line 2, Line 4, Line 6, and Line 10 are the five subway lines with the highest criticality under Space L and Space P; and
- (3)
- Considering the global and local levels, different analysis indexes reflect the different image degrees of the lines to the global network and subway lines, and there are unit differences between the indexes. The line importance index is proposed to combine the above indexes to derive the criticality of the line at a comprehensive level. Considering only the complex network characteristics, Line 10, Line 9, Line 1, Line 2, and Line 5 are the five most important subway lines, with line importance indexes of about 10.07, 6.48, 5.06, 4.56, and 4.36. Line S1, Changping Line, Xijiao Line, Capital Airport Line, and Daxing International Airport Line are the five lowest-importance subway lines, with line importance indexes of about 1.04, 1.04, 0.94, 0.31, and 0.25.
More and more cities are stepping into subway construction, and the scale and structure of subway networks are showing complexity. This study characterizes the current network of the Beijing subway network, but the future characteristics will be changed. Previous scholars have less involvement in the network characteristics under Space C. This study initially involves the small-world and scale-free characteristics of the subway network under Space C, and other studies need to be further deepened, such as association analysis. At the same time, the key lines’ identification method selected in this study, for the selection of indexes, can be further improved. Space C, also known as an interchange network, expresses the connection between lines and can be introduced into the key lines’ identification. The centrality sensitivity coefficient is proposed to describe the sensitivity of the lines to the influence of other networks, which is not overly developed, but this study provides direction for the study of network robustness, which is one of the directions of future research.
Author Contributions
Conceptualization, Y.P. and M.C.; methodology, Y.P. and M.C.; software, S.F. and D.H.; validation, Y.P. and S.F.; formal analysis, Y.P. and M.C.; investigation, S.F. and D.H.; resources, S.F. and Y.P.; data curation, Y.P., M.C. and S.F.; writing—original draft preparation, Y.P., M.C., S.F. and D.H.; writing—review and editing, Y.P., M.C., S.F. and D.H.; visualization, Y.P., S.F. and D.H.; supervision, Y.P., M.C. and D.H.; project administration, Y.P.; and funding acquisition, S.F. All authors have read and agreed to the published version of the manuscript.
Funding
This work was supported by the National Natural Science Foundation of China (grant no. 71771062).
Institutional Review Board Statement
Not applicable.
Informed Consent Statement
Not applicable.
Data Availability Statement
The data used in the study are available from the corresponding author upon request.
Conflicts of Interest
The authors declare that they have no conflict of interest.
References
- Lü, W.H.; Wang, G.J.; Wang, P.F. A Review on Reliability of Transportation Network Based on Complex Network Theory. Sci. Technol. Eng. 2019, 19, 26–33. [Google Scholar]
- Sarker, S.; Veremyev, A.; Boginski, V.; Singh, A. Critical Nodes in River Networks. Sci. Rep. 2019, 9, 11178. [Google Scholar] [CrossRef] [PubMed]
- An, F.; Gao, X.; Guan, J.; Jiang, M.; Liu, Q. Detecting the Significant Nodes in Two-Layer Flow Networks: An Interlayer Non-Failure Cascading Effect Perspective. Eur. Phys. J. Spec. Top. 2019, 228, 2475–2490. [Google Scholar] [CrossRef]
- Yang, Y.; Liu, Y.; Zhou, M.; Li, F.; Sun, C. Robustness Assessment of Urban Rail Transit Based on Complex Network Theory: A Case Study of the Beijing Subway. Saf. Sci. 2015, 79, 149–162. [Google Scholar] [CrossRef]
- Watts, D.J.; Strogatz, S.H. Collective Dynamics of ‘Small-World’ Networks. Nature 1998, 393, 440–442. [Google Scholar] [CrossRef]
- Barabási, A.-L.; Albert, R. Emergence of Scaling in Random Networks. Science 1999, 286, 509–512. [Google Scholar] [CrossRef]
- Ye, Q.; Kim, H. Assessing Network Vulnerability of Heavy Rail Systems with the Impact of Partial Node Failures. Transportation 2019, 46, 1591–1614. [Google Scholar] [CrossRef]
- Ye, Q.; Kim, H. Assessing Network Vulnerability Using Shortest Path Network Problems. J. Transp. Saf. Secur. 2021, 13, 1–25. [Google Scholar] [CrossRef]
- Owais, M. Issues Related to Transit Network Design Problem. Int. J. Comput. Appl. 2015, 120, 40–45. [Google Scholar] [CrossRef]
- Owais, M.; Ahmed, A.S.; Moussa, G.S.; Khalil, A.A. Design Scheme of Multiple-Subway Lines for Minimizing Passengers Transfers in Mega-Cities Transit Networks. Int. J. Rail Transp. 2021, 9, 540–563. [Google Scholar] [CrossRef]
- Owais, M.; Ahmed, A.S.; Moussa, G.S.; Khalil, A.A. An Optimal Metro Design for Transit Networks in Existing Square Cities Based on Non-Demand Criterion. Sustainability 2020, 12, 9566. [Google Scholar] [CrossRef]
- Latora, V.; Marchiori, M. Is the Boston Subway a Small-World Network? Phys. A Stat. Mech. Appl. 2002, 314, 109–113. [Google Scholar] [CrossRef]
- Sienkiewicz, J.; Hołyst, J.A. Statistical Analysis of 22 Public Transport Networks in Poland. Phys. Rev. E 2005, 72, 046127. [Google Scholar] [CrossRef] [PubMed]
- Zhang, J.; Liang, Q.H.; He, X.T. Study on the complexity of Beijing metro network. J. Beijing Jiaotong Univ. 2013, 37, 78–84. [Google Scholar]
- Zhang, J.; Zhao, M.; Liu, H.; Xu, X. Networked Characteristics of the Urban Rail Transit Networks. Phys. A Stat. Mech. Appl. 2013, 392, 1538–1546. [Google Scholar] [CrossRef]
- Du, F.; Huang, H.W.; Zhang, D.M.; Zhang, F. Analysis of characteristics of complex network and robustness in Shanghai metro network. Eng. J. Wuhan Univ. 2016, 49, 701–707. [Google Scholar]
- Wang, X.; Koç, Y.; Derrible, S.; Ahmad, S.N.; Pino, W.J.A.; Kooij, R.E. Multi-Criteria Robustness Analysis of Metro Networks. Phys. A Stat. Mech. Appl. 2017, 474, 19–31. [Google Scholar] [CrossRef]
- Lü, L.; Chen, D.; Ren, X.-L.; Zhang, Q.-M.; Zhang, Y.-C.; Zhou, T. Vital Nodes Identification in Complex Networks. Phys. Rep. 2016, 650, 1–63. [Google Scholar] [CrossRef]
- Gao, H.Y.; Liu, F.; Qian, Y. Complexity and optimization of public transit network: Taking Baoji for example. J. Chang. Univ. 2018, 38. 146–153 + 181. [Google Scholar]
- Lu, H.; Shi, Y. Complexity of Public Transport Networks. Tsinghua Sci. Technol. 2007, 12, 204–213. [Google Scholar] [CrossRef]
- Newman, M.E.J. Fast Algorithm for Detecting Community Structure in Networks. Phys. Rev. E 2004, 69, 066133. [Google Scholar] [CrossRef] [PubMed]
- Yang, Y.Z.; Hu, M.; Huang, T.Y. Influential Nodes Identification in Complex Networks Based on Global and Local Information. Chin. Phys. B 2020, 29, 088903. [Google Scholar] [CrossRef]
- Sheng, J.; Dai, J.; Wang, B.; Duan, G.; Long, J.; Zhang, J.; Guan, K.; Hu, S.; Chen, L.; Guan, W. Identifying Influential Nodes in Complex Networks Based on Global and Local Structure. Phys. A Stat. Mech. Appl. 2020, 541, 123262. [Google Scholar] [CrossRef]
Disclaimer/Publisher’s Note: The statements, opinions and data contained in all publications are solely those of the individual author(s) and contributor(s) and not of MDPI and/or the editor(s). MDPI and/or the editor(s) disclaim responsibility for any injury to people or property resulting from any ideas, methods, instructions or products referred to in the content. |
© 2022 by the authors. Licensee MDPI, Basel, Switzerland. This article is an open access article distributed under the terms and conditions of the Creative Commons Attribution (CC BY) license (https://creativecommons.org/licenses/by/4.0/).