1. Introduction
With recent advancements in medical information technology, a huge volume of raw medical data is rapidly generated from different medical resources such as medical examinations, radiology, laboratory tests, mobile health applications, and wearable healthcare technologies [
1,
2,
3]. Extracting informative knowledge from these medical data using artificial intelligence and machine learning algorithms can help in faster treatment and significantly reduce patient mortality rates [
4,
5]. Application of these algorithms in some diseases such as Diabetes, Heart problems, Hepatitis, and Coronavirus is more common than others due to their high epidemic and mortality rates, expensive tests, and the requirement of special experience [
6,
7,
8]. One of the main challenges in such disease datasets is the existence of redundant and irrelevant features [
9], which can decrease the effectiveness of disease diagnosis systems. In medical data mining and machine learning [
10,
11], one of the most crucial preprocessing steps is feature selection, which eliminates redundant and irrelevant features to uncover effective ones. Since there are 2
N distinct feature subsets in a dataset with
N features, the feature selection problem is NP-hard [
12,
13]. Therefore, evaluating all feature subsets to find effective features is very costly, and if each feature is added to the dataset, then the complexity will be doubled [
13,
14].
Filter-based, wrapper-based, and embedded methods are the three main categories of feature selection techniques [
15,
16]. The classification algorithm is not involved in filter-based methods, which typically operate based on feature ranking. Wrapper-based methods use a classifier algorithm to evaluate individual candidate subsets of features as opposed to filter-based methods [
17,
18]. Embedded methods combine the qualities of filter and wrapper methods, and the feature selection algorithm is integrated as part of the learning algorithm [
16]. Many wrapper feature selection methods based on metaheuristic algorithms have been proposed [
15,
16] that can effectively solve feature selection problems as an NP-hard problem in a reasonable response time [
19,
20]. The main goal of using metaheuristic algorithms is to search the feature space and find near-optimal solutions effectively. Metaheuristic algorithms are recognized as robust problem solvers to solve a variety of problems with different types, such as continuous [
21], discrete [
22,
23,
24], and constraint [
25,
26]. Particle swarm optimization (PSO) [
27], ant colony optimization (ACO) [
28], differential evolution (DE) [
29], cuckoo optimization algorithm (COA) [
30], krill herd (KH) [
31], social spider algorithm (SSA) [
32], crow search algorithm (CSA) [
33], grasshopper optimization algorithm (GOA) [
34], quantum-based avian navigation optimizer algorithm (QANA) [
35] and African vultures optimization algorithm (AVOA) [
36] are some of the successful metaheuristic algorithms that are promisingly developed to solve feature selection problems.
Many metaheuristic-based methods have been proposed to select features from medical data [
37,
38,
39]. However, a few of them can select effective features that may provide acceptable accuracy in diagnosing all the targeted diseases in this study, including Diabetes, Heart problems, Hepatitis, and Coronavirus [
40]. The main reason for this drawback is generating and storing many irrelevant and redundant features in the medical processes, which reduces the efficiency of classification algorithms used in disease diagnosis systems. Therefore, a metaheuristic algorithm is needed to select useful and effective features from medical datasets by striking a proper balance between local and global search strategies. Responding to this need, particularly for the datasets targeted in the scope of this study, is our motivation to introduce binary versions of the newly proposed starling murmuration optimizer (SMO) algorithm [
41], which can balance between its search strategies efficiently. The SMO algorithm uses a dynamic multi-flock construction and three search strategies: separating, diving, and whirling. Starlings in large flocks turn, dive, and whirl across the sky in SMO. The separating search strategy enriches population diversity by employing the quantum harmonic oscillator. With the help of a quantum random dive operator, the diving search strategy enhances the exploration. In contrast, the whirling search strategy significantly uses cohesion force in the vicinity of promising regions. The SMO algorithm has shown a high ability to solve different complex and engineering problems, but it was not yet developed for solving feature selection problems. The binary version of SMO or BSMO is expected to effectively solve the feature selection problem.
The BSMO algorithm generates candidate subsets of features using two different approaches. The first approach develops binary versions of BSMO using several S-shaped and V-shaped transfer functions. In contrast, in the second approach, BSMO maps each dimension in a continuous solution generated by SMO to 0 or 1 using a variable threshold method. The scope of this study is limited to selecting effective features from four targeted datasets consisting of Diabetes, Heart, Hepatitis, and Coronavirus. The performance of the BSMO’s variants is assessed on targeted datasets in terms of fitness, accuracy, sensitivity, specificity, precision, and error. The results are contrasted with competing binary algorithms like the ant colony optimization (ACO) [
28], binary bat algorithm (BBA) [
42], binary grey wolf optimization (bGWO) [
43], and binary whale optimization algorithm (BWOA) [
39]. The main contributions of this study can be summarized as follows.
Developing the BSMO algorithm as a binary version of the SMO algorithm.
Transferring the continuous solutions to binary ones effectively using two different approaches, including S-shaped and V-shaped transfer functions and value threshold method.
Evaluating BSMO on medical datasets targeted in this study and comparing its performance with other popular feature selection algorithms.
Finding satisfactory results in selecting effective features from the targeted medical datasets.
The rest of this paper is organized as follows. The related works are reviewed in
Section 2. A description of the standard SMO algorithm is presented in
Section 3. The details of the proposed BSMO algorithm are presented in
Section 4.
Section 5 includes the experimental evaluation and the comparison between the proposed BSMO and contender algorithms.
Section 6 concludes this study and its finding, and suggests some future works.
2. Related Works
Real-world optimization problems have different properties and involve various intricacies, creating critical challenges for optimization algorithms in solving them. Generally, optimization problems in mechanical and engineering applications are mostly faced with multiple properties, such as linear and non-linear constraints in decision variables, non-differentiable objectives, and constraint functions. Therefore, many constraint-handling methods, such as penalty functions, static, dynamic, annealing, adaptive, co-evolutionary, and the death penalty, are developed to cope with such challenges [
44]. The other optimization problems, especially in feature selection applications, mostly involve different intricacies such as discrete search spaces, existing irrelevant and redundant features, and high dimensionality feature space. Feature selection is a common way in preprocessing phase to cope with such intricacies by selecting only a small subset of relevant features from the original dataset [
45,
46]. Feature selection reduces the feature space’s dimensionality, speeds up the learning process, simplifies the learned model, and boosts classifier performance by eliminating redundant and irrelevant features [
47,
48,
49].
The topic of feature selection is presented as a binary optimization problem with the conflicting objectives of reducing the number of features and enhancing classification accuracy. Each solution is presented by a
D-dimensional binary vector that only has the two values 0 and 1, where 0 signifies that the corresponding feature is not selected, and 1 indicates that it is selected. The number of dimensions in this binary vector corresponds to the number of features in the initial feature dataset. In many machine learning and data mining tasks, including intrusion detection [
50,
51,
52,
53], spam detection [
54,
55], financial problem prediction [
56], and classification [
57,
58,
59]. Particularly, finding an optimal subset of features from medical datasets is a challenging problem that many researchers have recently considered. Metaheuristic algorithms are recognized as prominent problem-solver to solve optimization problems especially feature selection. Based on the source of their inspiration, metaheuristic algorithms may be divided into eight groups: physical-based, biology-based, swarm-based, social-based, mu-sic-based, sport-based, chemistry-based, and math-based [
60,
61,
62]. Since most metaheuristic algorithms are proposed for continuous problems, many binarization methods such as logical operators, variable threshold methods and transfer functions, are developed to map the continuous feature space to the binary one. In the literature, the most famous transfer functions are S-shaped [
63], V-shaped [
64,
65,
66], U-shaped [
67,
68], X-shaped transfer function [
69], and Z-shaped [
70]. This section presents an overview of the most recent related works on metaheuristics for the wrapper feature selection problem in medical data classification.
Nadimi-Shahraki et al. [
40] proposed an improved whale optimization algorithm called BE-WOA. In BE-WOA, a pooling mechanism and three effective search strategies, migration, preferential selection, and surrounded prey, are used to improve the WOA to select effective features from medical datasets. BE-WOA also applied to predict Coronavirus 2019 disease or COVID-19. The obtained results prove the efficiency of the BE-WOA algorithm. The gene selection technique is used for high-dimensional datasets where the number of samples is small, and the number of features is large. Finding the best feature subset in a dataset is the process of gene selection [
71]. For gene selection, Alirezanejad et al. [
72] developed two Xvariance heuristics against mutual congestion. This approach involves ranking the features first. Then, using Monte’s cross-validation, ten subsets of features are chosen based on forward feature selection (FFS). To enhance the results, majority voting is applied to the features selected in the prior stage to calculate accuracy, sensitivity, specificity, and matthews correlation coefficient.
Asghari Varzaneh et al. [
73] proposed a new COVID-19 intubation prediction strategy using the binary version of the horse herd optimization algorithm to select the effective features. The results of the tests showed that the proposed feature selection method is better than other methods. Pashaei et al. [
74] introduced two binary variations of the chimp optimization algorithm using S-shaped and V-shaped transfer functions for biomedical data classification. In a recent study, Nadimi-Shahraki et al. [
75] proposed the binary version of the quantum-based avian navigation optimizer algorithm (BQANA) to select the optimal feature subset from high-dimensional medical datasets. The reported results show that the BQANA using a threshold method can dominate all contender algorithms. Alweshah et al. [
76] proposed the greedy crossover (GC) operator strategy to boost the exploration capability of the coronavirus herd immunity optimizer (CHIO). Then, some medical datasets were used to evaluate the performance of the proposed algorithm in addressing the feature selection problem in the field of medical diagnosis. The results indicated that the GC operator strikes a balance between the search strategies of the CHIO algorithm.
For challenges involving medical feature selection, Anter et al. [
77] proposed a hybrid crow search optimization algorithm combined with chaos theory and a fuzzy c-means algorithm (CFCSA). The suggested algorithm avoids local optima and improves the CSA’s convergence using chaos theory and the global optimization method. The test results show the efficiency and stability of CFCSA for solving medical data and real problems. Singh et al. [
78] proposed a hybrid ensemble-filter wrapper feature selection algorithm to improve the performance of classifiers in medical data applications. In this algorithm, first, the filter-based method is used based on the weight points to produce the ranking of the features. Then, the sequential forward selection algorithm is used as a wrapper-based feature selection to generate an optimal feature subset. To propose the binary version of the atom search optimization algorithm (ASO), Too et al. [
79] applied four S-shaped and four V-shaped transfer functions to solve the feature selection problem. Among the eight presented binary versions, BASO based on the S1–shaped transfer function has the highest performance. Moreover, Mirjalili et al. [
67] proposed a new binary version of the PSO algorithm using a U-shaped transfer function to transform continuous velocity values into binary values. The results show that U-shaped transfer functions significantly increase the performance of BPSO.
Elgamal et al. [
80] enhanced the reptile search optimization algorithm (RSA) by employing the chaotic map and simulated annealing algorithm to tackle feature selection issues for high-dimensional medical datasets. Applying chaos theory to RSA improves its exploration ability, and hybridizing RSA with the simulated annealing algorithm can avoid local optima trapping. Many metaheuristic algorithms have been proposed to solve feature selection problems, such as binary ant lion optimizer (BALO) [
81], return-cost-based binary firefly algorithm (Rc-BBFA) [
82], chaotic dragonfly algorithm (CDA) [
83], binary chimp optimization algorithm (BChOA) [
84], altruistic whale optimization algorithm (AltWOA) [
85], binary African vulture optimization algorithm (BAVOA) [
86], and binary dwarf mongoose optimization algorithm (BDMSAO) [
87].
Studying related works shows that various metaheuristic algorithms have been used to select effective features from medical data. However, most of them cannot find effective features for providing an acceptable diagnosis of important diseases such as Diabetes, Heart, Hepatitis, and Coronavirus. To respond to this weakness, the BSMO algorithm is introduced to develop a new wrapper feature selection method for these diseases in this study.
3. Starling Murmuration Optimizer (SMO)
SMO is a population-based metaheuristic algorithm recently developed by Zamani et al. [
41]. The SMO algorithm is modeled the starlings’ behavior during their stunning murmuration using three new search strategies, separating, diving, and whirling. The starling’s population is denoted by
where
N is the population size. The position of each starling
si at iteration
t is denoted using a vector
and its fitness value is expressed by
. In first iteration, each
is initiated by a uniform random distribution in a
D-dimensional search space using Equation (1), where
and
are lower and upper bounds of the search space, respectively and
is a random value between 0 and 1.
For the rest of the iterations, the population of starlings is moved using the separating, diving, and whirling search strategies. The details of these search strategies are discussed in the following sections.
3.1. Separating Search Strategy
The separation search strategy is promoted diversity throughout the population. In this strategy, first, a portion of starlings with size
Psep are randomly selected to separate from population
S using Equation (2). Then, some dimensions of the selected starlings are updated using Equation (3), where
is the global best position, and
is randomly selected from a population S. In each iteration, the best position obtained so far is stored, then these positions are joined with the separated positions with size
, ultimately
is randomly selected from these sets.
is a separation operator which is calculated using Equation (4), where
is the quantum harmonic oscillator, parameters
m and
k are the particle’s mass and strength, respectively and the parameter
h is Planck’s constant. Moreover, the function
is the Hermite polynomial with integer index
n, and
y is a random number.
The rest of the starlings with a size of Ń (N − Psep) is flocked using dynamic multi-flock construction to search the problem space using either diving or whirling search strategies. Each iteration creates a dynamic multi-flock using k non-empty flocks f1…fk. First, k best starlings are separated from the population Ń and stored in matrix R, then the rest of the population (Ń-R) is divided among the k flocks. Finally, each position of R assigns to each flock such that f1← {R1 U f1}, …, fk← {Rk U fk}.
As shown in Equation (6), the diving and whirling search strategies are assigned to the flocks based on the quality of each flock. The quality of each flock (
Qq (t)) is evaluated using Equation (5), where
k is the number of flocks,
sfij (t) is the fitness value of the starling
si in the flock
fj, and
n is the number of starlings in each flock. The parameter
μQ (t) in Equation (6) denotes the average of all flock’s quality.
3.2. Diving Search Strategy
The diving search strategy is encouraged the selected flocks (
Qq (t) ≤
µQ (t)) to explore the search space effectively. The starlings are moved using upward and downward quantum random dives (
QRD). The starlings of a flock switch among these quantum dives using two quantum probabilities shown in Equation (7), where
and
are the upward and downward probabilities that are computed using Equations (8) and (9). Parameters
and
are set by the user, and
is an inverse-Gaussian distribution that is computed using Equation (10), where the values of
λ and
µ are set by the user, and
y is a random number.
The downward and upward quantum dives are computed using Equations (11) and (12), respectively, where
is selected from set
R,
is the position of starling
si in the current iteration, the position of
is randomly selected among flocks assigned for diving strategy,
is randomly selected from the population
S and the best starlings set.
is a random position selected from the best starlings set obtained from the first iteration so far and the starling population
S.
3.3. Whirling Search Strategy
Starlings of a flock exploit the search problem using the whirling search strategy when the quality of the flock is more than the average quality of all flocks
(Qq (t) >
µQ (t)). The whirling search strategy is denoted in Equation (13), where
Xi (t+
1) is the next position of starling
si at iteration
t, a position
XRW (t) is randomly selected from set
R of flocks that are considered for the whirling search strategy,
XN (t) randomly selected from all flocks that want to use the whirling search strategy.
Ci (t) is the cohesion operator which is calculated using Equation (14), where
ξ (t) is a random number between intervals 0 and 1.
The pseudocode of the SMO algorithm is shown in Algorithm 1.
| Algorithm 1: Starling Murmuration Optimizer (SMO) |
| Input: N (Population size), k (Flocks size), and MaxIt (Maximum iterations). |
| Output: Global best solution. |
| 1: | Begin |
| 2: | Randomly distributed N starlings in the search space. |
| 3: | Set t = 1. |
| 4: | Whilet ≤ MaxIt |
| 5: | Separating a portion of starlings with size Psep from the population using Equation (2). |
| 6: | The rest of the population is flocked into k flocks using the dynamic multi-flock construction. |
| 7: | Computing the quality of each flock (fq) using Equation (5). |
| 8: | For q = 1: k |
| 9: | If Qq (t) ≤ µQ (t) |
| 10: | Moving starlings of the flock fq using the diving strategy. |
| 11: | Else |
| 12: | Moving starlings of the flock fq using the whirling strategy. |
| 13: | End if |
| 14: | End for |
| 15: | Update the position of starlings and global best solution. |
| 16: | t = t + 1. |
| 17: | End while |
| 18: | Return position of best starling as a global best solution. |
| 19: | End |
4. Binary Starling Murmuration Optimizer (BSMO)
SMO is a new metaheuristic algorithm that effectively solves various engineering and complex problems. However, the ability of the SMO algorithm to solve feature selection problems has not been studied yet, which is the motivation of this study. In this study, a binary starling murmuration optimizer (BSMO) is proposed to select effective features from the datasets of four important targeted diseases consisting Diabetes, Heart problems, Hepatitis, and Coronavirus. The proposed BSMO is developed using two different approaches. The first approach uses S-shaped and V-shaped transfer functions, whereas the second approach maps the continuous search space to 0 or 1 using a threshold value.
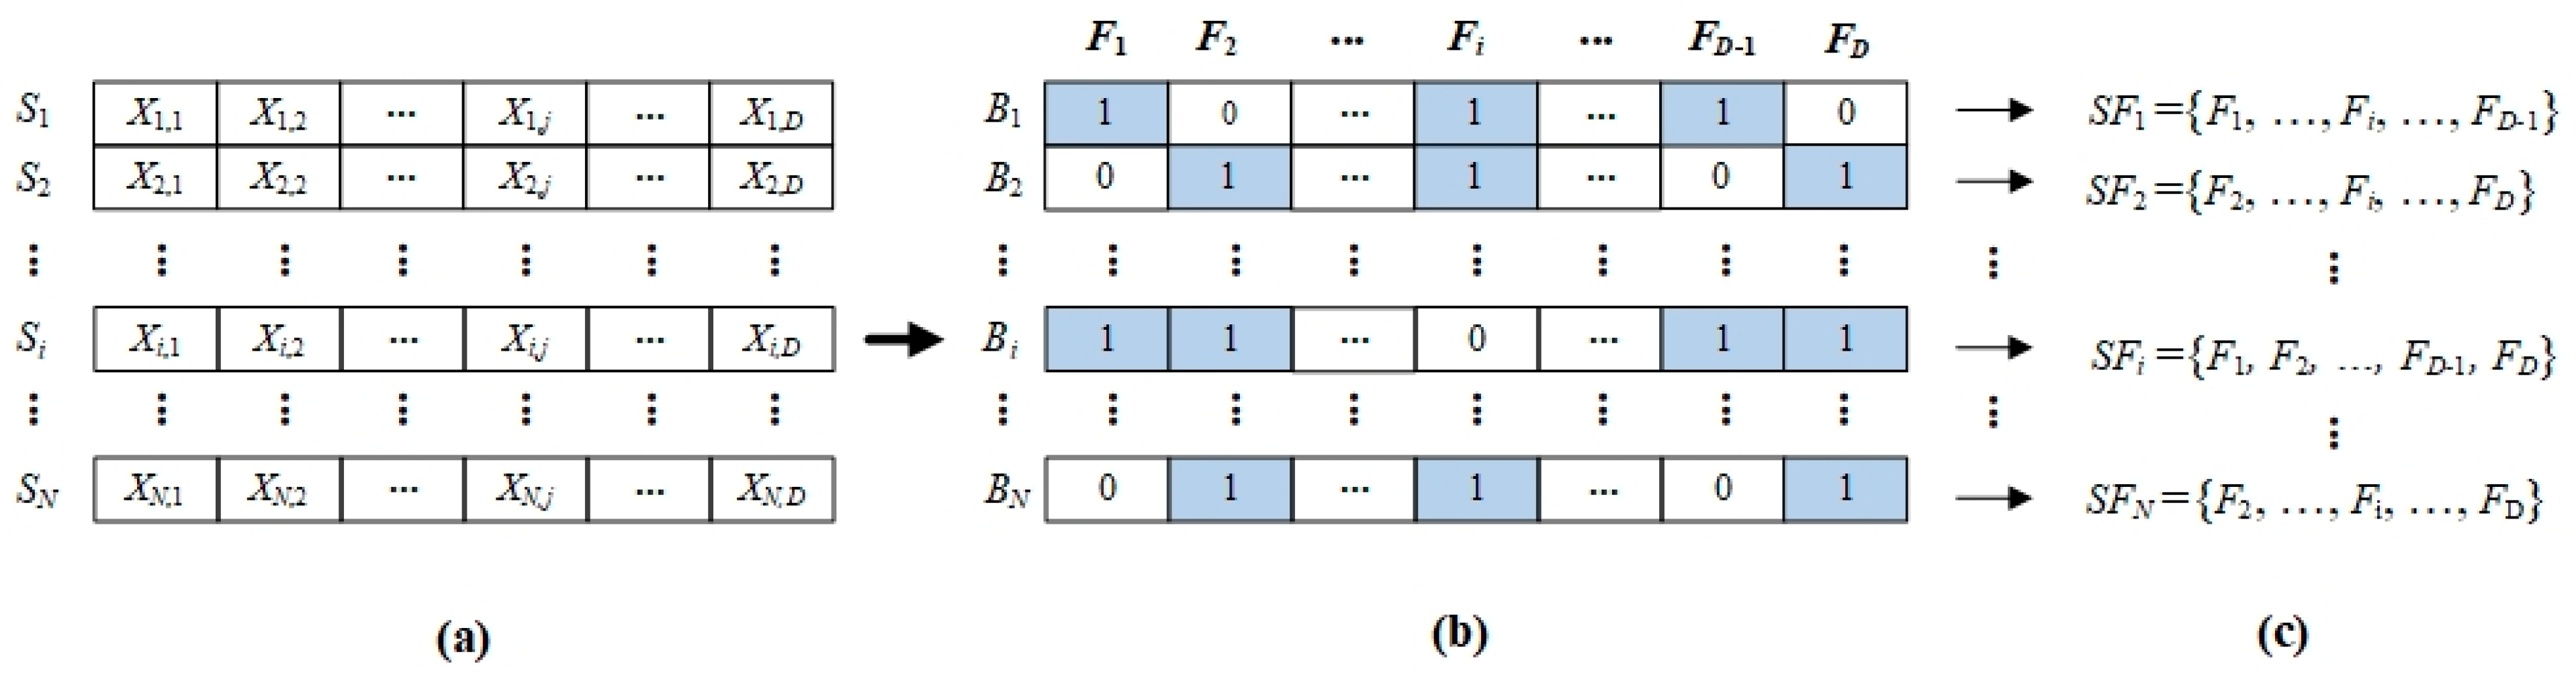
Suppose matrix X is to represent the population of starlings in the BSMO, then
Figure 1 shows the representation scheme of the proposed BSMO algorithm in solving the feature selection problem.
Figure 1a–c show starling
Si, binary vector
Bi, and the selected feature set
SFi. Each starling
Si is transformed using different transform functions to the binary vector
Bi in which the value of 1 for each element means the corresponding feature should be selected to form the selected feature set
SFi. Accordingly, the BSMO algorithm uses the fitness function defined in Equation (15) [
83,
88].
where
E determines the error rate of the classification algorithm,
and
D are the number of the selected feature in a subset of
SFi, and the total features in the dataset, respectively.
and
are two constant values to control the significance of the classification accuracy and feature subset reduction, respectively. Since the accuracy is more important of the number of features, usually
β is very smaller than
α, in this study,
α = 0.99 and
β = 0.01, according to [
89].
4.1. BSMO Using S-Shaped Transfer Function (S-BSMO)
This method uses the sigmoid transfer function (S-shape) to map the continuous to the binary version of the SMO algorithm. Therefore, updating the position of the starlings by the transfer functions
S will cause them to be in a binary search space, and their position vector will only take the values of “0” or “1”. The sigmoid function
S2 formulated in Equation (16) first used in BPSO to develop a binary PSO [
89,
90].
where
and
show the position and probability of changing the binary position value of the search agent
ith in dimension
d in the
tth iteration, respectively. Since the calculated value of
S is still in continuous mode, it must be compared with a threshold value to create binary mode. Therefore, the new position of the search agent is updated using Equation (17), where
is a binary position of
ith search agent in dimension
d, and
r is a random value between 0 and 1.
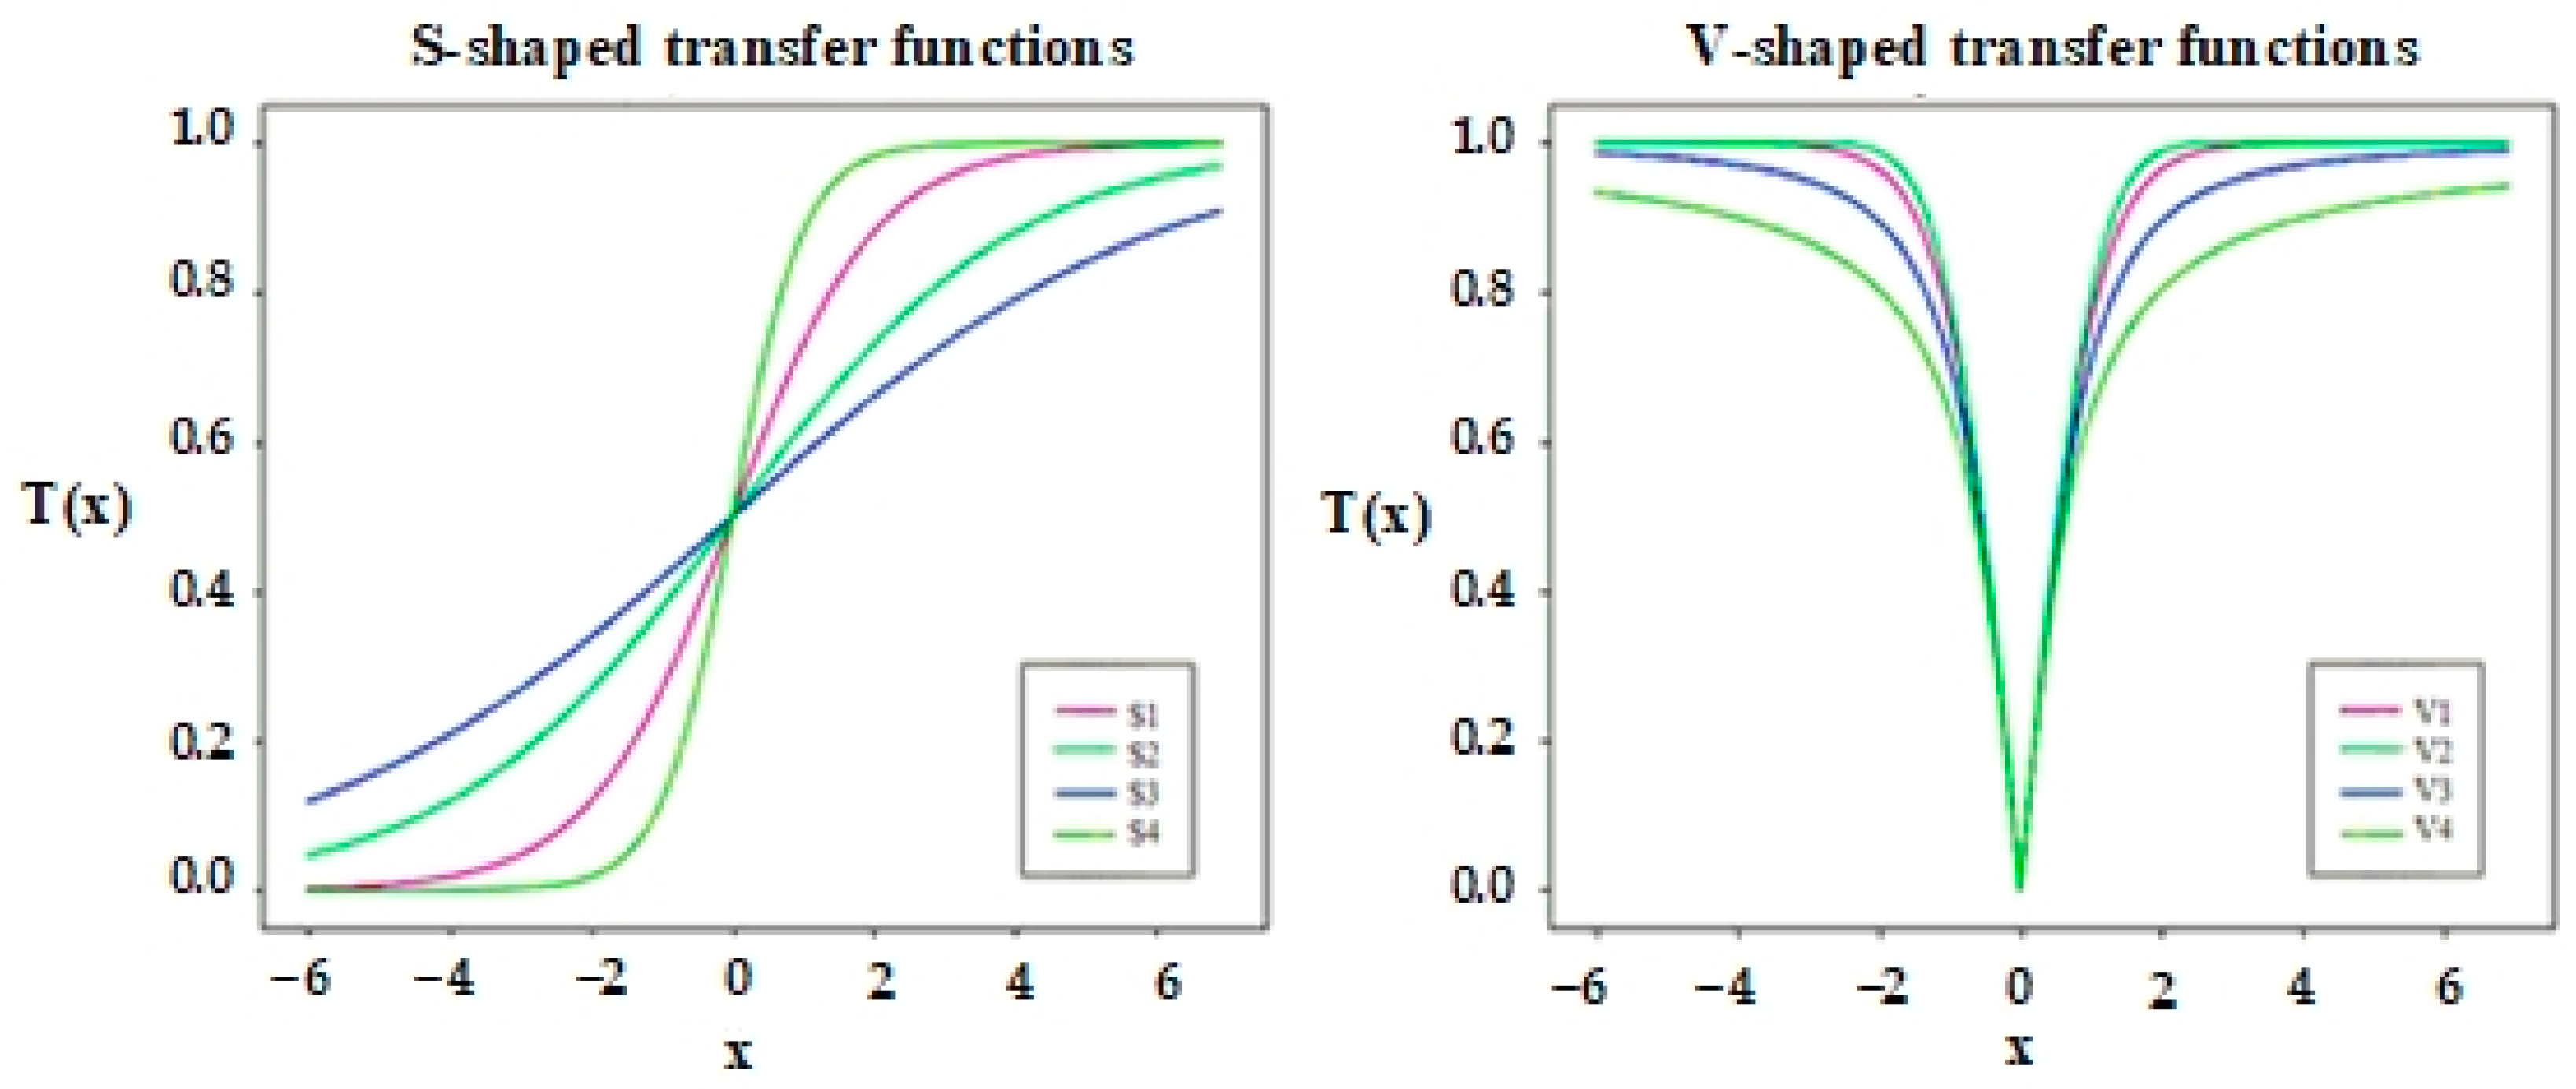
In addition to the transfer function
S2 introduced in Equation (16), three other types of S-shaped transfer functions, including
S1,
S3, and
S4 have been used. All four transfer functions are formulated in
Table 1. Moreover, all these transfer functions are shown visually in
Figure 2. According to the figure, as the slope of the transfer function
S increases, the probability of changing the position value increases. Therefore,
S1 obtains the highest probability, and
S4 obtains the lowest probability, effectively updating agents’ position and finding the optimal solution.
4.2. BSMO Using V-Shaped Transfer Function (V-BSMO)
In this approach, the V-shaped transfer function is used to calculate the probability of changing the position of the agents in the SMO algorithm. Probability values are calculated using the V-shaped (hyperbolic) transfer function by Equation (18) [
64], where
indicates the position value of the
ith search agent in dimension
d at iteration
t.
Considering that the V-shaped transfer function is different from the S-shaped transfer function, after calculating the probability values, the Equation (19) [
64] is used to update the position of each search agent.
where,
indicates the binary position of the
ith search agent at iteration
t + 1 in dimension
d. Moreover,
indicates the complement of
. In addition,
r is a random number in [0,1]. Unlike the S-shaped transfer function, the V-shaped transfer function does not force the search agents into 0 or 1. According to Equation (19), if the value of
is small and less than the value of
r, the binary position of the search agents in dimension
d will not change. On the other hand, if the calculated value of the transfer function is greater than or equal to the value
r, the position of the search agents is changed to the complement of the current binary position.
Table 1 formulates the mathematical equations of transfer functions
V1, V2, V3, and
V4, and
Figure 2 represents transfer functions visually. According to
Figure 2,
V1 has the highest probability, and
V2, V3, and
V4 have lower probability values for moving the positions of search agents, respectively [
89].
4.3. BSMO Using Variable Threshold Method (Threshold-BSMO)
In this section, the SMO transforms the continuous solutions into the binary form using the variable threshold method defined in Equation (20), where
is a new binary position of the
ith search agent, and a variable threshold
is 0.5 that is set by the user.
Figure 3 represents the flowchart of the proposed BSMO algorithm, which is a binary version of the SMO algorithm to solve the feature selection problem. As shown in this figure, the optimization process is started by initializing the input variables, including a maximum number of iterations (
MaxIt), population size (
N), problem size (
D), and flocks size (
k). First,
N starlings are randomly distributed in a
D-dimensional search space. Then, a portion of starlings (
Psep) using Equation (2) are randomly selected to separate from the population and explore the search space using the separating strategy defined in Equation (3). The rest of the starlings are partitioned between different flocks to exploit the search space using the whirling strategy defined in Equation (13) or explore using the diving strategy defined in Equation (7). The obtained solutions from such search strategies are mapped to binary using two binarization approaches demonstrated in
Table 1 and Equation (20). The obtained solutions are restricted to binary values 0 or 1 using Equations (17), (19), and (20). Finally, the solutions are evaluated using Equation (15). The optimization process is repeated until the termination condition, or MaxIt, is satisfied, and the global best solution is reported as the output variable.
4.4. The Computational Complexity of the BSMO Algorithm
Since BSMO has six distinct phases: initialization, separating search strategy, multi-flock construction, diving or whirling search strategy, mapping, and fitness evaluation, its computational complexity can be computed as follows. The initialization phase’s computational complexity is O (
ND), considering
N starlings are randomly allocated in a
D-dimensional search space using Equation (1). Then, a portion of the starlings is randomly selected using Equation (2) to explore the search space with computational complexity O (
ND). The cost of the multi-flock construction phase to build
k flocks by partitioning
N starlings is O (
NlogN +
k). In the next phase, the cost of each flock containing
n subpopulation for determining its quality utilizing Equation (5) is O (
nD), and for moving by either diving or whirling search strategy is also O (
nD). Thus, the overall complexity of this phase is O (
knD) or O (
ND) in the worst case. In the mapping phase, the continuous solutions are transformed into binary ones based on
Table 1 and Equation (20) with computational complexity O (
ND). Finally, in the fitness evaluation phase, the quality of binary solutions is assessed using Equation (15), consisting of a K-fold cross-validation method, k-NN classifier, and updating. The computational complexity of a K-fold cross-validation method with
M samples is O (
KM). Since
K is a constant value, complexity equals O (
M). The k-NN classifier with
M samples and
D features for training the classifier is O (
MD), and the complexity of updating is O (
ND). Since these phases are repeated
T times, therefor the summation of the computational complexity of BSMO is O (
ND + T (ND + (
NlogN+
k) +
ND +
ND +
M +
MD +
ND)), which is equal to
O (
TD (
N+
M)).
5. Experimental Evaluation
The performance of the proposed BSMO algorithm is assessed in finding the optimal feature subset from targeted datasets, Diabetes, Heart, Hepatitis, and Coronavirus diseases 2019, downloaded from [
91,
92]. Then, the nine BSMO variants’ outcomes are then compared with those of competitive algorithms, ACO [
28], BBA [
42], bGWO [
43], and BWOA [
39].
All experiments are run under the same experimental conditions. MATLAB R2019b programming language is considered for implementing the BSMO and running all comparative algorithms. All experiments are run using an Intel (R) Core (TM) i5-3770 CPU, 3.4 GHz, 8 GB RAM, and Windows 10 with the 64-bit operating system.
5.1. Parameter Settings of Algorithms and k-NN Classifier
In this study, the k-nearest neighbor (
k-
NN) classifier with
k = 5 is used to classify the feature subsets in all algorithms [
93]. To learn the
k-
NN classifier, each dataset is randomly partitioned using a
K-fold cross-validation method into training and testing sets, where
K is a constant value equal to 10. One fold is used for the testing set, and the
K−1 folds are applied for the training set [
94,
95].
For a fair comparison, all results were obtained under the same experimental conditions. The common parameters in BSMO and comparative algorithms, such as termination criterion and population size (N), are the same. In most optimization algorithms, the termination criterion is defined using the maximum number of iterations (MaxIt) or maximum function evaluations (MaxFEs), where MaxIt = MaxFEs/N and it is set to 300 and N is 30. Due to the stochastic nature of the algorithms, all simulations and obtained results are conducted with 15 independent runs. All results are reported using the standard statistical metrics maximum (Max), average (Avg), and minimum (Min) values. In each table, the best result is highlighted in boldface.
Table 2 shows the values of parameters used for BSMO and other comparative algorithms. The parameter values of all contender algorithms were set as same as their original papers. Moreover, a sensitivity analysis on key parameters of the BSMO algorithm, such as flock size (
k), and population size (
N), is performed to tune the values of these parameters using the offline parameter tuning method. The tuning results were reported in
Table A1,
Table A2,
Table A3,
Table A4,
Table A5 and
Table A6 of
Appendix A in terms of fitness, error, accuracy, sensitivity, specificity, and precision metrics.
5.2. Evaluation Criteria
The performance of proposed BSMO and contender algorithms are assessed using evaluation criteria such as fitness, accuracy, sensitivity, specificity, precision, and error. The fitness evaluation metric is computed using Equation (15). The accuracy, sensitivity, specificity, precision, and error are calculated using Equations (21)–(25) [
96,
97]. In these equations, parameters
TP and
TN specify the number of positive and negative samples that are correctly classified by the classifier, respectively.
FN is the number of positive samples incorrectly predicted as negative, and FP is the number of negative samples incorrectly predicted as positive using a classifier [
98].
The error metric is computed using the mean square error (MSE) denoted in Equation (25), where
N is the number of samples,
is the observed values and
is the predicted value. Moreover, evaluating the proposed algorithm does not use any constraint handling methods since no constraints are considered in the feature selection problem.
5.3. Numerical Results and Discussion
In this section, the simulation results of the proposed BSMO algorithm are presented on targeted medical datasets.
5.3.1. Comparison of Algorithms to Detect Diabetes Disease
The Pima Indian Diabetes dataset [
91] consists of eight features, 268 samples with diabetes-positive labeling and 500 samples with diabetes-negative. The objective of this dataset is to detect whether or not a patient has diabetes.
Table 3 shows that the proposed Threshold-BSMO can achieve the best performance compared to all comparative algorithms.
5.3.2. Comparison of Algorithms to Detect Heart Disease
The Statlog (Heart) dataset [
91] consists of 13 features and 270 samples without no missing values to detect the absence or presence of heart disease. In this dataset 120 of the samples are labeled with the presence of heart disease and 150 samples are labeled with the absence of this disease. The performance of the proposed BSMO with nine variants is assessed and compared with well-known optimizers to diagnose heart disease. The results in
Table 4 show that the proposed Threshold-BSMO can obtain a minimum fitness value of 0.1322 and a maximum accuracy of 87.037 than other algorithms.
5.3.3. Comparison of Algorithms to Detect Hepatitis Disease
The Hepatitis disease dataset [
91] is complex with many missing values that contain occurrences of hepatitis in people. This dataset consists of 19 features with 155 samples, of which 123 samples are categorized in the live class, and 32 are categorized in the die class. The optimization algorithms try to find the best feature set which can detect Hepatitis disease with high accuracy. In this evaluation, the performance of the proposed algorithm is assessed and reported in
Table 5. The results show that the BSMO using the variable threshold can obtain the optimum feature set with a minimum fitness value. Additionally, the Threshold-BSMO achieves the highest classification accuracy compared to the contender algorithm.
5.3.4. Comparison of Algorithms to Detect Coronavirus Disease 2019 (COVID-19)
The COVID-19 pandemic is an infectious disease of severe acute respiratory syndrome Coronavirus 2019 [
99] which was initiated in Wuhan, China, in December 2019 and profoundly affected human life [
100]. Early detection of Coronavirus disease can reduce the transmission rate and slow the epidemic outbreak. Many optimization algorithms have been developed to alleviate this global crisis [
101]. In this section, the performance of the proposed algorithm is evaluated in the Coronavirus disease 2019 (COVID-19) dataset [
92]. This dataset consists of two classes, death or recovery, and 13 features, including location, country, gender, age, whether the patients visited Wuhan, whether the patients from Wuhan had fever, cough, cold, fatigue, body pain, malaise, and day’s difference between the symptoms being noticed and admission to the hospital. The results reported in
Table 6 indicate the proposed Threshold-BSMO outperforms all contender algorithms and BSMO variants to detect COVID-19.
5.4. Convergence Comparison
In addition, to compare the efficiency of BSMO with other comparative algorithms, convergence curves were drawn for each dataset used in the evolution.
Figure 4 shows the convergence curves of all algorithms based on the fitness value. According to the figure, Threshold-BSMO has the highest efficiency in diagnosing Diabetes, Hepatitis, Heart, and Coronavirus 2019 diseases with the lowest fitness value compared to competitive algorithms.
5.5. Statistical Analysis
To compare the algorithms fairly and to choose the best transfer function for mapping the continuous solutions to binary ones, Friedman’s statistical test was used to rank the algorithms.
Table 7 shows the results of Friedman’s test according to the fitness values of the algorithms in which the Threshold-BSMO is a great variant to select the effect features from Diabetes, Heart, Hepatic, and Coronavirus diseases.
6. Conclusions
Many metaheuristic algorithms have been applied in the wrapper-based methods to select effective features from medical data; however, most cannot find those features that can fulfill an acceptable accurate diagnosis of diseases. To deal with this weakness, a new binary metaheuristic algorithm named binary starling murmuration optimization (BSMO) is proposed to select the effective features from different important diseases such as Diabetes, Heart, Hepatitis, and Coronavirus. The proposed BSMO used two different approaches: S-shaped and V-shaped transfer functions and a variable threshold method to convert the continuous solutions to binary ones. Moreover, metrics such as fitness, accuracy, sensitivity, specificity, precision, and error were used to assess the proposed BSMO’s performance compared to competing algorithms. Finally, the Friedman non-parametric test was also used to show the proposed algorithm’s superiority statistically. The statistical and experimental tests proved that the proposed BSMO algorithm is very competitive in selecting effective features from targeted medical datasets. The proposed Threshold-BSMO can effectively find the optimal feature subset for Diabetes, Heart, Hepatitis, and Coronavirus diseases. Overall, considering the fitness criterion as the main criterion for identifying the most effective binary algorithm in selecting the effective features from the medical datasets targeted in this study, Threshold-BSMO was a superior variant to the contender algorithms.
Although the proposed algorithm can select effective features compared to other comparative algorithms, it was limited to four disease datasets targeted in this study. Therefore, the proposed BSMO algorithm can be applied and improved for other real-world applications. Moreover, a self-adapting parameter tuning method can be applied instead of the try-and-test method used for tuning some parameters of BSMO. The BSMO can be armed by other binarization techniques and transfer functions for selecting effective features in other applications. In addition, the SMO’s search strategies can be hybridized with other metaheuristic algorithms to generate better candidate continues solutions.


 ,
, 


