Abstract
Electric vehicle timeshare rentals (EVTRs) have been recognized as promising solutions to growingly severe problems of traffic congestion, air pollution, and insufficient parking spaces. This study aims to explore the factors that affect the adoption of EVTRs. To achieve the research objective, the household survey is conducted to obtain the travelers’ attitudes towards their travel. Ten latent attitudinal factors are extracted based on the technology acceptance model (TAM) and the theory of planned behavior (TPB). The multi-index and multi-cause (MIMIC) method simultaneously estimates the correlations between the attitudinal factors. Two logit models with attitudinal factors or not are constructed to estimate the quantitative relationship between various factors and EVTR adoption. The results show that the accuracy of the mixed logit model with latent attitude variables is better than the binary logit model without attitude latent variables. This indicates that attitude latent factors could be well matched with the traveler’s travel behavior and could better reflect travelers’ travel demand. Perceived comfort, perceived efficient, subjective evaluation, use preference, and use willingness significantly impact EVTR use frequency. The inconvenience in travelers, rental stations, shared vehicles, and use modes have significant negative impacts. Finally, social pressure has no significant impact. Findings provide valuable insights regarding the efficient planning of the EVTR system and allow decision-makers to develop scientific and practical measures of EVTRs.
1. Introduction
Electric vehicle timeshare rentals (EVTRs) are emerging as a quasi-public transportation mode that is more flexible than transit and less expensive than traditional ownership [1,2,3]. EVTRs refer to the user self-service car rental service, which is the main application and development mode of carsharing. Users can flexibly book pickup stations, returning stations, and rental times according to their personal travel needs, and the charges are calculated based on the length of the rental time and the mileage [4,5,6]. In recent years, EVTR has been considered one of the solutions to urban transport issues such as air pollution [7], traffic congestion [8], and parking stress [9]. Therefore, a large number of EVTR projects are widely established around the world. However, the use intensity and scale of EVTRs have been relatively low. Autolib has less than 20% of the vehicle’s daily use time and was officially deactivated in Paris on 1 July 2018 [10,11]. EVTRs have been developed in China for more than 30 years, and there were more than 1000 in China in 2018, but the market penetration of EVTRs was still less than 1% in January 2019 [12]. Exploring the reasons that influence travelers to adopt EVTRs is the key to promoting the development of EVTRs [13].
Existing research mainly focuses on three aspects: characteristics of EVTR adopters, motives for EVTR, and factors influencing EVTR adoption. (1) For the characteristics of EVTR adopters, researchers focus on categorizing which socioeconomic attributes of travelers are more willing to use shared cars, for example, typically younger in age, having a higher social status, more financial lucidity, advanced education, and being more socially forward [14,15,16]. (2) For the motives for EVTR, the main motives travelers have to choose EVTRs are cost-saving and increased convenience, because they are time-saving and freedom-expanding compared with public transport [14,17,18]. With the challenge of sustainability, environmentalism has been one important reason to join EVTRs [19,20]. Additionally, choosing EVTRs to travel can be motivated by changes in personal circumstances, such as changing residence, work, etc. [21,22]. (3) For the factors influencing EVTR adoption, the sociodemographic attributes are the focus of early, extensive, and mature studies on this aspect [23], and most studies show these factors have a significant effect on travelers’ adoption of EVTR [24]. Further, a few studies analyze the influence of psychological factors on the adoption of EVTR [25]. Environmental concern and perceptions of financial saving possibilities positively influence EVTR adoption [13,26,27].
These studies on travelers’ characteristics, motives, and sociodemographic attributes of factors influencing EVTRs have been comprehensive. However, attitudinal determinants of EVTR adoption, use, and impacts, which are also recognized as subjective variables in the travel behavior literature, are not understood very well [26]. For example, existing studies focus on the effects of environmental sustainability, willingness, and social pressures [27,28,29] but ignore other basic psychological desires, e.g., comfortability, safety, sensitivity to time, flexibility, and so on. Therefore, it is necessary to analyze the effects of attitude and psychological factors on EVTR adoption from an overall perspective.
To the best of the authors’ knowledge, there is no research on the relationship between travelers’ attitudinal latent variables and EVTR choice behavior. Travelers’ attitudes are often unobservable and cannot be directly measured. Previously, the multi-index and multi-cause (MIMIC) method was commonly used to identify the latent attitudes towards travel behaviors from a series of attitudinal statements or questions [30,31,32,33,34]. For example, Outwater et al. [33] reported that the MIMIC method provided significantly better performance for identifying the travelers’ latent attitudes from the attitudinal statements compared to the logistic regression model with factor analysis. Shiftan et al. [34] used the MIMIC method to simultaneously identify the relationships among travelers’ attitudes, travel behaviors, and socioeconomic profiles. The latent attitudinal factors in the MIMIC were further used for the transit market segmentation. Thus, the MIMIC method was considered for the EVTR choice behavior analysis in the current study.
The current research aims to address this gap in the literature by empirically investigating the characteristics of users’ social economy, travel behavior, and use attitudes. We surveyed residents of Beijing to obtain a large urban sample. The emphasis on the urban population is warranted because most EVTR services target urban customers [35,36]. Ten latent attitudinal factors are extracted based on the technology acceptance model (TAM) and the theory of planned behavior (TPB). The multi-index and multi-cause (MIMIC) method simultaneously estimates the correlations between the attitudinal factors. Two logit models with attitudinal factors or not are constructed to estimate the quantitative relationship between various factors and EVTR adoption.
2. Methodology
2.1. Overall Framework
To explore the adoption of EVTRs, the latent factors are selected based on TAM and TPB. Then, the quantitative relationship between various factors and EVTR demand is explored. The overall framework of the approach is shown in Figure 1.
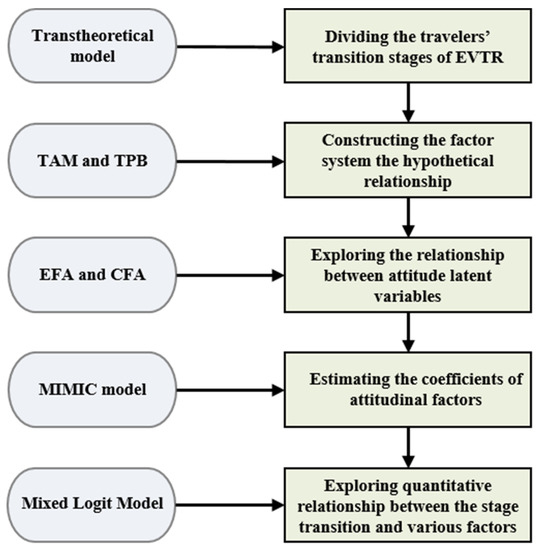
Figure 1.
Overall framework.
2.2. Factor System Construction
The technology acceptance model (TAM) and the theory of planned behavior (TPB) are both developed based on rational behavior theory. The homology of the two theories provides the possibility for integration. Chen and Chao [37] integrated the two theories to build models to study the public’s intention to change from motor vehicles to public transport. EVTR is a new way of travel, and EVTR adoption is also a purchase behavior, so it is suitable to use TAM and TPB to study travelers’ use attitudes and EVTR behavior.
- TAM: TAM is mainly used to analyze people’s acceptance of new technologies and products and their influencing factors. The theory holds that people’s use willingness determines adoption and use frequency, which is determined by people’s attitudes towards technology or system and perceived usefulness, while people’s attitudes are influenced by perceived usefulness and perceived ease of use;
- TPB: TPB is a theory explaining the relationship between attitude and behavior in social psychology. It holds that when an individual takes a positive attitude towards a particular behavior, thinks that it conforms to their subjective behavioral norms, and feels that they have mastered the skills and resources to adopt the behavior, they will have strong use willingness, and the probability of actual behavior will increase significantly.
Based on TAM and TPB, we selected ten latent factors (i.e., perceived usefulness (perceived comfort, perceived efficiency), subjective evaluation, use preference, perceived availability (station inconvenience, station inconvenience, use inconvenience, personal inconvenience), social pressure, and use willingness) to analyze travelers’ EVTR use attitude and behavior. The meaning of the attitudinal factors is shown in Table 1. Several hypotheses are constructed to estimate the relationship between attitudinal factors, as follows:
Hypothesis 1.
The higher the use preference is, the stronger the intention to use EVTRs;
Hypothesis 2.
The higher the perceived usefulness is, the stronger the intention to use EVTRs;
Hypothesis 3.
The higher the perceived availability is, the stronger the intention to use EVTRs;
Hypothesis 4.
The higher the social pressure is, the stronger the intention to use EVTRs;
Hypothesis 5.
The higher the subjective evaluation is, the stronger the intention to use EVTRs;
Hypothesis 6.
The perceived usefulness has a mediating effect between subjective evaluation and intentions;
Hypothesis 7.
The perceived availability has a mediating effect between subjective evaluation and intentions;
Hypothesis 8.
The social pressure has a mediating effect between subjective evaluation and intentions;
Hypothesis 9.
Use preference has a mediating effect between behavior attitude and intentions.

Table 1.
Description of attitudinal variables.
Table 1.
Description of attitudinal variables.
| Latent Variable | Index | Description |
|---|---|---|
| Perceived comfort | The respondents’ attitude towards the comfort of EVTRs | |
| Perceived efficiency | The respondents’ attitude toward the efficiency of EVTRs | |
| Subjective evaluation | Investigators’ overall understanding and evaluation of EVTRs | |
| Use preference | The direct preference of respondents to travel using EVTRs | |
| Station inconvenience | Investigator perceived barriers to EVTR station | |
| Station inconvenience | Investigator perceived barriers to EVTR vehicle | |
| Use inconvenience | Investigator perceived barriers to the use of EVTRs | |
| Personal inconvenience | Investigators’ personal barriers to using EVTRs | |
| Social pressure | Social pressure sensed by investigators when using EVTRs | |
| Use willingness | Investigators’ willingness and possibility to use EVTRs |
2.3. MIMIC Model
The MIMIC model aims to estimate the coefficients of latent attitudinal factors as functions of statement variables and identify the relationships between attitudinal factors. The MIMIC model used in this study includes statement variables and attitudinal factors. The attitudinal statement variables are directly measured from the survey data, inferring the latent attitudinal factors among the statement variable. The MIMIC model is used to calculate the scores of attitudinal factors for each individual, which are then used in the cluster analysis. The relationship between attitudinal factors in the MIMIC model estimates provides essential information in understanding the travelers’ considerations on the choice of EVTR for travel.
2.4. Mixed Logit Model
The utility of the first mode of travel for travelers is as follows:
where is the vector of observable individual attributes of travelers; is the vector of attributes of travel modes, including travel time and expenses; is the vector of unobservable latent variables (i.e., perceived usefulness, perceived ease of use, attitudes, social pressures, perceived behavior control, and use willingness for EVTR); are unknown parameter vectors to be estimated; and is a random term.
The structural equation that reflects the relationship between latent variables is defined as:
where is the latent variable vector; is the exogenous variable vector that affects the latent variable ; is the unknown parameter matrix to be estimated; and is the measurement error.
where y is the observable indicator vector of the latent variable ; Λ is the unknown parameter matrix to be estimated; and v is the error term.
Equations (1) and (2) constitute a discrete selection model, while Equations (3) and (4) constitute a MIMIC model. Therefore, Equation (3) can also be written as follows:
where is an individual’s latent attitudinal variables such as perceived usefulness, perceived availability, and subjective evaluations; and is an estimated parameter. It also shows that the potential preference of travelers for car sharing is influenced by the social demographic attributes such as gender, age, and monthly income of travelers.
For the estimation of model parameters, the continuous two-stage estimation method can be used, which is mainly divided into two steps: Step 1, using the maximum likelihood method to estimate the latent variable model, that is, estimating the parameters of the MIMIC model; and Step 2, calculating the adaptation value of the latent variable according to the estimated value of the MIMIC model parameters, and substituting it as an exogenous variable into the discrete selection model for parameter calibration. This paper completes the above parameter estimation steps using AMOS v.24.0 and SPSS v.22.0 software. The conceptual diagram of the model is shown in Figure 2.
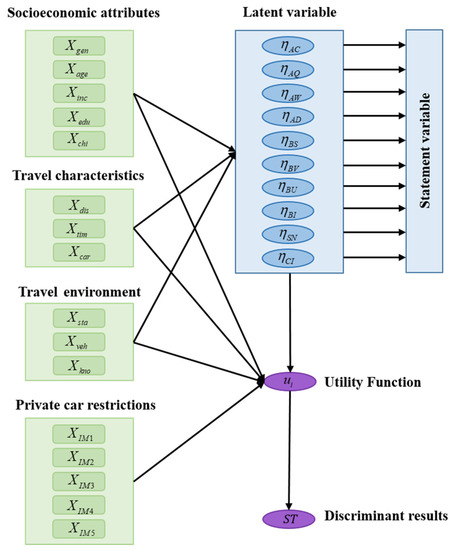
Figure 2.
Illustration of the proposed mixed logit model.
3. Data
The data resource was obtained through the household survey that was conducted in multiple traffic analysis zones in the metropolitan district, Beijing, 2021. Considering the complexity of the questionnaire, several confusing questions were redesigned based on the feedback from a pilot survey, including (1) the socioeconomic characteristics; (2) the daily trips information, i.e., trip length and mode choice; and (3) the attitudinal questions towards travels and EVTR. The attitude survey mainly refers to the mature research in TAM and TPB. A total of 868 questionnaires were distributed randomly, and 759 questionnaires were completed. A total of 619 valid questionnaires were obtained after excluding the questionnaires lacking key information. The Likert five-scale method is adopted: “1” means a strong disagreement, while “5” indicates a strong agreement. The summary statistics of latent variables and socioeconomic characteristics are shown in Table 2 and Table 3, respectively.
Table 2.
Statistics of latent variables of respondents.
Table 3.
Statistics of socioeconomic characteristics of respondents.
To ensure the stability and reliability of the questionnaires and the collected data, Cronbach’s Alpha and Kaiser–Meyer–Olkin (KMO) sample measurements and Bartlett ball test were used to analyze the reliability and validity of the collected data before data analysis. The reliability of Cronbach’s Alpha in each dimension of the questionnaire is greater than 0.7, the factor load is greater than 0.8, the KMO is greater than 0.5, and the Bartlett is less than 0.05, which shows the reliability and validity of the questionnaire are ideal.
4. Results
4.1. Estimating Correlations between Variables Using MIMIC
4.1.1. The Correlation between Attitude Latent Variables
The EFA is first conducted to explore the proper groups of latent factors that explain all the original statement variables. The Cattell’s Scree Plot method is used to decide the number of factors. Based on the preliminary EFA, the CFA extracted 10 latent attitudinal factors from 32 statement variables using AMOS 24.0. The CFA goodness of fit index (GFI) is 0.953, indicating that the given model can reproduce 95.3% of the co-variation in the data. The CFA shows the ten-dimension latent factor structure is appropriate for the data of this study.
Based on prior information on the correlation structures from the CFA in this study and several studies [38,39,40], the model structure shown in Figure 3 is specified in the MIMIC model. The measurement model and structural model are simultaneously estimated. Figure 3 also shows the model estimates the correlations between the latent factors.
The goodness of fit index (GFI) of the MIMIC model is 0.953, the root mean square residual (RMR) is 0.028, and the root mean square error of approximation (RMSEA) is 0.012, indicating that these measures meet the acceptable criteria. The incremental fit index (IFI) = 0.925 and comparative fit index (CFI) = 0.917 exceed the ideal value of 0.9. The adjusted goodness of fit index (AGFI) = 0.944 is above the recommended value of 0.8. These indices indicate that the final MIMIC model is a good fit.
As shown in Figure 3, several attitudinal factors are significantly related to travelers’ use willingness towards EVTRs. Travel obstacles (including station inconvenience, station inconvenience, use inconvenience, and personal inconvenience) have a negative impact on the perception towards EVTRs. The other attitude latent variables have a positive impact on the perception towards EVTRs, as follows:
- The coefficient between use preference and use willingness in the MIMIC model is 0.745, indicating that use preference is positively related to use willingness, which proves that Hypothesis 1 is true;
- The coefficient between perceived usefulness and use willingness in the MIMIC model is positive (perceived comfort 0.512 and perceived efficiency 0.593), indicating that perceived usefulness is positively related to use willingness, which proves that Hypothesis 2 is true;
- The coefficient between travel obstacles and use willingness in the MIMIC model is negative (station inconvenience −0.393, station inconvenience −0.405, use inconvenience −0.501, and personal inconvenience −0.439), indicating that perceived availability is positively related to use willingness, which proves that Hypothesis 3 is true;
- The coefficient between subject norm and use willingness in the MIMIC model is 0.121, indicating that subject norm is positively related to use willingness, which proves that Hypothesis 4 is true;
- The coefficient between subjective evaluation and use willingness in the MIMIC model is 0.878, indicating that subjective evaluation is positively related to use willingness, which proves that Hypothesis 5 is true.
The travelers’ perception towards EVTRs has a significant positive impact on their willingness to use EVTRs. Other attitudinal factors are also related to this willingness. To further study the relationship between latent variables, we examined the mediating effect among potential variables in three steps through the mediating effect test method summarized by Lin W. [41,42], and the direct and indirect effects of attitudinal factors on the willingness to use EVTRs are summarized in Table 4.
Table 4.
Direct and indirect effects between latent attitudinal factors.

Figure 3.
Path relationship between latent attitudinal variables in the MIMIC model.
Figure 3.
Path relationship between latent attitudinal variables in the MIMIC model.

According to the system distribution and fitting results of the factors shown in Figure 3 and Table 4, it can be concluded that the latent variables have the following relationship:
- The coefficient of indirect effect between perceived comfort and use willingness is 0.078, indicating that perceived comfort has a positive impact on use willingness through subjective evaluation, which proves that Hypothesis 6 is true;
- The coefficient of indirect effect between perceived efficiency and use willingness is 0.203, indicating that perceived efficiency has a positive impact on use willingness through subjective evaluation, which proves that Hypothesis 7 is true;
- The coefficient of indirect effect between social pressure and use willingness is 0.127, indicating that social pressure positively impacts use willingness through subjective evaluation, which proves that Hypothesis 8 is true;
- The coefficient of indirect effect between use preference and use willingness is 0.116, indicating that use preference positively impacts use willingness through subjective evaluation, which proves that Hypothesis 8 is true.
4.1.2. The Correlation between Latent Attitude Variables and Exogenous Variables
In order to analyze the impact of latent attitudinal variables and exogenous variables, such as social demographic attributes, travel characteristics, and travel environment, on EVTR use demand in the next section, this section makes a detailed analysis of the quantitative relationship between exogenous variables and latent variables, and latent variables and their observed variables by constructing a MIMIC model. Since this section studies the direct relationship between latent variables and exogenous variables, and latent variables and their observed variables, the interaction between the latent variables of each attitude is not considered. After adjusting the structure between variables repeatedly, and screening and removing the correlations that are not significant, the correlation among variables is finally obtained, as shown in Figure 4.
The relationships between exogenous and latent variables were obtained from Figure 4, as shown in Table 5. All the coefficients in the MIMIC model are significant at a 95% confidence level. Gender (Xgen) and age (Xage) negatively impact personal obstacles, and education positively impacts personal obstacles, which indicates that all kinds of people have some inconvenience to the use of EVTRs. Income (Xinc) positively impacts travelers’ use preference, which might be related to the personalized travel requirements of high-income people. Travelers with children (Xchi) are more concerned with the comfort of travel. Travelers with private cars (Xcar) tend to use private cars and are less interested in EVTRs. The station density (Xsta) and fleet size (Xveh) indicate the service intensity of EVTRs. The higher the service intensity is, the higher the service level perceived by the travelers. Therefore, expanding the infrastructure construction of EVTRs is fundamental to promote the development of EVTR use demand. The level of understanding of EVTRs (Xkno) has a negative impact on use obstacles and a positive effect on the social pressure, which indicates that improving the promotion might increase travelers’ acceptance of EVTRs. All car restriction measures (XIM1-XIM5) positively impact use willingness related to the competitive relationship between cars and EVTRs.
4.1.3. The Correlation between Latent Attitude Variables and Statement Variables
The relationships between latent variables and statement variables were obtained from Figure 3. Ten attitude factors with the factor loading, standard error, and t-statistics from the CFA are shown in Table 6. Each latent factor is a linear combination of several statement variables. For example, factor 1 includes three statement variables (AC1–AC3) related to the respondents’ perceived comfort. Thus, factor 1 reflects the need for comfort. Other attitudinal factors can be interpreted similarly: factor 2 reflects the respondents’ convenient attitude (AQ1–AQ3), factor 3 is related to subjective evaluation (AW1–AW3), factor 4 is identified as the use preference (AD1–AD3), factor 5 is the station inconvenience (BS1–BS3), factor 6 reflects the station inconvenience (BV1–BV3), factor 7 is related to the use inconvenience (BU1–BU3), factor 8 reflects the respondents’ personal inconvenience (BI1–BI4), factor 9 pertains to the respondents’ social pressure (SN1–SN4), and factor 8 is a measurement of the travelers’ use willingness (CI1–CI3).

Figure 4.
The relationship between exogenous variables and latent variables.
Figure 4.
The relationship between exogenous variables and latent variables.

Table 5.
The relationship between exogenous variables and latent variables.
Table 5.
The relationship between exogenous variables and latent variables.
| −0.165 (2.122) | ||||||||||
| −0.127 (5.715) | ||||||||||
| 0.132 (3.072) | ||||||||||
| 0.145 (4.323) | ||||||||||
| 0.246 (2.721) | ||||||||||
| −0.313 (8.072) | ||||||||||
| 0.352 (4.602) | 0.242 (6.045) | 0.293 (2.883) | −0.176 (11.773) | |||||||
| 0.323 (6.101) | 0.112 (2.262) | 0.431 (12.292) | −0.145 (3.812) | |||||||
| −0.115 (5.429) | 0.213 (3.624) | |||||||||
| 0.244 (2.722) | ||||||||||
| 0.123 (4.116) | ||||||||||
| 0.122 (3.982) | ||||||||||
| 0.112 (5.752) | ||||||||||
| 0.157 (2.385) |
Table 6.
Latent attitudinal factors in the CFA.
Table 6.
Latent attitudinal factors in the CFA.
| Latent Factor | Statement Variable | Estimate | S.E. | C.R. | P |
|---|---|---|---|---|---|
| AC1 | 1 | ||||
| AC2 | 1.017 | 0.140 | 9.597 | 0.009 | |
| AC3 | 2.102 | 0.275 | 6.642 | 0.032 | |
| AQ1 | 1 | ||||
| AQ2 | 0.778 | 0.109 | 10.767 | 0.006 | |
| AQ3 | 0.796 | 0.096 | 7.765 | 0.006 | |
| AW1 | 1 | ||||
| AW2 | 0.246 | 0.029 | 5.978 | 0.021 | |
| AW3 | 0.428 | 0.045 | 9.005 | 0.012 | |
| AD1 | 1 | ||||
| AD2 | 0.658 | 0.084 | 5.610 | 0.009 | |
| AD3 | 0.847 | 0.091 | 4.668 | 0.008 | |
| BS1 | 1 | ||||
| BS2 | 0.340 | 0.041 | 10.433 | 0.031 | |
| BS3 | 0.284 | 0.042 | 6.422 | 0.155 | |
| BV1 | 1 | ||||
| BV2 | 0.677 | 0.079 | 2.946 | 0.033 | |
| BV3 | 0.755 | 0.108 | 4.927 | 0.041 | |
| BU1 | 1 | ||||
| BU2 | 4.373 | 0.468 | 5.888 | 0.038 | |
| BU3 | 0.845 | 0.109 | 7.339 | 0.019 | |
| BI1 | 1 | ||||
| BI2 | 0.722 | 0.086 | 8.173 | 0.030 | |
| BI3 | 0.622 | 0.064 | 5.119 | 0.034 | |
| BI4 | 0.595 | 0.068 | 7.068 | 0.039 | |
| SN1 | 1 | ||||
| SN2 | 0.429 | 0.053 | 10.156 | 0.045 | |
| SN3 | 0.351 | 0.046 | 3.151 | 0.032 | |
| SN4 | 0.220 | 0.027 | 6.027 | 0.012 | |
| CI1 | 1 | ||||
| CI2 | 1.566 | 0.230 | 8.830 | 0.005 | |
| CI3 | 1.441 | 0.209 | 7.877 | 0.004 |
Thus, according to Table 6, the adaptation value of each latent variable is obtained by the following Equations (6)–(15).
4.2. EVTR Travel Choice Prediction Using Two Mixed Logit Models
In order to explore the influencing factors of EVTR adoption and analyze the explanatory ability of exogenous variables and potential variables to shared car travel demand, the binary logit model without attitudinal variables and the mixed logit model with attitudinal variables are constructed, respectively.
4.2.1. EVTR Travel Selection Model without Latent Variables
The selection model without latent variables is constructed using the binary logit model, which takes the social population attributes, travel characteristics, travel environment, and car restriction measures as independent variables, and whether travelers choose EVTR travel as an independent variable. The SPSS is used to calibrate the model. After multiple modeling and screening to remove the independent variables that have no significant influence on the dependent variable, the parameter estimation and test results of the ordered logical model are finally established in Table 7. The number of samples was 619. The McFadden R2 = 0.273 > 0.2(41) shows that the precision of the ordered logic model is acceptable.
Gender significantly impacts the choice of shared electric vehicles (p = 0.038 < 0.05). The estimated value of the parameters is 0.052, and Or = exp(0.052) = 1.053 > 1, indicating that women are more willing to choose EVTRs to travel, which may be related to women’s higher personalization demand for EVTR travel. The age coefficient is −0.019, Or = exp(−0.019) = 0.981, indicating that the probability of choosing EVTRs to travel will decrease for each level of age increase in the decision-making process, which may be related to the fixed use habits of older passengers. Regarding education and income, the regression coefficients were 0.081 and 0.029, respectively. This shows that the higher the education level and income, the higher the probability of choosing EVTR to travel, which may be related to their higher acceptance of new things and higher demand for personalized services.
Whether the respondent owns a private car has the most significant impact on the use of EVTR. Its coefficient is −0.468, which indicates that respondents with private cars are more reluctant to use EVTRs. The number of vehicles available in the station and the transfer time between the origin/destination and rental station indicate the service strength of EVTRs. Increasing the number of vehicles available will help to improve travelers’ willingness to use EVTRs. Additionally, the longer the transfer time is, the weaker the willingness to use is. The level of understanding (EVTRs) is positively correlated with the demand for EVTRs, which indicates that travelers’ lack of understanding of EVTRs is an important factor limiting the development of EVTR demand. All car restriction measures are positively related to the use of EVTRs, which is related to the competitive relationship between EVTRs and cars (such as taxis, private cars, etc.).
Table 7.
Parameter fitting results of binary logit model without attitudinal variables.
Table 7.
Parameter fitting results of binary logit model without attitudinal variables.
| Variable | B | S.E. | Sig. | Exp (B) |
|---|---|---|---|---|
| Constant | −1.600 | 1.052 | 0.013 | 0.202 |
| 0.052 | 0.180 | 0.038 | 1.053 | |
| −0.019 | 0.087 | 0.043 | 0.981 | |
| 0.029 | 0.100 | 0.027 | 1.029 | |
| 0.081 | 0.110 | 0.046 | 1.084 | |
| 0.154 | 0.199 | 0.064 | 1.166 | |
| −0.486 | 0.186 | 0.030 | 0.615 | |
| −0.121 | 0.103 | 0.023 | 0.886 | |
| 0.012 | 0.081 | 0.028 | 1.012 | |
| 0.314 | 0.084 | 0.018 | 1.369 | |
| 0.090 | 0.110 | 0.041 | 1.094 | |
| 0.075 | 0.110 | 0.044 | 1.078 | |
| 0.169 | 0.109 | 0.012 | 1.184 | |
| 0.082 | 0.111 | 0.046 | 1.085 | |
| 0.152 | 0.140 | 0.017 | 1.164 | |
| n | 619 | |||
| Log likelihood | 742.995 | |||
| McFadden’s R2 | 0.273 | |||
4.2.2. EVTR Travel Selection Model with Latent Variables
The selection model with latent variables is constructed using the mixed logit model, which takes the social population attributes, travel characteristics, travel environment, and attitude latent variable as independent variables, and whether travelers choose EVTR travel as an independent variable. The SPSS is used to calibrate the model. After multiple modeling and screening to remove the independent variables that have no significant influence on the dependent variable, the parameter estimation and test results of the ordered logical model are finally established in Table 8. The number of samples was 619. The McFadden R2 = 0.341 > 0.2 [43], which shows that the precision of the mixed logit model is acceptable.
Table 8.
Parameter fitting results of logit model without latent attitude variables.
For the observed variables, age, gender, education level, individual income, marriage, and child have no significant impact on EVTR adoption. Further, the automobile available, EVTR station density, fleet size, and familiarity significantly impact EVTR adoption. These findings suggest that travel characteristics influence travelers’ adoption of EVTRs more than other socioeconomic attributes. From the calibration results of model parameters containing latent variables, it can be found that not all latent variables have significant effects. Perceived comfort (0.387), perceived efficiency (0.211), subjective evaluation (0.165), use preference (0.174), and use willingness (0.023) have significant positive impacts on EVTR use demand. Station inconvenience (−0.005), station inconvenience (−0.121), use inconvenience (−0.277), and personal inconvenience (−0.263) have significant negative impacts. Social pressure (Sig. = 0.086 > 0.5) has no significant impact. Therefore, in addition to improving the coverage of rental stations and fleet size, increasing the publicity and promotion of EVTRs, enhancing the perception level of travelers on the perceived usefulness and availability of EVTRs, and reducing the perception level of travelers on travel inconvenience are essential contents to promote the development of shared car demand.
Lastly, we compare the results of the respondents’ choice obtained from the survey data and the logit model fitting and prediction. The goodness of fit of the binary logit model without latent attitude variables and mixed logit model with attitude latent variables is 0.237 and 0.341, respectively. In practice, it is considered that the accuracy of the model is higher when the value of R2 is above 0.2. Thus, this model could meet the reliability requirements of model fitting, and the analysis results of the above factors could be acceptable. Additionally, compared with the binary logit model, the goodness of fit (0.341 > 0.273) of the mixed logit model with attitude latent variables is better. This finding indicates that attitude latent factors could be well matched with the travelers’ travel behavior and could better reflect travelers’ travel demand.
5. Conclusions
This study explored the factors that affect travelers’ EVTR use demand. Individuals’ attitudes toward electric vehicle timeshare rental (EVTR) travel were extracted from the attitudinal questions in the household survey conducted in Beijing, China. A MIMIC model was used to identify the latent attitudinal factors and capture their interrelationships. Two logit models with attitudinal factors or not were constructed to estimate the quantitative relationship between various factors and EVTR adoption.
The results show that the accuracy of the mixed logit model with latent attitude variables is better than that of the binary logit model without attitude latent variables. This indicates that attitude latent factors could be well matched with the adoption behavior and could better reflect travelers’ travel demand. Perceived comfort, perceived efficiency, subjective evaluation, use preference, and use willingness significantly impact EVTR use demand. Station, vehicle, use, and personal inconvenience have significant negative impacts. Social pressure has no significant impact.
This study aimed to test whether attitudinal factors have a significant impact on EVTR adoption. The extracted attitudinal factors may not be complete. In the future, more attitude factors (e.g., environmental awareness) can be selected to explore their impact on the adoption and use frequency of EVTRs. Additionally, this study roughly divides travelers into EVTR users and non-users. However, public acceptance of an emerging concept requires a complex process that usually includes multiple cognitive stages, such as pre-awareness, awareness, preparation, action, and maintenance. Future research can explore the influence of attitudinal factors on different cognitive stages and stage transition behaviors of EVTR.
Due to the different cultures and environments in travel activities between China and other countries, travelers’ choice behavior regarding EVTR explored in this study may not be directly transferrable to other parts of the world. Other parts of the world should explore attitudes and other factors that affect EVTR adoption in combination with local culture, adaptability of electric vehicles, charging facilities, rental and sharing approaches, etc. Then, policies can be proposed according to the particular characteristics of travel environments and traffic facilities. Such studies can provide grounds for communities to strive for better carsharing facilities, amenities, and support.
Author Contributions
Conceptualization, S.W.; methodology, S.W.; software, S.W.; validation, S.W., Q.L. and Z.Z.; formal analysis, S.W. and Q.L.; investigation, S.W.; resources, S.W. and Q.L.; data curation, S.W.; writing—original draft preparation, S.W.; writing—review and editing, Q.L., Z.Z. and C.N.; visualization, Q.L. and Z.Z.; supervision, Z.Z.; project administration, Z.Z.; funding acquisition, Z.Z. All authors have read and agreed to the published version of the manuscript.
Funding
This work was supported by the National Natural Science Foundation of China (Project #: 71871057) and the Postgraduate Research and Practice Innovation Program of Jiangsu Province (No. KYCX21_0131).
Institutional Review Board Statement
Not applicable.
Informed Consent Statement
Not applicable.
Data Availability Statement
Not applicable.
Conflicts of Interest
The authors declare no conflict of interest.
References
- Long, Y.; Zhang, Y.; Sun, H.; Hou, X.; Xiao, J. A Developed Vehicle Terminal of Time-Sharing Rental Electric Vehicle Using Acoustic Communication Technology. Appl. Sci. 2019, 9, 5408. [Google Scholar] [CrossRef]
- Kajanova, M.; Bracinik, P. The Vehicle-to-Grid Concept with Respect to the Preferences of Electric Vehicle Drivers and Charging Station Operators. Appl. Sci. 2022, 12, 5476. [Google Scholar] [CrossRef]
- Alfian, G.; Rhee, J.; Ijaz, M.F.; Syafrudin, M.; Fitriyani, N.L. Performance Analysis of a Forecasting Relocation Model for One-Way Carsharing. Appl. Sci. 2017, 7, 598. [Google Scholar] [CrossRef]
- Yang, J.; Lin, Y.; Wu, F.; Chen, L. Subsidy and Pricing Model of Electric Vehicle Sharing Based on Two-Stage Stackelberg Game—A Case Study in China. Appl. Sci. 2019, 9, 1631. [Google Scholar] [CrossRef]
- Turoń, K.; Kubik, A. Economic Aspects of Driving Various Types of Vehicles in Intelligent Urban Transport Systems, Including Car-Sharing Services and Autonomous Vehicles. Appl. Sci. 2020, 10, 5580. [Google Scholar] [CrossRef]
- Changaival, B.; Lavangnananda, K.; Danoy, G.; Kliazovich, D.; Guinand, F.; Brust, M.; Musial, J.; Bouvry, P. Optimization of Carsharing Fleet Placement in Round-Trip Carsharing Service. Appl. Sci. 2021, 11, 11393. [Google Scholar] [CrossRef]
- Sun, L.; Wang, S.; Liu, S.; Yao, L.; Luo, W.; Shukla, A. A completive research on the feasibility and adaptation of shared transportation in mega-cities—A case study in Beijing. Appl. Energy 2018, 230, 1014–1033. [Google Scholar] [CrossRef]
- Galatoulas, N.-F.; Genikomsakis, K.N.; Ioakimidis, C.S. Analysis of potential demand and costs for the business development of an electric vehicle sharing service. Sustain. Cities Soc. 2018, 42, 148–161. [Google Scholar] [CrossRef]
- Bobeth, S.; Kastner, I. Buying an electric car: A rational choice or a norm-directed behavior? Transp. Res. Part F Traffic Psychol. Behav. 2016, 73, 236–258. [Google Scholar] [CrossRef]
- Autolib. Autolib Service Shut Down. Available online: https://www.autolib.eu (accessed on 1 July 2018).
- SOHU. Is Autolib Going to the End? Available online: www.sohu.com/a/234831160_236796 (accessed on 9 June 2018).
- Aurora Big Data. Research Report on Carsharing in January 2019. Available online: http://www.199it.com/archives/828369 (accessed on 1 July 2018).
- Taru, J.; Marilyn, J.; Geoffrey, R. Exploring the process of travel behaviour change and mobility trajectories associated with car share adoption. Travel Behav. Soc. 2020, 18, 117–131. [Google Scholar]
- Efthymiou, D.; Antoniou, C.; Waddell, P. Factors affecting the adoption of vehicle sharing systems by young drivers. Transp. Policy 2013, 29, 64–73. [Google Scholar] [CrossRef]
- Millard-Ball, A.; Murray, G.; TerSchure, J.; Fox, C.; Burkhardt, J. Car-Sharing: Where and How It Succeeds. Transit Cooperative Research Program (TCRP) Report 108; Transportation Research Board: Washington, DC, USA, 2005. [Google Scholar]
- Shaheen, S. Dynamics in Behavioral Adaptation to a Transportation Innovation: A Case Study of Carlink—A Smart Carsharing System. Ph.D. Thesis, Institute of Transportation Studies, University of California, Davis, CA, USA, 2004. [Google Scholar]
- Arena, M.; Azzone, G.; Colorni, A.; Conte, A.; Luè, A.; Nocerino, R. Service design in electric vehicle sharing: Evidence from Italy. IET Intell. Transp. Syst. 2015, 9, 145–155. [Google Scholar] [CrossRef]
- Boyacı, B.; Zografos, K.G.; Geroliminis, N. An optimization framework for the development of efficient one-way car-sharing systems. Eur. J. Oper. Res. 2015, 240, 718–733. [Google Scholar] [CrossRef]
- Luè, A.; Colorni, A.; Nocerino, R.; Paruscio, V. Green Move: An Innovative Electric Vehicle-Sharing System. Procedia—Soc. Behav. Sci. 2012, 48, 2978–2987. [Google Scholar] [CrossRef]
- Biondi, E.; Boldrini, C.; Bruno, R. Optimal charging of electric vehicle fleets for a carsharing system with power sharing. In Proceedings of the 2016 IEEE International Energy Conference (ENERGYCON), Leuven, Belgium, 4–8 April 2016. [Google Scholar]
- Wang, H.; Li, Z.; Zhu, X.; Liu, Z. A Full Service Model for Vehicle Scheduling in One-Way Electric Vehicle Car-Sharing Systems. In International Conference on Internet of Vehicles; Springer: Cham, Switzerland, 2015; pp. 25–36. [Google Scholar] [CrossRef]
- Wang, N.; Yan, R. Research on Consumers’ Use Willingness and Opinions of Electric Vehicle Sharing: An Empirical Study in Shanghai. Sustainability 2015, 8, 7. [Google Scholar] [CrossRef]
- Heilig, M.; Mallig, N.; Schröder, O.; Kagerbauer, M.; Vortisch, P. Implementation of free-floating and station-based carsharing in an agent-based travel demand model. Travel Behav. Soc. 2017, 12, 151–158. [Google Scholar] [CrossRef]
- Habib, K.M.N.; Morency, C.; Islam, M.T.; Grasset, V. Modelling users’ behaviour of a carsharing program: Application of a joint hazard and zero inflated dynamic ordered probability model. Transp. Res. Part A Policy Pract. 2012, 46, 241–254. [Google Scholar] [CrossRef]
- Paundra, J.; Rook, L.; van Dalen, J.; Ketter, W. Preferences for carsharing services: Effects of instrumental attributes and psychological ownership. J. Environ. Psychol. 2017, 53, 121–130. [Google Scholar] [CrossRef]
- Mishra, G.S. Estimating the Travel Behaviour Effects of Technological Innovations from Cross Sectional Observed Data: Applications to Carsharing and Telecommuting; University of California: Davis, CA, USA, 2017. [Google Scholar]
- Wu, C.; Le Vine, S.; Sivakumar, A.; Polak, J. Traveller preferences for free-floating carsharing vehicle allocation mechanisms. Transp. Res. Part C Emerg. Technol. 2019, 102, 1–19. [Google Scholar] [CrossRef]
- Li, Z.; Wang, W.; Yang, C.; Ragland, D.R. Bicycle commuting market analysis using attitudinal market segmentation approach. Transp. Res. Part A Policy Pract. 2013, 47, 56–68. [Google Scholar] [CrossRef]
- Xiong, Q.; Zhang, Q.; Yang, Y.; Li, Z. Perceived barriers faced by Chinese adult children in social support of their elderly parents’ outbound travels. Tour. Manag. Perspect. 2021, 38, 100827. [Google Scholar] [CrossRef]
- Golob, T.F.; Hensher, D.A. Greenhouse gas emissions and australian commuters’ attitudes and behavior concerning abatement policies and personal involvement. Transp. Res. Part D Transp. Environ. 1998, 3, 1–18. [Google Scholar] [CrossRef]
- Gärling, T.; Fujii, S.; Boe, O. Empirical tests of a model of determinants of script-based driving choice. Transp. Research. Part F Traffic Psychol. Behav. 2001, 4, 89–102. [Google Scholar] [CrossRef]
- Golob, T.F. Structural equation modeling for travel behavior research. Transp. Res. Part B (Methodol.) 2003, 37, 1–25. [Google Scholar] [CrossRef]
- Outwater, M.L.; Castleberry, S.; Shiftan, Y.; Ben-Akiva, M.; Zhou, Y.S.; Kuppam, A. Attitudinal market segmentation approach to mode choice and ridership forecasting—Structural equation modeling. Transp. Res. Rec. 1854, 2003, 32–42. [Google Scholar] [CrossRef]
- Shiftan, Y.; Outwater, M.L.; Zhou, Y. Transit market research using structural equation modeling and attitudinal market segmentation. Transp. Policy 2008, 15, 186–195. [Google Scholar] [CrossRef]
- Bert, J.; Collie, B.; Gerrits, M.; Xu, G. What’s Ahead for Car Sharing?: The New Mobility and Its Impact on Vehicle Sales. 2016. Available online: https://www.bcg.com/publications/2016/automotive-whats-ahead-car-sharing-new-mobility-its-impact-vehicle-sales (accessed on 23 February 2016).
- Esfandabadi, Z.S.; Diana, M.; Zanetti, M.C. Carsharing services in sustainable urban transport: An inclusive science map of the field. J. Clean. Prod. 2022, 357, 131981. [Google Scholar] [CrossRef]
- Chen, C.F.; Chao, W.H. Habitual or reasoned? Using the theory of planned behavior, technology acceptance model, and habit to examine switching intentions toward public transit. Transp. Res. Part F Traffic Psychol. Behav. 2011, 14, 128–137. [Google Scholar] [CrossRef]
- Anable, J. ‘Complacent car addicts’ or ‘aspiring environmentalists’? Identifying travel behaviour segments using attitude theory. Transp. Policy 2005, 12, 65–78. [Google Scholar] [CrossRef]
- Dill, J.; Voros, K. Factors Affecting Bicycling Demand: Initial Survey Findings from the Portland, Oregon, Region. Transp. Res. Rec. J. Transp. Res. Board 2007, 2031, 9–17. [Google Scholar] [CrossRef]
- Marsh, H.W.; Muthén, B.; Asparouhov, T.; Lüdtke, O.; Robitzsch, A.; Morin, A.J.; Trautwein, U. Exploratory structural equation modeling, integrating CFA and EFA: Application to students’ evaluations of university teaching. Struct. Equ. Model. Multidiscip. J. 2009, 16, 439–476. [Google Scholar] [CrossRef]
- Wen, Z.; Marsh, H.W.; Hau, K.T. Structural Equation Models of Latent Interactions: An Appropriate Standardized Solution and Its Scale-Free Properties. Struct. Equ. Model. A Multidiscip. J. 2010, 17, 1–22. [Google Scholar] [CrossRef]
- Wen, Z.; Fan, X. Monotonicity of effect sizes: Questioning kappa-squared as mediation effect size measure. Psychol. Methods 2015, 20, 193–203. [Google Scholar] [CrossRef]
- Nkurunziza, A.; Zuidgeest, M.; Brussel, M.; Van Maarseveen, M. Examining the potential for modal change: Motivators and barriers for bicycle commuting in Dar-es-Salaam. Transp. Policy 2012, 24, 249–259. [Google Scholar] [CrossRef]


Disclaimer/Publisher’s Note: The statements, opinions and data contained in all publications are solely those of the individual author(s) and contributor(s) and not of MDPI and/or the editor(s). MDPI and/or the editor(s) disclaim responsibility for any injury to people or property resulting from any ideas, methods, instructions or products referred to in the content. |
© 2022 by the authors. Licensee MDPI, Basel, Switzerland. This article is an open access article distributed under the terms and conditions of the Creative Commons Attribution (CC BY) license (https://creativecommons.org/licenses/by/4.0/).