Abstract
The regenerator is one of the most important elements of a thermal machine operating in an alternating flow regime. The present study constituted an experiment on the dynamic characterization of different metallic regenerators crossed by alternating air flow. During an experiment, gas temperature, velocity, and pressure were measured at both ends of the regenerator. The acquisition frequency was set at 1 kHz for each temperature, pressure, and velocity signal. This enabled us to fully characterize an oscillating flow cycle. Experiments were performed for different regenerators (structures and porosities), frequencies, temperature gradients, and displaced air volumes. The experimental results showed that the density ratio is significant at high frequencies for all structures. The friction coefficient is determined based on a classical correlation at the time of maximum velocity. The friction factorseems to decrease with the kinetic Reynolds numberfor a 30% porosity regenerator. For the other tested regenerators (35% and 40% porosity), we observed that it is almost constant with a little dispersion. To minimize the dispersion effects, another definition was proposed to calculate the friction factor at the time of maximum pressure drop. The results showed that for all regenerators a single clear trend is the function of the kinetic Reynolds number. A significant phase shift was observed between the velocity and pressure drop. It increases with the increasing kinetic Reynolds number. It was found that the phase shift only depends on frequency. Finally, a correlation equation was proposed to predict the phase shift of different regenerator structures. It was found that the effect of the kinetic Reynolds numberon the phase shift is more dominant than that of the hydraulic diameter to length ratio .
1. Introduction
The alternating or oscillating flows within a regenerator are of scientific and industrial interest. They are frequently found in many industrial applications, such as Stirling machines, magneto-caloric coolers with active regeneration, heat exchangers, compressors, and internal combustion engines. These machines operate according to thermodynamic cycles requiring the use of an alternating fluid flow. The characterization of regenerators operating in an alternating regime constitutes an essential need for the thermal or thermo-mechanical modeling of these systems. Experimental and theoretical works are being devoted to the thermo-fluidics of alternating flows within a regenerator. The first regenerator was developed in 1816 by Robert Stirling for the improvement of his hot air engine. The regenerator or economizer of a Stirling machine increases the efficiency of the thermodynamic cycle and it is located between the hot and cold heat exchangers. It often consists of either a porous material or an assembly of small grids of fine wire cloth, plates, or balls, through which the working gas flows in an alternating fashion. Various authors, such as Tong and London [1], Blass [2], and Miyabe et al. [3], have proposed correlations for the pressure drop (or the Darcy friction factor) in a regenerator based on unidirectional steady flow experiments.
In previous works, the Darcy friction factorhas been calculated using the following equation (Tanaka et al. [4]):
whereis the pressure drop, is the hydraulic diameter, is the fluid density, is the length of the regenerator matrix, and is the velocity of the fluid flow.
Previous experimental and analytical investigations showed that the steady flow condition is not exactly the same as that of the oscillating flow. Several authors (Taylor and Aghili [5], Tanaka et al. [4], Gedeon and Wood [6], and Pamuk and Özdemir [7]) conducted experiments that reveal that pressure drops across the regenerator are different under oscillating flow conditions than under steady flow at the same Reynolds number.
Zhao and Cheng [8] investigated the oscillatory pressure drop characteristics in packed columns (composed of three different sizes of woven screen) subjected to a periodically reversing flow of air. They found that the cycle-averaged pressure drop of the oscillatory flow in a packed column is four to six times higher than that of a steady flow.
In an experimental work, Xia et al. [9] presented two test rigs that could generate steady and oscillating flows through a woven screen regenerator under similar conditions. They measured velocity at both ends of the regenerator. This is different from theoretical velocity based on piston velocity, which should begin at a 0° crank angle of the piston (bottom dead center) and end at 180° (top dead center). It was also shown that the effect of gas compression cannot be ignored for steady and oscillating flows through a regenerator when mass flow increases. They stated that the theoretical velocity could be used only when the effect of gas compression is negligible. By studying the pressure drop for a smooth tube with tri-orifice baffle inserts under steady and oscillatory flow conditions, Muñoz-Cámara et al. [10] showed that the pressure drop coefficient is identical to the steady flow one at a very low kinetic Reynolds number. The kinetic Reynolds numberis a dimensionless expression for the oscillating inertial forces in relation to viscous forces (Simon and Seume [11]):
whereis the density, is the angular frequency, andis the dynamic viscosity. The kinetic Reynolds number is also called the oscillating Reynolds number.
They also observed that the pressure drop signal under oscillatory flow is not a purely sinusoidal wave.
Richardson and Tyler [12] were among the first to experimentally investigate oscillatory flow in a pipe and discovered the so-called “annular effect”, i.e., that the maximum velocity in an oscillatory flow occurs near the wall rather than at the center of the pipe, as is the case under steady flow. Experiments such as those of Hino et al. [13], Ohmi et al. [14], and Zhao and Cheng [15] showed that the appearance of turbulence (perturbation) in an alternating flow is different from that in a quasi-stationary, unidirectional flow. The onset of turbulence happens only in the early deceleration phase, whereas in the acceleration phase the flow regime is quasi-laminar.
Other works, performed by Hino et al. [16], Akhavan et al. [17] and Vittori and Verzicco [18], also show that the oscillating flow regime can be either laminar, disturbed laminar (small perturbations appearing during the acceleration phase of the cycle), highly turbulent for the entire cycle, or intermittently turbulent (at the beginning of the deceleration part of the cycle).
Not only is there a fundamental difference between steady and oscillatory flow, but many experimental and analytical investigations have shown that under conditions of oscillating flow, the pressure drop is not always in phase with the velocity. Thus, predicting phase shift in alternating flow is crucially important for designing alternating flow-based devices. This is why the phase shift has received particular attention.
For example, Chen et al. [19] showed that the influence of the regenerator length on the phase shift between pressure and velocity is negligible compared to that of frequency. The authors prove that the pressure drop coefficient is difficult to determine due to the phase shift variation with velocity (up to 50°). Choi et al. [20] used modified phase shift as a dimensionless parameter to predict the phase shiftbetween the pressure drop and the mass flow rate at the warm end of oscillating flow through a twill screen regenerator. They found that all their experimental cases can be expressed by a single relationship:
whereis the Valensi number (same as kinetic Reynolds number, ratio of the time scale of viscous penetration to the oscillation period [11]).
Another analytical correlation was obtained by Khodadadi [21] to predict the phase shift between the velocity and the pressure of oscillating flow through a porous medium channel bounded by two impermeable parallel plates. He found a significant phase shift of 90° between the velocity and the pressure. His results showed that the phase shift can be predicted using the Stokes number, external diameter, and porous medium shape parameter. The annular effect reported by Khodadadi [21] could be responsible for this phase shift. Ni et al. [22] observed significant phase differences between the movements of gas inside porous media and the movements of the piston. This phase shift increases with the increasing pressure drop of porous media.
A combined theoretical and experimental study on fluid motion in the wire mesh regenerator of a Stirling engine in an oscillatory flow was conducted by Isshiki et al. [23]. They found a small phase shift between the pressure drop and velocity. It was stated that the turbulent intensity in the regenerator exit flow field is stronger during the decelerating period than during the accelerating one. Friction factors defined by adjusting the phase shift between the pressure drops and velocity variations show that it appears bigger in the accelerating period than in the decelerating period. Zhao and Cheng [8] found that the phase shift between the pressure drop and the velocity strongly depends on the kinetic Reynolds number and less so on the dimensionless displacement of the fluid.
Guo et al. [24] experimentally investigated the flow characteristics of a split cycle Stirling cryocooler regenerator. They stated that the phase shift between the pressure drop and the mass flow depends on the porosity and the regenerator outlet conditions. Zhao and Cheng [25], Leong and Jin [26], Jin and Leong [27], Bağcı et al. [28], Rogdakis et al. [29], and Dellali et al. [30] experimentally investigated the characteristics of oscillating flow. Their results showed that the phase shift between the velocity and the pressure drop is small under high porosity.
In this study, the characteristics of alternating air flow through three types of regenerator (Str_30%, Str_35% and Str_40%) with different geometries, lengths, and porosities were experimentally investigated. We present new experimental results for velocity, pressure, and temperature under alternating air flow. The friction factors through the regenerator were also calculated and are discussed herein. Based on all the experimental data, a new correlation equation for the phase shift between instantaneous pressure drop and velocity was obtained.
2. Description of Experimental Setup
In this section, the experimental setup designed and built to perform experiments of alternating flow interaction with porous media is described. The device (Figure 1) is similar to an alpha Stirling engine configuration. Its main components are an electrical motor (1), a cylinder and crank shaft (2), a double-acting pneumatic cylinder (3), two connecting tubes (4 and 5), two air/water heat exchangers (6 and 7), and a regenerator (8). These parts are mounted on an aluminum support of sufficient mechanical rigidity to withstand the substantial vibration caused by the alternating motion of the system. The shaft is pierced so that the position of the crank and hence its travel, and thus the volume swept by the piston, can be adjusted. The piston stroke can vary from 64.4 mm to 128.4 mm in 3.20 mm increments.
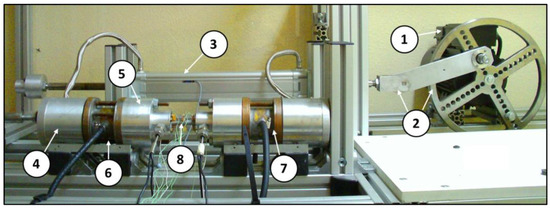
Figure 1.
Experimental test bench composed of 1: electrical motor, 2: cylinder and crank shaft, 3: pneumatic cylinder, 4 and 5: connecting tubes, 6: hot heat exchanger (HHEX), 7: cold heat exchanger (CHEX), and 8: regenerator under test.
The experimental device allowed for the insertion of different regenerators to be tested. The working fluid is air, which is displaced as an alternating in-line flow by the motion of the piston (cylinder). The regenerator is connected between the two connecting tubes at the extremities.
2.1. Regenerators
The studied regenerators are all made of 316 L stainless steel and are manufactured using the direct metal laser sintering (DMLS) technique. Using this technique, their dimensions and shapes can be precisely defined. They all have an outer diameter of 9.5 mm and a lengthof 60 or 70 mm. The differences between them lie in their porosities (ε), which result from their structure (Figure 2). We examined a 30% porosity regenerator presenting a pyramidal structure [31], a 35% porosity regenerator with a straight channel structure, and a 40% porosity regenerator with heterogenous straight channels. The hydraulic diameterof each regenerator structure (Str) is obtained using the defining Equation (4) of that parameter:
whereis the fluid volume contained within the regenerator and is the regenerator surface in contact with the contained fluid. These parameters’ values are given by the CAD software used to design the regenerator.

Figure 2.
Drawings of different regenerators tested. (a) Front view of Str_30%. (b) Structure close-up of Str_30%. (c) Isometric view of Str_30%. (d) Front view of 35% and 40%. (e) Isometric view of 35%. (f) Isometric view of Str_40%. TR: microthermocouples planned.
2.2. Instrumentation and Measurement Techniques
In order to characterize the fluid regenerator interaction from thermal and dynamic perspectives, temperatures, pressures, and velocities were measured as indicated in Figure 3 and Figure 4.

Figure 3.
Schematic of the alternating flow regenerator test bench.
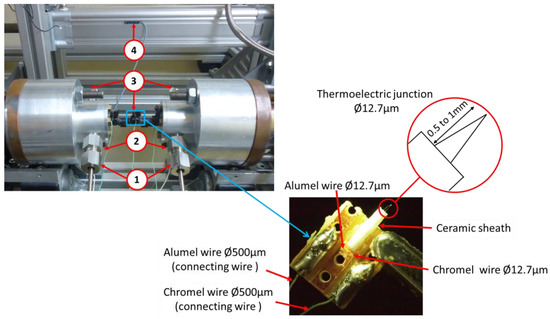
Figure 4.
Positions of the different sensors 1: hot-wire sensors, 2: pressure sensors, 3: microthermocouples, 4: magnetic proximity sensor.
For temperature measurements, homemade 12.7 μm diameter K type (Chromel-Alumel) microthermocouples were used (Label 3 on Figure 4). They were placed at both ends of the regenerator, and at five spots that were manufactured on the regenerator (Figure 2). In this paper, we only present the temperature evolution measured at both ends of the regenerator. Thermocouples were characterized under static and dynamic states (Lanzetta and Gavignet [32]). Their accuracy is ±0.1 °C and their cut-off frequency is 30 Hz for forced convection. The alternate flows have a frequency range between 0.65 to 5.88 Hz. Therefore, no temperature correction is required as the cut-off frequency is higher than that of the flow. Local instantaneous pressures were measured using XTL-140M-5BARA Kulite sensors (Label 2 in Figure 4). The sensors were calibrated and placed at both ends of the regenerator. Two hot-wire sensors (TSI, Model: 1201) were used for measurements of the instantaneous axial velocity at each end of the regenerator (Label 1 in Figure 4). The hot-wire sensor was calibrated using a TSI IFA-300 system. The velocity signal was digitized using an A/D converter card and the data were processed via Thermal-Pro software. Sensors were placed on each regenerator side in the same section as pressure and temperature sensors. The hot-wire sensor only measures the velocity of the flow, i.e., an absolute velocity value. As the flow oscillates, a sign should be added to that value in order to give information regarding flow direction.
Finally, the angular position of the pistonwas obtained using a magnetic proximity sensor (FESTO SME-8-K-LED-24), with a response time of less than 5 ms. The proximity sensor was positioned on the cylinder (Label 4 on Figure 4) in such way that it delivered a signal of maximum value for the initial position of the piston A (Figure 5).
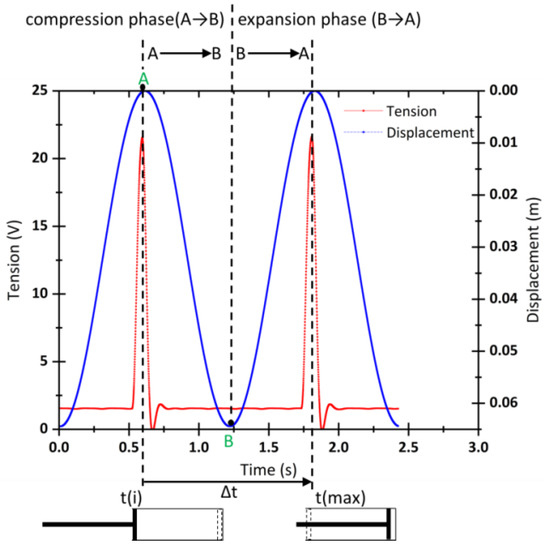
Figure 5.
Example of the experimental angle sensor signal and of the theoretical piston position.
The calculation of the temporal angular position of the piston was conducted theoretically. It consists of calculating the complete cycle time that corresponds to the two successive positions of port A and B (Figure 5). The compression phase corresponds to the first half of the cycle and the expansion phase corresponds to the other half.
The formula used to obtain the transient angular position of the pistonis given by:
where t(i) is the variation of time during a cycle, t(max) is the time corresponding to the second position of the maximum dead center of the piston, and Δt is the time between the two successive positions of the maximum dead center of the piston.
Since the flow alternates, it is necessary to define a temporal reference in order to describe the parameters’ temporal evolutions. Based on sensor position detection, the zero-time reference for a single cycle matches the detection of a piston’s lower spatial position. For the study of successive cycles, zero time matches the lower piston position of the first cycle of the series. Conveniently, we used rotation angleinstead of time to plot the thermo-fluidic parameters’ evolution.
In this paper, we consider that the piston motion pushes fluid from the hot side to cold side of the regenerator during the compression phase. During the expansion phase, fluid passes from the cold to the hot side of the regenerator (Figure 6).
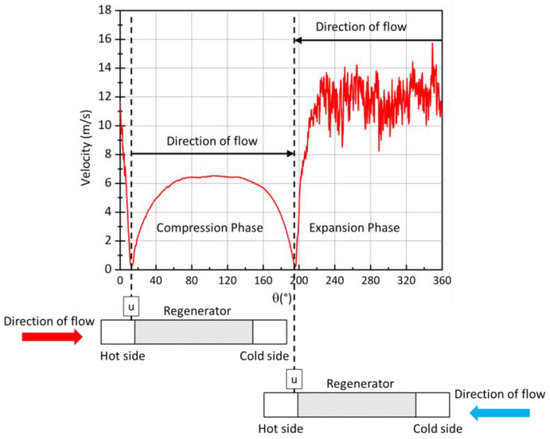
Figure 6.
Evolution of the fluid velocity during the compression phase (or hot blow when the hot gas enters the regenerator) and expansion phase (or cold blow when the cold gas enters the regenerator).
The hot side represents the volume between the regenerator and the hot exchanger, and the cold side is between the regenerator and the cold exchanger. The time corresponding to the minimum value of the velocity (u) is taken as a reference for the starting point of the compression phase or the expansion phase (reverse phase) of the fluid flow.
All the signals were synchronized using a National Instrument USB-6211 I/O 250 KHZ multifunction board that was connected to both the external trigger system of the IFA 300 board and the NI SCXI-1600 trigger module of the NI SCXI-1000 chassis.
2.3. Uncertainty Analysis
The uncertaintieswere analyzed by the method described in the Guide to the expression of Uncertainty (GUM) [33]. It can be classified into two groups. In Type “A”, standard uncertainty is evaluated using statistical methods. In Type “B”, standard uncertainty is evaluated by means other than statistical methods [33].
The equation to estimate the experimental uncertainty (type “A” uncertainty) of a quantity estimated from independent observationsis represented by:
When performing the cycle averaging of the data obtained over 45 successive cycles, the Type “A” uncertainty of the measured velocity is ±0.02 ms−1. The dynamic uncertainty measurement is ±1.85 × 10⁻³ bar.
For the Type “B” evaluation of standard uncertainty, we used data provided in the calibration apparatus for the velocity (±1%) and the pressure (±5 × 10⁻³ bar). Considering that these intervals represent a rectangular distribution between the values, the Type “B” evaluation of standard uncertainty was calculated according the following equation:
The combined standard uncertainty is:
The expanded uncertaintyis obtained by multiplying the combined standard uncertaintyby a coverage factorcorresponding to a 95% confidence interval:
The total relative percent uncertainty is computed using the following formula:
The uncertainties of frequencyand porositywere estimated to be 0.64% and 1%, respectively. The thermocouples were calibrated under static and dynamic states to ensure the accuracy uncertainties of ±0.1 °C (Lanzetta and Gavignet [32]). The calculated total relative percent uncertainties for pressure and velocity are given in Table 1 for different structures of the regenerator with all experimental data.

Table 1.
Total relative percent uncertainty of experiment.
Considering that the errors are uncorrelated variables, the standard uncertainties can be calculated using Equations (11) and (12) according to the principle of uncertainty propagation.
where are measured quantities with uncertainties, and the measured values are used the compute the function.
The maximum uncertainties of the kinetic Reynolds numberand the friction factorare 1.55% and 8.9%, respectively, with a 95% confidence level.
The relative uncertainties depend on the frequency and vary from:
- 0.72% to 1.55% for the kinetic Reynolds number ;
- 7.6% to 2.5% for the pressure drop;
- 8.9% to 3.6% for the friction factor.
2.4. Experimental Protocol
The tests were performed for different structures of metallic regenerators (Str_30%, Str_35% and Str_40%) and two lengths (L1 = 60 mm and L2 = 70 mm). These tests were operated with ten frequencies from 0.65 Hz to 5.88 Hz, two strokes of the piston (C1 = 64.4 mm and C2 = 128.4 mm), and two thermal axial temperature gradients (∆T1 = 70 °C/10 °C; ∆T2 = 40 °C/10 °C). Table 2 includes all the tested parameters in our study. Experiments were conducted for each combination of parameters for a given regenerator. The results are discussed in the next section.
Table 2.
Test conditions for alternating flow.
3. Results and Discussion
In the present section, the exploitation and analysis of the measurements data are presented in order to investigate the overall thermo-fluidic behavior of the alternating flow through the regenerator. In the presented experiments, the hot heat exchanger (HHEX) temperature was set at 70 °C, while the cold heat exchanger (CHEX) temperature was set at 10 °C. The piston stroke was set at C1 = 64.4 mm. We start by analyzing the temperature before moving on to the velocities and then the pressures.
3.1. Evolution of Side Temperatures
In this paper, we only present the temperature evolution measured at each side of the regenerator. The effect of frequency on the temperature is plotted in Figure 7 for three types of regenerators, Str_30%, Str_35%, and Str_40%, at a length of L1 = 60 mm.

Figure 7.
Evolution of temperatures at hot and cold inlet sides of regenerator ((a): Str_30%, (b): Str_35%, (c): Str_40%. L1 = 60 mm, C1 = 64.4 mm) versus phase for temperature gradient ΔT1 = 70 °C/10 °C.
At low frequency, the fluid temperature in the hot side increases in amplitude due to the heating effect as the piston motion pushes fluid from the hot side to the cold side of the regenerator. The fluid temperature in the cold side also increases due to the heating effect from the hot side. The temperature fluid drops when the piston motion pushes fluid from the cold side to the hot side. It should also be noted that fluid temperatures reach their maximum value earlier for Str_35% and Str_40% regenerators than for the 30% one at low frequencies. Moreover, maximum temperatures are reached before the mid-period.
When increasing the rotation velocity of the motor, the maxima are reached for a rotation angle closest to 180°. The fluid maximum temperature reaches 80 °C on the hot side and 35 °C on the cold side (Figure 7). These temperatures are 10 and 25 °C higher than those of the hot and cold exchangers, respectively. This is due to compressibility effects (pressure and, therefore, density) implied by alternations, as can be seen in Section 3.3 and Section 3.4. The evolutions of the maximum temperatures of the hot side and cold side for the three types of regenerator are out of phase by about 180°. Neither geometry nor porosity affects this value. This was also observed by Bonnet [34] and Gheith [35] in studies on heat engines operating on alternating flow.
3.2. Evolution of Side Velocities
Figure 8 shows the velocity evolution measured by the hot-wire sensor. One can clearly see the outward and return phase. However, one can also describe the cycle as a combination of compression and expansion phases. Those phases occur between the two successive minimum velocity values. The compression phases match the hot to cold flow displacement where velocity should be counted positively, whereas the expansion phase is associated with the cold to hot displacement where velocity should be counted negatively. Typical velocity evolutions on each regenerator’s sides are shown on Figure 8a–c for porosities of 30%, 35%, and 40%, respectively. Experiments were conducted for the same frequency (close to Fr ≈ 0.7 Hz) that corresponds to the lowest tested frequency. The relative uncertainties depend on the frequency Fr and vary from ±1.16% to ±2.33% for the Str_30% regenerator, whereas it is almost constant at ±2.30% for the Str_35% and Str_40% regenerators.

Figure 8.
Evolution of velocities at hot and cold inlet sides of regenerator ((a): Str_30%, (b): Str_35%, (c): Str_40%. L1 = 60 mm, C1 = 64.4 mm) versus phase for temperature gradient ΔT1 = 70 °C/10 °C.
The first observation is that the amplitude of the velocity of the fluid in the hot side is less when the piston pushes the fluid from the hot side to the cold side of the regenerator during first half cycle. This is because the volume of fluid during this phase is subjected to compression generated by the movement of the piston. As a result, the density increases under the effect of the increase in pressure. In addition, the regenerator plays the role of an obstacle, slowing the flow of the fluid as a result of head losses. At the same time, the fluid in the cold side of the regenerator is decompressed. Its velocity increases when fluid exits the regenerator. We can also observe that exiting velocities are more disturbed, implying turbulence generation in the exiting flow. Measured axial velocities are similar to those obtained by Hino et al. [16], Simon and Seume [11], Zhao and Cheng [15], and Xiao et al. [9]. During the second half cycle, fluid passes from the cold to the hot side of the regenerator, and the reverse situation occurs.
The second observation is that the minimum velocity, obtained with the structures Str_35% and Str_40%, do not correspond to the moment when the piston is in the top dead center (TDC) extreme position. The absolute speed reaches its minimum value at a rotation angle of about θ = 15° and 190° (instead of 0° and 180°). This divergence also exists with the Str_30% structure and is more significant. The explanation may lie in the geometry of the Str_30% structure, which generates a large variation in density (the effect of gas compression) as a result of its more compact and disturbing structure.
3.3. Evolution of Side Pressures
Figure 9 shows the pressures curves at each regenerator side. The pressure amplitude is weakly sensitive to frequency for the Str_30% structure (Figure 9a). For the Str_35% and Str_40% structures, the pressure amplitude increases by approximately 0.2 bar between the lowest and highest frequency (Figure 9b,c). This corresponds to 20% of the average pressure. This phenomenon is probably due to the fact that the compressibility of the fluid in the presence of the Str_30% structure is greater than with the other two structures.
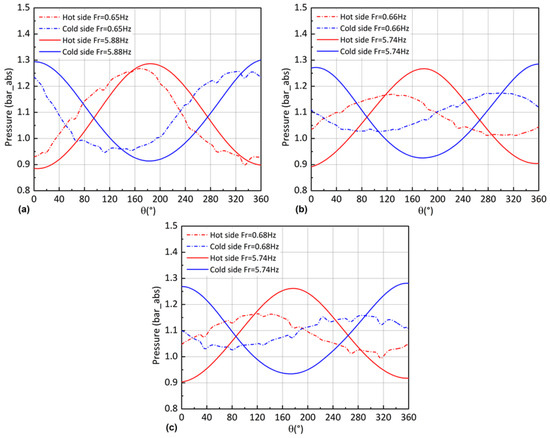
Figure 9.
Evolution of pressures at hot and cold inlet sides of regenerator ((a): Str_30%, (b): Str_35%, (c): Str_40%. L1 = 60 mm, C1 = 64.4 mm) versus phase for temperature gradient ΔT1 = 70 °C/10 °C.
In Figure 9b,c the pressure maximum amplitude on either side of the regenerators (Str_35% and Str_40%) does not match the predicted theoretical temporal forecasts. The pressure reaches its maximum value for θ = 120° at a low frequency. For higher frequencies, the maximum is obtained just before the neutral point (aka TDC), i.e., θ = 180° instead of θ = 90°. This shift also occurs for Str_30% (Figure 9a), regardless of the frequency, and always for θ = 180°. This phenomenon is probably due to compressibility, which is greater for the Str_30% regenerator. This could explain the most disturbed structure and the lowest porosity. These results are confirmed by those obtained at different frequencies. This difference between the theoretical and experimental results was also experimentally observed by Zhao and Cheng [8].
3.4. Effect of Air Compressibility
In this section, we take interest in the gas compression effect of alternating fluid flow. We carried out isothermal flow tests (no initial temperature gradient) in order to solely investigate the fluid gas compression effect due to the regenerator’s presence.
The ideal gas model is used to approximate gas density. The resulting equation for density estimation is:
where for the air.
The effect of frequency on the gas density at both ends of the regenerator for a porosity of ε = 40% is plotted in Figure 10a (similar results are obtained for other porosities; Kahaleras et al. [34]). We observe an increase in the gas density at high frequencies. We also observe a significant variation in the density (1.08 kg m−3 < ρ < 1.50 kg m−3), even if the measurements were carried out for isothermal flow.
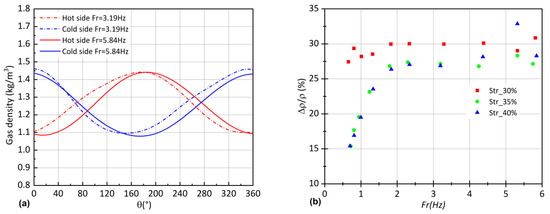
Figure 10.
Effect of frequency on gas density. (a) Evolution of the gas density of regenerator Str_40% versus phase angle. (b) Density variation ratio versus the frequency of each regenerator (L1 = 60 mm, C1 = 64.4 mm, for isothermal flow).
The density variation ratio for the three types of tested regenerators is calculated with respect to the average densityover a complete cycle, which is defined by Kahaleras et al. [34]:
where and are the minimum and maximum densities over a complete cycle, respectively.
We can observe that the density variation ratio is significant at a high frequency for any structure (Figure 10b) as it reaches 30%. For the most disturbed structure (Str_30%), this compressibility is already obtained at low frequencies. For Str_35% and Str_40% structures, we observe that this ratio increases with frequency until it stabilizes at a maximum value (28%), beyond which this ratio remains almost constant.
3.5. Friction Factor Evaluation
As we have seen, in alternating flow, all the flow parameters (pressure, velocity, and temperature) vary over time. One can therefore determine the friction factorat a particular time . The literature study showed that many authors, such as Tanaka et al. [4], Hsu et al. [35], and Jin and Leong [27], determine the friction factor at the time of maximum velocity as:
where the velocity is obtained by dividing the frontal velocity by porosity.
We first determine the friction factoron the basis of this relationship. In a second step, we discuss the suitability of this relationship for an alternating flow.
In the formula for calculating, the flow parameters, such as densityand pressure drop, are determined at the position of maximum velocity and denotedand respectively. These quantities are calculated during the compression phase (when the hot gas enters the regenerator) at the time when the fluid speed reaches its maximum value.
Figure 11a–c show the evolution of the friction factor as a function of the kinetic Reynolds numberfor different regenerator structures. Since the tested friction factor is a function of the velocity and pressure drop, the uncertainties of the tested friction factor, denoted by the error bars in Figure 11, are estimated by the law of propagation (Equation (11)). The largest uncertainty in the friction factor was computed to be approximately 5.50% for Str_30%, 7.60% for Str_35%, and 8.9% for Str_40%. We note that the uncertainty for the Str_30% regenerator is lower than that of Str_35% and Str_40% structures.
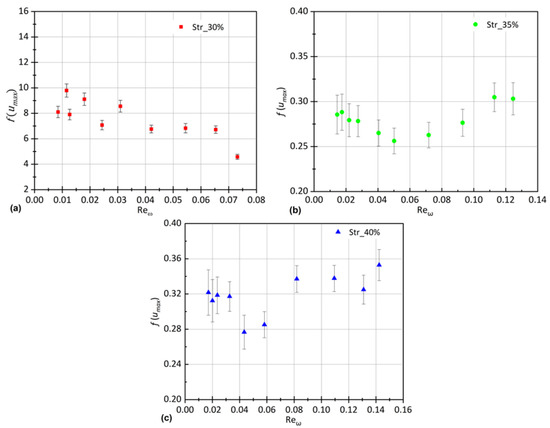
Figure 11.
Evolution of friction factor at maximum velocity of regenerator ((a): Str_30%, (b): Str_35%, (c): Str_40%. L1 = 60 mm, C1 = 64.4 mm) versus kinetic Reynolds number Reω.
In addition, the friction factor seems to decrease with the frequency of the Reynolds number for the regenerator of porosity 30%, despite some dispersion of values. This result is consistent with the works of Ibrahim et al. [36] on complex geometry regenerators. Nothing like this is clearly visible for other regenerators. Indeed, we observe that it is almost constant (less than 0.05% dispersion).
These dispersions are due to the velocity patterns being relatively flat around the maximum value (Figure 8). This leads to uncertainty in the determination of which can have a significant impact. Indeed, the pressure dropmeasured for maximum fluid velocity time can vary considerably over a small range of rotation angles (Figure 12).

Figure 12.
The angular phase shift between pressure drop and velocity of regenerator (Str_40%, L1 = 60 mm, C1 = 64.4 mm) versus phase for temperature gradient ΔT1 = 70 °C/ 10 °C and Fr = 5.74 Hz.
This implies potential substantial dispersion in the friction factor values. Although it is difficult to determine clear trends, there is a real quantitative difference in the friction factor depending on the type of regenerator. Indeed, if it seems logical that the porosity impacts the friction factor (ε decreases, increases), it can be seen that for identical porosity variations of 5% between regenerators, the friction factor changes significantly in the first case (passage from 30% to 35%) and very little in the second (passage from 35% to 40%). This is due to the difference in structure geometry. The Str_30% regenerator is the only one with a pyramid structure that is much more disruptive than the channel structures of the Str_35% and Str_40% regenerators. Thus, the 30% to 35% evolution is more relevant than the 35% to 40% one.
We have seen that the determination ofin our installation is a source of dispersion. Conversely, the maximum pressure drop is easily detectable (Figure 12).
We therefore propose to calculate the pressure drop coefficient related to the maximum pressure drop:
The results obtained and presented in Figure 13a–c show a clearer trend for each of the regenerators. We observe that the effects of dispersion have therefore been attenuated by the choice of the maximum pressure dropas a study parameter. The evolution of the friction factor seems to consist of two distinct phases. At low kinetic Reynolds numbersthe friction factor seems almost constant. When the kinetic Reynolds number is sufficiently largethe friction factor increases with the kinetic Reynolds number.

Figure 13.
Evolution of friction factor at maximum pressure drop of regenerator ((a): Str_30%, (b): Str_35%, (c): Str_40%. L1 = 60 mm, C1 = 64.4 mm) versus kinetic Reynolds number Reω.
3.6. Pressure-Drop and Velocity Phase Shift
In this subsection, the evolution of pressure drops and velocities are compared. The pressure drop is calculated using the following formula:
where and are pressures at the hot and cold inlet sides of the regenerator, respectively.
In Figure 14, different evolutions are plotted together as a function of the angle of rotationfor the three regenerator structures (Str_30%, Str_35%, and Str_40%). As fluid velocity shows an almost constant plateau around the maximum velocity over a significant rotation angle interval, measuring phase shift between the pressure drop and velocity maximum appears hazardous.
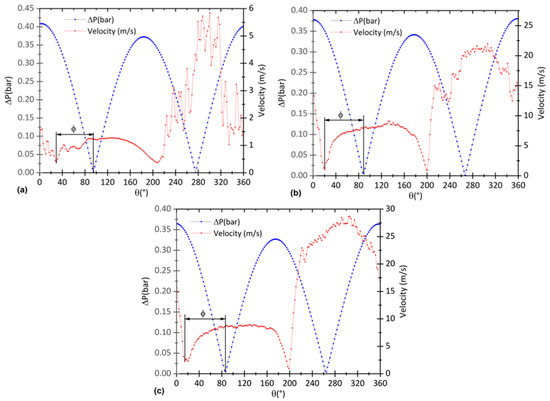
Figure 14.
Evolution of the pressure drop and the velocity as a function of the angle of rotation of a regenerator ((a): Str_30%, (b): Str_35%, (c): Str_40%. L1 = 60 mm, C1 = 64.4 mm) versus the phase for the temperature gradient ΔT1 = 70 °C/10 °C.
Substantial uncertainties in the calculation of the angular phase difference between the head loss and velocity are probable. Therefore, it appears to be more justified to determine this phase shift between the minimum values. Furthermore, as experiments were conducted for different frequencies and regenerators, we gathered results on a single phase shift versus kinetic Reynolds number (defined in the Introduction) pattern.
Those evolutions in phase shift are presented for all regenerators regarding:
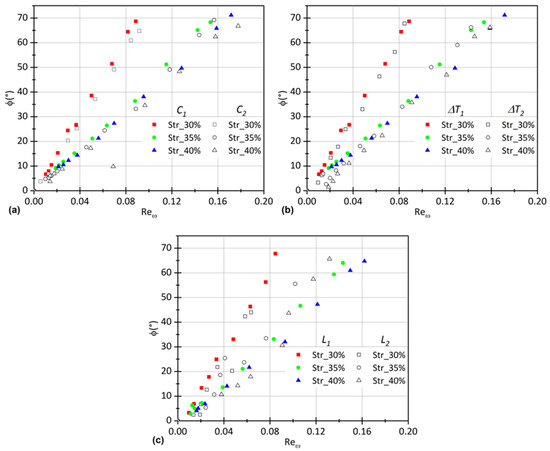 Figure 15. Evolution of the phase shiftas a function of the kinetic Reynolds number Reω for each regenerator. (a): Strokes (C1 = 64.4 mm and C2 = 128.4 mm), (b): Temperature gradient (ΔT1 = 70 °C/10 °C and ∆T2 = 40 °C/10 °C), (c): Regenerator length (L1 = 60 mm and L2 = 70 mm).
Figure 15 shows that the phase shift between the pressure drop and velocity is significant and can reach 71° at high Reynolds frequency numbers for any structures. We can also observe that the phase shift increases linearly with the kinetic Reynolds number, regardless of the configuration. This means that there are negligible effects of displacement, regenerator length, and temperature gradient on the phase shift in our investigated parameter area. This confirms the theoretical and experimental results of Simon and Seume [11], Khodadadi [21], Zhao and Cheng [8], and Isshiki et al. [23]. However, the above results show that the phase shift depends on the structure of the regenerator.
Thus, all the results have been plotted for each regenerator for all the corresponding experiments independently of other parameters (length, stroke’s motion, and temperature gradient). The obtained graphs are presented in Figure 16.

Figure 16.
Evolution of the phase shiftfor each regenerator ((a): Str_30%, (b): Str_35%, (c): Str_40%) as a function of the kinetic Reynolds number Reω for different strokes (C1 = 64.4 mm and C2 = 128.4 mm), lengths (L1 = 60 mm and L2 = 70 mm) and temperature gradients (ΔT1 = 70 °C/10 °C and ∆T2 = 40 °C/10 °C).
In each graph in Figure 16, the phase difference appears as a growing linear function of the oscillating Reynolds number for each regenerator. Seeking a law confirms this observation, as the regression curves added to the figure proves it. Regressions are given in Table 3, assuming that at zero frequency a phase shift should be null.
Table 3.
Phase shift correlations between the pressure drop and speed for different regenerator structure.
If we relate the phase shift of a regenerator of any structure (i) to the phase shift of the 30% porosity regenerator, the following relationship may be written:
Furthermore, the ratio is quite constant; it is then possible to write:
The calculations of those ratios for regenerators Str_35% and Str_40% are given in Table 4. It appears that they are the inverse of each other.
Table 4.
Slope ratio and hydraulic diameter inversed ratio.
Thus, Equation (20) leads to:
meaning:
This result proves that the phase shift is only frequency-dependent in our experiments. When plotting the experimental phase shift measurements versus frequency altogether, Figure 17 is obtained.

Figure 17.
Phase shift between pressure drop and velocity for different regenerator structures, strokes, lengths, and temperature gradients.
The arrangement of the experimental measurement points thus obtained seems to confirm the previous result.
In order to obtain correlations depending on characteristics of the regenerators, a modified phase shiftas a new dimensionless parameter (as defined by Choi et al. [20]) is introduced to obtain the proper following:
Thus, all our results are plotted for each regenerator for all the corresponding experiments independently of other parameters (length L, stroke of the piston C, and temperature gradient ∆T). The proposed equation is also plotted on the graph for comparison in Figure 18.

Figure 18.
Modified phase shift correlations between pressure drop and velocity for different regenerator structures, strokes, lengths, and temperature gradients.
Therefore, the experimental modified phase shift is well fitted by the following correlated equation, as shown in Figure 18. The linear regression plot definitively validates it, as the R-square of the fitting curves is 0.97 with an error of ±2.39%.
Thus:
Therefore, in our case, a correlation equation for phase shiftbetween the velocity and pressure drop is proposed for our experimental data:
which is valid in the range of.
Equation (25) shows that the phase shift between the velocity and the pressure drop is governed by the hydraulic diameter to length ratio and the kinetic Reynolds number. It indicates that the effect of the kinetic Reynolds number on the phase shift is more dominant than that of the hydraulic diameter to length ratio .
4. Conclusions
This study was focused on our understanding of the physical parameters characterizing alternating flows at different frequencies submitted to a temperature gradient and passing through different metallic regenerator structures that can be found in Stirling cycle thermal machines, and in so-called alternative machines. These investigations were experimentally performed using a specific test bench, allowing for the measurement of instantaneous pressures, velocities, and temperatures at both sides of the regenerator over several cycles.
From the results presented above, the following main conclusions may be drawn:
- The dynamic characteristics of the regenerator are finally determined from the instantaneous measurements of the pressures, velocities, and temperatures on each side of our regenerators. Temperature measurements required the development of microthermocouples of 12.7 µm (type K). They were manufactured in our laboratory and characterized both statically and dynamically.
- The effect of the compressibility of the working fluid (variation of the density) in our experimental device is not negligible, which brings us closer to the conditions actually generated in thermal machines operating an alternating regime.
- The friction coefficient is calculated using a classical correlation at the time of maximum velocity. The friction factorseems to decrease with the kinetic Reynolds number for a 30% porosity regenerator. For the other tested regenerators, we observe that it is almost constant with a little dispersion. To minimize the dispersion effects, another definition was proposed to calculate the friction factor at the time of maximum pressure drop. The results then show, for the three regenerators, a single trend that is clearer as a function of the frequency Reynolds number.
- A new correlation for the phase shift between the velocity and pressure drop of different regenerator structures was obtained. It was found that the effect of on the phase shift is more dominant than that of the hydraulic diameter to length ratio . This correlation equation is useful in the design of regenerators in a Stirling machine or alternating flow-based devices.
In future, this experiment will be carried out for other regenerators, especially those with different porosities and shapes (mesh, grid, and channel). In order to do so, the test bench will be enhanced. We also aim to determine the energy balance on the regenerator and on each heat exchanger. The last improvement will be the temperature measurement inside and at the wall of the regenerators.
Author Contributions
Conceptualization, G.L. and F.L.; literature review and analysis, M.S.K.; methodology, all authors; investigation, all authors; writing—Original draft preparation, G.L.; writing—Review and editing, all authors. All authors have read and agreed to the published version of the manuscript.
Funding
This work was supported by the EIPHI Graduate School (contract ANR-17-EURE-0002) and the Region Bourgogne-Franche-Comté, France.
Data Availability Statement
Data sharing is not applicable.
Conflicts of Interest
The authors declare no conflict of interest.
References
- Tong, L.S.; London, A.L. Heat-Transfer and Flow-Friction Characteristics of Woven-Screen and Crossed-Rod Matrices; Westinghouse Electric Corp.: Pittsburgh, PA, USA, 1956. [Google Scholar]
- Blass, E. Geometrische und strömungstechnische Untersuchungen an Drahtgeweben. Chem. Ing. Tech. 1964, 36, 747–758. [Google Scholar] [CrossRef]
- Miyabe, H.; Hamaguchi, K.; Takahashi, K. An approach to the design of Stirling engine regenerator matrix using packs of wire gauzes. In Proceedings of the 17th the Intersociety Energy Conversion Engineering Conference, Los Angelese, CA, USA, 8–12 August 1982; Volume 4. [Google Scholar]
- Tanaka, M.; Yamashita, I.; Chisaka, F. Flow and Heat Transfer Characteristics of the Stirling Engine Regenerator in an Oscillating Flow. JSME Int. J. 1990, 33, 283–289. [Google Scholar] [CrossRef]
- Taylor, D.R.; Aghili, H. An investigation of oscillating flow in tubes. In Proceedings of the Intersociety energy conversion engineering conference, San Francisco, CA, USA, 19–24 August 1984; Volume 3. [Google Scholar]
- Gedeon, D.; Wood, J.G. Oscillating-Flow Regenerator Test Rig: Hardware and Theory with Derived Correlations for Screens and Felts; CreateSpace Independent Publishing Platform: Scotts Valley, CA, USA, 1996. [Google Scholar]
- Pamuk, M.T.; Özdemir, M. Friction factor, permeability and inertial coefficient of oscillating flow through porous media of packed balls. Exp. Therm. Fluid Sci. 2012, 38, 134–139. [Google Scholar] [CrossRef]
- Zhao, T.S.; Cheng, P. Oscillatory pressure drops through a woven-screen packed column subjected to a cyclic flow. Cryogenics 1996, 36, 333–341. [Google Scholar] [CrossRef]
- Xiao, G.; Peng, H.; Fan, H.; Sultan, U.; Ni, M. Characteristics of steady and oscillating flows through regenerator. Int. J. Heat Mass Transf. 2017, 108, 309–321. [Google Scholar] [CrossRef]
- Muñoz-Cámara, J.; Solano, J.P.; Pérez-García, J. Experimental correlations for oscillatory-flow friction and heat transfer in circular tubes with tri-orifice baffles. Int. J. Therm. Sci. 2020, 156, 106480. [Google Scholar] [CrossRef]
- Simon, T.W.; Seume, J.R. A survey of oscillating flow in Stirling engine heat exchangers. NASA STIRecon Tech. Rep. N 1988, 88, 22322. [Google Scholar]
- Richardson, E.G.; Tyler, E. The transverse velocity gradient near the mouths of pipes in which an alternating or continuous flow of air is established. Proc. Phys. Soc. 1929, 42, 1. [Google Scholar] [CrossRef]
- Hino, M.; Sawamoto, M.; Takasu, S. Experiments on transition to turbulence in an oscillatory pipe flow. J. Fluid Mech. 1976, 75, 193–207. [Google Scholar] [CrossRef]
- Ohmi, M.; Iguchi, M.; Urahata, I. Flow Patterns and Frictional Losses in an Oscillating Pipe Flow. Bull. JSME 1982, 25, 536–543. [Google Scholar] [CrossRef][Green Version]
- Zhao, T.S.; Cheng, P. Experimental studies on the onset of turbulence and frictional losses in an oscillatory turbulent pipe flow. Int. J. Heat Fluid Flow 1996, 17, 356–362. [Google Scholar] [CrossRef]
- Hino, M.; Kashiwayanagi, M.; Nakayama, A.; Hara, T. Experiments on the turbulence statistics and the structure of a reciprocating oscillatory flow. J. Fluid Mech. 1983, 131, 363–400. [Google Scholar] [CrossRef]
- Akhavan, R.; Kamm, R.D.; Shapiro, A.H. An investigation of transition to turbulence in bounded oscillatory Stokes flows Part 1. Experiments. J. Fluid Mech. 1991, 225, 395–422. [Google Scholar] [CrossRef]
- Vittori, G.; Verzicco, R. Direct simulation of transition in an oscillatory boundary layer. J. Fluid Mech. 1998, 371, 207–232. [Google Scholar] [CrossRef]
- Chen, H.; Yang, L.; Cai, J.; Liang, J. Phase Shift Characteristics of Oscillating Flows in Pulse Tube Regenerators. In Proceedings of the 14th International Cryocooler Conference, Annapolis, MD, USA, 14–16 June 2006; International Cryocooler Conference, Inc.: Boulder, CO, USA, 2007. [Google Scholar]
- Choi, S.; Nam, K.; Jeong, S. Investigation on the pressure drop characteristics of cryocooler regenerators under oscillating flow and pulsating pressure conditions. Cryogenics 2004, 44, 203–210. [Google Scholar] [CrossRef]
- Khodadadi, J.M. Oscillatory Fluid Flow Through a Porous Medium Channel Bounded by Two Impermeable Parallel Plates. J. Fluids Eng. 1991, 113, 509–511. [Google Scholar] [CrossRef]
- Ni, M.; Peng, H.; Sultan, U.; Luo, K.; Xiao, G. A quantitative method to describe the flow characteristics of an oscillating flow including porous media. Int. J. Heat Mass Transf. 2018, 119, 860–866. [Google Scholar] [CrossRef]
- Isshiki, S.; Takasaki, Y.; Ushiyama, I.; Isshiki, N. An experimental study on flow resistance of regenerator wire meshes in oscillatory flow [in Stirling engines]. In Proceedings of the IECEC-97 Proceedings of the Thirty-Second Intersociety Energy Conversion Engineering Conference (Cat. No.97CH6203), Honolulu, HI, USA, 27 July–1 August 1997. [Google Scholar] [CrossRef]
- Guo, F.Z.; Chou, Y.M.; Lee, S.Z.; Wang, Z.S.; Mao, W. Flow characteristics of a cyclic flow regenerator. Cryogenics 1987, 27, 152–155. [Google Scholar] [CrossRef]
- Zhao, T.S.; Cheng, P. The friction coefficient of a fully developed laminar reciprocating flow in a circular pipe. Int. J. Heat Fluid Flow 1996, 17, 167–172. [Google Scholar] [CrossRef]
- Leong, K.C.; Jin, L.W. Characteristics of oscillating flow through a channel filled with open-cell metal foam. Int. J. Heat Fluid Flow 2006, 27, 144–153. [Google Scholar] [CrossRef]
- Jin, L.W.; Leong, K.C. Pressure drop and friction factor of steady and oscillating flows in open-cell porous media. Transp. Porous Media 2007, 72, 37–52. [Google Scholar] [CrossRef]
- Bağcı, Ö.; Dukhan, N.; Özdemir, M. Characteristics of oscillating liquid flow in foam-like highly-porous media: An experimental study. Exp. Therm. Fluid Sci. 2015, 60, 96–105. [Google Scholar] [CrossRef]
- Rogdakis, E.; Bitsikas, P.; Dogkas, G. Study of Gas Flow through a Stirling Engine Regenerator; American Society of Mechanical Engineers Digital Collection: New York, NY, USA, 2018. [Google Scholar]
- Dellali, E.; Bégot, S.; Lanzetta, F.; Gavignet, E.; Rauch, J.Y. Pressure drop analysis of oscillating flows through a miniature porous regenerator under isothermal and nonisothermal conditions. Exp. Therm. Fluid Sci. 2019, 103, 394–405. [Google Scholar] [CrossRef]
- Djetel-Gothe, S.; Doubs, M.; Kahaleras, M.S.; Lanzetta, F.; Layes, G. Regenerator and Method for Manufacturing Such a Regenerator. International Patent Application WO2020127300, 25 June 2020. [Google Scholar]
- Lanzetta, F.; Gavignet, E. Temperature Measurements: Thermoelectricity and Microthermocouples. In Thermal Measurements and Inverse Techniques; CRC Press: Boca Raton, FL, USA, 2011; ISBN 978-0-429-11071-9. [Google Scholar]
- Joint Committee for Guides in Metrology. Evaluation of Measurement Data. Guide to the Expression of Uncertainty in Measurement; International Bureau of Weight and Measures (BIPM): Sèvres, France, 2008; BIPM, IEC, IFCC, ILAC, ISO, IUPAC, and OIML, JCGM 100:2008, GUM 1995 with minor corrections. [Google Scholar]
- Kahaleras, M.S.; Layes, G.; Lanzetta, F.; Nika, P. Characterization of an oscillating flow through a porous media: Phase shift and compressibility effects. In Proceedings of the International Stirling Engine Conference, Nexcastle, UK, 20 October 2016. [Google Scholar]
- Hsu, C.-T.; Fu, H.; Cheng, P. On Pressure-Velocity Correlation of Steady and Oscillating Flows in Regenerators Made of Wire Screens. J. Fluids Eng. 1999, 121, 52–56. [Google Scholar] [CrossRef]
- Ibrahim, M.; Wang, M.; Gedeon, D. Experimental Investigation of Oscillatory Flow Pressure and Pressure Drop Through Complex Geometries. In Collection of Technical Papers—Proceedings of the 2nd International Energy Conversion Engineering Conference, Providence, RI, USA, 16–19 August 2004; Aerospace Research Central: Reston, VA, USA, 2005; p. 5560. [Google Scholar] [CrossRef]
Publisher’s Note: MDPI stays neutral with regard to jurisdictional claims in published maps and institutional affiliations. |
© 2022 by the authors. Licensee MDPI, Basel, Switzerland. This article is an open access article distributed under the terms and conditions of the Creative Commons Attribution (CC BY) license (https://creativecommons.org/licenses/by/4.0/).