Abstract
Due to its excellent strength, plasticity, and fracture toughness, titanium alloy has been widely used in the aerospace field. The specificity of its application environment places high demands on the surface quality of titanium alloy. In this paper, we study the effects of different lubrication methods on the microscopic topography, surface roughness, and microhardness of titanium alloy TC21 during the milling process. The lubrication methods include dry, high-pressure air cooling, and minimum quantity lubrication (MQL). Compared with dry milling and high-pressure air cooling conditions, the MQL environment can effectively suppress plastic deformation and surface defects of titanium alloy TC21. MQL is significant for improving the milling process of titanium alloy TC21. In addition, a surface roughness model considering milling vibration is developed. According to the results of orthogonal experiments, the prediction accuracy of the surface roughness model is acceptable, and the prediction errors are all below 20%.
1. Introduction
Currently, MQL has been widely used as a green processing method for machining fields such as milling and grinding [1,2]. Compared with traditional machining methods, MQL can provide an effective cooling and lubricating environment for tools during the cutting process. Meanwhile, MQL can improve the utilization efficiency of cutting fluid and environmental benefits and enhance the economics of the cutting process [3]. At present, some alloy materials such as titanium alloys and nickel-based alloys are widely used in milling processes under MQL conditions. The combination of low temperature and MQL achieved a balance between machining quality and environmental protection. Thus, MQL is an effective method to reconcile ecological and technical factors. Meanwhile, the hybrid sustainable environment obtained by MQL can reduce tool wear and improve surface quality compared to the dry environment [4,5,6]. Cutting fluids for the MQL environment mainly include vegetable-based lubricant, unsaturated polyol ester, and nanoparticle-modified cutting fluids. In comparison with conventional cutting fluids, nanoparticle-modified cutting fluids can significantly reduce the machining temperature and improve the cooling effect. In addition, the nanoparticle-modified cutting fluid also has a significant reduction in cutting force and surface roughness due to its excellent lubricating properties and thermal conductivity [7,8]. In terms of cutting force, for the milling process under MQL condition, the contact length of the cutter workpiece and chip thickness is different from the dry condition. As a result, it is difficult to control the cutting force accurately. Theoretical analysis shows that high accuracy can be obtained by modeling the cutting forces using the dual contact zone theory. Moreover, the prediction of cutting force using gray correlation is effective. Related studies have shown that the most important factor affecting the surface quality under the MQL condition is the feed rate. Cutting speed has the least degree of influence on surface quality [9,10].
Titanium alloys are characterized by high chemical activity, low thermal conductivity, and low modulus of elasticity. Compared with other conventional engineering materials, titanium alloys have poor machinability, which restricts the application and development in the aerospace field. The specificity of the application environment places higher demands on the machining quality, mechanical properties, and cost of titanium alloys [11,12,13]. In recent years, most scholars have conducted a series of studies about the milling of titanium alloy Ti-6Al-4V. Due to the dimensional effect of cutting area, subsurface deformation and burrs are generated by chip squeezing and tearing failure during the conventional milling process. These defects can seriously affect the working performance and service life of critical components such as aeroengines. Thus, it is necessary to establish an advanced cutting theory and find a suitable machining method [14,15]. In recent years, some novel machining methods such as electric discharge assisted milling (EDAM) and electric discharge assisted grinding (EDAG) have been gradually accepted and applied by modern industry. Due to the reduction in surface hardness and yield stress of the workpiece, EDAM can effectively suppress burr generation and improve the surface quality of Ti-6Al-4V. The residual stress obtained by EDAM is much smaller than that of general milling [16,17]. Many scholars have also developed the milling machining mechanism from milling temperature and milling force. Based on the established milling machining model, the theoretical results of these models are in better agreement with the experimental results [18,19,20].
In summary, most scholars have conducted extensive studies on the milling properties of traditional materials such as titanium alloy Ti-6Al-4V. Titanium alloy TC21 has been rarely reported as a novel metal material for aeronautical applications. In terms of milling theory, the modeling and prediction of milling force and temperature are the main studying directions. A surface roughness model considering milling vibration is developed in this study. Titanium alloy TC21 is milled using a coated tool under three machining methods (dry, high-pressure air cooling, and MQL). The coating and substrate materials are TiAlN and WC, respectively. The effects of lubrication methods, lubrication parameters, and machining parameters on the surface integrity of TC21 are studied. This work is significant to improve the surface quality and optimize the machining process of titanium alloy TC21 during milling.
2. Experimental Equipment and Method
2.1. Experimental System and Measuring Equipment
The experimental system for milling machining is shown in Figure 1. The experimental system includes the force measuring system, the temperature measuring system, the MQL system, the machine tool, the workpiece, and the milling cutter. The model of the machine tool is a TH5650 vertical machining center. The spindle of the machine tool is controlled by an encoder, which can realize infinitely adjustable speed. The maximum speed of the main motion can reach 6000 r/min. The rapid feed of the x-axis and y-axis can reach 24 m/min and the z-axis can reach 15 m/min. The force measuring system mainly includes the Kistler 9257B force measuring instrument, the Kistler 5070 charge signal amplifier, the data acquisition card, and the signal analysis software. The measuring accuracy is 0.01 N, and the data acquisition frequency is 4 kHz. The temperature measuring system includes the k-type thermocouple, the multichannel acquisition box, the signal amplifier, and the display devices. The data acquisition frequency of milling temperature is 20 kHz.
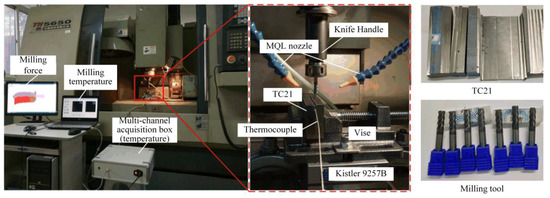
Figure 1.
The experimental system for milling machining.
The MQL system is shown in Figure 2. The MQL system includes the air pump, the air pressure gauge, the oil tank, the air and oil amount adjustment valves, the frequency generator, and the nozzle. Accu-Lube precision oil spraying device is used for the MQL system. The lubricant used for MQL is Accu-Lube LB-2000 super-lubricated spray-type vegetable cutting oil. The viscosity of cutting oil is 36cSt at 40 °C. The strength of the oil film is 60 kg/cm2.
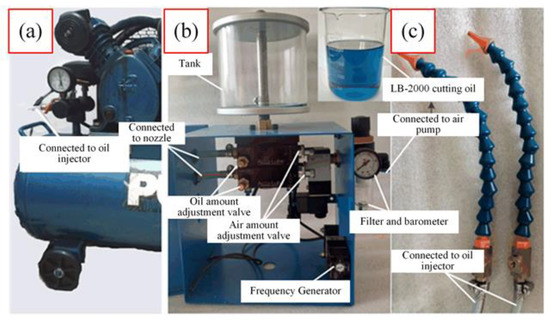
Figure 2.
The MQL system: (a) air pump, (b) oil injector, and (c) nozzle.
Figure 3 shows the measuring equipment, including the 3D measurement laser microscope and the microhardness tester. The 3D laser microscope (LEXT OLS41003D) is selected to measure the surface roughness and observe the microscopic topography. The total magnification is 108 times–17,280 times. The accuracy of the worktable movement along the x-axis and y-axis directions is 0.12 μm and 0.01 μm in the z-axis direction. The microhardness tester (MH500) is used for hardness inspection and hardening layer depth measurement of titanium alloy TC21. The dwell time is 10 s, and the test load is 200 gf. The magnifications of the eyepiece and objective are 10 times and 40 times, respectively.
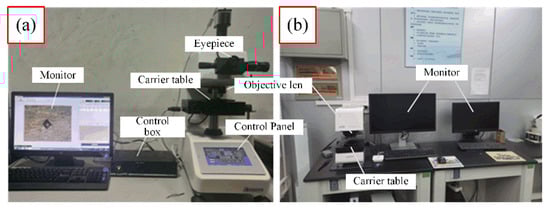
Figure 3.
Measuring equipment: (a) MH500 microhardness tester; (b) 3D laser microscope.
Due to the measurement uncertainty and noise, the measurement results may contain large errors [21,22,23]. To guarantee measuring accuracy, the surface roughness and milling force have been automatically noising reduced in the measurement software. In addition, to eliminate the effect of measurement uncertainty, the average value of multiple sample points is used as the final measurement result of the microhardness.
2.2. Experimental Material and Method
The milling cutter used in the experimental process is a GM-4E-D6.0 solid carbide with a diameter of 6.0 mm. The coating material is TiAlN and the substrate material is WC. The workpiece material is a titanium alloy TC21 plate. TC21 is a novel high-toughness and high-strength material with the nominal composition of Ti-6Al-2Zr-2Sn-2Mo-1.5Cr-2Nb. The mechanical properties of titanium alloy TC21 are shown in Table 1.

Table 1.
The mechanical properties of titanium alloy TC21.
To facilitate measurement and consider the applicable range of machining parameters of the existing machine tools, a series of single-factor experimental parameters are designed for machining. Table 2 shows the single-factor experiments regarding the milling parameters. The milling method is side milling, and the three machining lubrication methods are dry milling, high-pressure air-cooling (air pressure of 0.6 MPa), and MQL (air pressure of 0.6 MPa and lubrication amount of 80 mL/h).
Table 2.
The single-factor experiments on the milling parameters.
Regarding the single-factor experiments of lubrication method and lubrication parameters, the milling method is slot milling. The level variations of lubrication methods are dry milling, high-pressure air cooling (air pressure of 0.6 MPa), MQL1 (air pressure of 0.6 MPa, lubrication amount of 40 mL/h), MQL2 (air pressure of 0.6 MPa, lubrication amount of 80 mL/h), and MQL3 (air pressure of 0.6 MPa, lubrication amount of 120 mL/h). The milling speed (28.27 m/min), axial cutting depth (0.8 mm), and feed per tooth fz (20 μm/z) are kept constant during the milling process.
For the effect of tool wear on the surface integrity of the workpiece, the milling method is adopted as side milling and the lubrication method is performed by MQL. The wear width VB on the flank of the milling cutter is 0.1 mm. The milling speed (28.27 m/min), radial cutting depth (1.5 mm), axial cutting depth (2 mm), and feed per tooth (20 μm/z) are kept constant.
For the validation of the surface roughness model and optimization of process parameters, the conventional four-factor, four-level L16 (44) orthogonal experiments are designed. The milling method is side milling. The lubrication method is MQL (air pressure of 0.6 MPa and lubrication amount of 80 mL/h). Table 3 shows the level variations of milling processing parameters. In the modeling process of surface roughness, spindle speed is calculated instead of the feed per tooth. The relationship between spindle speed and feed per tooth is:
Table 3.
The level variations of milling processing parameters.
3. Study on Surface Integrity of Milled Workpiece Surface
3.1. Microscopic Topography of Milled Workpiece Surface
The geometric structure and cutting trajectory of the milling cutter is mapped on the workpiece surface, which is the microscopic topography of the machined surface. Cutting parameters, workpiece material, vibration, lubrication methods, and lubrication parameters can affect the microscopic topography of the machined surface. The machined surface defects of milled workpieces include feeding tool marks, scratches, plastic deformation, scaly spurs, and secondary material deposition. In particular, feeding tool marks are inherent defects of milled surfaces [26,27,28].
3.1.1. Surface Defects of the Milled Workpiece
On the milled TC21 surface, there are obvious feeding tool marks and surface scratches (see Figure 4). The feeding tool marks are inherent defects of the milled workpiece and are composed of residual surface material when the milling cutter is tooth change cutting. Periodic surface material residues eventually form feeding tool marks that are parallel to each other. The distance between the feeding marks is determined by the feed per tooth. The larger the feed per tooth, the farther the distance between adjacent feeding tool marks and the more significant the tool marks. A great number of surface scratches can also be observed in Figure 4. The surface scratches are caused by the scraping of the milling cutter with the machined surface. The surface scratches are densely distributed over the entire machined surface and are perpendicular to the feeding tool marks.
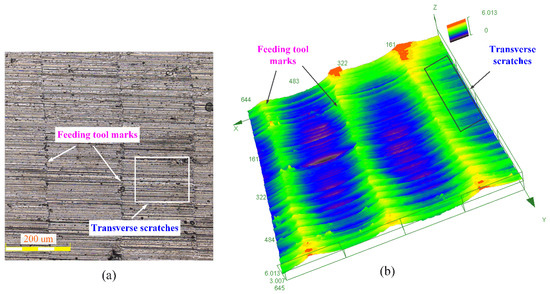
Figure 4.
Feeding tool marks and surface scratches: (a) two-dimensional topography; (b) three-dimensional topography.
The inspection of the machined workpiece revealed that the banding bulges could be easily observed on the workpiece surface side milled by high-pressure air cooling and dry milling (see Figure 5). For the formation of the banding bulges, the high-pressure air cooling and dry milling have higher temperatures compared with MQL machining. The workpiece material tends to bond on the tool surface during machining and form a chip tumor to complete cutting. The chip tumor squeezes the workpiece material and causes plastic flow during the machining process. The banding bulges are formed at the cutting edge of the chip tumor. In addition, the local temperature distribution is not uniform in the cutting area. For the same force, the material in the high-temperature area is more prone to flow to the low-temperature area, forming the banding bulges.
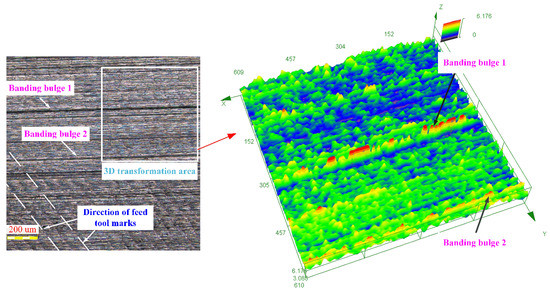
Figure 5.
Banding bulges of the milled surface.
The banding bulges are different from the residual bands of the feeding tool marks. The residual zone of the feeding tool mark undergoes a strong plastic deformation that is not easily observed on the side milling surfaces of high-pressure air cooling and dry milling. Ideally, the milling cutter will not cut the workpiece material left behind by the tooth change cutting. The chip tumor bonded to the flank of the tool can replace the cutter to complete the cutting process, leading to a change in cutter structure. Moreover, the machining temperature of high-pressure air cooling and dry milling is high, and the workpiece material is highly susceptible to plastic deformation. Due to the existence of thermal and mechanical stress, the residual material of the feeding tool mark is extruded and smoothed out.
During the machining process, some scaly burrs are found on the milled surface of titanium alloy TC21 (see Figure 6). From the height-color scale, the 3D image shows that the burrs have a certain height. Thus, the existence of burrs increases the roughness of the milled surface and deteriorates the surface quality. For the formation of scaly burrs, it may be since some large particles are introduced into the area between the machined surface and the tool flank. Under the squeezing effect, the particles form craters and scratches on the machined surface. The large particles may be produced in two forms; one is the shedding of the tool surface bonding, and the other is the deposition of debris.
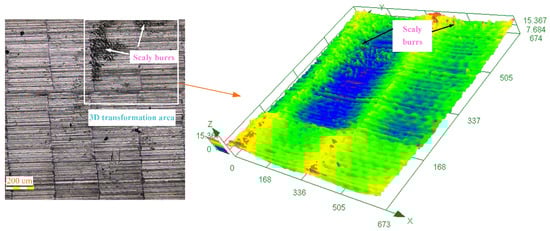
Figure 6.
Scaly burrs of the milled surface.
For the MQL machining environment, a barklike machined surface tends to appear when the feed rate is excessively high (see Figure 7). This is because the plastic deformation ability of titanium alloy becomes weaker under the MQL condition due to the lubrication and cooling effect of high-pressure oil mist. Extrusion cracking or expansion behavior of the deformation zone may occur suddenly when the workpiece has little deformation, forming extrusion cracks and unit chips during the cutting process. Meanwhile, tearing dimples are left on the machined surface. As the cutting process proceeds, the workpiece expands along the defective direction of the material tissue under the pushing and squeezing effect of the tool flank, and eventually, cracks are formed.
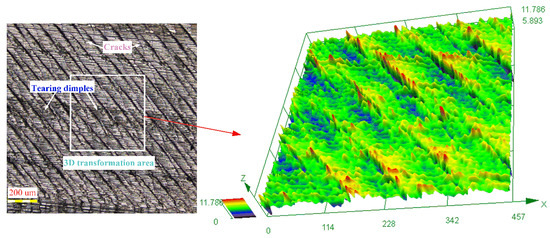
Figure 7.
Tearing dimples and cracks.
During the high-pressure air cooling and dry milling process, black scars can be easily observed on the machined surface (see Figure 8). Especially, the most scars are observed on the dry milling surfaces and these substances cannot be rinsed off by alcohol after machining. The black scars may be caused by the high temperature in the dry milling and high-pressure air cooling cutting area, which easily oxidizes some elements in the titanium alloy material or tool. The secondary oxides are deposited on the original titanium alloy surface, forming black scars. If the flushing is not timely after machining or there are deep cracks on the machined surface, large black oil stains are easily deposited on the surface. In Figure 8, both the secondary material and the oil deposited areas are shown as yellow scars. From the height-color scale, this indicates that the height of these deposited areas is greater than other areas. Therefore, both secondary material deposition and oil stains affect the surface roughness of milled titanium alloy TC21 and reduce the surface quality.
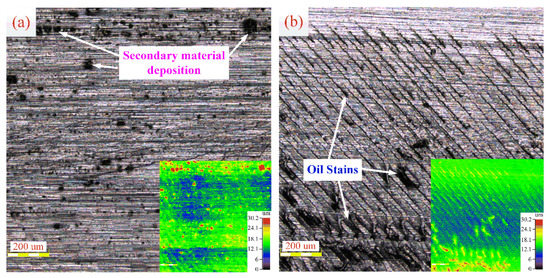
Figure 8.
Surface defect: (a) secondary material deposition; (b) oil stains.
3.1.2. Influence of Milling Parameters on the Surface Microscopic Topography of the Milled Workpiece
Figure 9 shows the surface topography of the machined workpiece at different milling speeds. In Figure 9, the banding bulges of the workpiece surface are significantly more severe at low speed, with longer and greater height. At the same speed of 9.42 m/min, the surface deformation is lower with the MQL method compared to dry milling. Under dry milling condition, the machined surface appears blue due to the chemical reaction of some elements in the titanium alloy at high temperature.
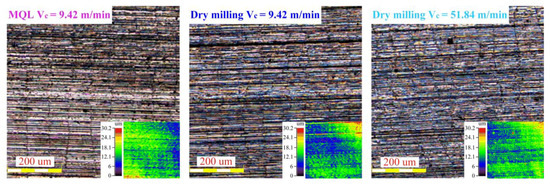
Figure 9.
The surface topography of the machined workpiece at different milling speeds.
The surface topography of the machined workpiece at different radial cutting depths is shown in Figure 10. When the radial cutting depth increases from 0.8 mm to 1.6 mm, the surface deformation and the black scars formed on the side milling surface due to the secondary material deposition increase significantly. However, under the MQL condition, few superficial black scars could be observed at the radial cutting depth of 1.6 mm. This may be because MQL reduces the temperature in the cutting area, which is detrimental to the oxidation of elements and prevents the formation of black scars on the machined surface.
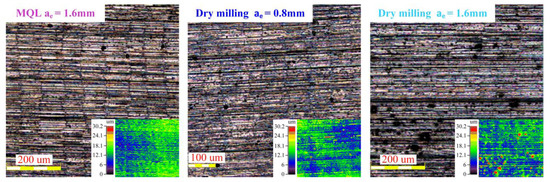
Figure 10.
The surface topography of the machined workpiece at different radial cutting depths.
The surface topography of the machined workpiece at different axial cutting depths is shown in Figure 11. When the axial cutting depth is 1 mm and 2 mm, there is no significant difference in surface morphology. It indicates that within the experimental parameters, the axial cutting depth has little effect on the microstructure of the milled surface. Although the increase of axial cutting depth will increase the milling force accordingly, the milling area will also increase proportionally. This causes little change in force per unit milling area after the change in axial cutting depth. Thus, the microscopic topography of the milled surface does not change significantly.
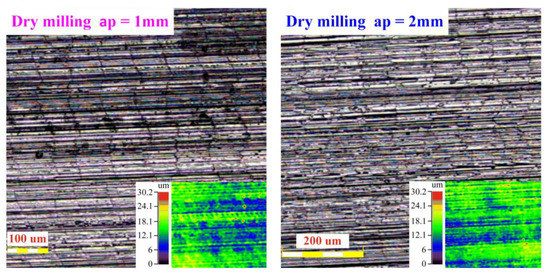
Figure 11.
The surface topography of the machined workpiece at different axial cutting depths.
Figure 12 shows the surface topography of the machined workpiece at different feeds per tooth. When the feed per tooth is 8.33 μm/z, the height distribution of the surface is uniform for both dry milling and MQL conditions, but there are slight banding bulges on the surface. The banding bulges under MQL condition are caused by the feeding tool marks, while the banding bulges on the machined surface are raised due to high-temperature plastic deformation under dry milling condition. When the feed per tooth is increased to 33.33 μm/z, the feeding tool marks under MQL condition become apparent and the height of the residual material in the feeding tool marks increased significantly. In contrast, although little feeding tool marks are observed for the dry milling condition, a large amount of secondary material deposition appears.
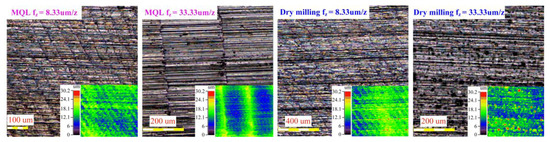
Figure 12.
The surface topography of the machined workpiece at different feeds per tooth.
3.1.3. Effect of MQL on the Microscopic Topography of Milled Workpiece
MQL is a green machining method that uses the high-pressure oil mist to cool and lubricate the machining area. The number and position settings of the high-pressure oil mist nozzles, air pressure, and lubrication amount used all affect the lubrication effect of MQL. Figure 13 shows the surface topography of the machined workpiece at different lubrication amounts. According to Figure 13, it can be seen that under MQL machining condition, when the lubrication amount is 40 mL/h, the feeding tool marks are more obvious compared to dry milling. Compared with the lubrication amount of 80 mL/h, there are more banding bulges on the bottom surface of slot milling, which is caused by plastic deformation. Thus, when the lubrication amount is 40 mL/h, it cannot improve the plastic deformation of the workpiece surface caused by the extrusion of cutting heat and tool flank. The cooling effect from the high-pressure oil mist makes feeding tool marks more obvious.
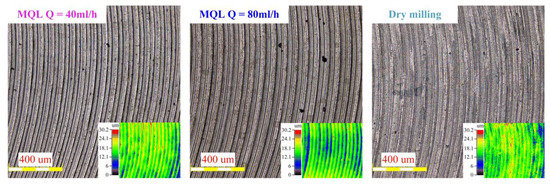
Figure 13.
The surface topography of the machined workpiece at different lubrication amounts.
The rational selection of MQL amount is of great significance. When the amount of lubricating oil is too small, not only can it not effectively improve the surface quality, but it can also make the surface quality deteriorate sharply. In MQL machining, there is a critical amount of lubricating oil. When the critical amount is reached, a stable lubricant film is formed between the workpiece and the milling cutter. After that, increasing the lubrication amount used does not improve the quality of the oil film, and the lubrication effect does not change significantly.
3.1.4. Effect of Tool Wear on the Microscopic Topography of the Milled Workpiece
The high chemical activity and low thermal conductivity of titanium alloys make them extremely susceptible to tool wear during the cutting process. In turn, the worn tool can affect the integrity of the milled surface. To investigate the form and extent of the effect of tool wear on the milled surface of titanium alloys, a worn milling cutter with VB = 0.1 mm is used to milling titanium alloy TC21 under MQL condition. The surface topography of the machined workpiece is shown in Figure 14. According to Figure 14, it can be seen that the scraping effect between the workpiece and the worn tool causes scratches on the machined surface and makes the surface rough. Since the weakened plastic deformation ability of the workpiece under MQL condition, when the worn tool scrapes against the feeding tool marks, it will squeeze the residue material of the feeding tool marks and make it come off in blocks or flakes, which leaves pits.
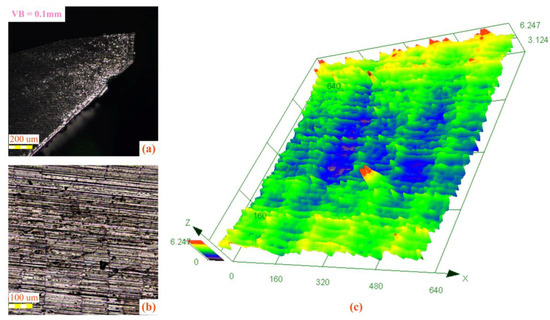
Figure 14.
The surface topography of the machined workpiece, (a) tool wear, (b) two-dimensional topography, and (c) three-dimensional topography.
3.2. Effect of Milling Parameters and Lubrication Parameters on the Surface Roughness of the Milled Workpiece
The stability, contact stiffness, corrosion resistance, fatigue strength, and wear resistance of machine parts are closely related to the machined surface roughness. During the milling process, feeding tool marks, scratches, plastic deformation, and secondary material deposition affect the machined surface roughness [29,30]. According to the study in the previous section, the use of different lubrication methods can also have a significant effect on the milling surface roughness. The feeding tool marks have the greatest effect on the machined surface roughness for the MQL environment. In contrast, under the high-pressure air-cooling and dry milling conditions, the surface roughness is greatly affected by the banding bulges on the workpiece surface caused by the plastic deformation and by the secondary material deposition resulting from the chemical reaction of the TC21 surface. According to the ISO 25178 standards, surface roughness is described by Sa and Sq parameters.
3.2.1. Effect of Milling Parameters on the Surface Roughness of the Milled Workpiece
The trends of the surface roughness with the milling parameters for different machining methods are shown in Figure 15, Figure 16, Figure 17 and Figure 18. From the experimental results, the surface roughness for the high-pressure air cooling condition is slightly higher than that of the dry milling condition. Compared with dry milling and high-pressure air cooling, the surface quality of the workpiece is the best under MQL condition. This is because the use of lubricant can well improve the tool–workpiece contact condition and reduce the scraping effect between the workpiece and the milling cutter. In addition, the reduction of cutting temperature reduces plastic deformation and scraping on the milled surface.
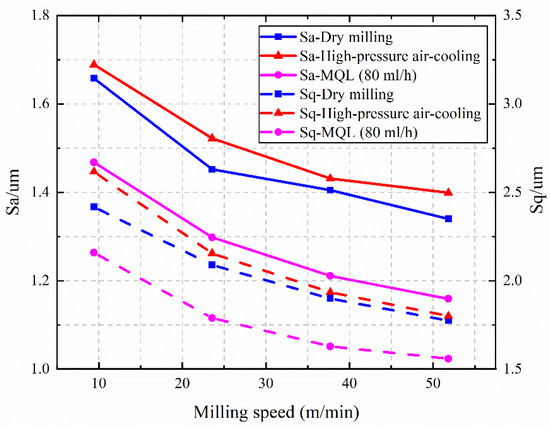
Figure 15.
The effect of milling speed on surface roughness Sa and Sq. μm/z).
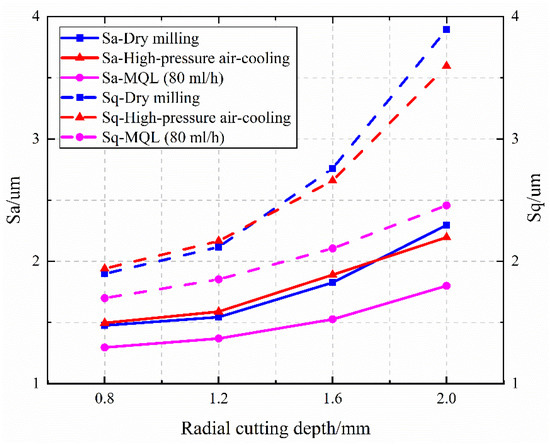
Figure 16.
The effect of radial cutting depth on surface roughness Sa and Sq. μm/z).
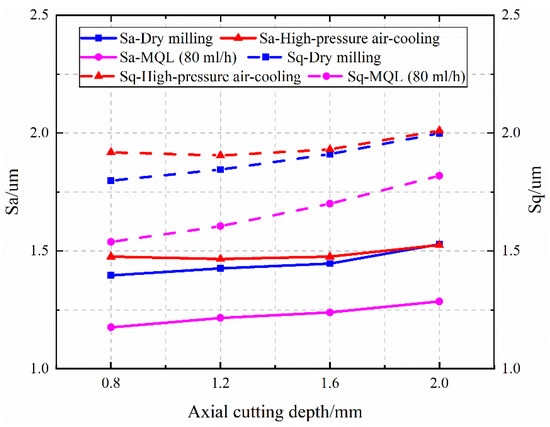
Figure 17.
The effect of axial cutting depth on surface roughness Sa and Sq. .
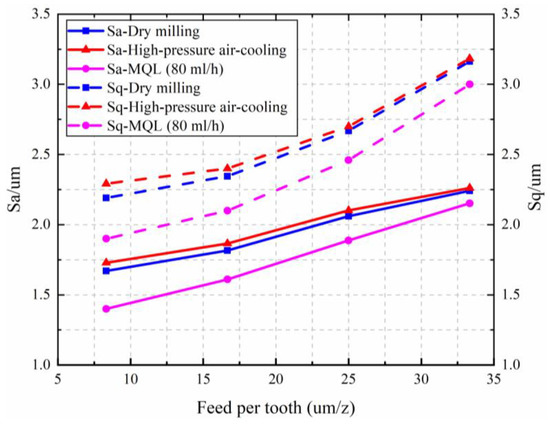
Figure 18.
The effect of feed per tooth on face roughness Sa and Sq. .
Figure 15 and Figure 16 show the effects of milling speed and radial cutting depth on the surface roughness Sa and Sq, respectively. As the milling speed increases, the surface roughness slowly decreases. With the increase of radial cutting depth, the surface roughness under dry milling condition increases rapidly. MQL can effectively suppress the generation of secondary material deposition. Thus, the surface roughness changes more slowly with radial cutting depth under the MQL condition compared with the dry milling condition.
Figure 17 shows the effect of axial cutting depth on surface roughness Sa and Sq. From Figure 17, it can be seen that the axial cutting depth has less effect on the surface roughness. With the increase of axial cutting depth, the surface roughness Sa and Sq change hardly. Although the increase of axial cutting depth will cause a corresponding increase in milling force, the milling area will also increase approximately proportionally. Thus, the change of the force per unit milling area does not vary significantly with axial cutting depth. Since plastic deformation is the result of the comprehensive effect of force and heat, the amount of plastic deformation on the milled surface is small. As a result, the machining efficiency can be increased by appropriately increasing the axial milling depth.
Figure 18 shows the effect of feed per tooth on the surface roughness Sa and Sq. With the increase of feed per tooth, the machining quality of the milled surface becomes worse and the surface roughness increases. Banding bulges and secondary material deposition are the causes of increased roughness of the milled surface under dry milling and high-pressure air cooling conditions. In contrast, the residual feeding tool mark is the primary factor affecting the surface roughness under the MQL condition. From the experiments, the radial cutting depth affects the surface roughness significantly under high-pressure air cooling and dry milling conditions. It is the axial cutting depth that has the least effect on surface roughness in all three environments. Since the lubrication and cooling effect of high-pressure oil mist can reduce the scraping between the milling cutter and workpiece, MQL can effectively suppress the plastic deformation of the workpiece surface. Although the feeding tool marks are obvious, the surface roughness is still significantly reduced and the machined surface quality is improved.
3.2.2. Effect of Lubrication Parameters on the Surface Roughness of the Milled Workpiece
By the effects of the lubrication parameters on the microscopic topography of the milled surface in the previous section, it can be seen that MQL does not always improve the surface quality. When the lubrication amount is low, MQL may deteriorate the surface quality of the workpiece. Figure 19 shows the trend of the surface roughness with the lubrication parameters. As can be seen from Figure 19, when the lubrication amount of MQL is 40 mL/h, the roughness of the milled surface is the largest. This is because the low lubrication amount does not effectively suppress the plastic deformation of the titanium alloy and makes the feeding tool mark more obvious. When the lubrication amount of MQL increases to 80 mL/h, the roughness of the milled surface decreases rapidly. At this time, a stable lubricant film is formed between the milling cutter and workpiece, which can reduce the scraping effect and inhibit the plastic deformation of the workpiece surface. When the lubrication amount increases to 120 mL/h, the roughness Sa and Sq change hardly. It indicates that when the lubrication amount reaches a certain value, continuing to increase the lubrication amount has a limited effect on the surface roughness of the workpiece.
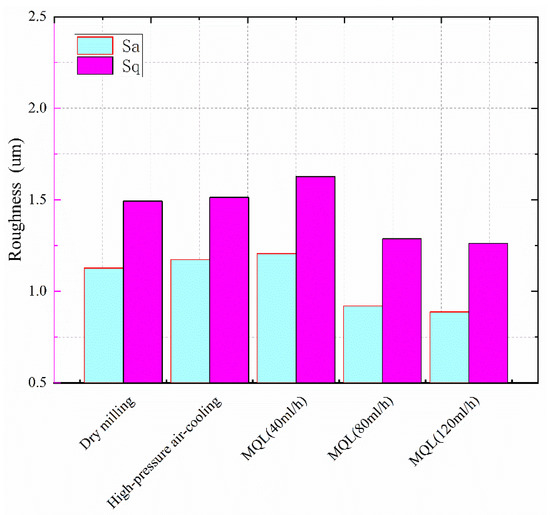
Figure 19.
The trend of the roughness of the milled surface with the lubrication parameters.
3.3. Effect of Milling Parameters and Lubrication Parameters on the Surface Hardening of Milled Workpiece
During the milling process, plastic deformation occurs on the machined surface, causing twisting and deformation of the machined surface grains. The twisted deformation of the grains in turn can inhibit the plastic deformation of the material. The elongation and fibrillation of the grains can have a strengthening effect on the surface layer of the workpiece, forming a work-hardening layer. Surface hardening is the result of the comprehensive effect of a thermally coupled inhomogeneous stress field on the machined surface. The machining hardening phenomenon is widespread during the milling process. Milling parameters, lubrication methods, lubrication amount, and workpiece material can affect the hardening of the machined surface [31,32,33,34].
3.3.1. Effect of Milling Parameters on the Surface Hardness of the Milled Workpiece
In this section, the variation of the microhardness of titanium alloy TC21 with milling parameters will be studied. The microhardness values of the machined surface are the result of the comprehensive effect of material hardening and softening of the workpiece surface. Titanium alloy TC21 consists of isometric, spherical α-phase, and β-phase. The volume fraction of the β-phase, which is the hardening phase becomes larger during milling, which leads to the hardening of the workpiece surface [35]. The titanium element is chemically active at high temperatures, and the machining surface tends to form a hard and dense film of titanium oxide and titanium nitride, which also increases the degree of surface hardening. In addition, the poor thermal conductivity of titanium alloys, and the concentration of milling heat on the workpiece surface will cause thermal softening of the machined surface layer. The experimental results show that the substrate hardness of TC21 is in the range of 320–340 HV. During the milling of TC21, The hardening effect caused by the deformation and chemical reaction of the material tissue is stronger than the softening effect caused by the milling heat. This is manifested in the results as a surface hardening phenomenon, in which the surface microhardness is higher than that of the substrate.
According to the experimental results, the variation of the surface microhardness with the machining parameters under dry milling condition can be obtained as shown in Figure 20. The microhardness of titanium alloy TC21 becomes larger with the increase of milling speed, radial cutting depth, and feed per tooth, while the effect of axial cutting depth on the microhardness of the machined surface is small. The milling force increases with the increase of axial cutting depth, but the increase of axial cutting depth also leads to the increase of milling area in the same proportion. The cutting force and heat per unit area vary little. Thus, the axial cutting depth has little effect on the hardness of the milled surface. With the increase in milling speed, radial cutting depth, and feed per tooth, the milling temperature will increase accordingly, which will lead to an increase in softening effect. However, the milling heat also causes an increase in the oxidation of titanium elements. Meanwhile, the elongation and fibrillation of the internal grains of the material will become more prevalent. This leads to a greater hardening effect than softening effect on the workpiece surface. As a result, the surface hardness becomes greater with increasing radial cutting depth, milling speed, and feed per tooth.
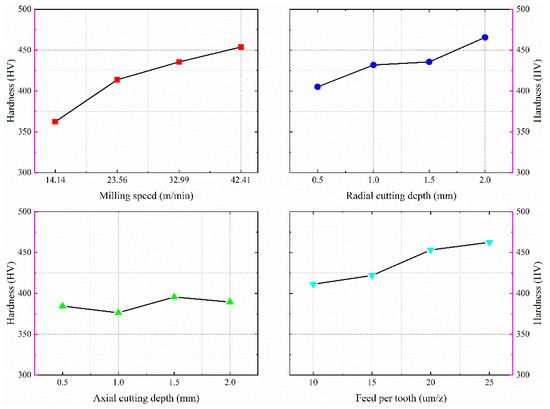
Figure 20.
The effect of milling parameters on surface microhardness.
3.3.2. Effect of Lubrication Parameters on the Hardness Distribution of the Milled Workpiece
In this section, the hardness distribution of the titanium alloy surface is measured using the cross-sectional method. The milled TC21 workpiece is cut to obtain a cross-section perpendicular to the machined surface, and the cross-section is ground using sandpaper and finely polished. Figure 21 shows the hardness distribution of the surface layer for different machining methods (dry milling, MQL1 (40 mL/h), MQL2 (80 mL/h)). MQL can reduce the temperature in the machining area and effectively mitigate the thermal softening effect of the machined surface. The lubricant can effectively improve the contact condition of the milling cutter and workpiece and reduce the deformation degree of the machined surface. Meanwhile, the lubricant film attached to the workpiece surface prevents the titanium element from coming into contact with the air, thus inhibiting the formation of a dense oxide film on the workpiece surface. The reduction of surface hardening caused by the weakening of material deformation and chemical reaction is stronger than the strengthening of surface hardening caused by the weakening of thermal softening. Thus, the hardness of the machined surface decreases after using MQL compared to dry milling.
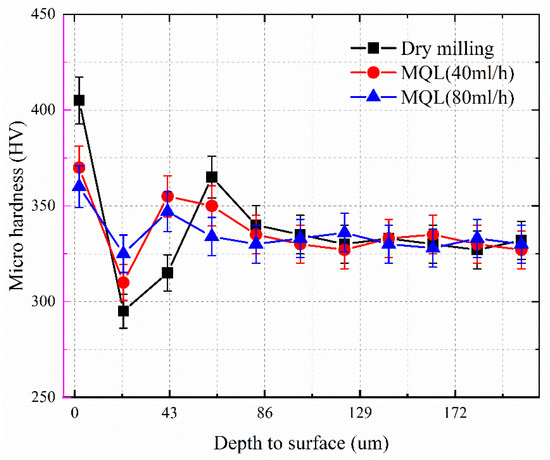
Figure 21.
The microhardness distribution of the surface layer.
As can be seen from Figure 21, the trend of hardness variation along the depth of the surface layer is similar, and both go through the process of surface hardening, softening, rehardening, and stabilization in the substrate hardness. The milling heat is transferred to a narrow area where the heat is enriched during the milling process. The material is thermally softened to form a material softening layer. The microhardness in this area decreases rapidly compared to the workpiece surface. Dry milling has the widest softening layer since the massive cutting heat is transferred to the surface. Meanwhile, the minimum hardness value at the softening layer is the smallest in all three lubrication environments. For MQL (80 mL/h), the softening layer is the narrowest. The minimum hardness value of the softened layer is the largest as the least amount of cutting heat is transferred to the machined surface. Due to the thermal expansion of the material, the internal material adjacent to the softened layer is squeezed by the softened layer, which leads to dislocations and increases the density of the material. Eventually, rehardening of the material is caused.
4. Validation of Surface Roughness Model and Process Parameter Optimization
4.1. Establishment of Surface Roughness Model Considering Milling Cutter Vibration
The surface profile of a milling process is formed by the marks left on the workpiece surface after the milling cutter has finished cutting. The shape of the milling cutter, machining method, machine vibration, and other factors will affect the surface profile of the workpiece. The surface roughness is an important criterion for evaluating the surface quality of the milled workpiece [36]. Thus, the surface roughness of the milled workpiece needs to be analyzed and predicted from a theoretical point of view.
4.1.1. Establishment of the Vibration Model of Milling Cutter
In the modeling process of the vibration of the milling cutter, the effect of tool runout on the machining process is ignored. The milling cutter is assumed to be a uniform continuous system (uniform simply supported beam of equal cross-section), which means that the density, cross-sectional area, and stiffness of the milling cutter do not vary with position. During the milling process, the milling cutter is held by the knife clip at one end and is in contact with the workpiece at the other end. Therefore, the vibration model of the milling cutter can be simplified to a fixed-hinged beam system subjected to concentrated forces. The force model of the milling cutter is shown in Figure 22.
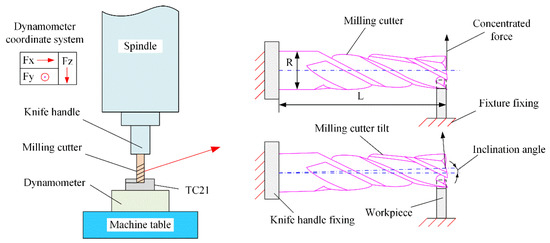
Figure 22.
Force model of the milling cutter.
Let the intrinsic frequency at a given boundary condition be and the corresponding formation function be . For a homogeneous beam of equal cross-section, the intrinsic frequency can be expressed as [37,38]:
where E is the modulus of elasticity, J is the moment of inertia of the section, A is the cross-sectional area, and ρ is the mass per unit volume. L is the overhanging length of the milling cutter, and is the characteristic root of Equation (2). For the fixed-hinged beam system, the characteristic roots of Equation (2) can be expressed as [39]:
where , denotes the order. Based on the above assumptions about the vibration model, the formation function of the milling cutter can be expressed as:
where denotes the hyperbolic function and is a function related to the intrinsic frequency and material properties:
Since the stiffness of the milling cutter in the axial direction is much greater than that in the radial direction, the milling machining system can be assumed as a two-degree-of-freedom system (x and y directions). As the solution process of the vibration model in the x and y directions is the same, for the sake of simplicity, only the solution process in the x-direction is discussed. Assume that the force applied to the milling cutter in the x-direction is the concentrated force , which can be expressed as:
where denote the δ function. For a homogeneous beam of equal cross-section, the vibration differential equation can be expressed as [40]:
Introducing the regular coordinates , based on the formation superposition method, the solution for a given boundary condition can be expressed as [41]:
The vibration differential equation (Equation (7)) can be expressed as:
The boundary conditions of the fixed-hinged beam system can be expressed as [42]:
Regularize both sides of Equation (9) while integrating over the entire interval . An independent system of ordinary differential equations is obtained as follows [43]:
where is the generalized force corresponding to the canonical coordinate . When acts on the end of the milling cutter, the generalized force can be expressed as:
Combined with the previous studies, the response of Equation (12) is [44,45]:
Substituting into the canonical equation (Equation (12)):
For the fixed-hinged beam system, . Ultimately, the vibration response at the end of the milling cutter in the x-axis direction is:
During the milling process, the milling force is a force that varies from moment to moment. Milling force and vibration displacement exist in a mutually coupled relationship. To find the milling cutter displacement in the vibration state, the time is discretized into multiple tiny moments. For the period , the milling force in the x-direction is approximated by considering it as a constant force (see Figure 23):
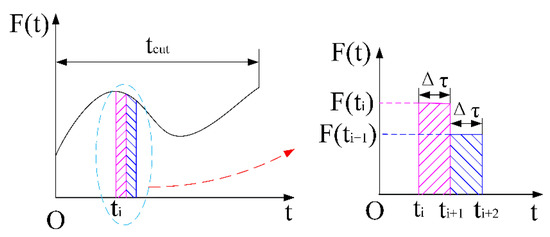
Figure 23.
The discrete model of the milling force.
For the convenience of calculation, the formation function is only taken to the first three orders. The discretized equation can be expressed as:
Similarly, the vibration response of the milling cutter in the x-direction can be found. Therefore, the vibration response of the end of the milling cutter during milling can be expressed in vector form as:
It is worth noting that the coordinate systems of the dynamometer and the milling cutter are different. Regarding the x-direction, the directions specified in both coordinate systems are the same. Regarding the y- and z-directions, they are opposite in both coordinate systems.
4.1.2. Surface Roughness Model Considering Milling Cutter Vibration
In previous studies, the trajectory of the milling cutter was usually generated by the radial runout and tilt runout of the milling cutter [46,47,48]. As the milling cutter rotates, the position and trajectory of each point on the cutting edge of the milling cutter will deviate from the ideal value. In this study, the radial runout of the milling cutter is ignored since the milling cutter moves in the x-direction as a feed. For the tilt runout, it is attributed to the inclination between the milling cutter axis and the machine spindle due to the vibration of the milling cutter. Figure 24 shows the creation of surface topography.
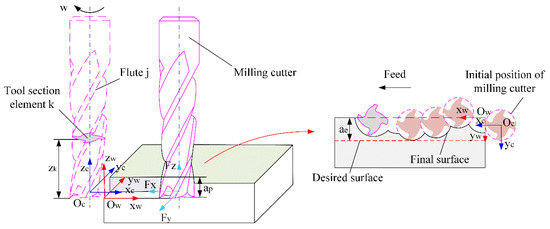
Figure 24.
The creation of surface topography.
Before the creation of the surface topography, the tool coordinate system (Oc-xc-yc-zc) and the workpiece coordinate system (Ow-xw-yw-zw) are established. The origin of the tool coordinate system is set to the projection of the bottom center of the milling cutter on the workpiece. For easy calculation, it is necessary to discretize the milling cutter along the axial direction. Under ideal conditions, when , the coordinate values of the cutting edge at the moment can be expressed as [49]:
where j denotes the jth flute, k denotes the kth unit in the axial direction, denotes the milling speed, and denotes the spindle speed. , is the number of teeth of the milling cutter. R = 6 mm is the radius of the milling cutter. denotes the thickness of the axial unit. is the helix angle of the flathead milling cutter, and is the axial milling depth. For the axial coordinate values, is written as for a uniform expression form.
When the vibration responses of the milling cutter in the x- and y-directions are and , respectively, the tilt angle τ of the milling cutter can be expressed as:
In this study, the position angle of the tilt angle is defined as the angle between the tilt direction of the milling cutter and the x-direction in the x–o–y plane. According to the direction of the force on the milling cutter, the position angle takes a range of . The position angle can be expressed as:
Once the tilt angle and the position angle of the milling cutter are determined, the coordinates of the cutting edge of the milling cutter under vibration response can be obtained by rotating (around the y-axis and z-axis) and translating the coordinate values in the ideal condition. The real coordinates of the cutting edge can be expressed as:
For simplicity of representation, the coordinate values of the cutting edge can be expressed as:
Combined with the previous studies, the undeformed cutting thickness can be derived from two adjacent cutting-edge trajectories (see Figure 25) [36,49]. Suppose there exist two points P and Q. The point P is any point on the j-th flute trajectory. The point Q is the intersection of the j-th flute trajectory and the line from the tool center O to the point P. denote the time corresponding to the cutting edge passing through the points P and Q, respectively.
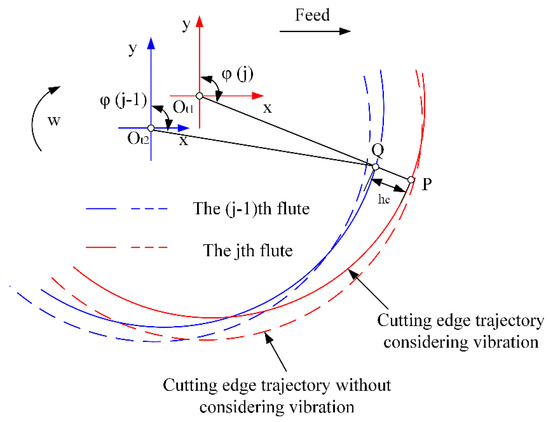
Figure 25.
Analysis of the cutting-edge trajectory.
The undeformed cutting thickness considering the vibration of the milling cutter during milling can be expressed as:
The coordinates of the point P can be expressed using Equation (26):
For the point Q, the coordinates can be expressed as:
Since the time corresponding to point P is the current time, the coordinates corresponding to point P can be obtained by Equation (26). For the coordinates of point Q, they can be calculated by the position relationship between point , point P, and point Q. Since point , point P, and point Q are located in a straight line, the coordinate relationship between the three points can be expressed as:
By iterating the Equation (28), the coordinates of point Q can be obtained where denotes the contact angle of the j-th flute of the milling cutter, which can be expressed as [36]:
The minimum cutting thickness in the milling process is an important factor affecting the surface roughness. Based on the geometric parameters of the surface roughness and the minimum cutting thickness, the surface roughness model considering the vibration of the milling cutter is established. When the undeformed cutting thickness is less than the minimum cutting thickness , the material deformation of the workpiece surface is dominated by the plowing effect under the extrusion of the cutting edge of the milling cutter. When the undeformed cutting thickness gradually increases to the minimum cutting thickness, the milling process is dominated by the shear effect and the elastic response of the workpiece is negligible.
According to the radius of the cutting edge of the milling cutter and the material properties, the minimum cutting thickness is expressed as [36]:
where, is the minimum cutting thickness proportionality constant, and is the radius of the cutting edge. Based on the relationship between the minimum cutting thickness and the undeformed cutting thickness on the milling mechanism, the actual undeformed cutting thickness can be expressed as [49]:
where denotes the elastic recovery rate.
Combining the above derivation, the actual cutting-edge trajectory considering the vibration response of the milling cutter and the minimum cutting thickness of the workpiece can be derived. When , the actual cutting-edge trajectory can be expressed as:
When , the actual cutting-edge trajectory can be expressed as:
In this study, the evaluation index of surface roughness is the arithmetic mean height of the surface . The object of evaluation is the milling side surface, which is . From the relationship between the workpiece coordinate system and the milling cutter coordinate system, when , the coordinates of any point in the workpiece coordinate system can be expressed as:
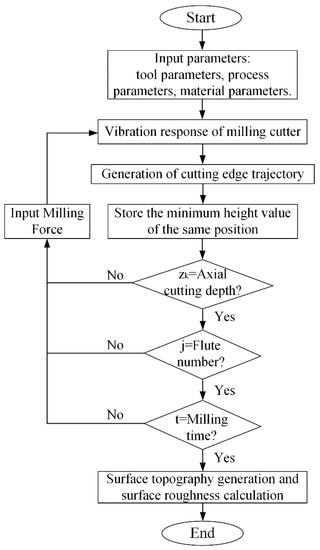
Figure 26.
The modeling process of surface roughness.
4.2. Validation of Surface Roughness Model
Sixteen sets of orthogonal experiments were designed according to the level and factor variations in Table 3, as shown in Table 4. In this section, the validation of the surface roughness model and the optimization of the process parameters will be studied according to the experimental parameters in Table 4.
Table 4.
The orthogonal experiments.
The comparison between the theoretical and experimental values obtained by the surface roughness model is shown in Figure 27. From Figure 27, the theoretical and experimental values are in good agreement. In the orthogonal experiments, the maximum value of error occurs in one of the experiments with an error value of 18.19%. The minimum value of error is 5.98%. The error values of all experiments are within 20%. In Figure 27, the theoretical value of surface roughness differs from the experimental value as the milling speed increases. This may be because the vibration frequency of the milling cutter-spindle system at this milling speed is close to the intrinsic frequency of the machine system. The vibration amplitude and deflection deformation of the milling cutter increases accordingly. This leads to a large deviation of the tool trajectory from the theoretical trajectory. Thus, the prediction accuracy of the surface roughness model decreases as the milling speed increases. It is worth noting that the theoretical values of surface roughness are all smaller than the experimental values because this model does not consider the effects of surface burrs and tool wear.
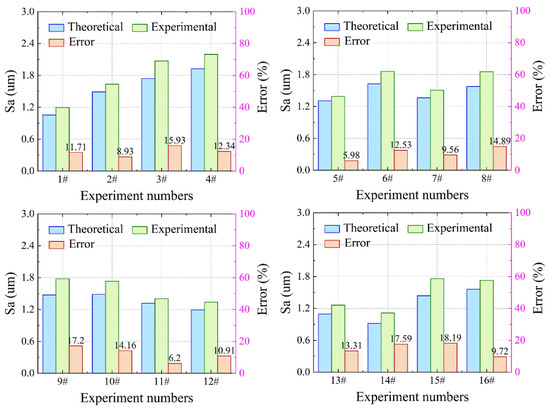
Figure 27.
The comparison between the theoretical and experimental values.
4.3. Parameters Optimization Based on Taguchi-Grey Correlation Method
The analysis of signal–noise ratio SNR is a meritocratic process. By selecting the optimal level combination of all parameters in the system, the designed product has a strong resistance to disturbances and robustness, and the fluctuation of the product quality characteristic is gentle. In this section, the surface roughness and the milling force are selected as the corresponding objectives. It is expected to improve the cutting performance and obtain high machining accuracy by designing for small milling forces and surface roughness. According to the desired characteristics of the corresponding objectives, the signal–noise ratio SNR can be expressed as [50,51]:
where denotes the number of experimental repetitions, and denotes the objective value of the i-th experiment. According to the experimental results of the corresponding objectives, the SNR for the surface roughness and milling force is shown in Table 5.
Table 5.
Results of orthogonal experiments and SNR of corresponding objectives.
The variance analysis based on the Taguchi method is suitable for single-objective optimization. Multiobjective optimization can be performed by transforming multiple response objectives into a single gray correlation degree value using gray correlation theory, which includes three steps of normalization, calculation of gray correlation coefficient, and calculation of gray correlation degree. The SNR results are taken as the original data and quantified as follows [52]:
where, denotes the standardized response objective, and denotes the objective value in the i-th group of experiments.
The gray correlation coefficients of the response objectives are calculated as follows [52]:
where denotes the number of gray correlation coefficients, and denotes the ideal normalized value in the ith group of experiments, which is equal to 1 in the calculation. is the discrimination coefficient, which is equal to 0.5. The gray correlation is calculated as follows [52]:
where denotes the total number of experiments to be arranged, and denotes the gray correlation.
Combining the derivation of the above formulas and experimental results, the mean response for gray correlation grade can be obtained in Table 6.
Table 6.
The mean response for gray correlation grade .
According to Table 6, the mean response diagram of the gray correlation for each factor can be obtained (see Figure 28). From Figure 28, it can be seen that the combination of process parameters that satisfies both roughness and milling force F with STB characteristics is . Combining the contents of Table 3, the milling speed is 42.41 m/min, the radial and axial cutting depths are 0.5 mm, and the feed per tooth is 10 μm/z. The combination of parameters is not included in the orthogonal experiments table (Table 4).
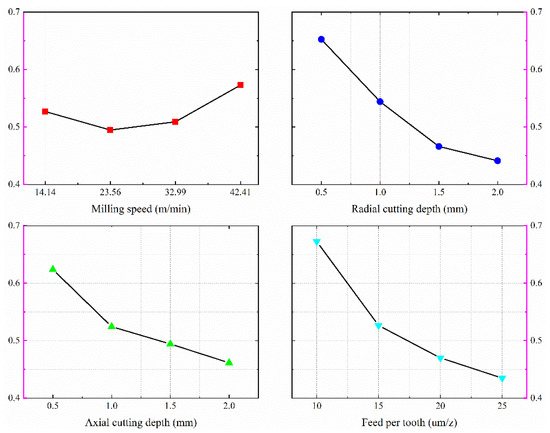
Figure 28.
The mean main response for gray correlation.
The titanium alloy TC21 workpiece is milled using the optimized milling parameters, and the milled surface is shown in Figure 29. The experimental results show that the surface roughness and the milling force are 1.046 μm and 6.251 N, respectively. The SNR of surface roughness and milling force is calculated to be −0.391 and −15.919, respectively. Compared with the experimental results of No. 5# (in Table 4), the surface roughness is reduced by 0.343 μm, and the milling force F is reduced by 6.259 N. The gray correlation is also greater than that of No. 5#. Thus, the optimized machining parameters can meet the requirements of improving the surface quality of the machined workpiece and reducing the milling force.
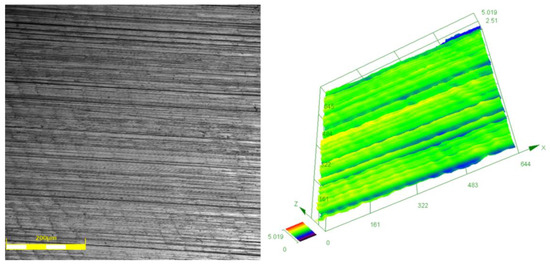
Figure 29.
The milled surface of titanium alloy TC21 with optimized parameters.
5. Conclusions
In this study, titanium alloy TC21 is milled using a coated tool (coated with TiAlN, and the substrate material is mainly WC) under three lubrication methods (dry, high-pressure air cooling, and MQL). By analyzing the surface topography, roughness, and microhardness of the milled titanium alloy TC21, the main findings may be as follows:
- In terms of microscopic topography, the defects on the milled machined surface mainly include feeding tool marks and surface scratches, banding bulges, scaly spurs, tearing dimples and cracks, and secondary material deposition. Under high-pressure air cooling and dry milling conditions, the feeding tool marks on the machined surface are not obvious due to the thermoplastic deformation. Plastic deformation of the milled surface is the main factor affecting surface roughness. When the machining parameters are too large, a great amount of black scars will be formed on the dry milling surface, which affects the surface machining quality. Under the MQL condition, the feeding tool marks are the most important factor affecting the surface quality of titanium alloy TC21.
- In terms of surface roughness, the effect of radial cutting depth on surface roughness increases under high-pressure air cooling and dry milling conditions. Under the MQL condition, the lubrication and cooling effect of high-pressure oil mist can reduce the scraping between the tool and workpiece surface and reduce the plastic deformation of the machined surface. Although the feeding tool marks are obvious, the surface roughness is still significantly reduced, and the machined surface quality is improved.
- The factors affecting the surface microhardness of titanium alloy TC21 come from three aspects: the thermal softening of the machined surface caused by cutting heat, the deformation and fibrillation of the internal grains of the material, and the dense oxide layer on the machined surface. The dry milling surface has the largest microhardness of the surface layer, the widest softening layer of subsurface, and the largest microhardness of the rehardening layer.
- A surface roughness model considering milling vibration is developed. In the orthogonal experiments, the maximum error between the theoretical values and the experimental values is 18.19%. The minimum value of error is 5.98%. The error values of all experiments are within 20%. Therefore, the model can be considered valid and acceptable. It is worth noting that the theoretical values of surface roughness are all smaller than the experimental values because this model does not consider the effects of surface burrs and tool wear.
Author Contributions
Z.W.: Conceptualization, methodology, software, validation, formal analysis, data curation, writing—original draft, and writing—review and editing. H.L.: Resources, supervision, and project administration. T.Y.: Funding acquisition and supervision. All authors have read and agreed to the published version of the manuscript.
Funding
This work was funded by the Major State Basic Research Development Program of China [No. 2017YFA0701200], and the Science and Technology Planning Project of Shenyang [No. 18006001].
Institutional Review Board Statement
Not applicable.
Informed Consent Statement
Not applicable.
Data Availability Statement
The datasets supporting the conclusion of this article are included within the article.
Conflicts of Interest
The authors declare no competing interests.
References
- Sharma, A.K.; Tiwari, A.K.; Dixit, A.R. Effects of Minimum Quantity Lubrication (MQL) in machining processes using conventional and nanofluid based cutting fluids: A comprehensive review. J. Clean. Prod. 2016, 127, 1–18. [Google Scholar] [CrossRef]
- Khanna, N.; Shah, P. Chetan Comparative analysis of dry, flood, MQL and cryogenic CO2 techniques during the machining of 15-5-PH SS alloy. Tribol. Int. 2020, 146, 106196. [Google Scholar] [CrossRef]
- Sun, H.W.; Zou, B.; Chen, P.; Huang, C.Z.; Guo, G.Q.; Liu, J.K.; Shi, Z. Effect of MQL condition on cutting performance of high-speed machining of GH4099 with ceramic end mills. Tribol. Int. 2021, 167, 107401. [Google Scholar] [CrossRef]
- Roushan, A.; Rao, U.S.; Patra, K.; Sahoo, P.B. Performance evaluation of tool coatings and nanofluid MQL on the micro-machinability of Ti-6Al-4V. J. Manuf. Process. 2021, 73, 595–610. [Google Scholar] [CrossRef]
- Korkmaz, M.E.; Gupta, M.K.; Boy, M.M.; Yaşar, N.; Krolczyk, G.M.; Günay, M. Influence of duplex jets MQL and nano-MQL cooling system on machining performance of Nimonic 80A. J. Manuf. Process. 2021, 69, 112–124. [Google Scholar] [CrossRef]
- Bagherzadeh, A.; Kuram, E.; Budak, E. Experimental evaluation of eco-friendly hybrid cooling methods in slot milling of titanium alloy. J. Clean. Prod. 2021, 289, 125817. [Google Scholar] [CrossRef]
- Su, Y.; Gong, L.; Li, B.; Liu, Z.Q.; Chen, D.D. Performance evaluation of nanofluid MQL with vegetable-based oil and ester oil as base fluids in turning. Int. J. Adv. Manuf. Technol. 2016, 83, 2083–2089. [Google Scholar] [CrossRef]
- Zhang, Y.B.; Li, C.H. Micro lubrication grinding mechanism and grinding force prediction model of vegetable oil-based nano particle jet and experimental verification. Chin. J. Mech. Eng. 2020, 56, 44. [Google Scholar]
- Behera, B.C.; Ghosh, S.; Rao, P.V. Modeling of cutting force in MQL machining environment considering chip tool contact friction. Tribol. Int. 2018, 117, 283–295. [Google Scholar] [CrossRef]
- Patole, P.B.; Kulkarni, V.V. Optimization of Process Parameters based on Surface Roughness and Cutting Force in MQL Turning of AISI 4340 using Nano Fluid. Mater. Today Proc. 2018, 5, 104–112. [Google Scholar] [CrossRef]
- Park, K.-H.; Yang, G.-D.; Suhaimi, M.A.; Lee, D.Y.; Kim, T.-G.; Kim, D.-W.; Lee, S.-W. The effect of cryogenic cooling and minimum quantity lubrication on end milling of titanium alloy Ti-6Al-4V. J. Mech. Sci. Technol. 2015, 29, 5121–5126. [Google Scholar] [CrossRef]
- Yang, D.; Liu, Z.Q.; Ren, X.P.; Zhuang, P. Hybrid modeling with finite element and statistical methods for residual stress prediction in peripheral milling of titanium alloy Ti-6Al-4V. Int. J. Mech. Sci. 2016, 108–109, 29–38. [Google Scholar] [CrossRef]
- Cai, Z.Y.; Chen, J.Y.; Du, P.; Xiang, T.; Chen, J.; Xie, G.Q. Mechanical behavior and microstructure control of the low-cost titanium-oxygen alloy prepared by ball milling and spark plasma sintering. J. Alloy. Compd. 2021, 887, 161349. [Google Scholar] [CrossRef]
- Brown, M.; M’saoubi, R.; Crawforth, P.; Mantle, A.; McGourlay, J.; Ghadbeigi, H. On deformation characterisation of machined surfaces and machining-induced white layers in a milled titanium alloy. J. Mater. Process. Technol. 2021, 299, 117378. [Google Scholar] [CrossRef]
- Wu, Y.; Chen, N.; Bian, R.; He, N.; Li, Z.; Li, L. Investigations on burr formation mechanisms in micro milling of high-aspect-ratio titanium alloy ti-6al-4 v structures. Int. J. Mech. Sci. 2020, 185, 105884. [Google Scholar] [CrossRef]
- Li, C.P.; Xu, M.R.; Yu, Z.; Huang, L.; Li, S.; Li, P.; Niu, Q.; Ko, T.J. Electrical discharge-assisted milling for machining titanium alloy. J. Mater. Process. Technol. 2020, 285, 116785. [Google Scholar] [CrossRef]
- Xu, M.R.; Li, C.P.; Kurniawan, R.D.; Park, G.C.; Chen, J.L.; Ko, T.J. Study on surface integrity of titanium alloy machined by electrical discharge-assisted milling. J. Mater. Process. Technol. 2021, 299, 117334. [Google Scholar] [CrossRef]
- Ahmadi, M.; Karpat, Y.; Acar, O.; Kalay, Y.E. Microstructure effects on process outputs in micro scale milling of heat treated Ti6Al4V titanium alloys. J. Mater. Process. Technol. 2018, 252, 333–347. [Google Scholar] [CrossRef] [Green Version]
- Sahoo, P.; Pratap, T.; Patra, K. A hybrid modelling approach towards prediction of cutting forces in micro end milling of Ti-6Al-4V titanium alloy. Int. J. Mech. Sci. 2019, 150, 495–509. [Google Scholar] [CrossRef]
- Mamedov, A.; Lazoglu, I. Thermal analysis of micro milling titanium alloy Ti–6Al-4V. J. Mater. Process. Technol. 2016, 229, 659–667. [Google Scholar] [CrossRef]
- Podulka, P. Suppression of the High-Frequency Errors in Surface Topography Measurements Based on Comparison of Various Spline Filtering Methods. Materials 2021, 14, 5096. [Google Scholar] [CrossRef] [PubMed]
- Giusca, C.L.; Leach, R.K.; Helary, F.; Gutauskas, T.; Nimishakavi, L. Calibration of the scales of areal surface topography-measuring instruments: Part 1. Measurement noise and residual flatness. Meas. Sci. Technol. 2012, 23, 035008. [Google Scholar] [CrossRef]
- Haitjema, H. Uncertainty in measurement of surface topography. Surf. Topogr. Metrol. Prop. 2015, 3, 35004. [Google Scholar] [CrossRef]
- Zhang, M. Effect of Heat Treatment on Microstructure and Properties of TC21 Titanium Alloy. Master’s Thesis, Northwestern Polytechnical University, Xi’an, China, 2004. [Google Scholar]
- Zhao, Y.Q.; Qu, H.L.; Feng, L.; Yang, H.Y. Development of high strength and high toughness damage tolerant titanium alloy TC21. Tita. Indus. Prog. 2004, 21, 22–24. [Google Scholar] [CrossRef]
- Yang, D. Study on Milling Surface Integrity of Titanium Alloy Ti-6Al-4V Based on Long Fatigue Life. Master’s Thesis, Shandong University, Jinan, China, 2017. [Google Scholar]
- Liu, C.; Ren, C.Z.; Wang, G.F.; Yang, Y.W.; Zhang, L. Study on surface defects in milling Inconel 718 super alloy. J. Mech. Sci. Technol. 2015, 29, 1723–1730. [Google Scholar] [CrossRef]
- Wang, T.; Xie, L.J.; Wang, X.B. Simulation study on defect formation mechanism of the machined surface in milling of high volume fraction SiCp/Al composite. Int. J. Adv. Manuf. Technol. 2015, 79, 1185–1194. [Google Scholar] [CrossRef]
- Yang, X.Y. Study on Tool Wear and Surface Integrity of Titanium Alloy Milling. Master’s Thesis, Tianjin University, Tianjin, China, 2013. [Google Scholar]
- Lu, Y.X. Study on Surface Integrity of Titanium Alloy Efficiently Milled by Cemented Carbide End Milling Cutter. Master’s Thesis, Xiangtan University, Xiangtan, China, 2016. [Google Scholar]
- Hua, Y.; Liu, Z.Q. Effects of cutting parameters and tool nose radius on surface roughness and work hardening during dry turning Inconel 718. Int. J. Adv. Manuf. Technol. 2018, 96, 2421–2430. [Google Scholar] [CrossRef]
- Alami, A.H.; Abu Hawili, A.; Chaker, N. Experiments on surface hardening of aluminum components by high-energy centrifugal milling. Int. J. Adv. Manuf. Technol. 2018, 95, 3855–3862. [Google Scholar] [CrossRef]
- Du, S.Y. Study on Machined Surface Integrity and Fatigue Properties of New Titanium Alloy. Master’s Thesis, Nanjing University of Aeronautics and Astronautics, Nanjing, China, 2017. [Google Scholar]
- Han, J.D. Experimental Study on Machined Surface Quality of Titanium Alloy TC11 Turning. Master’s Thesis, Harbin University of technology, Nanjing, China, 2017. [Google Scholar]
- Shi, Z.F. Study on Process Optimization and Relationship between Microstructure and Properties of TC21 Titanium Alloy. Master’s Thesis, Northwestern Polytechnical University, Xi’an, China, 2016. [Google Scholar]
- Zhang, X.W. Research on the Key Technology and Processing Mechanism of Micro-Milling. Ph.D. Thesis, Northeastern University, Shenyang, China, 2016. [Google Scholar]
- Loya, J.A.; Aranda-Ruiz, J.; Zaera, R. Natural frequencies of vibration in cracked Timoshenko beams within an elastic medium. Theor. Appl. Fract. Mech. 2022, 118, 103257. [Google Scholar] [CrossRef]
- Chen, S.; Geng, R.; Li, W. Vibration analysis of functionally graded beams using a higher-order shear deformable beam model with rational shear stress distribution. Compos. Struct. 2021, 277, 114586. [Google Scholar] [CrossRef]
- Capozucca, R.; Magagnini, E. Experimental vibration response of homogeneous beam models damaged by notches and strengthened by CFRP lamina. Compos. Struct. 2018, 206, 563–577. [Google Scholar] [CrossRef]
- Hong, G.Y.; Li, J.; Dong, J.L.; Ning, Y.; Pan, J.W. Frequency-dependent characteristics of grain-beam system: Negative mass and jump behaviour. Int. J. Mech. Sci. 2021, 209, 106706. [Google Scholar] [CrossRef]
- Newland, D.E.; Ungar, E.E. Mechanical Vibration Analysis and Computation. J. Acoust. Soc. Am. 1990, 88, 2506. [Google Scholar] [CrossRef]
- Dimitrovová, Z. A general procedure for the dynamic analysis of finite and infinite beams on piece-wise homogeneous foundation under moving loads. J. Sound Vib. 2010, 329, 2635–2653. [Google Scholar] [CrossRef]
- Li, X.Z.; Zhang, Z.J.; Liu, Q.M. Analysis on Vertical Dynamic Response of Simply Supported Beam Bridge under Successive Moving Loads. J. Vib. Shock. 2012, 31, 137–142. [Google Scholar]
- Duan, M.F.; Jiang, C.; Li, J.W.; Ni, B.Y. Dynamic response boundary analysis and application of elastic simply supported beam excited by uncertain moving load. Chin. J. Comput. Mech. 2020, 37, 34–41. [Google Scholar] [CrossRef]
- Clough, R.W.; Penzien, J.; Griffin, D.S. Dynamics of Structures. J. Appl. Mech. 1977, 44, 366. [Google Scholar] [CrossRef] [Green Version]
- Jiang, S.L.; Zhan, D.N.; Liu, Y.; Sun, Y.W.; Xu, J.T. Modeling of variable-pitch/helix milling system considering axially varying dynamics with cutter runout offset and tilt effects. Mech. Syst. Signal Process. 2021, 168, 108674. [Google Scholar] [CrossRef]
- Wan, M.; Zhang, W.-H.; Dang, J.-W.; Yang, Y. New procedures for calibration of instantaneous cutting force coefficients and cutter runout parameters in peripheral milling. Int. J. Mach. Tools Manuf. 2009, 49, 1144–1151. [Google Scholar] [CrossRef]
- Zhuo, Y.; Han, Z.Y.; An, D.; Jin, H.Y. Surface topography prediction in peripheral milling of thin-walled parts considering cutting vibration and material removal effect. Int. J. Mech. Sci. 2021, 211, 106797. [Google Scholar] [CrossRef]
- Du, Y.C. Study on Vibration Response and Surface Topography Prediction of Microfabrication. Master’s Thesis, Shandong University, Jinan, China, 2019. [Google Scholar]
- Muñoz-Rubio, A.; Bienvenido-Huertas, D.; Bermúdez-Rodríguez, F.J.; Tornell-Barbosa, M. Design Optimization of the Aeronautical Sheet Hydroforming Process Using the Taguchi Method. Appl. Sci. 2019, 9, 1932. [Google Scholar] [CrossRef] [Green Version]
- Kim, N.; Bhalerao, I.; Han, D.; Yang, C.; Lee, H. Improving Surface Roughness of Additively Manufactured Parts Using a Photopolymerization Model and Multi-Objective Particle Swarm Optimization. Appl. Sci. 2019, 9, 151. [Google Scholar] [CrossRef] [Green Version]
- Li, H.Y. Study of tool Wear and Workpiece Surface Integrity in Titanium Alloy TC21 Milling under Micro-Lubrication Conditions. Master’s Thesis, Northeastern University, Shenyang, China, 2018. [Google Scholar]
Publisher’s Note: MDPI stays neutral with regard to jurisdictional claims in published maps and institutional affiliations. |
© 2022 by the authors. Licensee MDPI, Basel, Switzerland. This article is an open access article distributed under the terms and conditions of the Creative Commons Attribution (CC BY) license (https://creativecommons.org/licenses/by/4.0/).