Article

Characterization of the Different Oils Obtained through the Catalytic In Situ Pyrolysis of Polyethylene Film from Municipal Solid Waste

by
Lucía Quesada
,
Mónica Calero
*,
María Ángeles Martín-Lara
,
Antonio Pérez
,
Marco F. Paucar-Sánchez
and
Gabriel Blázquez
Department of Chemical Engineering, University of Granada, 18071 Granada, Spain
*
Author to whom correspondence should be addressed.
Appl. Sci. 2022, 12(8), 4043; https://doi.org/10.3390/app12084043
Submission received: 15 February 2022 / Revised: 5 April 2022 / Accepted: 14 April 2022 / Published: 16 April 2022
(This article belongs to the Topic Plastic Recycling)

Abstract

:
Nowadays, the thermal and catalytic decomposition of plastic wastes by pyrolysis is one of the best alternatives to convert these wastes into quality fuel oils, thus replenishing some petroleum resources. This work studied the catalytic pyrolysis of polyethylene film waste from the remaining organic fraction on different catalysts under dynamic operating conditions in a batch reactor. These catalysts have been characterized through isotherms of adsorption-desorption with N2 and X-ray powder diffraction for structural characterization to see the differences in their use. The results obtained have been compared with the pyrolysis of the same material without a catalyst. Special attention has been paid to the similarities and differences with thermal pyrolysis. The characterization of the liquid fraction, including physical and chemical properties, has been carried out. The liquid yield varies from 37 to 43%; it has good calorific values of 46–48 MJ/kg, an average density of 0.82 g/cm3, and a fairly low viscosity compared to the product without the catalyst. Other properties like the American Petroleum Institute (API) gravity or pH were also determined and found to be similar to conventional fuels. Oils are mainly composed of paraffins, naphthenes, and aromatic hydrocarbons. The general distribution of carbons is C7 to C31. Finally, a detailed analysis of the composition of liquid products shows they present heavy naphtha, kerosene, and diesel fractions in different proportions in the function of the catalyst used.

1. Introduction

Today, humans depend on plastic materials because of their uses and advantages. A total of 368 Mt of plastic were produced worldwide in 2019, with 58 Mt being produced in Europe. This led to a large production of plastic waste. In 2018, 29.1 Mt of post-consumer plastic waste was collected in Europe, and about 25% of plastic waste ended up in landfills (in Spain, this value increased to 39%) [1]. Spain has two collection systems: the selective collection of municipal waste in homogeneous fractions, which are normally recycled in their great majority, and the collection of non-segregated waste (the fraction of municipal waste not collected selectively), which includes a great amount of organic fraction mixed with other types of municipal waste. This second flow of municipal waste has more disadvantages than recycling due to the high heterogeneity and variety of materials it contains. Unfortunately, the non-selective collection system is the most popular among Spanish citizens, with 86% of municipal waste collected in this system for provinces such as Granada [2]. This organic-rest fraction comprises 12.6% of plastics [3] that could be recovered and used through a recycling or valorization process. Among valorization techniques, the conversion of plastics into valuable hydrocarbon fuels has attracted attention [4]. There are numerous techniques for plastic waste, mainly mechanical and chemical recycling. Ragaert et al. [5] made a comprehensive compilation of the ways to recycle different plastic waste and found that chemical recycling, and in particular pyrolysis, is a promising complementary model to support a circular economy for all plastics since it is specially focused on the plastic waste that cannot be mechanically recycled for technical or economic reasons, such as mixed polymers (including multilayers, multi-materials, very dirty plastics, etc.). In addition, Papari et al. [6] reviewed the potential of pyrolysis for the recovery of plastic waste. Their work discussed the different types of pyrolysis, operating conditions, use of catalysts, etc., and their effect on the characteristics of the pyrolysis products obtained. Al-Salem et al. [7] studied the most influential factors in the pyrolysis process, the products that can be obtained, and the differences when using catalysts. Sharuddin et al. [8] reviewed the plastic waste pyrolysis process, analyzing the parameters that most influence the characteristics of the final products, such as temperature, residence time, pressure, catalyst, and the type of reactor.
Additionally, in a recent study, Li et al. [9] extensively reviewed the current state of converting plastic waste to fuels. The authors reviewed traditional technologies, such as thermal pyrolysis, and new technologies, including catalytic pyrolysis, hydrothermal liquefaction, and advanced oxidation processes, such as photocatalytic oxidation, Fenton oxidation, and electrocatalytic oxidation. The authors indicate that it is possible to convert plastic waste to fuel through catalysts efficiently. However, problems such as the deactivation of the catalyst and its cost must be taken into account. In this sense, the authors included a line of research in the future: a greater study on the use of catalysts, emphasizing the development of catalysts that have good adaptability, high activity and recyclability. Therefore, pyrolysis can be considered an interesting recycling technology for municipal mixed plastic waste such as mixed polyethylene (PE) (high-density (HDPE) and low-density (LDPE)) or polyolefin mixtures (PE, polypropylene (PP) and polystyrene (PS)) that are currently not mechanically recycled but incinerated and/or dumped to landfill. Thermal or non-catalytic pyrolysis involves heating municipal mixed plastic waste at moderate temperatures in an inert atmosphere to produce three main products: gas, liquid (oils), and solid (char). One of the particularities of the thermal pyrolysis process is the flexibility to achieve the product of interest by changing the operating parameters, mainly temperature, residence time and heating rate [4]. Unlike mechanical recycling, thermal pyrolysis can handle highly contaminated waste, which is also economically viable [5]. There have been numerous studies on the thermal pyrolysis of particular types of plastic waste. For example, authors such as Ahmad et al. [10], Onwudili et al. [11] and Quesada et al. [12] carried out thermal pyrolysis tests to convert PE plastic waste into valuable oils. The main disadvantage of this process is that the oil obtained has high wax content with too much energy consumed.
One possibility for improving the performance of pyrolysis is the use of a specific catalyst (catalytic pyrolysis). The catalyst allows the use of less stringent reaction conditions, lowering the temperature and residence time of the overall process and affecting the total operating cost. In addition, the use of the catalyst allows the product spectra to be directed towards fuel and valuable chemicals, depending on the process conditions and being more selective [5,13]. In short, the catalyst plays an important role in energy consumption and the composition and properties of pyrolysis products [4,12]. A wide variety of catalysts have been assayed in the pyrolysis of plastic waste, placed in a pyrolysis reactor (in situ) or an independent catalytic bed (ex situ) [14,15,16]. Most of the used catalysts are structures of aluminum-silicate minerals with high surface area and high acid strength like HY, HUSY, HBeta and HZSM-5 zeolites. There are numerous works, such as Lopez et al. [14], where the catalytic pyrolysis of plastic waste was carried out in situ in the reactor. One of the disadvantages of this process is that the presence of contaminants like additives (plasticizers, stabilizers, antioxidants, etc.) and other materials (organic matter, papers, etc.) can have a direct effect on the acid centers of the catalyst, reducing its catalytic activity or favoring the formation of coke [17].
Problems related to global waste generation and management and plastic waste release, in particular, have been increasing in recent years. Therefore, there is a growing need to search for integrated solutions to respond to this problem. Achieving a model based on zero waste includes different actions such as sustainable design, reduction, reuse and recycling of waste and product responsibility [18]. In this sense, this work aims to give added value to PE film waste through catalytic pyrolysis, helping to reduce the amount of waste and avoiding environmental problems. For this, the characterization of different oils obtained through the catalytic in situ pyrolysis of PE film from the non-selectively collected fraction from municipal solid waste in a fixed-bed batch-type pyrolysis reactor with different commercial catalysts has been carried out. Additionally, the characterization of the catalyst was carried out using different techniques, including X-ray powder diffraction (XRD) and N2 adsorption isotherms.

2. Materials and Methods

2.1. Materials

The PE used in this study comes from the residual fraction of municipal solid waste and has been supplied by the municipal solid waste treatment plant Ecocentral, located in Granada (Spain). The characterization of this material can be found in our previous published paper [12], where the material was characterized both physically and chemically. The material has been transformed into a pellet in the present work to optimize the volume of this plastic waste. The study by Soto et al. [19] described the method of obtaining the PE in the municipal solid waste treatment plant. Its transformation into recycled PE pellets was performed in an industrial plastic recycling plant in Germany. The size of the pellets obtained was approximately 4 mm.
The catalysts indicated in Table 1 were used to carry out the catalytic pyrolysis tests. Information about Brønsted and Lewis acidity was obtained from the literature [20,21,22,23,24]. Before the experiment, the catalysts were calcinated in a muffle furnace at 773 K for 5 h to stabilize it and then placed in a desiccator before use. The catalysts were characterized according to the methodology indicated in the following subsection.

2.2. Characterization of the Catalysts

2.2.1. Textural Parameters

A Micromeritics ASAP 2010 instrument was used for determining the textural parameters from N2 adsorption isotherms at 77 K. Before adsorption, the zeolite samples were degassed at 363 K for 1 h and then at 623 K for 3 h under vacuum. The microporous volume and the external surface area were calculated using the t-plot method. The total pore volume was estimated from the adsorbed volume of nitrogen for a relative pressure P/P0 of 0.95, and mesopore volume was estimated by the difference between total pore volume and microporous volume. Finally, Brunauer–Emmett–Teller (BET)-specific surface area was calculated using the BET theory.

2.2.2. XRD

The structural characterization of the parent and modified samples was made from XRD patterns that were obtained in a Bruker AXSAdvanceD8 diffractometer using Cu Kα radiation (1.5406 Å) and operating at 40 kV and 40 mA. Diffractograms were obtained by continuous scanning from 5 to 80° (2θ), with a step size of 0.05° 2θ and 0.05 s acquisition for each step.

2.3. Catalytic Pyrolysis Tests

PE in the shape of pellets was pyrolyzed in a Nabertherm model R50/250/12 horizontal furnace reactor. About 20 g of pellets together with 10% by weight of the different catalysts were well-mixed to obtain a well-mixed mixture and fed into the pyrolysis reactor. The operating temperature was 773 K, with a heating rate of 20 K/min and a residence time of 120 min, in an inert atmosphere with a constant nitrogen flow of 100 mL/min. The exhaust gas condensation system consisted of a glass bottle immersed in an ice bath installed at the exit of the reactor. In this bottle, the liquid fraction was collected and quantified. A continuous flow of nitrogen was maintained through the reactor throughout the entire operation time. The PE was introduced at the beginning of the operation and taken out when the operation time was finished.

2.4. Physical Characterization of the Pyrolytic Oils

The pH value of oil was determined using a digital pH meter. Using an Ohaus density determination kit at room temperature, density was determined following Archimedes’ principle.
The American Petroleum Institute (API) gravity was determined according to ASTM D-1298 (Equations (1) and (2)).
API   gravity = ( 141.5 ρ p y r o l y s i s   o i l ) 131.5
ρ pyrolysis = ρ oil ρ water
where ρpyrolysis oil is determined at 288.6 K.
According to API gravity, the oils are classified as [25]:
  • Light oil: API gravity > 31.1°;
  • Medium oil: API gravity between 22.3° and 31.1°;
  • Heavy oil: API gravity < 22.3°;
  • Extra-heavy oil: API gravity < 10°.

2.5. Chemical Characterization of the Pyrolytic Oils

2.5.1. Elemental Analysis and Calorific Value

Elemental analysis of the oil sample was done by combustion analysis using an Elemental Fison’s Instruments EA 1108 CHNS. The high heating value (HHV) was determined according to the Dulong equation (Equation (3)) [26].
HHV = 8080 · C + 34460 · [ H O 8   ] + 2250 · S
where C, H, O and S are the mass fractions of carbon, hydrogen, oxygen and sulphur. The results of this equation are provided in kcal/kg. However, in this work, they were converted to MJ/kg.

2.5.2. Thermogravimetry Analysis (TGA)

The TGA tests were performed on a PerkinElmer TGA-DSC thermobalance model STA 6000. The conditions used for the TGA test were: a temperature from 370 to 800 K, a heating rate of 10 K/min, a nitrogen flow of 20 mL/min and an approximate sample mass of 20 mg. TGA testing was used to determine the volatilization characteristics of the oil.

2.5.3. Fourier-Transform Infrared Spectroscopy (FTIR) Analysis

A PerkinElmer Spectrum 65 spectrophotometer was used to determine the FTIR spectrum of the oil samples. The spectrum was recorded at a wavenumber between 4000 and 400 cm−1 with a resolution of 2 cm−1. This method is considered appropriate for the qualitative identification of organic and inorganic compounds.

2.5.4. Gas Chromatography-Mass Spectrometry (GC-MS)

The analyses were performed using an Agilent high-resolution GC, model 7890 A, coupled to a Waters triple-quadrupole mass spectrometer, model micro GC. The operating conditions were: injector and transfer line temperature, 523 K with the injector operating in split mode; carrier gas (helium) flow of 1 mL/min; and a nonpolar phase ZB-5MS capillary column, Phenomenex (USA), (30 m × 0.25 mm, ID × 0.25 µm film). The oven was programmed to hold at 313 K for 4 min, then heat to 553 K with a heating rate of 6 K/min and hold at this temperature for 6 min. The operation conditions of the mass selective detector were: interface temperature, 523 K; full scan, 30–650 Da; and electron ionization energy, 70 eV. The identification of compounds was based on the National Institute of Standards and Technology; NIST MS Search 2.0 software was integrated to MassLynx V4.1 with the mass spectrum library NIST 08 [12]. The referential retention times of normal paraffins were identified from a calibration mixture to determine the boiling points of pyrolytic oil compounds and, by linear interpolation, construct the simulated distillation curves according to the test method ASTM D2887 [27]. In short, chromatography gives us a qualitative and quantitative idea of the compounds present in these liquid fractions.

3. Results and Discussions

3.1. Characterization of the Catalysts

Figure S1 shows the N2 adsorption-desorption isotherms, and Table 2 presents the textural properties of the three used zeolites. According to IUPAC classification, the three studied zeolites can be classified as type IV isotherms, and mesoporous channels are presented in these materials [28].
HUSY CBV 720 zeolite showed a higher BET surface area, micropore volume and micropore area with values of 762 m2/g, 0.24 cm3/g and 589 m2/g, respectively. However, the higher mesopore and total volumes were obtained for HY CBV 600 zeolite with values of 0.94 and 1.11 cm3/g, respectively. Ammonium beta zeolite had a higher external surface (218 m2/g) than HY and HUSY zeolites (CBV 600 with 78 m2/g or CBV 720 with 173 m2/g).
Wei et al. [29] reported the characterization results of the same commercial HY catalysts, obtaining similar results to this work. Elordi et al. [30] studied an HBeta zeolite-based catalyst (commercial name CP811E-75), and its characterization is very different from ours, obtaining a micropore volume of 0.041 cm3/g and a mesopore volume of 0.27 cm3/g. However, it is important to remark that these authors studied a different commercial beta zeolite than this work.
Kenvin et al. [31] also worked with commercial HUSY CBV 720 zeolite, determining similar textual properties. For example, these authors reported a micropore volume of 0.36 cm3/g and a mesopore volume of 0.23 cm3/g. Finally, Simon-Masseron et al. [32] characterized the ammonium beta zeolite, obtaining a microporous volume of 0.19–0.26 cm3/g and a surface area of 178 m2/g.
In addition, the XRD patterns for the three used zeolites are shown in Figure S2. HY and HUSY zeolites were purely crystalline with the typical diffraction pattern of the FAU (faujasite) framework (structural information on all the zeolites can be consulted at http://www.iza-structure.org/databases/ (accessed on 14 February 2022)). Ammonium beta CP 814E EA zeolite is purely crystalline with the typical diffraction pattern of the BEA framework [32,33].

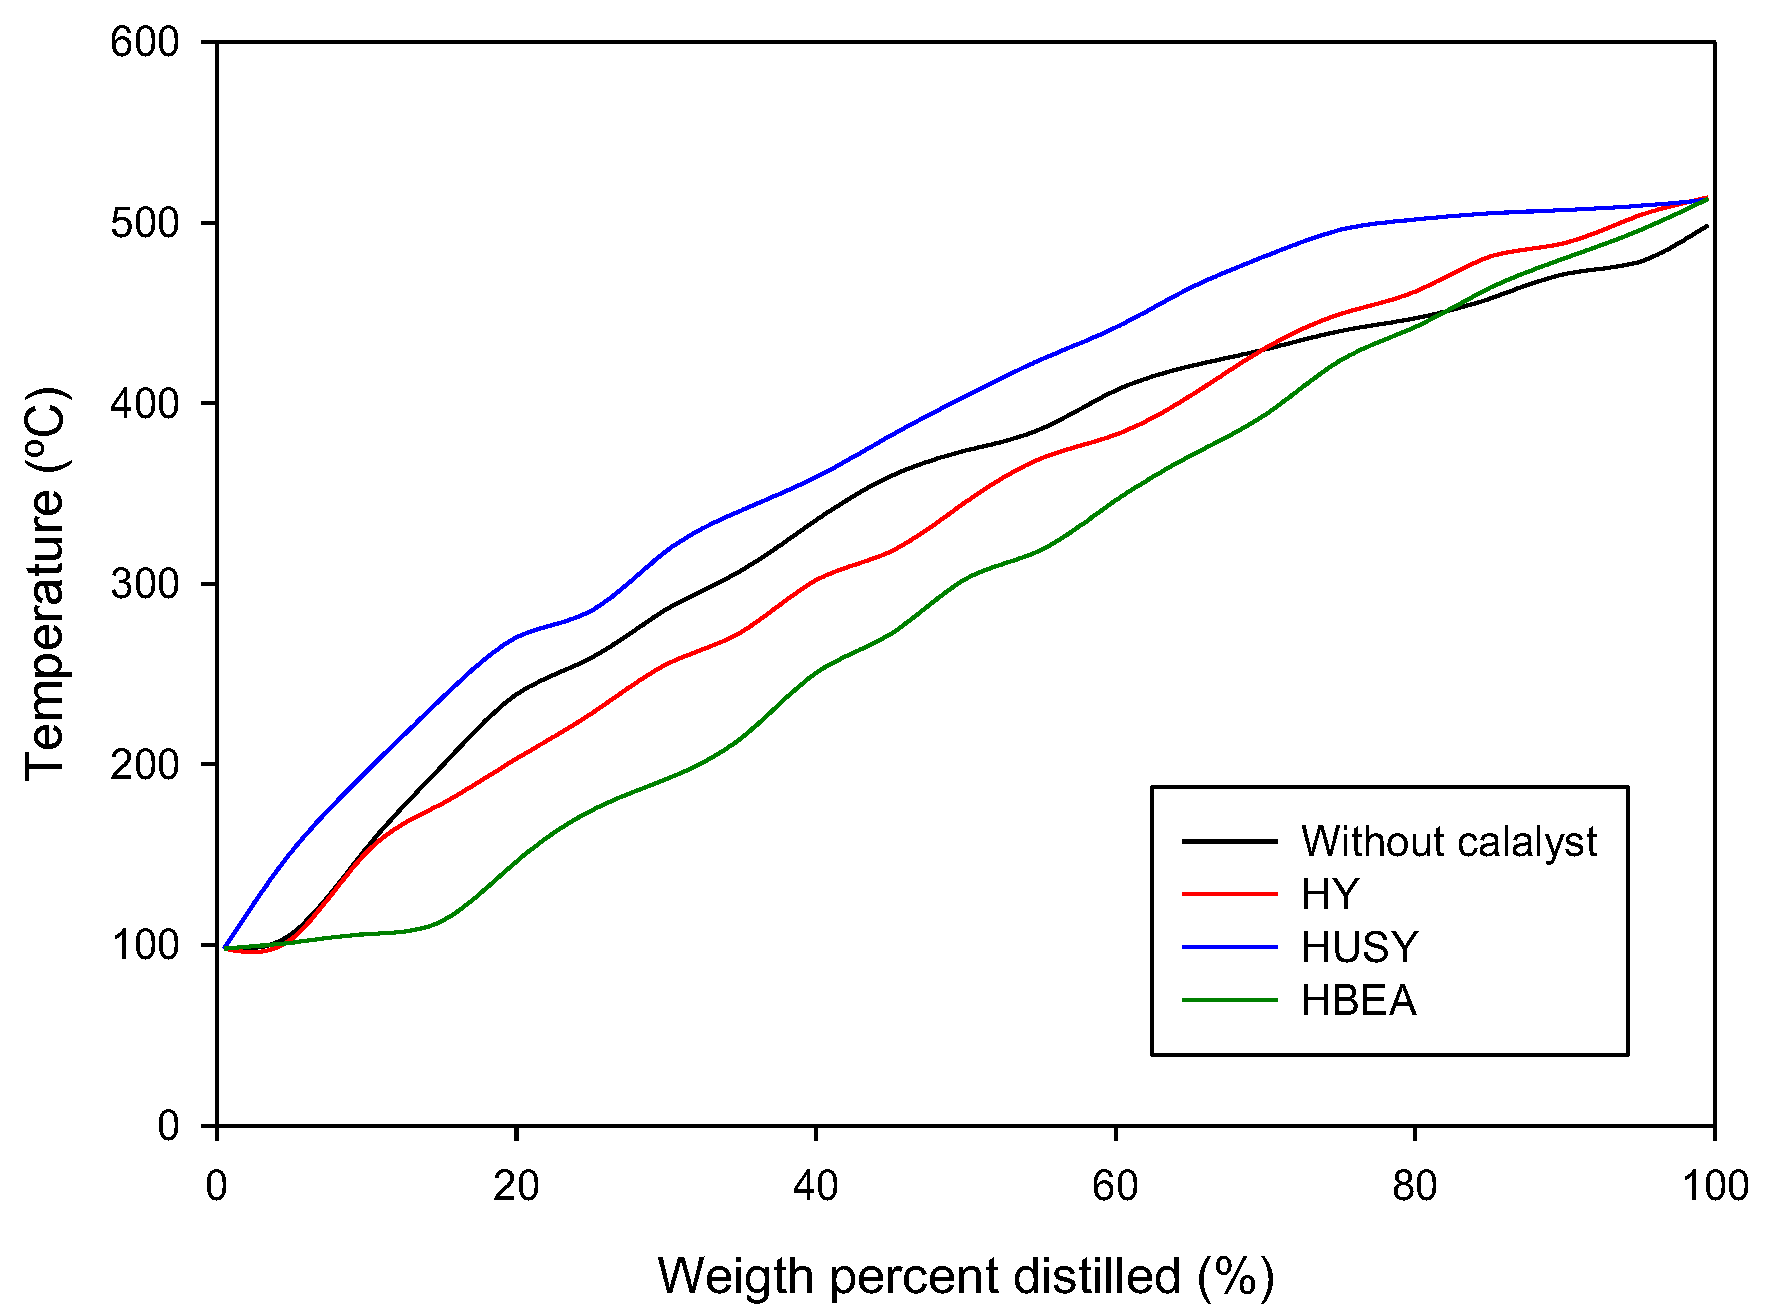
3.2. Physical Characterization of Pyrolytic Oil

In previous work by Quesada et al. [34], a study was carried out on the liquid yields using these catalysts, obtaining a liquid yield of 37% for HY, 39% for HUSY and 43% for HBEA.
The pH and viscosity of oil samples were determined in previous work [35]. The pH of all the samples was 6. The oil obtained with the HY catalyst had a viscosity of 137 cSt, the oil obtained with the HUSY zeolite had a viscosity of 209 cSt, and the oil obtained with the ammonium beta zeolite had a viscosity of 89 cSt at 313 K [33]. Other physical properties measured for the different oils are shown in Table 3.
The values for carbon and hydrogen contents differ only slightly between samples. The oils obtained with the different catalysts had a carbon content between 83.4 and 84.5%, similar to that obtained without a catalyst (83.2%) and an almost hydrocarbon-carbon ratio. Similar elemental analysis was observed by Lopez-Urionabarrenechea et al. [36] for oils obtained from the pyrolysis of a mixture of PE, PP, PS, poly(ethylene terephthalate) (PET) and poly(vinyl chloride) (PVC) at 713 K for 30 min using a zeolite as a catalyst. Similar elemental analysis was also observed by Singh et al. [37] in oils derived for HDPE using a pyrolysis-catalytic cracking process with a copper carbonate catalyst. The density of the four samples was 0.816 to 0.825 g/cm3. Their API gravities were within 40–42°, and the calorific values varied between 45.8 and 48.0 MJ/kg. The values of the HHV show an interesting result since they are among those of gasoline (46.1–48.2 MJ/kg) and kerosene/diesel (44.0–46.9 MJ/kg). The liquid product obtained by the HBEA catalyst is closer to the diesel range, whilst the density was within the range of kerosene (0.774–0.840 g/cm3).
As was indicated in the materials and methods section, the API gravity is used to classify the pyrolytic oils as light, medium, heavy or extra-heavy. According to values reported in Table 3, the pyrolytic oils are categorized as light oils.
The high values show the need for a viscosity reduction process regarding viscosity. For example, a viscosity range between 1 and 100 cSt at 293 K is the most common range for commercial fuels. It could be adequate for pyrolysis oils to facilitate its recovery, transportation and final use. However, adding the ammonium beta CP 814E catalyst promoted a decrease in viscosity. Nevertheless, it was still a very high value due to the characteristics and proportion of the catalyst used.

3.3. Chemical Characterization of Pyrolytic Oil
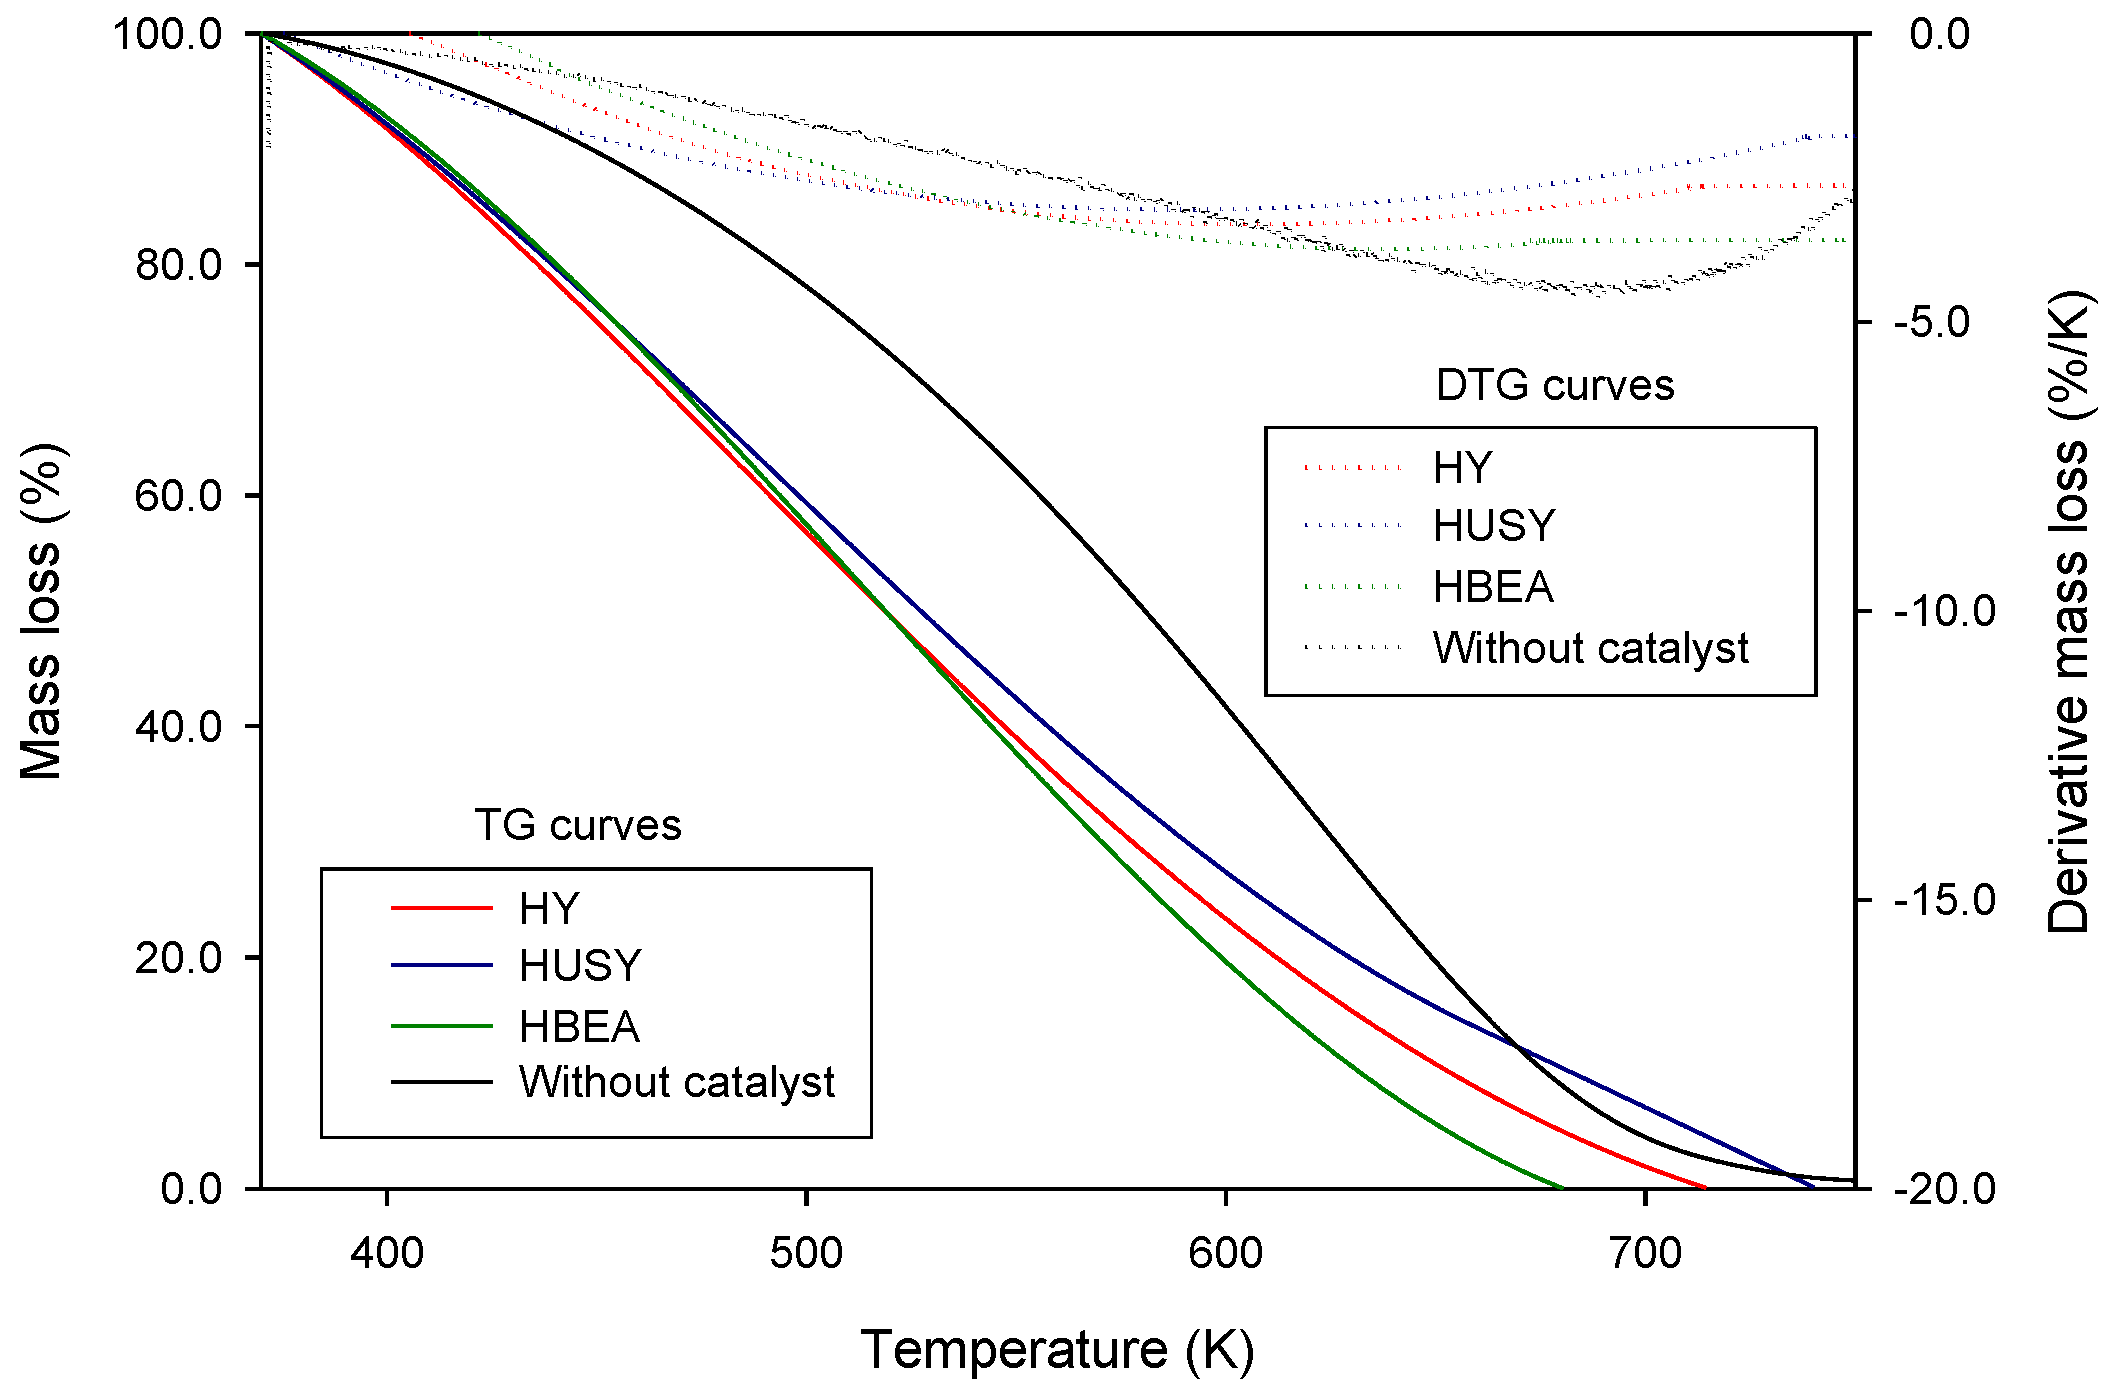
3.3.1. TGA Analysis

Figure 1 shows the TGA and DTG curves of the oils obtained without the catalyst (data from Quesada et al., [12]) and with three different studied catalysts.
Similar behavior was shown independent of the catalyst used during the pyrolysis. The pyrolytic oil samples presented a large mass loss between approximately 370 K and 670 K, which corresponds to the volatilization of compounds. Similar results were found by Lee et al. [38]. These authors showed the weight changes in the function of the temperature of pyrolysis oil obtained from the pyrolysis of plastic wastes. Additionally, a comparison of TG curves of oils from catalytic pyrolysis with those obtained without catalyst shows that the catalytic pyrolysis reduced the volatilization temperature due to the presence of lighter compounds. The catalyzed oils show an equal mass loss up to about 470 K (naphtha cutoff). Additionally, the oils catalyzed by HY and HBEA have similar behavior up to 550 K (kerosene cutoff). However, although all catalyzed oils have approximately the same amount of diesel cut (13.29 to 13.71%), the lower mass loss of HUSY compared to the others may be associated with the interaction between the kerosene and diesel cuts due to the low content of kerosene in oils obtained in the catalytic pyrolysis of plastic with a HUSY catalyst (HUSY: 12.29%, HBEA: 15.98% and HY: 17.9%). The behavior is markedly different, dominated by the heavy fraction. It is evident that the highest amount of bottoms is in the oil obtained by the HUSY catalyst (HUSY: 65.12%, HBEA: 41.12% and HY: 50.97%). These results show that the liquid fraction obtained by HBEA zeolite, the zeolite with the largest external surface (218 m2/g), has the highest amount of volatile compounds (58.88%), followed by HY zeolite (174 m2/g), which had liquid fractions with the highest API degrees. In addition, the results are consistent with the data obtained by simulated distillation that was reported in Figure 2.
Figure 2 shows simulated distillation curves of the pyrolytic oils obtained by thermal and catalytic cracking. These curves show that the liquid fraction obtained by the HBEA catalyst produced the lightest compounds, followed by the HY and HUSY catalysts because of the external surface area (HBEA: 218 m2/g, HY: 174 m2/g and HUSY: 78 m2/g). The latter, although it is catalyzed oil, has more heavy compounds (65.12% of bottoms) than the oil obtained without catalyst (59.02% of bottoms), and therefore has the lowest API gravity.

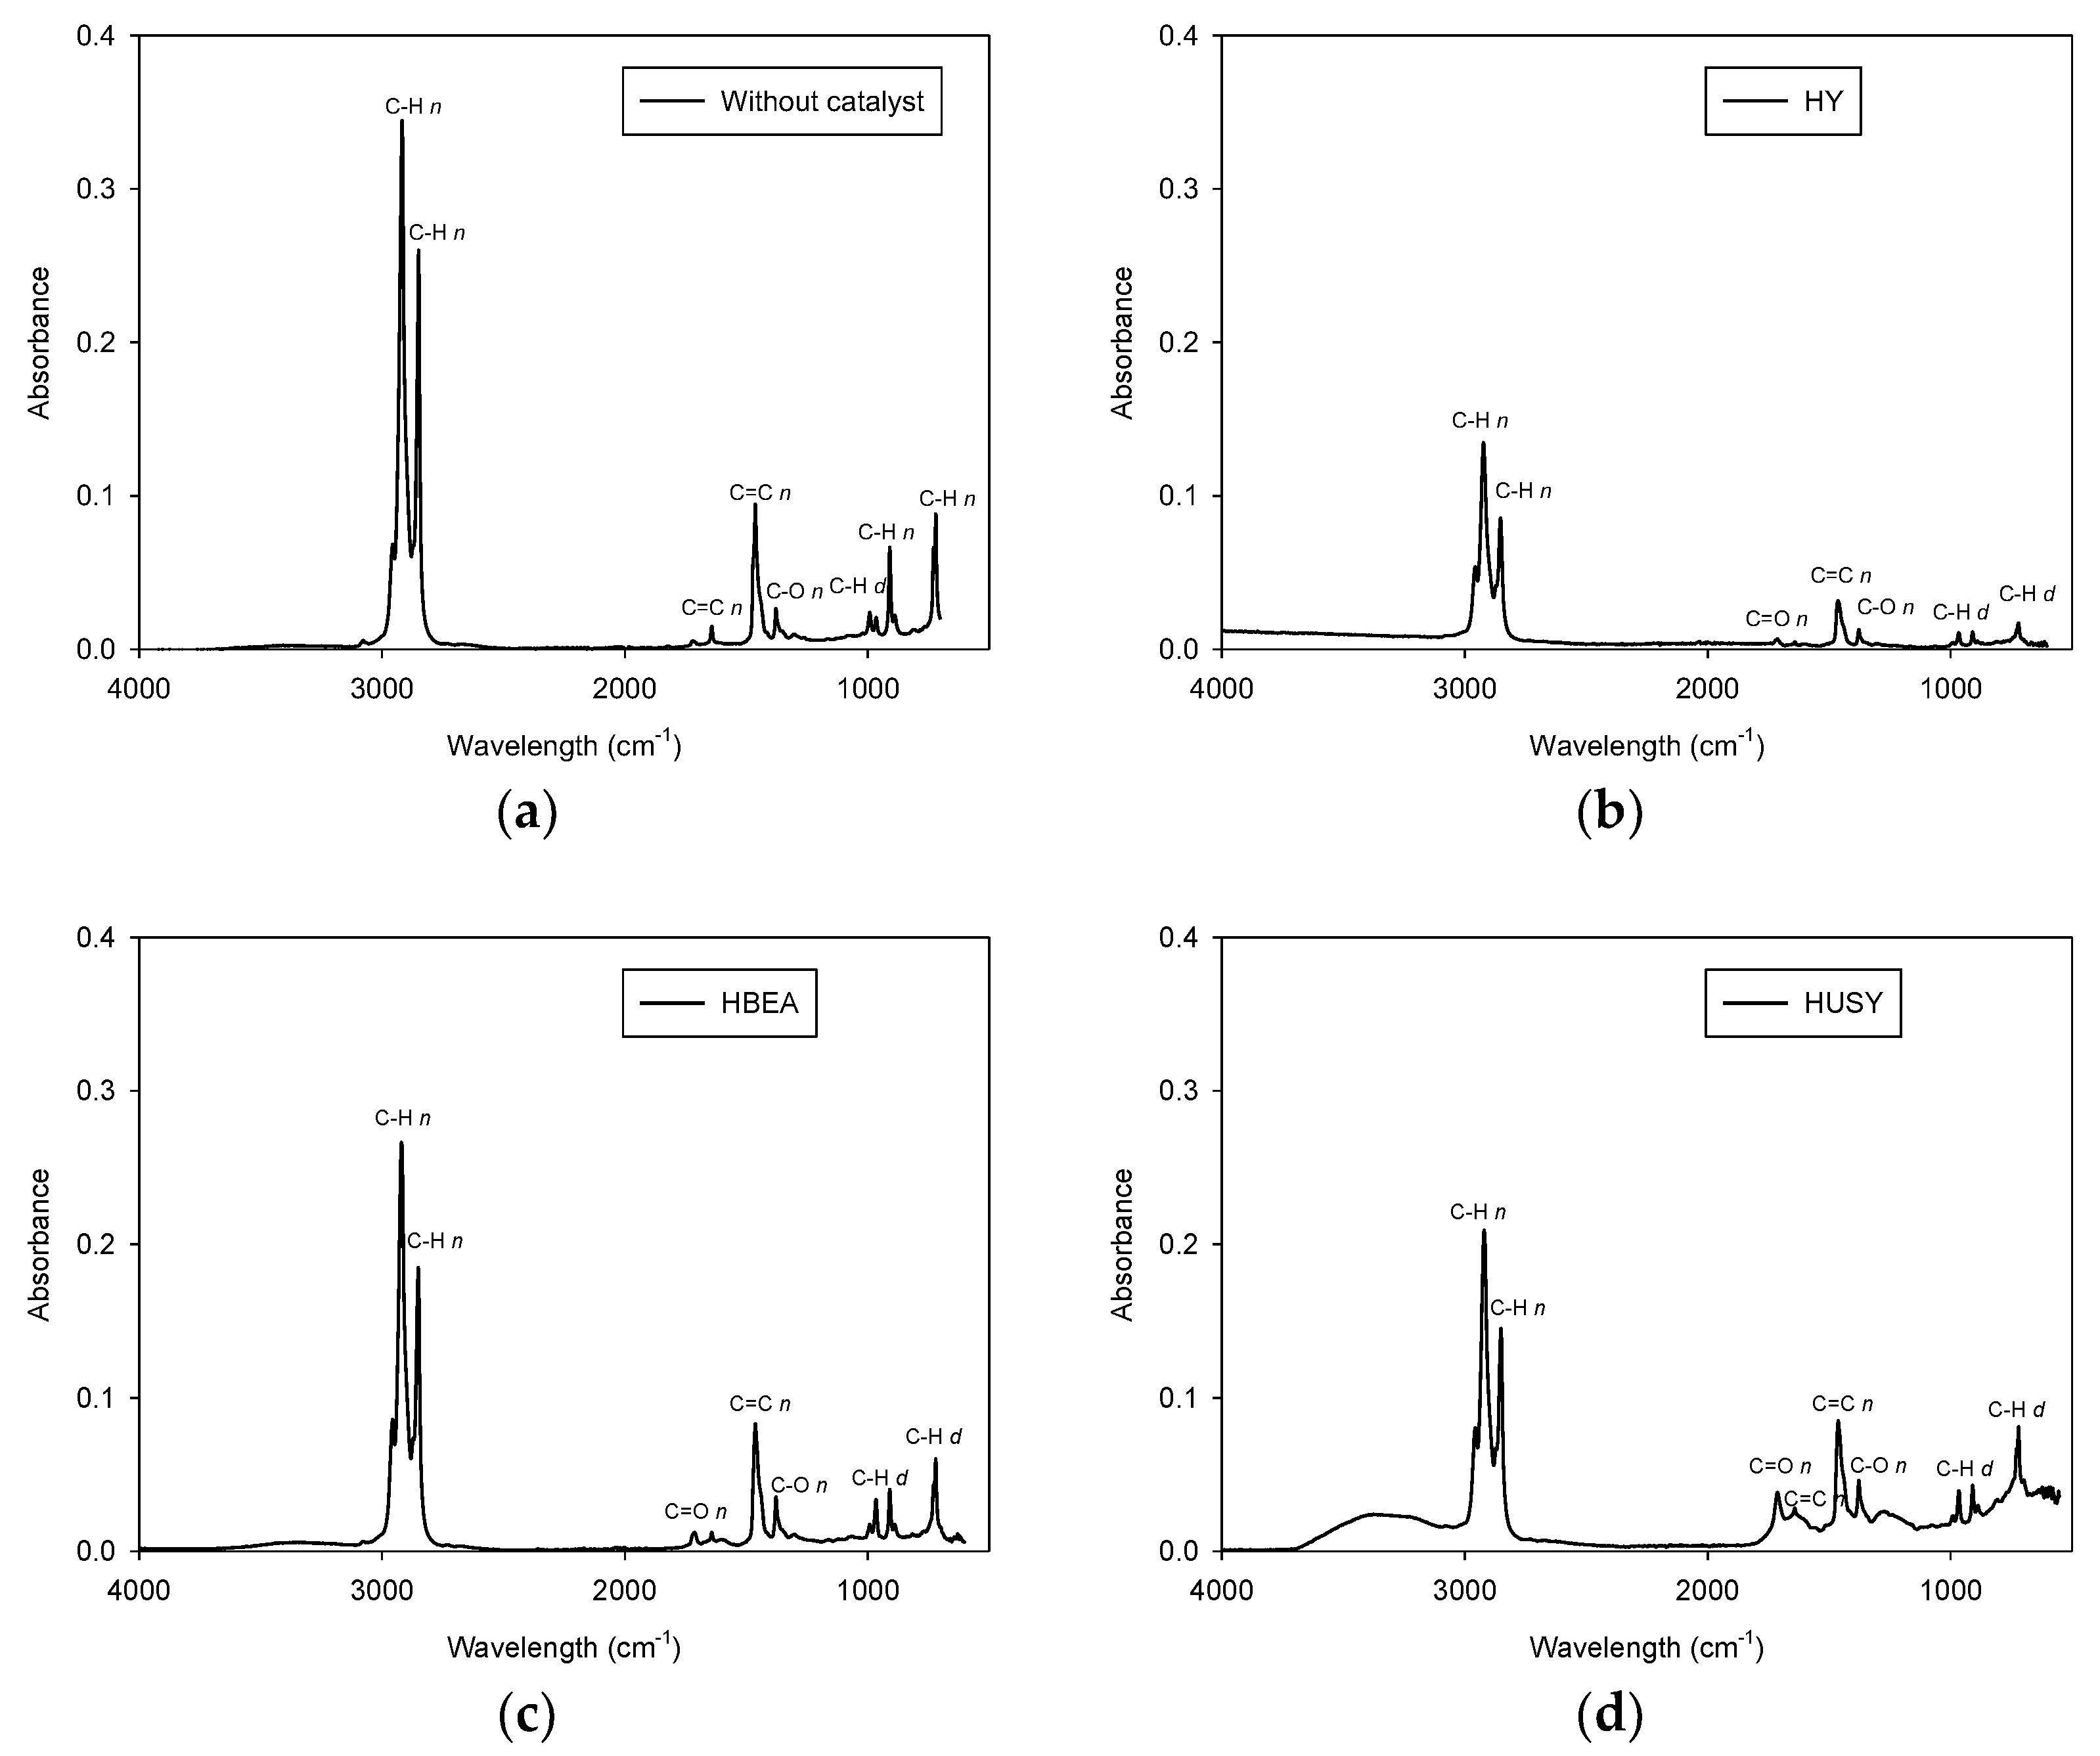
3.3.2. FTIR Analysis of the Pyrolytic Oil
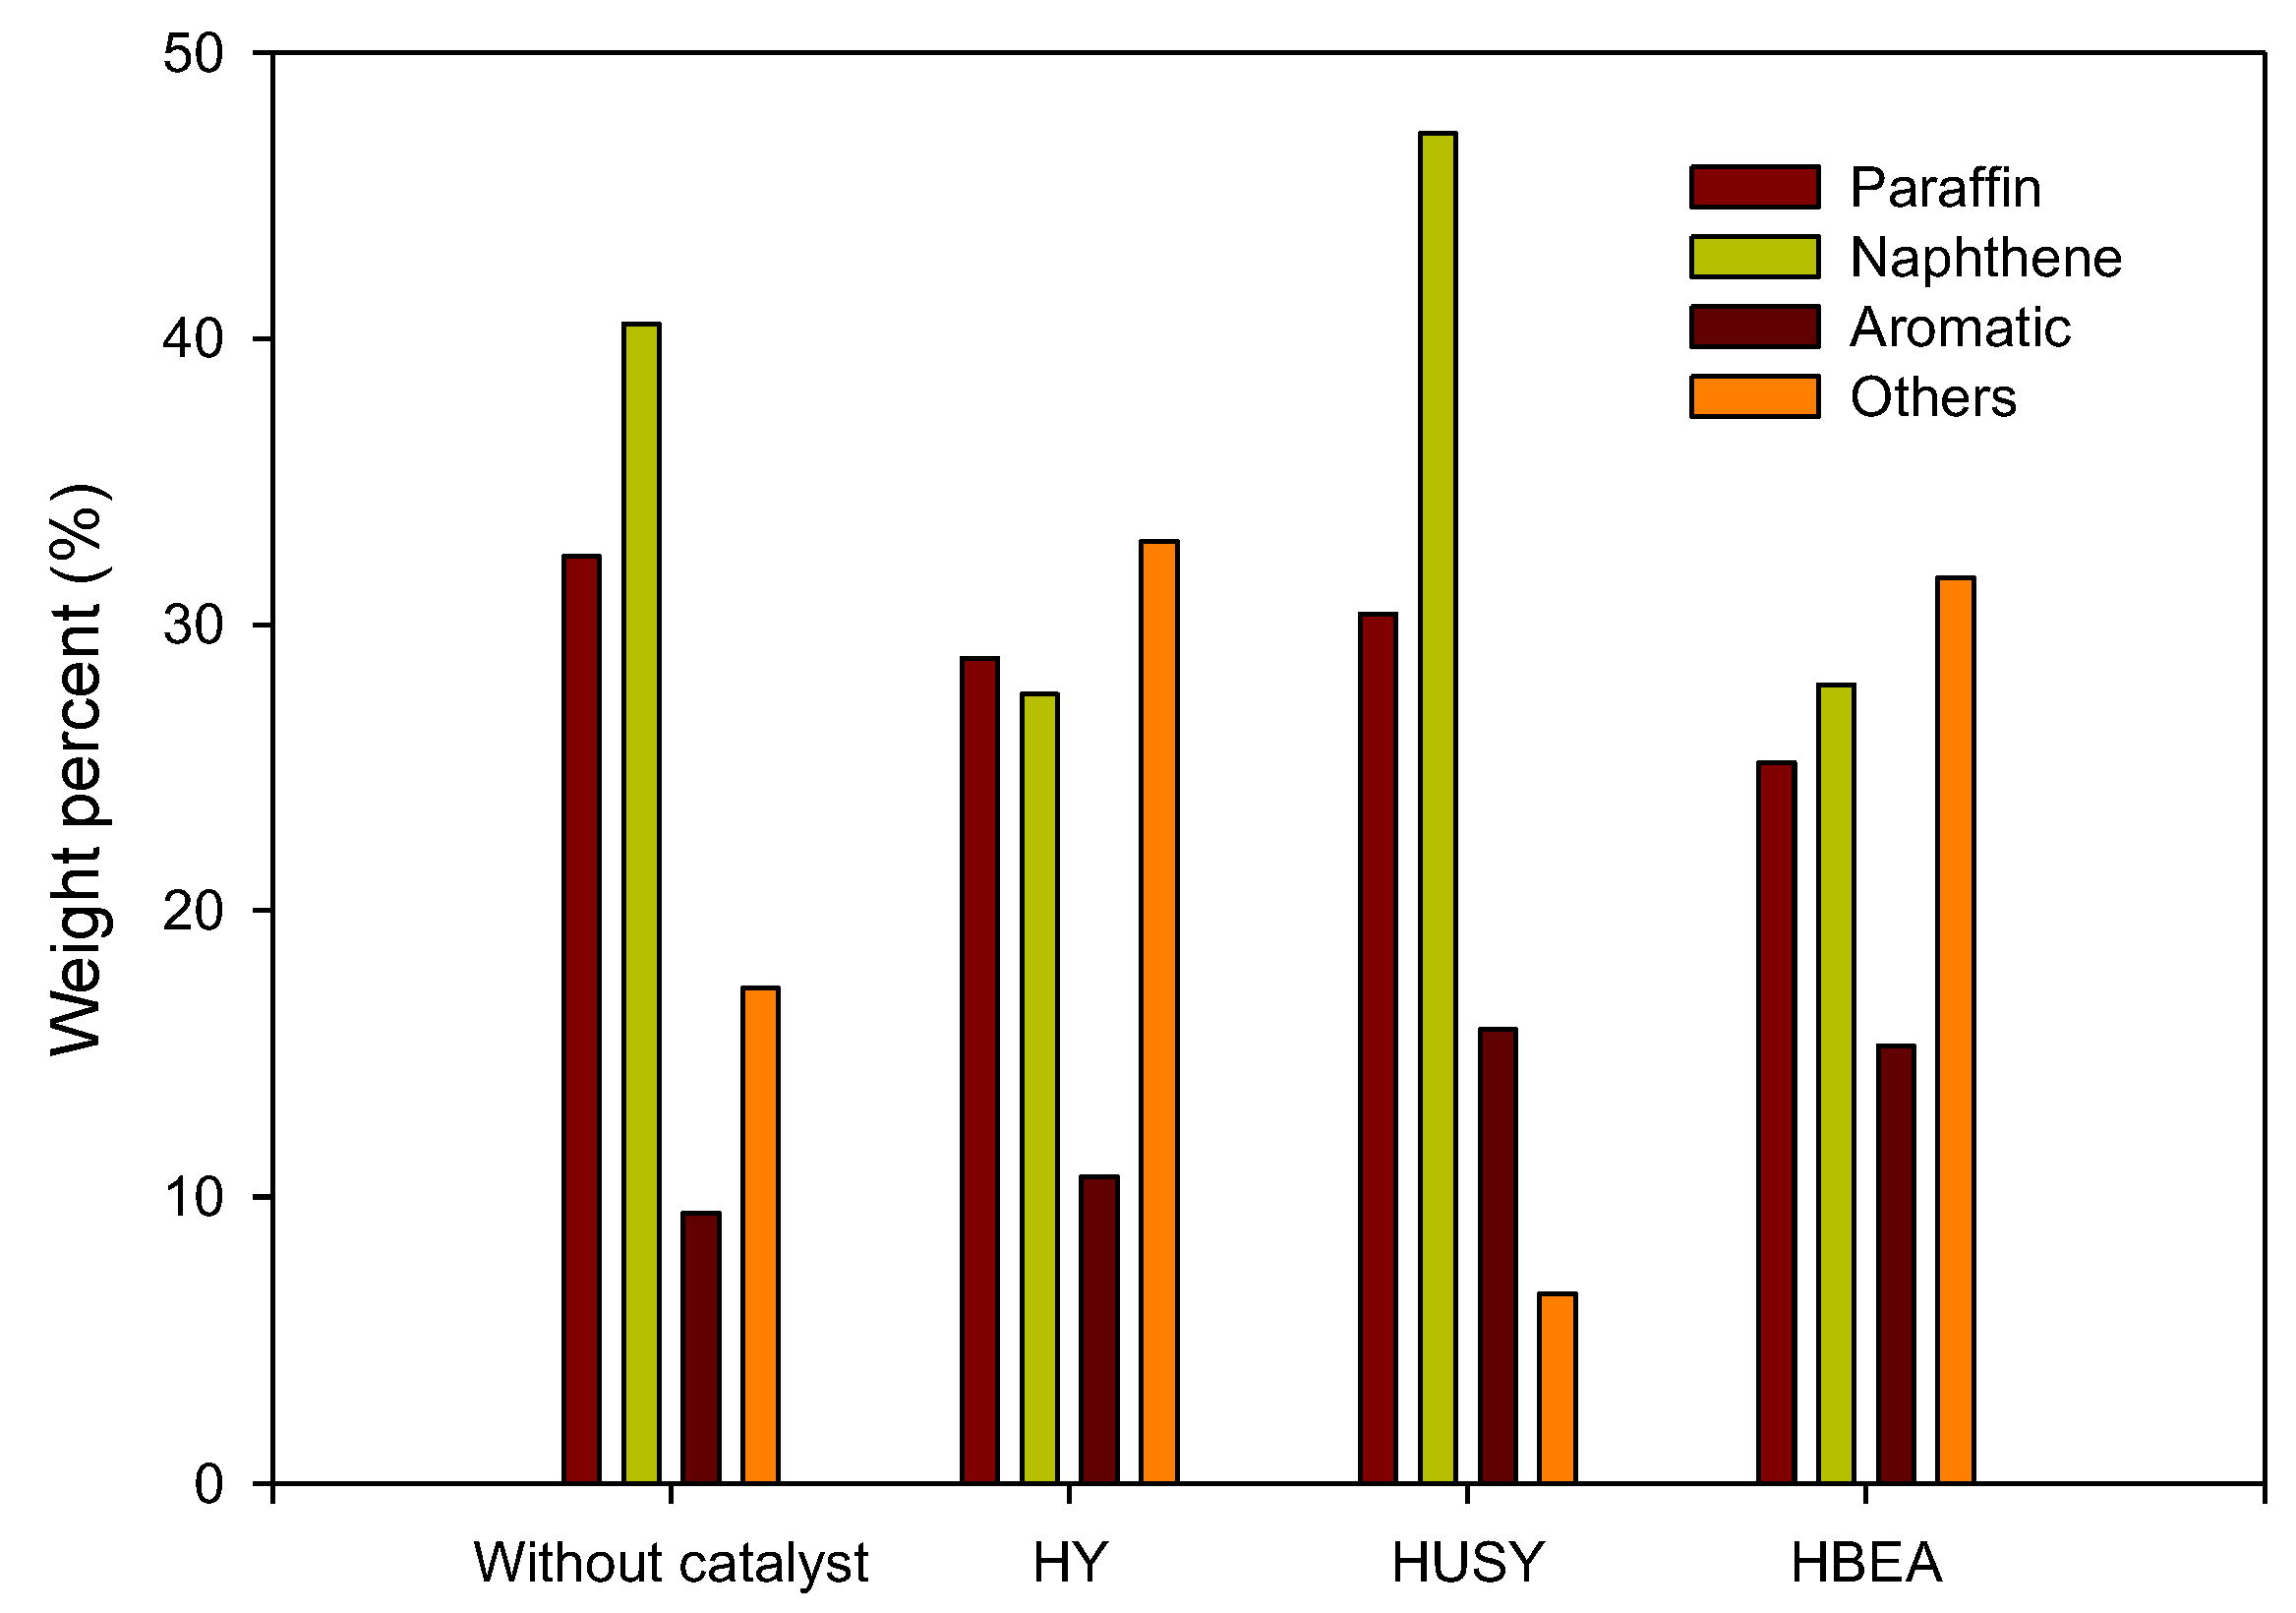
Figure 3 shows the FTIR spectra of the pyrolytic oil samples obtained from the pyrolysis of PE waste without using a catalyst [12] and using the three studied catalysts. The peaks observed in the FTIR of the oil without a catalyst were practically equal to those obtained with commercial catalysts, but absorbance values without a catalyst were higher. These variations in the absorbance intensity may be related to changes in the concentration of the compounds involved and the path length through the sample. In addition, some technical aspects, such as the pressure of the material on the ATR crystal, could also have an influence. The main peaks found were 2917 cm−1 and 2850 cm−1 (C–H medium stretch) for alkanes; 1714 cm−1 (C=O strong stretch) for aldehydes, ketones, carboxylic acids and esters; 1642 cm−1 (C=C medium and weak stretch) for alkenes; 1465 cm−1 (C–H variable scissoring and bending) for alkanes; 1150 cm−1 (C–O strong stretch) for alcohols, ethers, carboxylic acids and esters; 970 cm−1, and 890 cm−1 and 720 cm−1 (C–H strong bend) for alkenes [39].
In addition, the presence of certain compounds may be due to the origin of the plastic waste used; in this case, we used plastics that have already been processed and contain additives that have been added in the manufacturing process, as well as traces of organic and inorganic impurities [40]. In this way, since the acidity of hydrocarbons is mainly due to the presence of naphthenic acids (lineal, cyclic and aromatic carboxylic groups), the C=O and C–O bonds would be related to the slightly acid pH of liquid fractions, which increase to around 1.69% when the catalysts are used.
Colantonio et al. [41] studied the pyrolysis of different polymer wastes with HUSY and HZSM5 catalysts and obtained peaks similar to those determined.

3.3.3. GC-MS

The presence of a catalyst in the pyrolysis process of plastic waste improved the quality of the products obtained due to the multitude of reactions that occur during the pyrolytic process. In general, introducing a catalyst in this process can increase the concentration of aromatic compounds [42].
Figure S3 (in Supplementary Materials) shows the chromatograms and simulated distillation curves from the PE samples’ thermal and catalytic in situ pyrolysis. In all samples, the pyrolytic oil was comprised of a complex mixture of organic compounds, resulting in the appearance of several peaks in the GC-MS chromatogram. The oil obtained from the residual PE without a catalyst was characterized in previous works. Many of the components present in this oil were 1-alkenes and n-alkanes in C7–C32 [12,35]. In the presence of the catalysts, the concentration of total paraffinic compounds decreased between 13 and 68 percent. The distribution of the number of carbons decreased while increasing the total content of aromatic compounds from 13.4 to 67.8%. The carbon chains are practically the same as those obtained without catalyst, approximately C7 to C28. Figure 4 shows the distribution of the hydrocarbon type presented in the liquid fraction according to designations ASTM D2425, D2786, D2789 and ASTM D3239 (detailed information is shown in Table S1 in Supplementary Materials).
Similar results were obtained by Bagri and Williams [43], who studied the catalytic pyrolysis of PE waste with zeolites HY and ZSM-5. Similar results were also found by Ding et al. [44], who found that the thermal degradation of PE yielded compounds ranging in carbon number from C1 to C27 and higher. In contrast, the catalytic cracking of PE gave products with lower carbon numbers (from C1 to C17). Manos et al. [45] studied the catalytic degradation of HDPE on different zeolites obtaining a range of hydrocarbons C3–C15. These authors studied the zeolite HY with a Si/Al molar ratio of 2.5, zeolite β (HBEA) with a Si/Al molar ratio of 25, similar to those used in this work, although they also worked with other catalysts such as ZSM-5 and modernite. HY zeolites and HBEA zeolite produced a higher amount of alkanes, with fewer alkenes and aromatics and very small amounts of cycloalkanes and cycloalkenes. In comparison, modernite and ZSM-5 gave a higher amount of olefins. Most alkanes were isoparaffins, having a high octane number, which produced a high-quality fuel. Attique et al. [46] studied the catalytic pyrolysis of virgin LDPE with kaolin as a catalyst. The authors obtained a distribution of C9–C25 hydrocarbons, mainly alkanes and alkenes. Colantonio et al. [41] studied the thermal and catalytic pyrolysis of a mixture of plastic waste (PE, PP and PET). The authors found that the use of zeolites produces a decrease in the heavy oil fraction and wax formation. Additionally, HUSY had the best results in the total monoaromatic yield, and HZSM5 promoted the production of gases.
Figure 5 shows the liquid products yield of the pyrolytic oil samples from thermal and in situ catalytic pyrolysis. The retention times of the representative carbon compounds of each oil show that there are valuable cuts in the range of heavy naphtha (C6–C10), kerosene (C9–C15) and diesel (C13–C18) [27]. Their proportion increased according to the bimodal distribution of the pore area of the catalyst used [47]. HBEA produced the largest amount of transportation fuels due to its smallest microporous surface area and the largest mesoporous surface area. The former reduced the formation of gases from the light fraction, and the latter increased the cracking of heavy fractions. In addition, the HHV values in the range of 46.9 to 47.0 MJ/kg were obtained using the components of each oil sample shown in Figure 3. These results confirm those determined from the elemental analysis of the oil samples (Table 3).
The catalytic conversion and product yield of the liquid fraction from pyrolytic oil obtained by thermal pyrolysis shown in Figure 6 reflect that the three catalysts are gas-selective but provide important amounts of useful or valuable liquid cuts (jet fuel and diesel) that have to be added for the consideration of activity when liquid fuels are the target. In this way, HY zeolite is the most active, followed by HBEA and HUSY zeolites.
Two types of acid sites are present in studied zeolites: Brønsted acid sites and Lewis acid sites. In general, an increase in the Si/Al molar ratio typically decreases the acidity of this type of material [48,49]. Figure 7 shows the catalytic conversion as a function of the BrØnsted/Lewis acid site ratio. These results show that the HUSY catalyst (the zeolite with the highest Si/Al molar ratio and lowest BrØnsted/Lewis acid site ratio) had lower activity than HY and HBeta catalysts. Thus, the fraction of light products in pyrolytic oil from catalytic pyrolysis with the HUSY catalyst was relatively low. In summary, it can be appreciated that conversion decreases when the BrØnsted/Lewis acid site ratio also decreases, while the non-cracked bottom yield increases. Generally, the bottom fraction is composed of a large amount of paraffins and heavy compounds.
Olivera et al. [50] studied the catalytic pyrolysis of LDPE and found differences in the catalytic activity of the materials used mainly due to differences in their acid properties. Sarker et al. [51], while studying the co-pyrolysis of poplar wood sawdust and HDPE with acid-modified ZSM-5 as a catalyst, found that acid treatment affects the catalytic activity of ZSM-5 by changing the number of acid sites.
On the other hand, since mesopores in the zeolites seem to present a selective catalytic behavior [48], a study of the conventional conversion, which considers gases and naphtha, and the liquid yield in the function of mesopores area was also performed. Figure 8 shows the decrease in the conversion and yield of the liquid fraction as the mesopore area increases. In this sense, the zeolite with the lowest mesopore area (HY zeolite, 78 m2/g) presented the highest conversion (68%) and amount of liquid fraction (37%). Conversely, the pyrolysis performed with HBEA zeolite, the zeolite with the highest mesopore area (218 m2/g), showed the biggest conversion (71%) and liquid content (43%).

4. Conclusions

Catalytic pyrolysis experiments of PE from the non-selectively collected fraction from municipal solid waste were investigated in this work.
Thermal pyrolysis of PE residue produces greater quantities of liquids than gases, while catalytic pyrolysis with HY, HUSY and HBEA catalysts produces a greater quantity of gases. This fact demonstrates the role of catalysts in the degradation of plastic materials, facilitating the cracking process. With the use of Y and β catalysts, we could reduce the temperature and reaction time compared to the thermal pyrolysis process since the use of this typology of catalysts favors the breaking of the C–C bonds of the polymeric chains, obtaining higher yields of the gaseous fractions, especially with HY and HUSY catalysts. This result may be associated with the acidic properties of HY and HUSY zeolites, which significantly promote polymer degradation.
The characteristics of the liquid oil resulting from catalytic pyrolysis reveal values of density, API gravity, ash content and calorific value similar to those of fuels from fossil fuels. It is noteworthy how the use of the HY, HUSY and HBEA catalysts greatly reduces the viscosity of the liquid product when compared to the wax obtained in thermal pyrolysis; in this area, the HBEA zeolite stands out as the one that reduces the viscosity of the liquid product the most. The thermal degradation is similar for the three catalysts used. All TG curves show a great weight loss between 370 to 670 K. This weight loss occurs at a higher rate than in the product obtained from thermal pyrolysis.
Thermal pyrolysis of the PE residue resulted in a liquid product composed mainly of olefins and n-paraffins. However, catalytic pyrolysis caused a decrease in the concentration of paraffinic compounds and increased the content of, in some cases, aromatic and naphthene compounds. Additionally, the range of carbon number of compounds was changed to C7–C32.
Although there are numerous catalysts available for the pyrolysis process, the suitability depends on numerous variables, operating conditions, reactor typology and most importantly, the nature of the feed, which is very unfavorable in our work since the residue used comes from the fraction not selectively collected. Hence, it is quite heterogeneous both in the dirt that accompanies it and in the difference in the proportion found of LDPE and HDPE in the sample chosen in each experiment. All the catalysts used in this work produce a quality liquid product with similar properties, the most relevant differences being the viscosity and calorific value.

Supplementary Materials

The following supporting information can be downloaded at: https://www.mdpi.com/article/10.3390/app12084043/s1, Figure S1: N2 adsorption-desorption isotherms at 77 K of: (a) HY CBV 600 zeolite; (b) HUSY CBV 720 zeolite; (c) ammonium beta CP 814E zeolite; Figure S2. X-ray pattern of: (a) HY CBV 600 and HUSY CBV 720 zeolite; (b) HBEA CP 814E; Figure S3: GC-MS chromatogram and simulated distillation curve of the pyrolytic oil samples from non-catalytic and in situ pyrolysis: (a) without catalyst; (b) with HY; (c) with HUSY; (d) with HBEA; Table S1: Summary of the hydrocarbon type results of GC-MS chromatogram of pyrolytic oil samples from non-catalytic and in situ pyrolysis according to designations ASTM D2425, D2786, D2789 and ASTM D3239.

Author Contributions

Contextualization and methodology, M.C. and M.Á.M.-L.; Formal analysis: L.Q.; Investigation: L.Q. and M.F.P.-S.; Writing—original draft preparation: G.B. and A.P.; Validation and Supervision: all authors; Funding acquisition: M.C. and M.Á.M.-L. All authors have read and agreed to the published version of the manuscript.

Funding

This work is part of the project PID2019-108826RB-I00 funded by MCIN/AEI/10.13039/501100011033.

Institutional Review Board Statement

Not applicable.

Informed Consent Statement

Not applicable.

Data Availability Statement

Not applicable.

Conflicts of Interest

The authors declare no conflict of interest.

References

  1. PlasticsEurope. An Analysis of European Plastics Production, Demand and Waste Data. Plastics—The Facts 2020 PlasticsEurope. 2020. Available online: https://plasticseurope.org/knowledge-hub/plastics-the-facts-2020/ (accessed on 14 February 2022).
  2. Provincial Council of Granada. Municipal Waste Treatment Service. Municipal Waste Collection in the Province of Granada (Spain). 2015. Available online: https://www.resurgranada.es/datos_recogidas_RM.php (accessed on 14 February 2022).
  3. Calero, M.; Martin-Lara, M.A.; Godoy, V.; Quesada, L.; Martinez, D.; Peula, F.; Soto, J.M. Characterization of plastic materials present in municipal solid waste: Preliminary study for their mechanical recycling. Detritus 2018, 4, 104–112. [Google Scholar] [CrossRef]
  4. Rajendran, K.M.; Chintala, V.; Sharma, A.; Pal, S.; Pandey, J.K.; Ghodke, P. Review of catalyst materials in achieving the liquid hydrocarbon fuels from municipal mixed plastic waste (MMPW). Mater. Today Commun. 2020, 24, 100982. [Google Scholar] [CrossRef]
  5. Ragaert, K.; Delva, L.; Van Geem, K. Mechanical and chemical recycling of solid plastic waste. Waste Manag. 2017, 69, 24–58. [Google Scholar] [CrossRef] [PubMed]
  6. Papari, S.; Bamdad, H.; Berruti, F. Pyrolytic conversion of plastic waste to value-added products and fuels: A review. Materials 2021, 14, 2586. [Google Scholar] [CrossRef] [PubMed]
  7. Al-Salem, S.M.; Antelava, A.; Constantinou, A.; Manos, G.; Dutta, A. A review on thermal and catalytic pyrolysis of plastic solid waste (PSW). J. Environ. Manag. 2017, 197, 177–198. [Google Scholar] [CrossRef] [PubMed]
  8. Sharuddin, S.D.A.; Abnisa, F.; Daud, W.M.A.W.; Aroua, M.K. A review on pyrolysis of plastic wastes. J. Energy Convers. Manag. 2016, 115, 308–326. [Google Scholar] [CrossRef]
  9. Li, N.; Lium, H.X.; Cheng, Z.N.; Yan, B.B.; Chen, G.Y.; Wang, S.B. Conversion of plastic waste into fuels: A critical review. J. Hazard. Mater. 2022, 424, 127460. [Google Scholar] [CrossRef]
  10. Ahmad, I.; Khan, M.I.; Khan, H.; Ishaq, M.; Tariq, R.; Gul, K.; Ahmad, W. Pyrolysis study of polypropylene and polyethylene into premium oil products. Int. J. Green Energy 2015, 12, 663–671. [Google Scholar] [CrossRef]
  11. Onwudili, J.A.; Insura, N.; Williams, P.T. Composition of products from the pyrolysis of polyethylene and polystyrene in a closed batch reactor: Effects of temperature and residence time. J. Anal. Appl. Pyrolysis 2009, 86, 293–303. [Google Scholar] [CrossRef]
  12. Quesada, L.; Calero, M.; Martin-Lara, M.A.; Pérez, A.; Blázquez, G. Characterization of fuel produced by pyrolysis of plastic film obtained of municipal solid waste. Energy 2019, 186, 115874. [Google Scholar] [CrossRef]
  13. Miandad, R.; Barakat, M.A.; Aburiazaiza, A.S.; Rehanb, M.; Nizami, A.S. Catalytic pyrolysis of plastic waste: A review. Process Saf. Environ. Prot. 2016, 102, 822–838. [Google Scholar] [CrossRef]
  14. Lopez, G.; Artetxe, M.; Amutio, M.; Bilbao, J.; Olazar, M. Thermochemical routes for the valorization of waste polyolefinic plastics to produce fuels and chemicals. A review. Renew. Sustain. Energy Rev. 2017, 73, 346–368. [Google Scholar] [CrossRef]
  15. Benedetti, M.; Cafiero, L.; Angelis, D.D.; Dell’Era, A.; Pasquali, M.; Stendardo, S.; Tuffi, R.; Ciprioti, S.V. Pyrolysis of WEEE plastics using catalysts produced from fly ash of coal gasification. Front. Environ. Sci. Eng. 2017, 11, 11. [Google Scholar] [CrossRef]
  16. Kremer, I.; Tomic, T.; Katancic, Z.; Erceg, M.; Papuga, S.; Vukovic, J.P.; Schneider, D.R. Catalytic pyrolysis of mechanically non-recyclable waste plastics mixture: Kinetics and pyrolysis in laboratory-scale reactor. J. Environ. Manag. 2021, 296, 113145. [Google Scholar] [CrossRef] [PubMed]
  17. Aguado, J.; Serrano, D.P.; Miguel, G.S.; Escola, J.M.; Rodriguez, J.M. Catalytic activity of zeolitic and mesostructured catalysts in the cracking of pure and waste polyolefins. J. Anal. Appl. Pyrolysis 2007, 78, 153–161. [Google Scholar] [CrossRef]
  18. Awan, U.; Kraslawski, A.; Huiskonen, J. Progress from blue to the green world: Multilevel governance for pollution prevention planning and sustainability. In Handbook of Environmental Materials Management; Hussain, C.M., Ed.; Springer: Cham, Switzerland, 2020; pp. 1–22. [Google Scholar]
  19. Soto, J.M.; Blázquez, G.; Calero, M.; Quesada, L.; Godoy, V.; Martin-Lara, M.A. A real case study of mechanical recycling as an alternative for managing of polyethylene plastic film presented in mixed municipal solid waste. J. Clean. Prod. 2018, 203, 777–787. [Google Scholar] [CrossRef]
  20. Lakiss, L.; Gilson, J.-P.; Valtchev, V.; Mintova, S.; Vicente, A.; Vimont, A.; Bedard, R.; Abdo, S.; Bricker, J. Zeolites in a good shape: Catalyst forming by extrusion modifies their performances. Microporous Mesoporous Mater. 2020, 299, 110114. [Google Scholar] [CrossRef]
  21. Nichterwitz, M.; Grätz, S.; Nickel, W.; Borchardt, L. Solvent-free hierarchization of zeolites by carbochlorination. J. Mater. Chem. A 2017, 5, 221–229. [Google Scholar] [CrossRef] [Green Version]
  22. Batalha, N.; Comparot, J.-D.; Le Valant, A.; Pinard, L. In situ FTIR spectroscopy to unravel the bifunctional nature of aromatics hydrogenation synergy on zeolite/metal catalysts. Catal. Sci. Technol. 2022, 12, 1117–1129. [Google Scholar] [CrossRef]
  23. Awan, I.Z.; Beltrami, G.; Bonincontro, D.; Gimello, O.; Cacciaguerra, T.; Tanchoux, N.; Martucci, A.; Albonetti, S.; Cavani, F.; Di Renzo, F. Copper-nickel mixed oxide catalysts from layered double hydroxides for the hydrogen-transfer valorisation of lignin in organosolv pulping. Appl. Catal. A Gen. 2021, 609, 117929. [Google Scholar] [CrossRef]
  24. Zhang, R.; Xu, S.; Raja, D.; Khusni, N.B.; Liu, J.; Zhang, J.; Abdulridha, S.; Xiang, H.; Guan, Y.; Jiao, Y.; et al. On the effect of mesoporosity of FAU Y zeolites in the liquid-phase catalysis. Microporous Mesoporous Mater. 2019, 278, 297–306. [Google Scholar] [CrossRef]
  25. Gaurh, P.; Pramanik, H. Production and characterization of pyrolysis oil using waste polyethylene in a semi batch reactor. Indian J. Chem. Technol. 2018, 25, 336–344. [Google Scholar]
  26. Kathiravale, S.; Yunus, M.N.M.; Sopian, K.; Samsuddin, A.H.; Rahman, R.A. Modeling the heating value of municipal solid waste. Fuel 2003, 82, 1119–1125. [Google Scholar] [CrossRef]
  27. Totten, G.; Westbrook, S.; Shah, R. Fuels and Lubricants Handbook: Technology, Properties, Performance, and Testing, 2nd ed.; American Society for Testing & Materials: Seattle, WA, USA, 2019; Available online: https://www.astm.org/mnl37-2nd-eb.html (accessed on 14 February 2022).
  28. Thommes, M.; Kaneko, K.; Neimark, A.V.; Olivier, J.P.; Rodriguez-Reinoso, F.; Rouquerol, J.; Sing, K.S.W. Physisorption of gases, with special reference to the evaluation of surface area and pore size distribution (IUPAC Technical Report). Pure Appl. Chem. 2015, 87, 1051–1069. [Google Scholar] [CrossRef] [Green Version]
  29. Wei, B.Y.; Jin, L.J.; Wang, D.C.; Shi, H.; Hu, H.Q. Catalytic upgrading of lignite pyrolysis volatiles over modified HY zeolites. Fuel 2020, 259, 116234. [Google Scholar] [CrossRef]
  30. Elordi, G.; Olazar, M.; Lopez, G.; Amutio, M.; Artetxe, M.; Aguado, R.; Bilbao, J. Catalytic pyrolysis of HDPE in continuous mode over zeolite catalysts in a conical spouted bed reactor. J. Anal. Appl. Pyrolysis 2009, 85, 345–351. [Google Scholar] [CrossRef]
  31. Kenvin, J.; Mitchell, S.; Sterling, M.; Warringham, R.; Keller, T.C.; Crivelli, P.; Jagiello, J.; Pérez-Ramírez, J. Quantifying the complex pore architecture of hierarchical faujasite zeolites and the impact on diffusion. Adv. Funct. Mater. 2016, 26, 5621–5630. [Google Scholar] [CrossRef]
  32. Simon-Masseron, A.; Marques, J.P.; Lopes, J.M.; Ribeiro, F.R.; Gener, I.; Guisnet, M. Influence of the Si/Al ratio and crystal size on the acidity and activity of HBEA zeolites. Appl. Catal. A-Gen. 2007, 316, 75–82. [Google Scholar] [CrossRef]
  33. Baerlocher, C.; McCusker, L.B.; Olson, D.H. Atlas of Zeolite Framework Types, 6th ed.; Elsevier: Amsterdam, The Netherlands, 2007. [Google Scholar]
  34. Quesada, L.; Calero, M.; Martin-Lara, M.A.; Luzón, G.; Blázquez, G. Performance of different catalysts for the in situ cracking of the oil-waxes obtained by the pyrolysis of polyethylene film waste. Sustainability 2020, 12, 5482. [Google Scholar] [CrossRef]
  35. Quesada, L.; Calero, M.; Martin-Lara, M.A.; Pérez, A.; Blázquez, G. Production of an alternative fuel by pyrolysis of plastic wastes mixtures. Energy Fuel 2020, 34, 1781–1790. [Google Scholar] [CrossRef]
  36. Lopez-Urionabarrenechea, A.; de Marco, I.; Caballero, B.M.; Laresgoiti, M.F.; Adrados, A. Catalytic stepwise pyrolysis of packaging plastic waste. J. Anal. Appl. Pyrolysis 2012, 96, 54–62. [Google Scholar] [CrossRef]
  37. Singh, M.V.; Kumar, S.; Sarker, M. Waste HD-PE plastic, deformation into liquid hydrocarbon fuel using pyrolysis-catalytic cracking with a CuCO3 catalyst. Sustain. Energy Fuels 2018, 2, 1057–1068. [Google Scholar] [CrossRef]
  38. Lee, D.; Nam, H.; Wang, S.; Kin, H.; Kim, J.H.; Won, Y.; Hwang, B.W.; Kim, Y.D.; Nam, H.; Lee, K.-H.; et al. Characteristics of fractionated drop-in liquid fuel of plastic wastes from a commercial pyrolysis plant. Waste Manag. 2021, 126, 411–422. [Google Scholar] [CrossRef] [PubMed]
  39. Panda, A.K.; Singh, R.K. Experimental optimization of process for the thermo-catalytic degradation of waste polypropylene to liquid fuel. Adv. Energy Eng. 2013, 1, 74–84. [Google Scholar]
  40. Kusenberg, M.; Zayaud, A.; Roosen, M.; Thi, H.D.; Abbas-Abadi, M.S.; Eschenbacher, A.; Kresovic, U.; De Meester, S. A comprehensive experimental investigation of plastic waste pyrolysis oil quality and its dependence on the plastic waste composition. Fuel Process. Technol. 2022, 227, 107090. [Google Scholar] [CrossRef]
  41. Colantonio, S.; Cafiero, L.; De Angelis, D.; Ippolito, N.M.; Tuffi, R.; Ciprioti, S.V. Thermal and catalytic pyrolysis of a synthetic mixture representative of packaging plastics residue. Front. Chem. Sci. Eng. 2020, 14, 288–303. [Google Scholar] [CrossRef]
  42. Kasar, P.; Sharma, D.K.; Ahmaruzzaman, M. Thermal and catalytic decomposition of waste plastics and its co-processing with petroleum residue through pyrolysis process. J. Clean. Prod. 2020, 265, 121639. [Google Scholar] [CrossRef]
  43. Bagri, R.; Williams, P.T. Catalytic pyrolysis of polyethylene. J. Anal. Appl. Pyrolysis 2002, 63, 29–41. [Google Scholar] [CrossRef]
  44. Ding, W.B.; Liang, J.; Anderson, L.L. Thermal and catalytic degradation of high density polyethylene and commingled post-consumer plastic waste. Fuel Process. Technol. 1997, 51, 47–62. [Google Scholar] [CrossRef]
  45. Manos, G.; Garforth, A.; Dwyer, J. Catalytic degradation of high-density polyethylene over different zeolitic structures. Ind. Eng. Chem. Res. 2000, 39, 1198–1202. [Google Scholar] [CrossRef]
  46. Attique, S.; Batool, M.; Jalees, M.I.; Shehzad, K.; Farooq, U.; Khan, Z.; Ashraf, F.; Shah, A.T. Highly efficient catalytic degradation of low-density polyethylene using a novel tungstophosphoric acid/kaolin clay composite catalyst. Turk. J. Chem. 2018, 42, 684–693. [Google Scholar]
  47. Mitchell, M.M.; Hoffman, J.F.; Moore, H.F. Residual feed cracking catalysts. In Studies in Surface Science and Catalysis. Fluid Catalytic Cracking: Science and Technology; Magee, J.S., Mitchell, M.M., Eds.; Elsevier: Amsterdam, The Netherlands, 1993; pp. 293–338. [Google Scholar]
  48. Paucar-Sanchez, M.F. Study of the Activity of the Circulating Catalyst in the Fluidized Catalytic Cracking Unit (FCC) of the Esmeraldas State Refinery (REE). Master’s Dissertation, University of San Francisco, Quito, Ecuador, 2011. (In Spanish). [Google Scholar]
  49. Li, J.H.; Wang, Y.N.; Jia, W.Z.; Xi, Z.W.; Chen, H.H.; Zhu, Z.R.; Hu, Z.G. Effect of external surface of HZSM-5 zeolite on product distribution in the conversion of methanol to hydrocarbons. J. Energy Chem. 2014, 23, 771–780. [Google Scholar] [CrossRef]
  50. Olivera, M.; Musso, M.; De Leon, A.; Volonterio, E.; Amaya, A.; Tancredi, N.; Bussi, J. Catalytic assessment of solid materials for the pyrolytic conversion of low-density polyethylene into fuels. Heliyon 2020, 6, e05080. [Google Scholar] [CrossRef] [PubMed]
  51. Sarker, M.; Liu, R.H.; Rahman, M.M.; Li, C.; Chai, M.Y.; Nishu, N.; He, Y.F. Impact of acid-modified ZSM-5 on hydrocarbon yield of catalytic co-pyrolysis of poplar wood sawdust and high-density polyethylene by Py-GC/MS analysis. J. Energy Inst. 2020, 93, 2435–2443. [Google Scholar] [CrossRef]
Figure 1. Thermogravimetric curves of the pyrolytic oil samples were obtained by thermal (without catalyst) and catalytic cracking (HY, HUSY and HBEA).
Applsci 12 04043 g001
Figure 2. Simulated Distillation curves of the pyrolytic oil samples obtained by thermal (without catalyst) and catalytic cracking (HY, HUSY and HBEA).
Applsci 12 04043 g002
Figure 3. FTIR spectra of the pyrolytic oil samples from thermal and in situ catalytic pyrolysis: (a) Without catalyst; (b) HY; (c) HBEA and (d) HUSY.
Applsci 12 04043 g003
Figure 4. Hydrocarbon type distribution of the pyrolytic oil samples using different zeolites and without catalyst.
Applsci 12 04043 g004
Figure 5. Liquid product yield of the pyrolytic oil samples from thermal and in situ catalytic pyrolysis.
Applsci 12 04043 g005
Figure 6. Product yield of catalytic conversion of the liquid fraction obtained by thermal pyrolysis.
Applsci 12 04043 g006
Figure 7. The effect of the BrØnsted/Lewis acid site ratio in: (a) catalytic conversion of the liquid fraction obtained by thermal pyrolysis; (b) bottom percentage of the liquid fraction obtained by thermal pyrolysis.
Applsci 12 04043 g007
Figure 8. The effect of the micropore and mesopore area ratio in: (a) catalytic conversion of the oil obtained by thermal pyrolysis; (b) liquid fraction percentage of the oil obtained by thermal pyrolysis.
Applsci 12 04043 g008
Table 1. Information on used commercial catalysts.
ZeoliteMolecular FormulaNominal Cation FormSi/Al Molar RatioBrønsted Acitidy
(μmol/g)
Lewis Acidity
(μmol/g)
Total Acidity
(μmol/g)
Commercia Name Zeolyst
Zeolite HY-Hydrogen2.6272104995CBV 600
Zeolite HUSYH11.3Al11.3Si181O384Hydrogen15160318 CBV 720
Zeolite Ammonium Beta (HBEA)(NH4)3.33Al3.33Si61O128Ammonium12.54482081030CP 814E
Table 2. Pore volumes and surfaces of parent zeolites by N2 adsorption-desorption.
CatalystHY
CBV 600
HUSY
CBV 720
HBEA
CP 814E
Micropore volume (cm3/g)0.190.240.13
Mesopore volume (cm3/g)0.940.220.42
Total volume (cm3/g)1.130.460.56
Micropore area (m2/g)474589324
External surface area (m2/g)78174218
BET surface area (m2/g)553762542
Table 3. Physical characterization of the pyrolytic oil samples using different zeolites.
CatalystWithout CatalystHY
CBV 600
HUSY
CBV 720
Ammonium Beta
CP 814E
C (wt%)83.283.884.583.4
H (wt%)14.013.513.812.8
N (wt%)0.280.440.180.22
O (wt%)2.612.241.553.58
H/C (molar ratio)2.011.931.961.84
O/C (molar ratio)0.0240.0200.0140.032
Density (g/cm3)0.8230.8160.8250.817
API gravity40.241.839.841.6
Viscosity (cSt *)135213720989
HHV (MJ/kg)47.647.248.045.8
pH *5.96.06.06.0
* Data from [12,34,35].
Publisher’s Note: MDPI stays neutral with regard to jurisdictional claims in published maps and institutional affiliations.

