Abstract
The purpose of this research was to analyze the applicability of infrared thermography in assessing the condition of an e-bike battery. The main challenge was to interpret the surface radiation detected by a thermal imaging camera. In addition to basic challenges of thermography, such as determining the emissivity, the angle of image acquisition, the problem of low resolution and thermal inertia, it was necessary to understand the physical behavior of the elements inside the battery and battery pack that respectively determine the dynamics and shape of the thermal pattern. E-bike batteries are mainly composed of 18650 format Li-ion cells, and the topology of the battery cell is related to the energy profile of the system. With the aim of establishing a link between the surface radiation patterns and the parameters of the individual 18650 cells that dictate the internal thermal behavior, a detailed analysis of the battery pack interior, upon its lifetime, was performed. Based on the results of the capacity analysis of the individual cells and determination of the exact position of the cells within the structure of the battery, a visualization and comparison with the thermographic records were performed to determine whether infrared thermography is able to diversify faulty cells. The conclusion of the study is that it is not possible to make a judgment about the thermal pattern expression or the pattern shape based on the estimated capacity values; however, based on the pattern, it is possible to draw a conclusion about the homogeneity of the capacity of the individual battery cells.
1. Introduction
The work provides a postmortem analysis of an e-bike battery pack in the form of a detailed factorial review that surveys the battery pack end of service and lifetime properties after seven years of its age, five years of use, and hundreds of charge cycles in combination with 2543 km traveled in total. The analysis was performed on an e-bicycle, PEDELEC (pedal electric cycle), Kalkhoff Groove 28” made in 2011, equipped with a front hub motor and Li-ion battery pack of nominal voltage 36 V, capacity 9 Ah (324 Wh). Experiences of other users with the same bike indicate a battery pack lifetime of four years regardless of the mileage but in the same period of time, as well as under similar terrain and climatic conditions [1]. The environmental temperatures that prevailed at the time of the use significantly contribute to battery life shortening [2], and age [3] contributed to an annual capacity drop of 20%. That is supported by an extremely small number of charging cycles compared with the usual practice of a cycle analysis [4]. The bicycles were being used on flat terrain from 2014 to 2018, without significant vibrational stresses that could reduce the battery life [5]. The average wind speed at the site was 2.1 m/s, and riding speed of the e-bike was in the range of 20 to 22.8 km/h. In comparison, at the same location, the average car speed was from 38.4 to 39.7 km/h and the classic bicycle from 12.5 to 14.6 km/h [6].
An end-of-life battery problem directly impacts energy policy and transportation energy efficiency improvements, as well as the overall e-bike lifecycle. There are various possible causes of battery end of life [7]. Therefore, the article provides a brief history of the development of electric bicycles, a link between bicycle riding parameters and corresponding energy needs, and a description of the usual daily route to evoke the typical dynamics of battery usage. The core of the article deals with the usability case and comparative analysis of infrared thermograms, with the results of the analysis of the individual cells of the real-life e-bicycle battery pack based on a CAD modeling and spatio-thermal cells diversification. In order to preserve and prolong the functionality of the real-life exemplary e-bicycle, an additional analysis and modus operandi of a possible battery lifetime extension is proposed. It is based on the concept of the battery revival, in this case replacing 20 cells (half of the total number) with cells from other systems (laptops/notebooks). A condition assessment of scrapped cells and their placing optimization within the battery pack structure was carried out, thus allowing further unrestricted use of the exemplary real-life electric bike and giving back its functionality.
2. Electric Bicycles
Bicycles are predominantly the first vehicle we learn to ride. Sometimes it is a way of living and a favorite recreational choice [8]. The globally accepted trends in the form of utilizing energy systems efficiently—governed by strategical planning in transport as well—encourage the use of bicycles and electric bicycles in accordance with the strategies for reducing greenhouse gas emissions and energy consumption overall [9,10].
2.1. A Brief History of Bicycles
The history of bicycle development and cycling is interesting and rich, making it impossible to summarize in a few words. Only the most significant moments in bicycle history (bicycle technical progress [11] and the phenomenon of electromobility [10]) are elaborated here. The following years were the key moments in the rich bicycle development history:
- 1817 Appearance of first bicycle, the Vélocipede, by Karl Freiherr von Drais in Germany [12].
- 1839 Introduction of pedal and pedaling by Kirkpatrick MacMillan in Scotland [13,14].
- 1861 Relocation of pedals to the front wheel in “Michaulina” by Pierre Michaux in France [15].
- 1869 Introduction of solid rubber tires [16].
- 1864 Appearance of the chain by James Slater [17].
- 1870 Invention of the tangentially spoked wheel by James Starley [17].
- 1874 Women’s bicycle with a side seat and one pedal by James Starley [17].
- 1885 A modern kind of bicycle (Rover) designed by John Starley Kemp [18].
- 1888 Introduction of a cushion type of pneumatic tires [19,20].
- 1895 Appearance of the first electric bicycle by Ogden Bolton Jr. [21].
- 1896 Cycling became a sport at the first Olympic games in the Athens in 1896 [16].
- 1975 Panasonic made the E-bike driven by 24 V lead-acid car batteries [15].
- 1989 Sanyo introduced NiCd batteries [22].
- 1993 Yamaha presented PAS, an electrically power assisted bicycle [23].
- 2002 EU introduced and set on e-mobility legislation 2002/24/EC [24].
- 2003 NiMH chemistry prevailed in batteries for electrical driving systems [23].
- 2004 Li-ion became a standard battery choice [23].
- 2005 onward, a demand for PEDELECs grows constantly [25].
The written history of the electric bike began in 1881 when the Frenchman Gustave Truvé put an electric drive on a tricycle [26]. In 1895, Ogden Bolton Jr. submitted patent US 552 271 A for an electric bike with two wheels. John Schnepf patented the “friction drive” in 1899 [27]. In 1975, Panasonic produced an electric “pony” bicycle that did not look much different from today’s models. Furthermore, there have been a lot of different patents since the 1970s, but we can single out 1989 when Sanyo Enacle introduced NiCd chemistry-based batteries. In 1993, Yamaha electric bicycles presented PAS, the pedal-assist system. The same company used lead–acid batteries back in 1993 but switched to the NiCd one in 1995 and has been using NiMH batteries on some models since 1999. Generally, NiMH batteries have been a standard battery since 2003, and only a year after 2004, a Li-ion battery took over that title. It can be said that the era of electric bicycles began in the mid-90s with the price reduction in neodymium-based magnets caused by the rapid growth of the computer industry.
2.2. Technical and Regulatory Aspects of Electric Cycling
The technical solution of the electric bicycle in the form of PEDELEC (pedal electric cycle) [28] is the closest to the initial idea of cycling. A greater demand for PEDELECs began in 2005 primarily thanks to the wider use of Li-ion batteries. PEDELEC is “bicycles with pedals equipped with one auxiliary electric motor with a maximum continuous rated power of 0.25 kW, whose output value is constantly reduced and finally switched off when the vehicle reaches a speed of 25 km/h, or sooner if the cyclist stops stepping on the pedals” and is given in the description of PEDELEC legislature, in EU Directive 2002/24/EC [24]. Despite its higher weight (approximately 27 kg and more) than a conventional bike (approximately 14 kg), PEDELEC allows an easier movement regardless of terrain configuration and helps to lower the physical exertion of the driver. European PEDELEC manufacturers for the USA and Canada market, owing to the difference in legislation, produce 350 W motors exclusively. Furthermore, the USA legislature even allows the use of electric motors up to 750 W and Canada up to 500 W. In Europe, Switzerland allows electric motors up to 500 W, but the speed limit is in accordance with the EU—limited to 25 km/h. Switzerland legislature supported their 500 W limitation due to the needs and specifics of their predominant terrain configuration. In the end, PEDELEC is subject to the requirements of the international standard related to bicycles EN 14764 “City and trekking bicycles—Safety requirements and test methods”, but in addition, it must meet the requirements of EN 15194 “Cycles—Electrically power assisted cycles—EPAC bicycles”, which refers to the electrical part only.
When riding, the biggest problems for the rider are hills and strong winds. The average rider develops 100 W recreationally and up to 200 W when in a good physical condition. A professional rider can normally produce 200 W to 300 W during a non-competitive session and in races of up to 400 W continuously over a distance of 14 km. The power requirements for riding are best described in Figure 1 [29]. The green interval indicates the average operational cycling speed that prevails during a cycling session, the orange-colored intervals present a maximum value of the power required, and a light-orange one is a power requirement in the event of the mean wind occurrence at the cycling site.
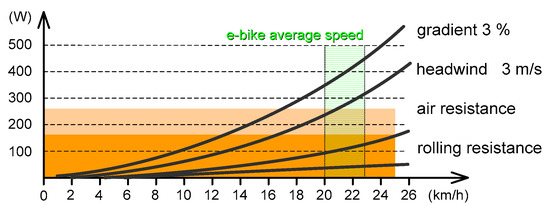
Figure 1.
Power intervals required for cycling.
In order to define, more precisely, the need for cycling power, it is necessary to deterministically describe such a process in the form of a deterministic mathematical relation. The mathematically defined and sufficiently accurately described need for cycling power is given with expression (1). The dependence and influential behavior of individual variables are in detail described in [14].
where
- W mechanical power at the wheel, [W] (which is slightly less than what the rider produces due to losses and coupling efficiency);
- Ka drag factor, [kg/m] (usually in interval of 0.1 to 0.3; for a small recumbent rider 0.1; large upright rider 0.3; typical values 0.2–0.25);
- V bike velocity, [m/s];
- s road slope, [%], (e.g., 5% = 0.05);
- Cr rolling resistance coefficient [1] (0.02 for racing tires; 0.08 for heavily grooved MTB; and 0.03 typically for road bikes);
- Vw heading wind velocity, [m/s];
- mr driver mass, [kg];
- mb bike mass, [kg];
- g gravitational constant, [m/s2] (taken an average value of 9.81 m/s2).
The battery as a power source is a more critical element of an electric bicycle because it intrinsically poses a hazard in the event of overcharging, short circuit, or physical damage [10]. Batteries that are not certified by BATSO (Battery Safety Organization) should not be left unattended on the charger. Batteries also have a limited lifespan, so the warranty is usually limited to two years due to manufacturer-specific application scenarios. Since 2014, there has been a growing movement in the EU to standardize batteries and charging systems used in LEVs (light electric vehicles), and there are plans to implement their requirements in WD 61851, Part 3-3: Requirements for Light Electric Vehicles (LEV) battery swap systems [25].
The “Bicycle Kalkhoff Groove 28”, which was used as a real-world test bed for the analysis in this article, has been used since 2014. It has a replaceable battery located in the vehicle above the rear wheel, Figure 2.
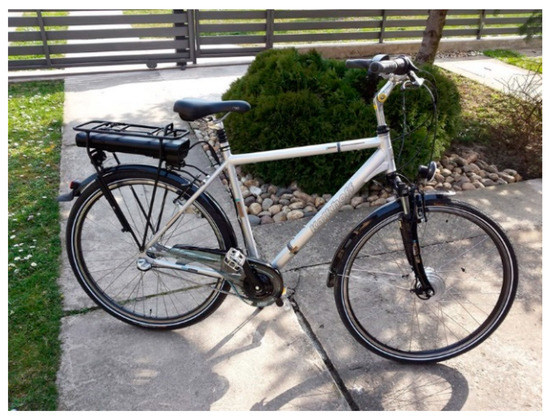
Figure 2.
“Kalkhoff Groove 28” bicycle.
The bicycle battery, which is the subject of the further analysis, is shown in Figure 3, in the form of a CAD modeled object placed in its holder/carrier assembly. The reason for the CAD modeling of the Kalkhoff battery is closely related to the need for the further analysis involving the parameterization of the geometric variables of the circuit components (battery cells, enclosures, and BMS systems) and the application of the infrared thermography analysis. In Figure 3, the leftmost drawing shows a top view of the holder and the inserted battery, and the mid-left drawing shows a bottom view, while the mid-right and rightmost drawings show what the battery itself looks like when it is pulled out of the holder.

Figure 3.
Kalkhoff Groove 28” battery pack model.
3. Analysis and Diagnostics of the Battery Pack
3.1. Thermography in the Battery State Assessment and Analysis
Infrared thermography is a contactless method for determining the temperature distribution on the surface of an observed object by measuring the intensity of radiation in the infrared region of the electromagnetic spectrum. Thermography is often used as a maintenance tool. In the field of electric power engineering, thermography is an unavoidable test method closely associated with the measurement of electrical parameters [30]. Contrary to popular belief that an infrared thermal imager/camera measures temperature, it actually registers electromagnetic radiation in the infrared portion of the spectrum, to which it assigns temperature values depending on the imaging parameters. Figure 4 graphically shows the components of the radiation registered by the infrared thermal imaging camera.
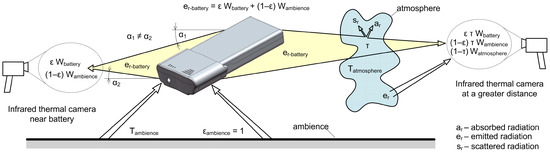
Figure 4.
Components of longwave infrared radiation registered by the infrared thermal camera.
Given the distance, the atmosphere may have an effect on the registered radiation. The distance of the camera depends mainly on the optical angle of the camera lens. The closer the camera gets to the object to be analyzed, the weaker the influence of the atmosphere becomes, but the possibility of reflection of the operator’s radiation increases. In addition to the fact that the power dissipation inside the battery is higher, its radiation becomes dominant, and the influence of the ambient radiation on the overall balance becomes smaller. The smaller distance to the object has another effect—namely, the radiation captured at different angles relative to the normal on the surface. The acquisition angle is important because of the change in emissivity, which can be seen in detail in Figure 5. Emissivity is the most important parameter and can change depending on the viewing angle or different materials used. The emissivity also depends on the wavelength at which the object is observed [31]. The emissivity of the plastic, used for the housing, is 0.95. It is confirmed by sticking a strip of reference tape on the battery housing, which is not visible on any of the thermograms, thus confirming the choice of the correct emissivity. In Figure 5, in addition to the emission values at each angle shown with a red line, we see (in brown) the temperature value that the camera would associate with the same amount of radiation at different angles for the spot measurement from Figure 6a. A significant error in the choice of emissivity would result in the display of an incorrect temperature value, shown in blue in Figure 5.
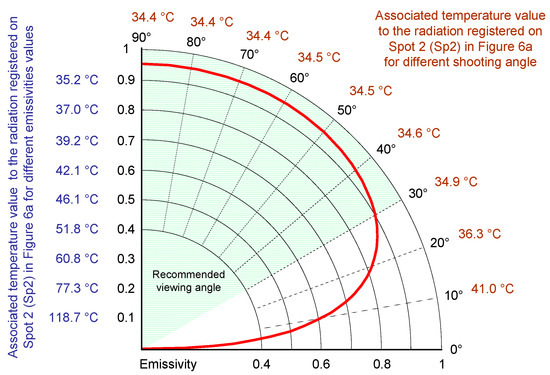
Figure 5.
Dependence of the emissivity of the battery pack and influence of emissivity changes on the temperature displayed by the thermal camera.
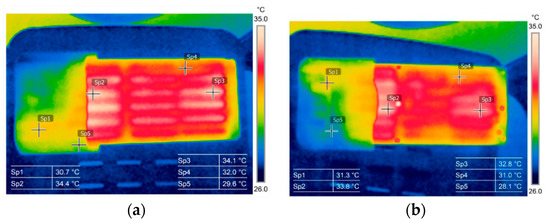
Figure 6.
Functional battery pack charging thermal patterns near the end of its life, (a) top view (b) bottom.
We can conclude that in the case of plastic enclosures, variations in the angle of capture do not significantly affect the measurement result, especially if we take into account the ±2 °C accuracy of the thermal imaging cameras used in this study, Table 1. Based on the details of the thermograms, it is clear that a camera with a higher resolution was used for the analysis. The higher resolution gives a clearer pattern but not necessarily better measurement results.

Table 1.
Comparison of cameras used for imaging and analysis, FLIR E60bx and E6.
Thermography easily finds its application in the battery analysis [32]. Unfortunately, the thermographic analysis is challenging in our case due to the closed system, mainly because the measurement of electrical parameters is not possible. The consideration of using the thermographic analysis as a method for evaluating the condition of the battery and diagnosing faults arose from the fact that the available range is constantly decreasing after each full charge cycle. Thus, there was a need for a non-invasive analysis method that would not interfere with the functionality of the battery under operating conditions. Figure 6 shows a thermographic recording of the battery pack during charging, near the end of its life. The image was taken when the range of the bike was significantly decreasing. Figure 7 shows the same battery and its thermographic pattern during charging, taken when the battery was at the beginning of its life, long before the images in Figure 6 were taken. The battery in Figure 7 shows a nearly uniform thermal pattern of a fully functional battery that is in excellent condition. However, this uniform thermal pattern has a slight disturbance in the heat distribution pattern caused by the spatial distribution of heat sources in the battery pack or cells.
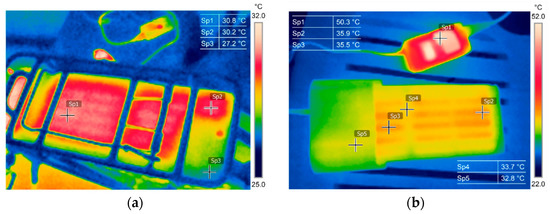
Figure 7.
Thermal pattern of the healthy battery pack: inside the bike holder (a) and outside (b).
Next, irregularities in the thermal patterns, shown in Figure 6, are a consequence of changes in the internal ohmic resistance of individual battery cells as well as their capacity. That fact leads to improper and spatially irregular thermal dissipation within the battery pack confinement space. When the battery started to show signs of reaching the end of its service life, the bicycles started to shut off/down unexpectedly. Soon after noticing the aforementioned first signs, the thermographic analysis of the bike battery pack was performed, and thermal hot spots were noticed. Additionally, asymmetry and spatial irregularity of heat dissipation within the pack now was augmented significantly, Figure 8. Hot spots with a temperature difference of ≥2 °C represent a possible battery defect that warrants further investigation, according to NETA (International Electrical Testing Association). The pattern disturbance is located in the spatial center of the battery and is normal since it represents the core of the entire battery. Furthermore, the comparison of the thermograms in Figure 7 and Figure 8 inevitably leads to the conclusion that a homogeneous heat distribution pattern may indicate a healthy condition or proper battery behavior.
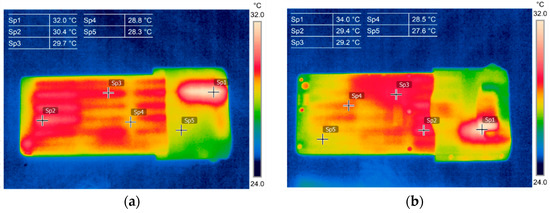
Figure 8.
Battery pack assembly thermal pattern, at the end of the lifetime, (a) top layer, (b) bottom layer.
Since the battery was no longer suitable for cycling, it was disassembled, and the internal circuits and visual condition of the battery cells were analyzed. Figure 9 depicts the interior of the subjected battery pack, fully disassembled with focus on areas where the hotspots are noticed (suspected faulty cells and a BMS circuitry).
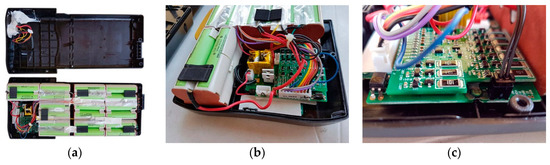
Figure 9.
Disassembled battery pack (a), cells that produce the hot spots (b), a BMS circuitry (c).
The battery pack structural analysis resulted in a circuit principal diagram, shown in Figure 10. The results can be summed up as follows: the battery pack consists of 40 cells Panasonic CGR18650CG type, cells nominal voltage is 3.6 V and nominal charge capacity of 2250 mAh, individual cell weight is 45 g [33]. The electrical connections arrangement was made in the form of ten cell blocks connected in series (10s), and each cell block consists of four parallel connected cells (4p)—a so-called the 4p10s battery cluster. The way cells are joined together is crucial for packet behavior [34,35]. The balancing leads connection points, for the sake of clarity, are marked with colored circles at the BMS and in between cellblocks. Each balancing line has temporally thermal overcurrent protection accomplished by Polymer PTC Resettable Fuse of JK-D Series; furthermore, the BMS has two additional thermal monitoring and protection probes.
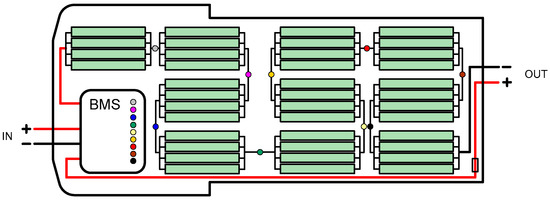
Figure 10.
Principal structural diagram and electric schematic of 4p10s battery pack.
The further analysis was followed by connecting the open battery to a charger device, and at the same time, the pack was monitored with a thermal imager during the charging process—charging cycle. The thermographic analysis of the thermal pattern of the pack’s cells shows that the first two pack cells were significantly warmer than the adjacent cells and that remedial action must be taken according to [30]. The reason for building up the heat in some cells is supported by the fact that ohmic resistance of all cells in the block is not approximately equal anymore—i.e., it is noticeably different. Instead of equally distributed charge current among all (four) cells within the block, the current is unevenly, reversely proportionally distributed through the cells according to their ohmic resistance. In our case, only two cells take all charge current, and other two in the cell block have significantly higher ohmic resistance. Contrary to intuition with infrared thermography, the healthy cells warm up while the defective cells look cooler, Figure 11.
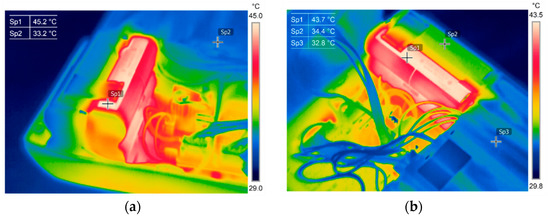
Figure 11.
Overheated healthy cells that conduct the overall battery pack current (a view from different perspectives), (a) from rear side and (b) from top side.
Further, in order to determine the condition of other cells in cellblocks, a different indirect thermal and electrical parameter observation method had to be used. For this purpose, a balancing resistor thermal throttling observation combined with the thermal imaging analysis was applied. The thermogram shown in Figure 12a illustrates that there is no dissipation on the two resistors, which means that only two parallel connections are still in the charging process and that most of the parallel connections are in a similar state. Additionally, that points to the fact that the battery blocks are not homogeneous in their electrical (resistive/ohmic) properties. Figure 12 visually describes the dynamics of BMS operation as well as dissipation, which leads to an increase in the pack ambient temperature of 6 °C, while the maximum temperature of the active resistor at the time of recording increases by 19.6 °C.
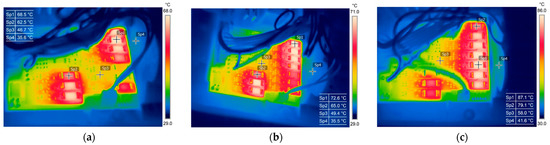
Figure 12.
BMS thermal load during charging process at: (a) 1:45 PM; (b) 1:58 PM; (c) 2:05 PM.
3.2. Battery Cells Electric Parameters and Functional Analysis
To complete the research, further analysis steps were taken to restore the functionality of the battery and make it operational again. The steps that followed included the replacement of the defective, faulty cell with a healthy one. Prior to that, a determination of electrical properties of each cell had to be conducted and correspondingly their spatial arrangement within the pack had to be planned. In this case, a disassembly and the measurement of all 40 battery pack cells was carried out; their state and electrical condition (internal ohmic resistance and charge capacity) were determined using the universal charger JUNS iCharger 1010B+ and terminals with fresh, clean contact surface to achieve the least amount of influence on the contact resistance. It was a difficult and a time-consuming process, but in the interest of the research and the fact that it was a single battery pack, the complete detailed analysis was necessary. In the attempt to revive batteries, which involves the management of larger battery quantities, it is necessary to use methods of cell selection based on the measurement of resistance or X-rays [36]. Prior to the analysis continuation, we numerically designated and labeled all battery pack cells for easier analysis management, Figure 13.
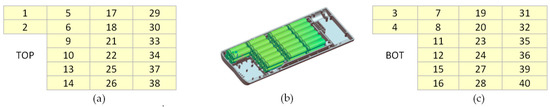
Figure 13.
Labels of individual cells in the pack arrangement, an assembly (b); a top cell layer TOP (a); a bottom cell layer BOT (c).
The first two faulty cells, marked with 1 and 3 in Figure 13, do not show voltage within expected, normal operating range. The cells discharged during the measurement despite the high internal resistance of the device. An example of an extreme is cell 1 whose diagram of discharge, via a voltmeter, is shown in Figure 14a. When cell 1 was removed from the cellblock, it mechanically caused a slight perforation of the battery tab weld [37], making it unsafe to handle further. During the cell recharge, cell 3 received voltage values of 5.76 V, which is significantly higher than the maximum allowed values of 4.2 V, Figure 14b. The fact that there was no inflammation clearly indicates the degree of degradation.
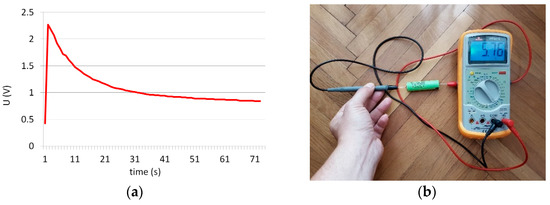
Figure 14.
Cell No. 1 high impedance load discharge graph (a) and overcharged cell No. 3, temperature and structurally stable (b).
The behavioral properties, electro-chemical characteristics, and energy transformational mechanisms of battery cells based on Li-ion chemistry are well described and explained in detail in the articles by Xuning et al. in Thermal runaway mechanism of lithium-ion battery for electric vehicles [38], and by Minggao et al. in Overcharge-induced capacity fading analysis for large format lithium-ion batteries with LiyNi1/3Co1/3Mn1/3O2 + LiyMn2O4 composite cathode [39]. According to the behavioral properties of such battery cells for the measured voltage of 5.76 V, a temperature of more than 50 °C is expected to be reached, but the cell remained at ambient temperature. That 50 °C temperature marks a breaking point when the cells start to change their structure mechanically and the deformation of the cell becomes visually noticeable. The absence of the above indicates a significantly impaired capacity of the cell. Figure 15 depicts a charge-thermal dynamic of an overcharged cell in relation to its measured voltage.
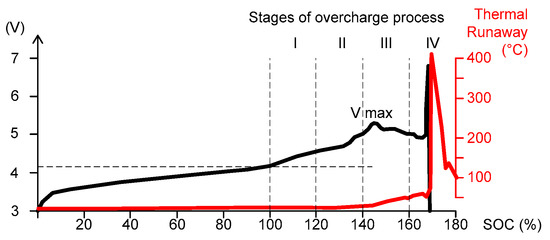
Figure 15.
Li-9on cell charging process and stages of overcharge states [38,39].
The measurement setup, shown in Figure 16, consists of a universal Li-ion charger (leftmost), the JUNS iCharger 1010B+, and current clamps (middle image) with a clean contact surface for achieving the lowest possible clamp contact resistance. Furthermore, the same figure (rightmost) shows the contents of the disassembled e-bike battery pack without 2 pack-origin defective cells and with 10 replacement cells acquired from the used laptop battery packs. Replacement cells from the used battery packs were originally planned to be a replacement source and eventually to replace all defective cells of the initial e-bike battery pack [40]. Among newly sourced cells, we found two battery cells that matched in appearance and labeled exactly as those in the original e-bike battery pack, so we placed them at cell positions 1 and 3 in the initial battery pack layout. With that substitution, the battery pack was restored back to the operational state, thus making the further investigation and analysis possible to continue and the battery pack usable again to some extent.
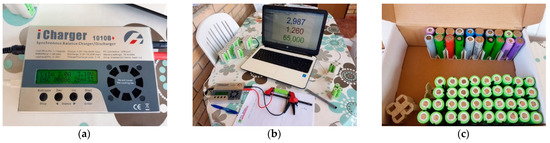
Figure 16.
A system charger (a); battery cell current clamp (b); and disassembled battery pack cells (c).
Table 2 shows the discharge parameters of all cells that were previously charged to nominal maximum voltage of 4.2 V. The cells were discharged with current of 2 A to voltage of 3 V [41]. That specific value of discharge current is the value closest to finding the maximum capacity under real conditions and also the value expected for the maximum battery load under dynamic operating conditions for an engine at the typical speed shown in Figure 1. According to the technical data [33], the cut-off voltage is 2.50 V, but after reaching the voltage of 3 V, the capacity change is significantly less noticeable, which further confirms the guidelines of [41].
Table 2.
Battery pack cell parameter values during 2 A discharge.
The evaluation of the cells’ condition and the parameter measurements showed that the cells’ condition in the pack was poor. The best one of all cells had only 48.93% of the initial and nominal capacity. Despite the fact that the resistance values, read by the charger, depend significantly on the cell’s electromechanical connection [42], it still can be confirmed that the cells with a higher capacity had the lowest value of internal resistance [43]. The current–voltage (C-V) discharging dynamics of the best cell, cell no. 21, and the cell with the highest capacity, are shown in Figure 17a.
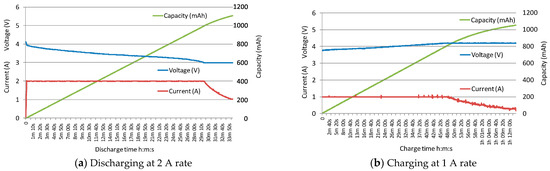
Figure 17.
Comparison of discharge (a) and charge (b) current–voltage (C-V) characteristics of best performing cell, cell No. 21.
Finally, discharge-based capacity assessment of all cells within the pack led to a visually representative spatial allocation of cell capacities for both pack assembly layers (TOP and BOT), Figure 18. The results confirm the poor state of the pack assembly and a high level of degradation.
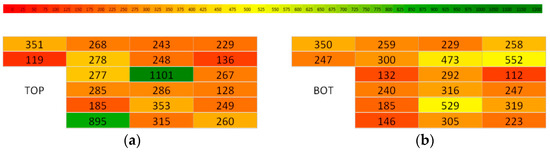
Figure 18.
Spatial distribution of TOP/upper- (a) and BOT/lower-layer (b) pack cells capacities.
In order to confirm cells’ capacities determined with the discharging method, a second approach was employed to validate the results. That approach relied on and utilized the charge counting method while the cell was charged up to its maximum voltage but with current that was lower in relation to the nominal discharge current of 2 A—i.e., charge current of 1 A was used. The results of the capacities determined in this way are shown in Table 3.
Table 3.
Battery pack cells parameter values during 1 A charge.
The results in Table 3, a charge-based capacity assessment approach, validate and confirm the results of the cell capacity determination method that utilized the discharging approach. Finally, a charge-based approach yielded similar visually representative cell spatial mapping for both pack assembly layers (TOP and BOT), as shown in Figure 19.
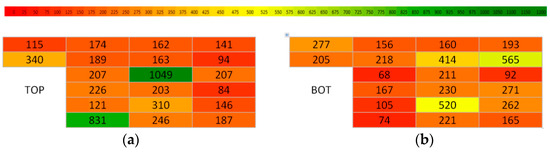
Figure 19.
TOP/Upper- (a) and BOT/lower-layer (b) cell capacities determined with 1 A cells charging method.
The results support the confirmation of the poor pack assembly state and cells degradation determined by the discharging method. The comparison of cells capacities, determined with the charging and discharging method, shows a capacity deviation in accordance with the expectation [41,44], as presented in Figure 20. A cell parameters degradation was expected [45,46], but in the case of the analyzed battery pack, it occurred rather quickly.
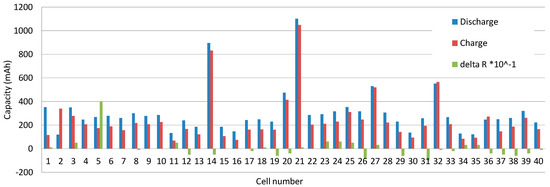
Figure 20.
Comparison of cells capacities determined with the charging and discharging method.
The visualization of the spatial capacity distribution within the battery pack as well as the corresponding temperature distribution are shown in Figure 21 and Figure 22. Unlike the previously presented thermograms, we decided to export the radiometric data to a more readable and convenient form for a further analysis—a CSV file—and to display it in a different form by processing in a basic spreadsheet tool.
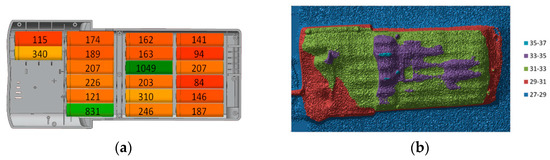
Figure 21.
Comparison of (a) TOP layer capacity distribution in (mAh) and (b) measured temperature values in (°C).
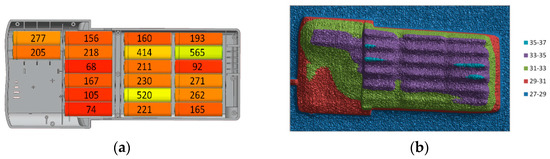
Figure 22.
Comparison of (a) BOT layer capacity distribution in (mAh) and (b) measured temperature values in (°C).
Figure 21 and Figure 22 clearly depict that the thermal distribution pattern and cell state of capacity cannot be correlated. The reason is in the inertia of the thermal process [47] and in the balancing dynamics shown in Figure 12. Among all the cells in the analyzed battery pack, only two can be used to make a new package—cells 14 and 21. Attempting to assemble a battery from these cells would be pointless, as none of the parallel cells would be able to match the capacity of a healthy cell, Table 4.
Table 4.
Optimal layout of pack compound in 4p10s configuration arranged from the existing cells regarding cell capacities (mAh).
4. Battery Pack Revitalization, Results, and Discussion
4.1. Revival and Optimization of Battery Assembly
In order to preserve the e-bike function by revitalizing its battery pack, we decided to use the batteries from Figure 16c (used laptop battery cells) to assemble the new functional pack. The availability of such cells is a rather limiting factor for making a proper selection, and in case of a larger quantity, it is necessary to check all the cells and choose the best performing [48]. Due to the different cells, which are not designed for the currents expected from e-bike batteries, it was decided to lower the discharge current by 20% to obtain more accurate capacity values. Table 5 shows cells’ charge states and cells’ capacities after discharging all cells with current of 1.8 A. The higher cell resistance values are the result of oxidation of the contacts [42]. The reused cells 21 and 14 show a higher capacity due to the lower discharge current and the slight overcharge, which can be seen from the voltage value before the discharge begins. The overcharge is the result of using a simple charger to shorten the charging time.
Table 5.
Reused cell capacities determined with the discharging method (discharged with 1.8 A).
After an optimal structure of the 2p10s pack was determined, the new pack parameter assessment was conducted, Table 6. As is shown in Figure 23, a repaired battery pack now has 35% of the capacity of a new one. However, it still has three times the capacity of a pack that has reached its end of service, when it has only 11% of the initial capacity and two defective cells in a pack assembly. In addition to Figure 23, there is a thermogram that monitors the equilibrium of the items during the initial fill that shows a fairly uniform thermal load on all cells. Such uniform distribution of the thermal load across the cells in the pack is a strong indicator that the battery pack is now recovered to some degree, as determined by the characteristics of the cells used.
Table 6.
Optimal layout of pack compound in 2p10s configuration restated from the used cells (considering its capacities, mAh).
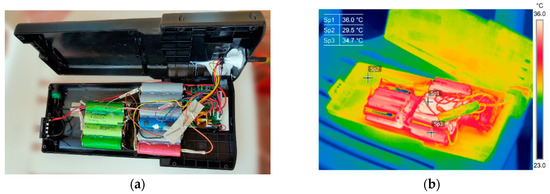
Figure 23.
Repaired and revived battery pack: an assembly (a) and its thermal footprint (b).
4.2. Functional Assessment and Discussion
The new battery pack, shown in Figure 23, is only a temporary solution that allows the bicycle to be used until a new battery pack is manufactured or otherwise acquired. It will be restructured by the means of its mechanical construction and cooling system, which makes the new battery pack lighter and longer lasting. The previous experience of modeling systems, based on the principle of air cooling [49,50], as well as analyzing various forms of battery packs [51], will take into account the models of individual cells [52], and serve to build a CAD model of the battery pack using a feature-based parametric modeling system. In addition, due to the poor thermal management of the current battery pack, optimization of the thermal management system of the new battery pack must be performed. The optimization will be based on a computational fluid dynamics analysis (CFD) that also takes into account the electrical parameters of the cells, such as the variable cell resistance, the state of cell charge, and ancillary components. The analysis of a new battery pack will rely on CFD simulations of different pack models [53], taking into account the characteristics and specifics of the electric bicycle application.
5. Conclusions
Infrared thermography is a practical and non-destructive test and measurement method for battery condition assessment and analysis, but only in a qualitative way. Changes in a battery and battery cells’ temperature values, due to thermal capacity and thermal resistance, can only provide information on the battery condition. On the thermograms of healthy batteries, a temperature difference of 2.1 °C was found at points with similar cells. At the end of the battery life, this difference was slightly larger and amounted to 2.4 °C. The reported values were close to the camera accuracy of ±2 °C and depended on power dissipation due to current that we could not measure. Therefore, general conclusions based on absolute temperature values are not possible. Owing to the high thermal sensitivity of the NETD camera, the pattern can be seen. The faulty battery had the largest temperature difference of 5.5 °C, which, according to a recommendation from the literature, is an indication of a possible defect (needs to be investigated). The homogeneity of the thermal pattern can serve as a criterion for assessing the health and service expectancy of the battery pack. Thermal hotspots within a pack, which occur when one or more battery cells start to fail, are caused by overloading of healthy cells. Contrary to the common reasoning, where hotspots represent a place of failing component, the situation here is the opposite. The hotspot represents a place of a normal operational component that generates excessive heat due to acting as a charging current sink, having low resistance within a cellblock. In addition, the thermographic analysis of the balancing circuitry can also provide information about the state of charge and capacity of individual cells by monitoring the power dissipation at each balancing resistor over time. Due to the way the e-bike’s battery pack operates, a failure of the battery pack usually inevitably means a failure of all the cells. The main factors leading to the battery cell failure are cell aging and operating conditions associated with high operating and resting temperatures. In order to draw conclusions based on thermographic records, detailed knowledge of the physical behavior of the object under study is required. Therefore, it was necessary to perform a detailed analysis of the battery pack. The main conclusion of the study is that it is not possible to make a judgment about the appearance of the thermal pattern or the pattern shape based on the estimated capacity values. However, based on the thermal pattern, it is possible to make a judgment about the homogeneity of the capacity of individual battery cells. Thus, in its qualitative form, infrared thermography is an ideal non-destructive method for monitoring the condition of e-bike batteries. Due to the high thermal sensitivity/NETD of today’s thermal imaging cameras, the dynamic of thermal pattern during charging and discharging can provide information about the condition of a battery pack.
Author Contributions
Conceptualization, H.G. and M.K.; methodology, H.G. and T.B.; software, M.K. and T.K.; validation, T.K. and T.B.; formal analysis, H.G.; investigation, H.G.; resources, H.G. and M.K.; data curation, H.G., T.B., T.K. and M.K.; writing—original draft preparation, H.G., M.K. and T.K.; writing—review and editing, M.K. and T.K.; visualization, H.G. and M.K.; supervision, T.B.; project administration, T.B.; funding acquisition, M.K. and H.G. All authors have read and agreed to the published version of the manuscript.
Funding
This research received no external funding.
Conflicts of Interest
The authors declare no conflict of interest.
References
- Glavaš, H.; Karakašić, M.; Petrović, I.; Vidaković, D. PEDELEC Li-Ion Battery Pack Lifetime. In Proceedings of the VIII International Conference Industrial Engineering and Environmental Protection 2018 (IIZS 2018), University of Novi Sad Technical Faculty “Mihajlo Pupin”, Zrenjanin, Serbia, 11–12 October 2018; pp. 27–33, ISBN 978-86-7672-309-6. [Google Scholar]
- Kim, J.; Mallarapu, A.; Finegan, D.P.; Santhanagopalan, S. Modeling cell venting and gas-phase reactions in 18650 lithium-ion batteries during thermal runaway. J. Power Sources 2021, 489, 229496. [Google Scholar] [CrossRef]
- Juarez-Robles, D.; Jeevarajan, J.A.; Mukherjee, P.P. Degradation-Safety Analytics in Lithium-Ion Cells: Part I. Aging under Charge/Discharge Cycling. J. Electrochem. Soc. 2020, 167, 160510. [Google Scholar] [CrossRef]
- Pastor-Fernández, C.; Bruen, T.; Widanage, W.D.; Gama-Valdez, M.A.; Marco, J. A Study of Cell-to-Cell Interactions and Degradation in Parallel Strings: Implications for the Battery Management System. J. Power Source 2016, 329, 574–585. [Google Scholar] [CrossRef]
- Berg, P.; Spielbauer, M.; Tillinger, M.; Merkel, M.; Schoenfuss, M.; Bohlen, O.; Jossen, A. Durability of lithium-ion 18650 cells under random vibration load with respect to the inner cell design. J. Energy Storage 2020, 31, 101499. [Google Scholar] [CrossRef]
- Glavaš, H.; Barić, T.; Keser, T. Pedelec—Pedal Electric Cycle. In Proceedings of the 35th Conference on Transportation Systems with International Participation Automation in Transportation 2015, Zagreb, Croatia, London, UK, 3–8 November 2015. [Google Scholar]
- Kabir, M.M.; Demirocak, D.E. Degradation mechanisms in Li-ion batteries: A state-of-the-art review. Int. J. Energy Res. 2017, 41, 1963–1986. [Google Scholar] [CrossRef]
- EuroVelo. The European Cycle Route Network. Available online: http://www.eurovelo.com/en/eurovelos (accessed on 30 April 2021).
- Weiss, M.; Dekker, P.; Moro, A.; Scholz, H.; Patel, M.K. On the electrification of road transportation—A review of the environmental, economic, and social performance of electric two-wheelers. Transp. Res. Part D Transp. Environ. 2015, 41, 348–366. [Google Scholar] [CrossRef] [PubMed]
- GoPedelec! (A Manual). 2015. Available online: www.gopedalec.eu (accessed on 24 July 2015).
- Hoffmann, U. Das Fahrradbuch, Kauf, Technik, Wartung, Reparaturen E-Bikes und Pedelecs, Stiftung Warentest; Stiftung Warentest: Berlin, Germany, 2012. [Google Scholar]
- Leaserad at Go Pedelec. Available online: http://www.datei.de/public/extraenergy/GoPedelec_Handbuch-DE-V1_0-b.pdf (accessed on 30 April 2021).
- Kirkpatrick MacMillan (1812–1878) Inventor of the Pedal Bicycle. 2021. Available online: http://gaukartifact.com/2013/04/05/kirkpatrick-macmillan-1812-1878-inventor-of-the-pedal-bicycle (accessed on 28 February 2021).
- Wilson, D.G. Bicycling Science, 3rd ed.; MIT Press Cambridge: London, UK, 2004. [Google Scholar]
- Remusat, T. Pierre Michaux and the History of the Motorized Bike, HISTORIA; Librairie Jules Tallandier: Paris, France, 2001; pp. 40–41. [Google Scholar]
- Herlihy, D.V. Bicycle: The History; Yale University Press: New Haven, CT, USA, 2006; ISBN 0-300-10418-9. [Google Scholar]
- Renold: A Company History. 2021. Available online: https://www.renold.com/company/history (accessed on 30 April 2021).
- Hadland, T.; Lessing, H.E. Bicycle Design, An Illustrated History; Massachusetts Institute of Technology: Cambridge, MA, USA, 2014; ISBN 978-0-262-02675-8. [Google Scholar]
- Kyle, C.R.; Weaver, M.D. Aerodynamics of human-powered vehicles. Proc. Inst. Mech. Eng. Part A J. Power Energy 2004, 218, 141–154. [Google Scholar] [CrossRef]
- Clayton, N. The Birth of the Bicycle; Amberley Publishing: Stroud, UK, 2016; ISBN 1445648822. [Google Scholar]
- Bolton, O., Jr. Electrical Bicycle. U.S. Patent No. 552,271, 31 December 1895. Available online: https://patents.google.com/patent/US552271?oq=Ogden+Bolton+Jr (accessed on 21 February 2021).
- Ron/Spinningmagnets. Electric Bike History, Patents from the 1800’s. 2013. Available online: https://www.electricbike.com/e-bike-patents-from-the-1800s/ (accessed on 30 April 2021).
- Power Assisted Bicycle, Two Decades of Electrically Power Assisted Bicycles; Yamaha Motor Co., Ltd.: Iwata, Japan, 2013.
- European Commission. Directive 2002/24/EC of the European Parliament and of the Council of 18 March 2002 Relating to the Type-Approval of Two or Three-Wheel Motor Vehicles. Available online: https://eur-lex.europa.eu/legal-content/EN/TXT/?uri=CELEX:32002L0024 (accessed on 30 April 2021).
- Neupert, H. Light-Electric-Vehicles Global Market Trends and Standardization; China Cycle Show: Shanghai, China, 2014. [Google Scholar]
- Desmond, K. Gustave Trouve: French Electrical Genius (1839–1902); McFarland & Company: Jefferson, NC, USA, 2015; ISBN 0786497092. [Google Scholar]
- Schnepf, J. U.S. Patent US627066A, 1898. Available online: https://patents.google.com/patent/US627066 (accessed on 30 April 2021).
- eCycleElectric. Available online: http://www.ecycleelectric.com/susanne-bruesch (accessed on 30 April 2021).
- CROW. Design Manual for Bicycle Traffic; CROW: Ede, The Netherlands, 2016; ISBN 9789066286597. [Google Scholar]
- Glavaš, H.; Józsa, L.; Barić, T. Infrared Thermography in Energy Audit of Electrical Installations. Teh. Vjesn. 2016, 23, 1533–1539. [Google Scholar] [CrossRef][Green Version]
- Baehr, H.D.; Stephan, K. Wärme-und Stoffübertragung; Springer GmbH Deutschland: Wien, Austria, 2019; ISBN 978-3-662-58441-5. [Google Scholar]
- Zhang, G.; Tian, H.; Ge, S.; Marple, D.; Sun, F.; Wang, C.Y. Visualization of self-heating of an all-climate battery by infrared thermography. J. Power Sources 2018, 376, 111–116. [Google Scholar] [CrossRef]
- Panasonic. CGR18650CG Datasheet; Panasonic: Osaka, Japan, 2018. [Google Scholar]
- Ye, M.; Song, X.; Xiong, R.; Sun, F. A Novel Dynamic Performance Analysis and Evaluation Model of Series-Parallel Connected Battery Pack for Electric Vehicles. IEEE Access 2019, 7, 14256–14265. [Google Scholar] [CrossRef]
- Baronti, F.; Di Rienzo, R.; Papazafiropulos, N.; Roncella, R.; Saletti, R. Investigation of series-parallel connections of multi-module batteries for electrified vehicles. In Proceedings of the IEEE International Electric Vehicle Conference (IEVC), Florence, Italy, 17–19 December 2014; pp. 1–7. [Google Scholar] [CrossRef]
- Chen, H.; Shen, J. A degradation-based sorting method for lithium-ion battery reuse. PLoS ONE 2017, 12, e0185922. [Google Scholar] [CrossRef]
- Masomtob, M.; Sukondhasingha, R.; Becker, J.; Sauer, D.U. Parametric Study of Spot Welding between Li-ion Battery Cells and Sheet Metal Connectors. In Proceedings of the Engineering Journal, 7th Thai Society of Mechanical Engineers-International Conference on Mechanical Engineering, (TSME-ICoME 2016), Chiang Mai, Thailand, 13–16 December 2016; Volume 21. [Google Scholar] [CrossRef]
- Feng, X.; Ouyang, M.; Liu, X.; Lu, L.; Xia, Y.; He, C. Thermal runaway mechanism of lithium-ion battery for electric vehicles: A review. Energy Storage Mater. 2018, 10, 246–267. [Google Scholar] [CrossRef]
- Ouyang, M.; Ren, D.; Lu, L.; Li, J.; Feng, X.; Han, X.; Liu, G. Overcharge-induced capacity fading analysis for large format lithium-ion batteries with LiyNi1/3Co1/3Mn1/3O2+LiyMn2O4 composite cathode. J. Power Sources 2015, 279, 626–635. [Google Scholar] [CrossRef]
- Salinas, F.; Krüger, L.; Neupert, S.; Kowal, J. A second life for li-ion cells rescued from notebook batteries. J. Energy Storage 2019, 24, 100747. [Google Scholar] [CrossRef]
- Pop, V.; Bergveld, J.H.G.; Op het Veld, P.P.L.; Regtien, D.D.; Notten, P.H.L. Modeling Battery Behavior for Accurate State-of-Charge Indication. J. Electrochem. Soc. 2006, 153, A2013–A2022. [Google Scholar] [CrossRef]
- Bolsinger, C.; Zorn, M.; Birke, K.P. Electrical contact resistance measurements of clamped battery cell connectors for cylindrical 18650 battery cells. J. Energy Storage 2017, 12, 29–36. [Google Scholar] [CrossRef]
- Ning, G.; Haran, B.; Popov, B.N. Capacity fade study of lithium-ion batteries cycled at high discharge rates. J. Power Sources 2003, 117, 160–169. [Google Scholar] [CrossRef]
- Andrea, D. Battery Management Systems for Large Lithium-Ion Battery Packs; Artech House: Norwood, MA, USA, 2010; p. 02062. ISBN 9781608071050. [Google Scholar]
- Baumann, M.; Wildfeuer, L.; Rohr, S.; Lienkamp, M. Parameter variations within Li-Ion battery packs–Theoretical investigations and experimental quantification. J. Energy Storage 2018, 18, 295–307. [Google Scholar] [CrossRef]
- Marcis, V.A.; Praneeth, A.V.J.S.; Patnaik, L.; Williamson, S.S. Analysis of CT-CV Charging Technique for Lithium-ion and NCM 18650 Cells Over Temperature Range. In Proceedings of the IEEE International Conference on Industrial Technology (ICIT), Buenos Aires, Argentina, 26–28 February 2020; pp. 947–952. [Google Scholar] [CrossRef]
- Tang, W.; Tam, W.C.; Yuan, L.; Dubaniewicz, T.; Thomas, R.; Soles, J. Estimation of the critical external heat leading to the failure of lithium-ion batteries. Appl. Therm. Eng. 2020, 179, 115665. [Google Scholar] [CrossRef] [PubMed]
- Kim, J.; Cho, B.H. Screening process-based modeling of the multi-cell battery string in series and parallel connections for high accuracy state-of-charge estimation. Energy 2013, 57, 581–599. [Google Scholar] [CrossRef]
- Saw, L.H.; Ye, Y.; Tay, A.O.; Chong, W.T.; Kuan, S.H.; Yew, M.C. Computational fluid dynamic and thermal analysis of Lithium-ion battery pack with air cooling. Appl. Energy 2016, 177, 783–792. [Google Scholar] [CrossRef]
- Ling, Z.; Wang, F.; Fang, X.; Gao, X.; Zhang, Z. A hybrid thermal management system for lithium-ion batteries combining phase change materials with forced-air cooling. Appl. Energy 2015, 148, 403–409. [Google Scholar] [CrossRef]
- Yoon, C.O.; Lee, P.Y.; Jang, M.; Yoo, K.; Kim, J. Comparison of internal parameters varied by environmental tests between high-power series/parallel battery packs with different shapes. J. Ind. Eng. Chem. 2019, 71, 260–269. [Google Scholar] [CrossRef]
- Yang, X.; Hu, X.; Chen, Z.; Chen, Y. Effect of ambient dissipation condition on thermal behavior of a lithium-ion battery using a 3D multi-partition model. Appl. Therm. Eng. 2020, 178, 115634. [Google Scholar] [CrossRef]
- Buidin, T.I.C.; Mariasiu, F. Modeling Approach of an Air-Based Battery Thermal Management System for an Electric Vehicle. Appl. Sci. 2021, 11, 7089. [Google Scholar] [CrossRef]
Publisher’s Note: MDPI stays neutral with regard to jurisdictional claims in published maps and institutional affiliations. |
© 2022 by the authors. Licensee MDPI, Basel, Switzerland. This article is an open access article distributed under the terms and conditions of the Creative Commons Attribution (CC BY) license (https://creativecommons.org/licenses/by/4.0/).