Email Address
The author wishes to make a change to the mail address of Dr. Wei He, which is now wei.he.2@warwick.ac.uk.
Figure Correction
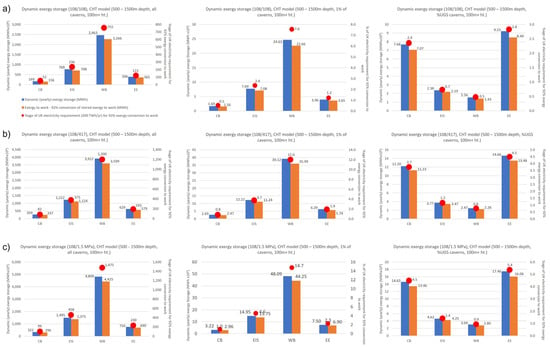
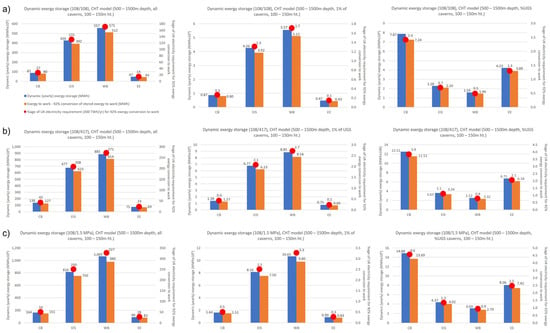
The author wishes to make the following correction to this paper [1]. In Figure 6 and Figure 8, the wrong graphs were used for column 1: in Figure 6, the wrong graphs appeared in rows 1, 2 and 3, where in the original manuscript, depths ranging from 500 m to 1300 m (from Figure 5) were used, when the correct depths for these graphs ranged from 500 m to 1500 m; in Figure 8, the wrong graphs appear in rows 2 and 3. In the original manuscript, depths of from 500 m to 1300 m for 100 m+ cavern heights were used (again from Figure 5), when the correct depths and cavern heights for these graphs were 500–1500 m and 100–150 m. The correct graphs are given below for Figure 6 and Figure 8. In Figure 6, column 2, rows 1 and 3, and in Figure 7, column 2, rows 2 and 3, minor errors in the plotted data have been corrected. The correct graphs are given below.

Figure 6.
Plots of dynamic exergy storage and exergy to work estimates for the preferred CHT model over the depth range 500–1500 m and cavern heights 100 m+ considered for CAES. Parts (a–c) show graphs for differing injection/withdrawal rates (108/108 kg/s and 108/417 kg/s) or fill and pressure reduction rates (108 kg/s/1.5 MPa/h) for all potentially available caverns, 1% of available caverns, and estimates based upon the number of UGS caverns in the basins. Additionally shown, by basin, the percentage of UK electricity demand for 92% of stored exergy to work. Key common to all; see Figure 3.

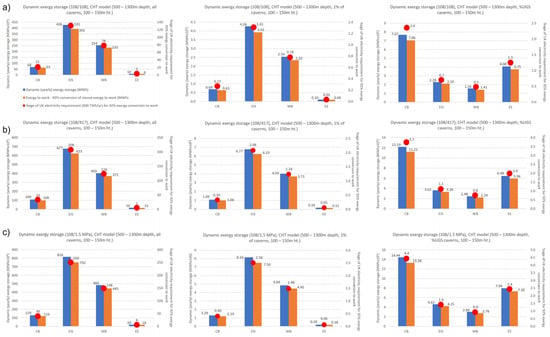
Figure 7.
Plots of dynamic exergy storage and exergy to work estimates for the preferred CHT model, over the depth range 500–1300 m and cavern heights 100–150 m considered for CAES. Parts (a–c) show graphs for differing injection/withdrawal rates (108/108 kg/s and 108/417 kg/s) or fill and pressure reduction rates (108 kg/s/1.5 MPa/h) for all potentially available caverns, 1% of available caverns and estimates based upon the number of UGS caverns in the basins. Additionally shown, by basin, the percentage of UK electricity demand for 92% of stored exergy to work. Key common to all; see Figure 3.

Figure 8.
Plots of dynamic exergy storage and exergy to work estimates for the preferred CHT model, over the depth range 500–1500 m and cavern heights 100–150 m considered for CAES. Parts (a–c) show graphs for differing injection/withdrawal rates (108/108 kg/s and 108/417 kg/s) or fill and pressure reduction rates (108 kg/s/1.5 MPa/h) for all potentially available caverns, 1% of available caverns and estimates based upon the number of UGS caverns in the basins. Additionally shown, by basin, the percentage of UK electricity demand for 92% of stored exergy to work. Key common to all; see Figure 3.
The authors apologize for any inconvenience caused and state that the scientific conclusions are unaffected. The original article has been updated.
Reference
- Evans, D.; Parkes, D.; Dooner, M.; Williamson, P.; Williams, J.; Busby, J.; He, W.; Wang, J.; Garvey, S. Salt Cavern Exergy Storage Capacity Potential of UK Massively Bedded Halites, Using Compressed Air Energy Storage (CAES). Appl. Sci. 2021, 11, 4728. [Google Scholar] [CrossRef]
Publisher’s Note: MDPI stays neutral with regard to jurisdictional claims in published maps and institutional affiliations. |
© 2022 by the authors. Licensee MDPI, Basel, Switzerland. This article is an open access article distributed under the terms and conditions of the Creative Commons Attribution (CC BY) license (https://creativecommons.org/licenses/by/4.0/).