1. Introduction
Among the many vibration forms of bridge structures, buffeting is a random forced vibration generated by the structure under the action of natural wind fluctuation components. It is one of the main areas of research content for the wind-induced vibration of long-span bridges. Low wind speed causes buffeting, and continuous buffeting may cause local fatigue failure of the bridge structure, affecting the bridge’s lifespan. In addition, excessive buffeting response of a bridge structure under strong winds negatively affects the safety of construction personnel, equipment, and the comfort of drivers and pedestrians during the operation of the structure. Its concept was proposed in 1930 and originated from the vibration of aircraft in turbulent flow [
1]. In the mid-1950s, Scruton first used the concept of buffeting to describe the forced vibration caused by wake flow when he was studying the dynamic response of the Runcorn–Widnes bridge [
2]. The theoretical analysis of the buffeting problem of long-span bridges began when Davenport [
3,
4] applied the statistical analysis method of buffeting in the aviation field to bridge structures. In the 1960s, based on the theory of aerodynamics, Davenport [
3,
4] took the lead in proposing the concept of aerodynamic admittance, defined the joint acceptance function, and considered the time and space distribution of the aerodynamic force on the structure. Furthermore, the spanwise correlation of the fluctuating wind was used to describe the spanwise correlation of the buffeting force, and a relatively complete buffeting analysis method for long-span bridges and other slender linear structures was established. In the 1970s, Scanlan et al. [
5,
6,
7,
8] extended their research results from the flutter theory to the analysis of the buffeting response, and believed that the self-excited force in the flutter analysis would affect the buffeting response of the bridge structure. They expressed the self-excited force caused by structural motion in the form of flutter derivatives, used aerodynamic stiffness and aerodynamic damping to modify Davenport’s theory, and then introduced the mechanical admittance function to reflect the influence of structural motion on the system transfer function. Since then, Davenport’s buffeting theory, in combination with Scanlan’s theory, has become the basis for the theoretical buffeting analysis and calculation method for long-span bridge structures. In the following decades, many scholars [
9,
10,
11,
12,
13,
14,
15] did fruitful work regarding the buffeting response prediction for long-span bridges under turbulent flow.
So far, the buffeting response has mainly been obtained by two methods: wind tunnel tests and theoretical calculation. The latter is usually based on the principle of aerodynamics, establishes a mathematical model of the relevant wind load, and then applies the structural dynamics method to solve the wind-induced response of the structure. The current theoretical method is based on the pioneering work achieved by Davenport, Scanlan, etc., and has been improved in many subsequent studies. However, due to the characteristics of atmospheric turbulence and the complexity and diversity of bridge section forms, a perfect analytical model cannot be established for the prediction of the buffeting response of bridges. It is difficult to calculate the aerodynamic force and wind-induced responses of bridge structures through purely theoretical analysis. The wind tunnel test is an indispensable and important method, and is still mainly used to identify parameters such as aerodynamic admittance and flutter derivatives.
At present, wind tunnel test techniques [
16,
17,
18] for long-span bridge buffeting response prediction are divided into three categories: full-bridge aeroelastic model wind tunnel tests, taut strip model wind tunnel tests and sectional model wind tunnel tests. Among them, the full-bridge aeroelastic model wind tunnel test is the most direct test method for measuring the buffeting response of long-span bridges. Based on accurately simulating the bridge model, it directly measures the dynamic response of the bridge to the wind in a simulated natural wind field, and then converts the response of the model measured in the test to the real bridge through a scale ratio. This method is a complete-scale simulation of a real bridge, which can naturally simulate the bridge’s three-dimensional aeroelastic effect and dynamic mode shape. It obtains the buffeting response of the bridge more intuitively, and avoids the identification of the aerodynamic parameters of the bridge section. However, the full-bridge test features the drawbacks of high cost, lengthy duration, and difficult model design and production. With the continuous increase of current bridge spans, full-bridge tests of long-span bridges require larger test wind tunnel sizes. In contrast, the sectional model mainly simulates the mid-span section of the main span of the bridge according to the geometric similarity principle, and has a large scale ratio. It has the advantages of low cost, less difficulty in design and production, short preparation time, etc. In addition, the shape of the sectional model can easily be changed, and the aerodynamic shape of the bridge can be optimized in time according to the test results, so it is more widely used. For the prediction of the buffeting response of long-span bridges, the sectional model test is an important auxiliary means of conducting the theoretical calculation method. The theoretical calculation of the buffeting response of long-span bridges has always used sectional model tests to identify the unsteady aerodynamic parameters of the bridge sections. The buffeting response of the bridge is then obtained through the buffeting analysis theory. However, because the sectional model wind tunnel test cannot simulate turbulent flow fields with large turbulence integral scales, the three-dimensional effect has affected the prediction results of the buffeting response for many years. In recent years, many scholars have proposed empirical correction methods for this problem, but they have not solved the problem with respect to the theoretical foundation or experimental technology [
19]. The taut strip model, an aeroelastic model between the full-bridge aeroelastic model and the sectional model, has often been used in previous studies to compare and analyze the difference between the test results of the sectional model and the full-bridge aeroelastic model. The taut strip model test is used to measure the buffeting response of the bridge girder under the condition that the additional aerodynamic interference caused by the structural auxiliary facilities (such as suspenders, cables, towers, etc.) is eliminated. The method considers the first several vibration modes of the bridge, and can consider both the two-dimensional effect of the sectional model and the three-dimensional vibration effect of the bridge structure.
For a long time, sectional model tests only used force and pressure measurements to identify the aerodynamic admittance to assist with the theoretical calculations [
20]. Due to the influence of factors such as the applicability of the strip assumption [
21,
22], there is no case wherein the buffeting response of long-span bridges is predicted by sectional model vibration tests. However, the force measurement test is difficult in the early leveling, correlation measurement, etc., and the accuracy is difficult to guarantee; the pressure measurement test has limitations such as the inability to measure the truss girder and accurately measure the overall force of the bridge in the completed state. In addition, Yan et al. [
23] identified the aerodynamic admittance of the bridge section in the free vibration state. The results show that the aerodynamic admittance is related to the vibration state of the main girder, so it is necessary to consider the effect of the actual bridge vibration on the aerodynamic admittance [
24,
25]. This makes the prediction results biased by the traditional calculation method based on the rigid sectional model pressure or force measurement test to identify aerodynamic admittance on account of the ignorance of the vibration of the structure. Fortunately, the vibration test can effectively avoid the limitations of force and pressure tests. At the same time, it can truly reflect the structural motion state, and comprehensively consider the effects of self-excited force terms such as aerodynamic damping and aerodynamic stiffness. Recently, Su et al. [
26] proposed the concept of the integrated transfer function based on the research of Li et al. [
27,
28,
29] on the influence of the structural aspect ratio on the three-dimensional effect of turbulence, and gave a long-span bridge buffeting response prediction method based on the integrated transfer function. The method points out that the aspect ratio of the test model will have a significant impact on the prediction accuracy of the buffeting response, and can correct the deviation of the prediction result of the buffeting response caused by the inaccurate simulation of the wind field parameters in the wind tunnel. However, even though Su et al. [
26] proved the feasibility of the integrated transfer function in the prediction of the buffeting response of long-span bridges through rigorous theoretical derivation and verified the independence of the integrated transfer function from the wind field characteristics through full-bridge aeroelastic model wind tunnel tests, they only expected the results to provide ideas for the buffeting response prediction of long-span bridges based on the identification of integrated transfer functions, and the accuracy and effectiveness of the method have not been directly verified by sectional model vibration tests. In addition, they considered that the sectional model test would also eliminate the additional aerodynamic interference of the structural ancillary facilities. At the same time, compared with the full-bridge test, the taut strip model test has the characteristics of low cost and short duration, and can also consider the three-dimensional vibration of the structure. The taut strip model has been selected to replace the full-bridge aeroelastic model to perform the buffeting response test, and the results are compared with the prediction results based on the sectional model test in this paper. For this reason, the paper uses a long-span bridge with a basic section as an example, takes the turbulent characteristics simulated in the taut strip model test as the target wind field, and relies on three different test techniques to predict the buffeting response of the structure. These techniques are as follows:
1. Identifying the aerodynamic parameters, such as aerodynamic admittance, through sectional model force measurement tests, and then calculating the response according to the traditional buffeting response calculation method;
2. Identifying the integrated transfer function of the structure through the sectional model vibration test, then predicting the buffeting response by using the method proposed by Su et al. [
26];
3. Measuring the buffeting response of the structure through the taut strip model test.
Each buffeting response prediction result was then compared to investigate the long-span bridge buffeting response prediction methods based on the above three different test techniques and verify the accuracy and effectiveness of the prediction method based on the sectional model vibration test to identify the integrated transfer function.
2. Theoretical Analysis
At present, in the more commonly used analysis process, although the higher-order modes and the coupling effects between modes have a certain degree of influence on the structural buffeting response, the fundamental frequency still dominates [
30]. Therefore, the coupling between modes in different directions is usually ignored without affecting the calculation accuracy. This paper will analyze the problem without considering the modal coupling effects. In addition, since the theoretical principles of the vertical, lateral and torsional buffeting responses are consistent, to simplify the derivation and demonstration process, this paper takes the vertical buffeting response as an example to study.
2.1. Traditional Buffeting Response Calculation
As mentioned above, most of the current bridge structure buffeting analysis uses Davenport’s correction through the introduction of the aerodynamic admittance function into Scanlan’s quasi-steady aerodynamic force expression. Although much work has been completed by many scholars to continuously improve the theories, these theoretical approaches are based on the pioneering work of Davenport and Scanlan.
Because the studies on buffeting by Su et al. [
26] and Li et al. [
27,
28,
29] used the wavenumber domain, in order to compare the traditional buffeting response calculation method with the following method, the buffeting response in the frequency domain is converted to the wavenumber domain for expression according to the relationship between the wavenumber and the frequency
. Based on the random vibration theory and the buffeting analysis principle, the power spectrum of the bridge buffeting displacement response can be expressed as:
where
is the power spectral density of the vertical buffeting displacement response at the axial coordinate
of the bridge;
is the
i-th mode shape of the vertical motion;
is the vertical generalized mass;
is the air density;
is the mean wind velocity;
is the half-width of the bridge, where
is the width;
is the lift coefficient of the bridge section;
is the longitudinal wavenumber, where
is the frequency;
is the one-wavenumber aerodynamic admittance function;
is the vertical one-wavenumber frequency response function;
is the vertical one-wavenumber joint acceptance function of the structure;
is the longitudinal one-wavenumber fluctuating wind velocity spectrum.
As mentioned above, the traditional method for calculating the buffeting response is to identify the aerodynamic admittance and the aerodynamic derivative in the frequency response function of the bridge section through sectional model tests, and then obtain the power spectrum of the structural buffeting displacement response based on Equation (1). Among them, the aerodynamic admittance function is an important transfer function for calculating the buffeting response, which is identified by the sectional model pressure or force measurement test. The RMS (root mean square) of the buffeting displacement can be obtained by integrating the buffeting response power spectrum:
Finally, according to the SRSS (Square Root of Sum Square) method, the total buffeting response without considering the coupling effect between modes can be obtained:
where m is the number of structural modes.
2.2. Calculation of Buffeting Response Based on Sectional Model Vibration Test
Traditional buffeting response calculation and analysis has always been based on the strip assumption; it divides the bridge into several strip units with independent aerodynamic properties in the spanwise direction, so as to obtain the aerodynamic response of the whole bridge through the integration along the spanwise direction [
31]. From another perspective, it is assumed that the spanwise correlation of the buffeting force acting on the structure is equal to the correlation of the fluctuating wind. Based on the one-wavenumber aerodynamic admittance identified through methods such as wind tunnel tests to calculate the structural buffeting response, the calculation and analysis of the buffeting force and the buffeting response can be greatly simplified. However, many scholars [
32,
33,
34,
35,
36,
37] found that when the spanwise wavelength of the incoming flow is not much larger than the structure width, the three-dimensional effect of turbulence cannot be ignored, and the spanwise correlation of the buffeting force is much greater than that of the wind. This will lead to the failure of the strip assumption, which means that there will be a certain error in the calculation of the buffeting response of the bridge when using the traditional one-wavenumber aerodynamic admittance. This indicates that the influence of the spanwise wavenumber
should not be ignored when calculating the buffeting response of the structure. In turbulent analysis, compared with the autocorrelation of different turbulent fluctuation components, the influence of the cross-correlation is small and can be ignored [
38,
39,
40]. To simplify the theoretical elaboration, according to the two-wavenumber buffeting analysis considering the three-dimensional effect of turbulence, and under the premise of ignoring the correlation between the horizontal fluctuating wind velocity and the vertical fluctuating wind velocity, the contribution of the longitudinal and vertical fluctuating wind velocities to the lift is equated to an equivalent aerodynamic admittance that considers the contribution of the fluctuating wind velocity in both directions to the lift. The two-wavenumber buffeting lift spectrum of a long-span bridge is:
where
is the unsteady buffeting lift spectrum corresponding to the
i-th mode of the structure;
is the equivalent two-wavenumber aerodynamic admittance;
is the drag coefficient of the bridge section;
represents the slope of the lift coefficient to the wind attack angle;
and
represent the two-wavenumber joint acceptance function corresponding to the longitudinal and vertical fluctuating wind velocities, respectively;
is the vertical one-wavenumber fluctuating wind velocity spectrum.
According to recent theoretical and experimental studies [
26,
27,
28,
29] of the influence of the aspect ratio on the accuracy of the strip assumption and the three-dimensional effect of turbulence, for long-span bridges and other slender linear structures with large aspect ratios, the strip assumption is accurate enough. The influence of the spanwise wavenumber on the aerodynamic admittance can be ignored in the calculation and analysis, and Equation (4) can be simplified as:
The one-wavenumber buffeting lift spectrum commonly used in the buffeting response calculation is easily obtained by integrating the above formula against
. At this time, it is consistent with the one-wavenumber buffeting lift spectrum in the process of the traditional calculation method in the previous section. The difference lies in the fact that the traditional buffeting analysis theory does not consider the influence of the three-dimensional effect of turbulence, which many scholars believe will cause a large error in the calculation of the buffeting response in the traditional buffeting analysis theory. The theoretical analysis mentioned earlier in this section pointed out that even if the influence of the turbulent three-dimensional effect is considered, as long as the turbulence integral scale is not much smaller than the structure width, the influence of the turbulent three-dimensional effect can also be ignored for long-span bridges and other linear slender structures with large aspect ratios [
26,
27,
28,
29]. The one-wavenumber aerodynamic admittance can be used instead of the two-wavenumber aerodynamic admittance, and the influence of the spanwise wavenumber
can be ignored. That is, the traditional buffeting analysis theory is considered to be accurate at this time. At present, the two-wavenumber buffeting analysis considering the three-dimensional effect of turbulence returns to the traditional buffeting theory analysis process, and the power spectral density function of the buffeting displacement response can also be expressed by Equation (1). In the formula, structural parameters such as geometric dimensioning, mode shape function, equivalent mass, natural frequency and damping ratio are only related to the inherent characteristics of the structure and do not change with the change of turbulence. The one-wavenumber aerodynamic admittance function only contains longitudinal wavenumbers, which reflects the aerodynamic transfer relationship between the 2D fluctuating velocity and the buffeting force, and can be expressed as a function of the dimensionless reduced frequency. It is only related to the bridge cross-section geometry and longitudinal wavenumber and has nothing to do with the characteristics of the turbulent flow field. In addition, considering the significance of buffeting research, and the fact that the study of the buffeting response is limited to ranges where the wind velocity is relatively small, the buffeting force is the main fluctuating load at this time, and the aerodynamic self-excited force accounts for a small proportion. Buffeting will not cause catastrophic consequences such as wind-induced flutter instability. It mainly affects comfort, safety and the fatigue damage of components in the use stage of the structure. Therefore, the study of buffeting under high wind velocity will, to some extent, be meaningless. For example, long-span bridges will be stopped when the wind velocity is high, limiting the passage of vehicles and pedestrians. Based on the above factors, Su et al. [
26] proposed the concept of the integrated transfer function, which is the product of the one-wavenumber aerodynamic admittance and the one-wavenumber frequency response function. It is only determined by the structural characteristic parameters and has nothing to do with the turbulent flow characteristics:
At this time, the buffeting response spectrum of the structure can be written as:
Based on Equation (7), a sectional model with a reasonable aspect ratio can be selected for vibration testing to identify the integrated transfer function. Since the function has nothing to do with the turbulent flow characteristics, it can be used to predict the buffeting response of bridge structures under any wind field by using Equations (1)–(3).
Two points need to be explained:
(1) Since the identification of the integrated transfer function is based on the measured value of the buffeting response at a certain point of the structure, when it is applied to the prediction of the buffeting response, the function identified at a point (such as the mid-span position of a long-span bridge) can only be used to predict the buffeting response of the actual structure at the same position;
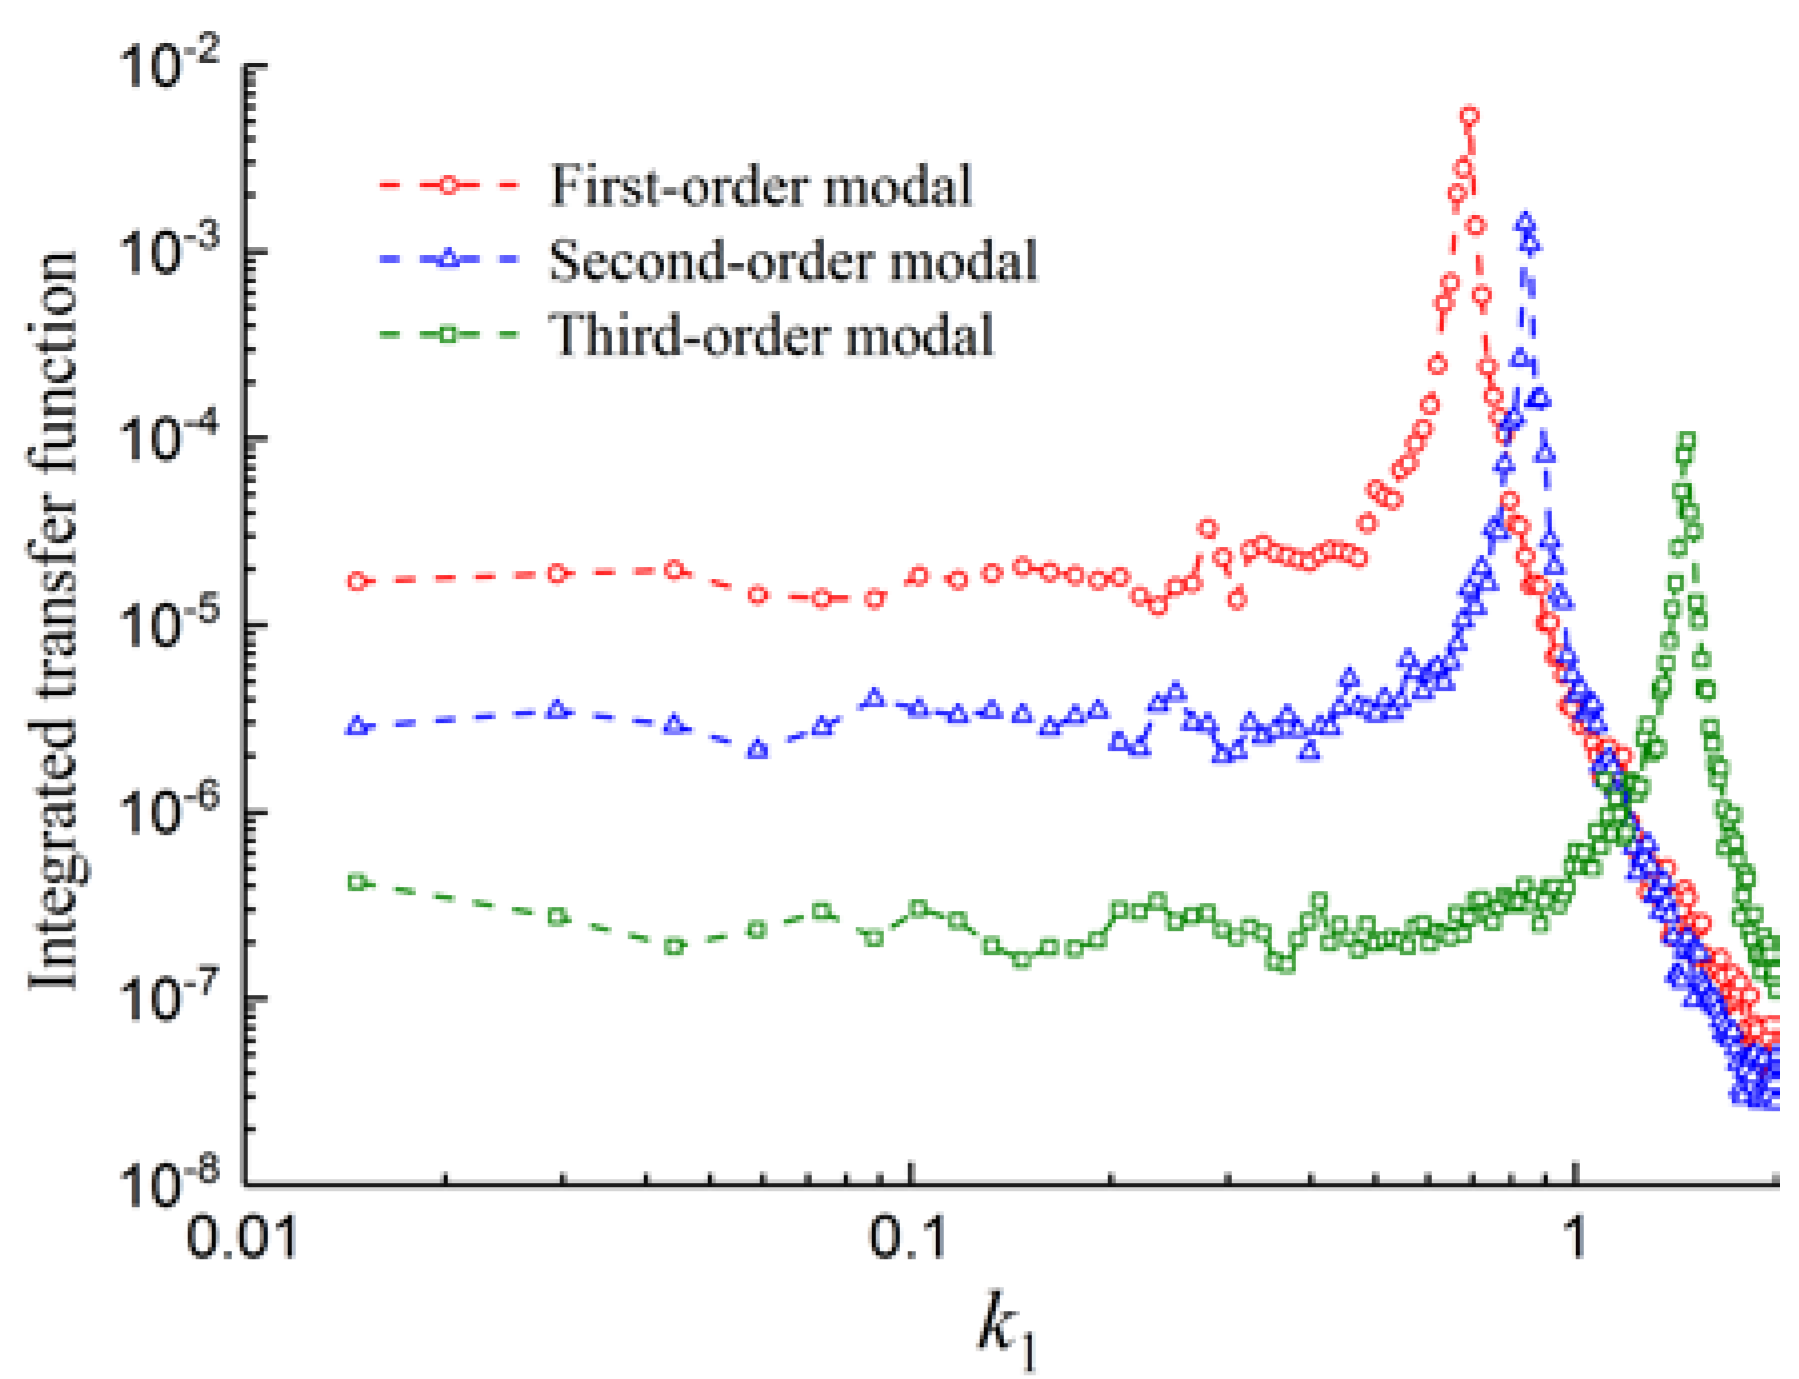
(2) Due to the inconsistency between the mode shape functions of different orders, the integrated transfer functions corresponding to the mode shapes of different orders are also different. In other words, there is a fixed integrated transfer function corresponding to the different order mode shapes of the structure. Therefore, when using the integrated transfer function to predict the buffeting response of the actual structure, it is necessary to calculate the response of the different modes corresponding to the real bridge through the integrated transfer function of different orders, after which the SRSS method can be used to calculate the total response of the structure.
2.3. Buffeting Response Prediction Based on Taut Strip Model Test
The taut strip model buffeting response test is similar to the full-bridge aeroelastic model test. They both measure the 3D buffeting response of the 3D model under the action of 3D turbulence, but the former eliminates the additional aerodynamic interference of the structural ancillary facilities. The buffeting response spectrum
of the structure under the simulated turbulent flow field is measured through the taut strip wind tunnel test, and the RMS of the buffeting response can then be calculated by Equation (8):
3. Test Preparation
In the comparative study of different buffeting response calculation methods in this paper, taking a long-span bridge as the engineering background and taking the vertical buffeting response at the mid-span as an example, three test methods were used to predict and compare the buffeting response of the structure. It should be noted that considering the influence of the model aspect ratio on the three-dimensional effect [
26,
27,
28,
29], it is necessary to use a small scale ratio to make the model with a large aspect ratio in the sectional model test to minimize the influence of the three-dimensional effect of turbulence. This will lead to difficulty in the simulation of structures such as railings and maintenance channels in the sectional model test, so the 100% construction state of the bridge is selected as the research object.
3.1. Structural Overview
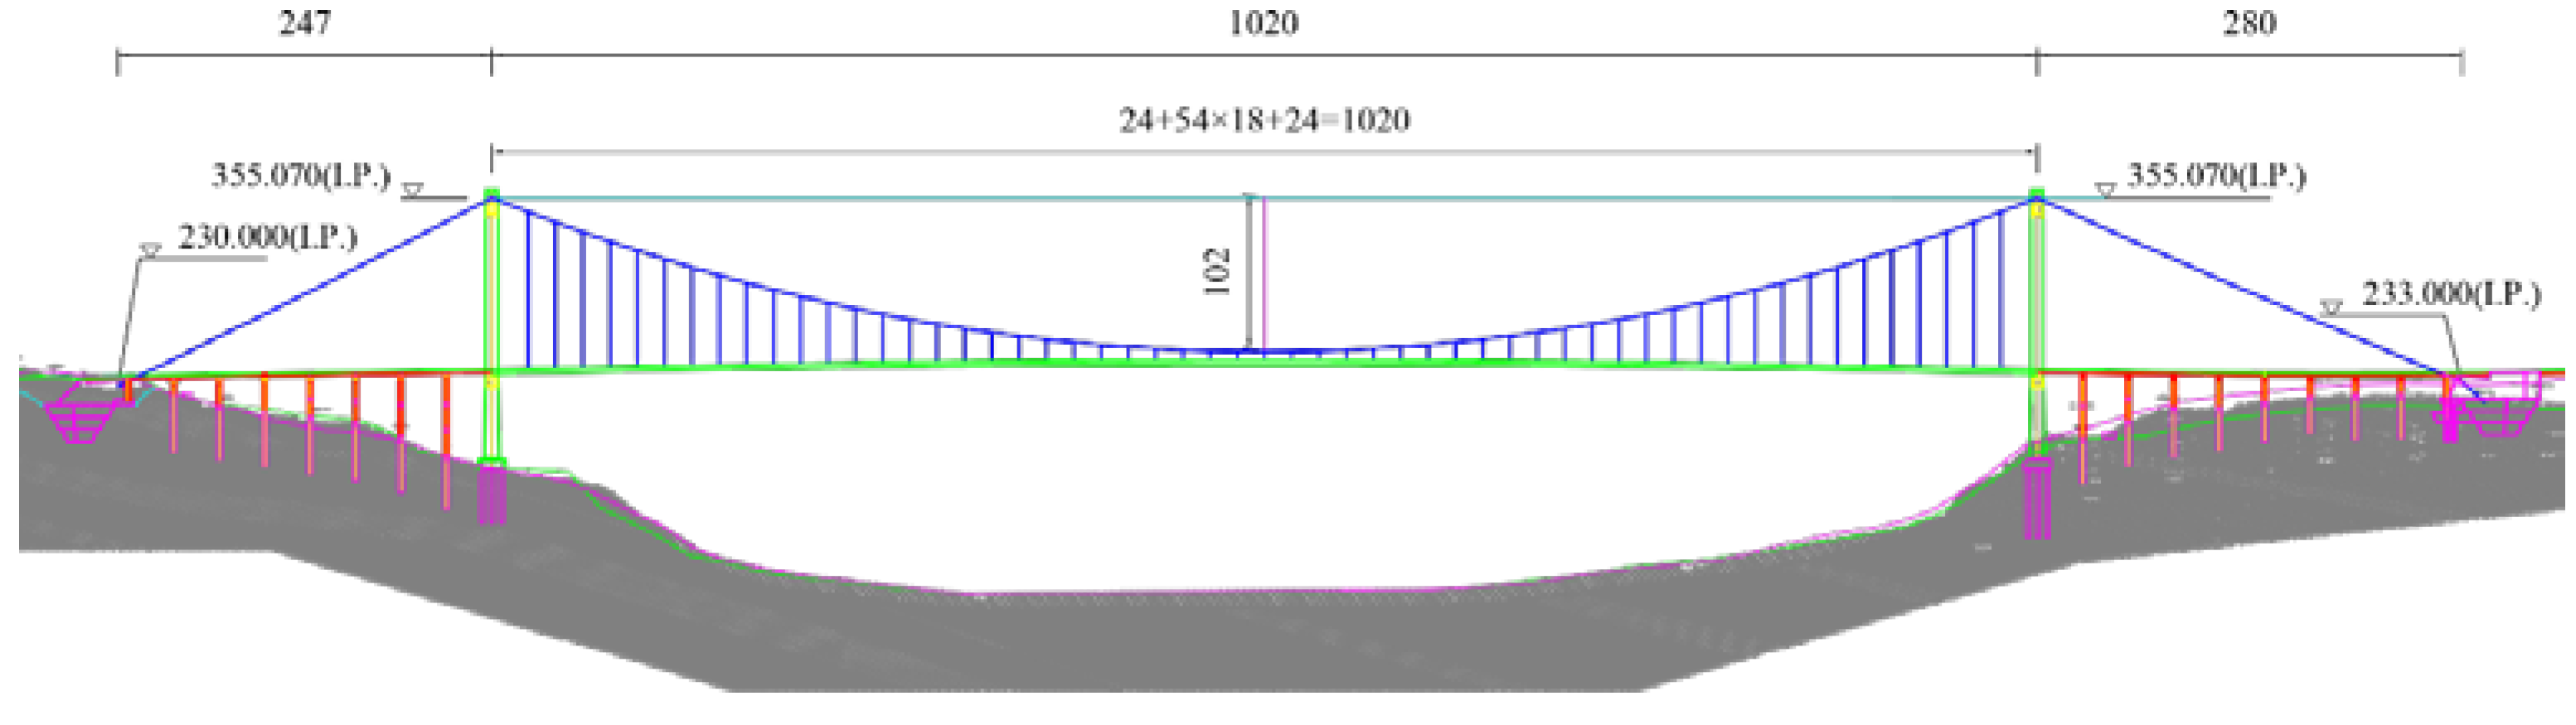
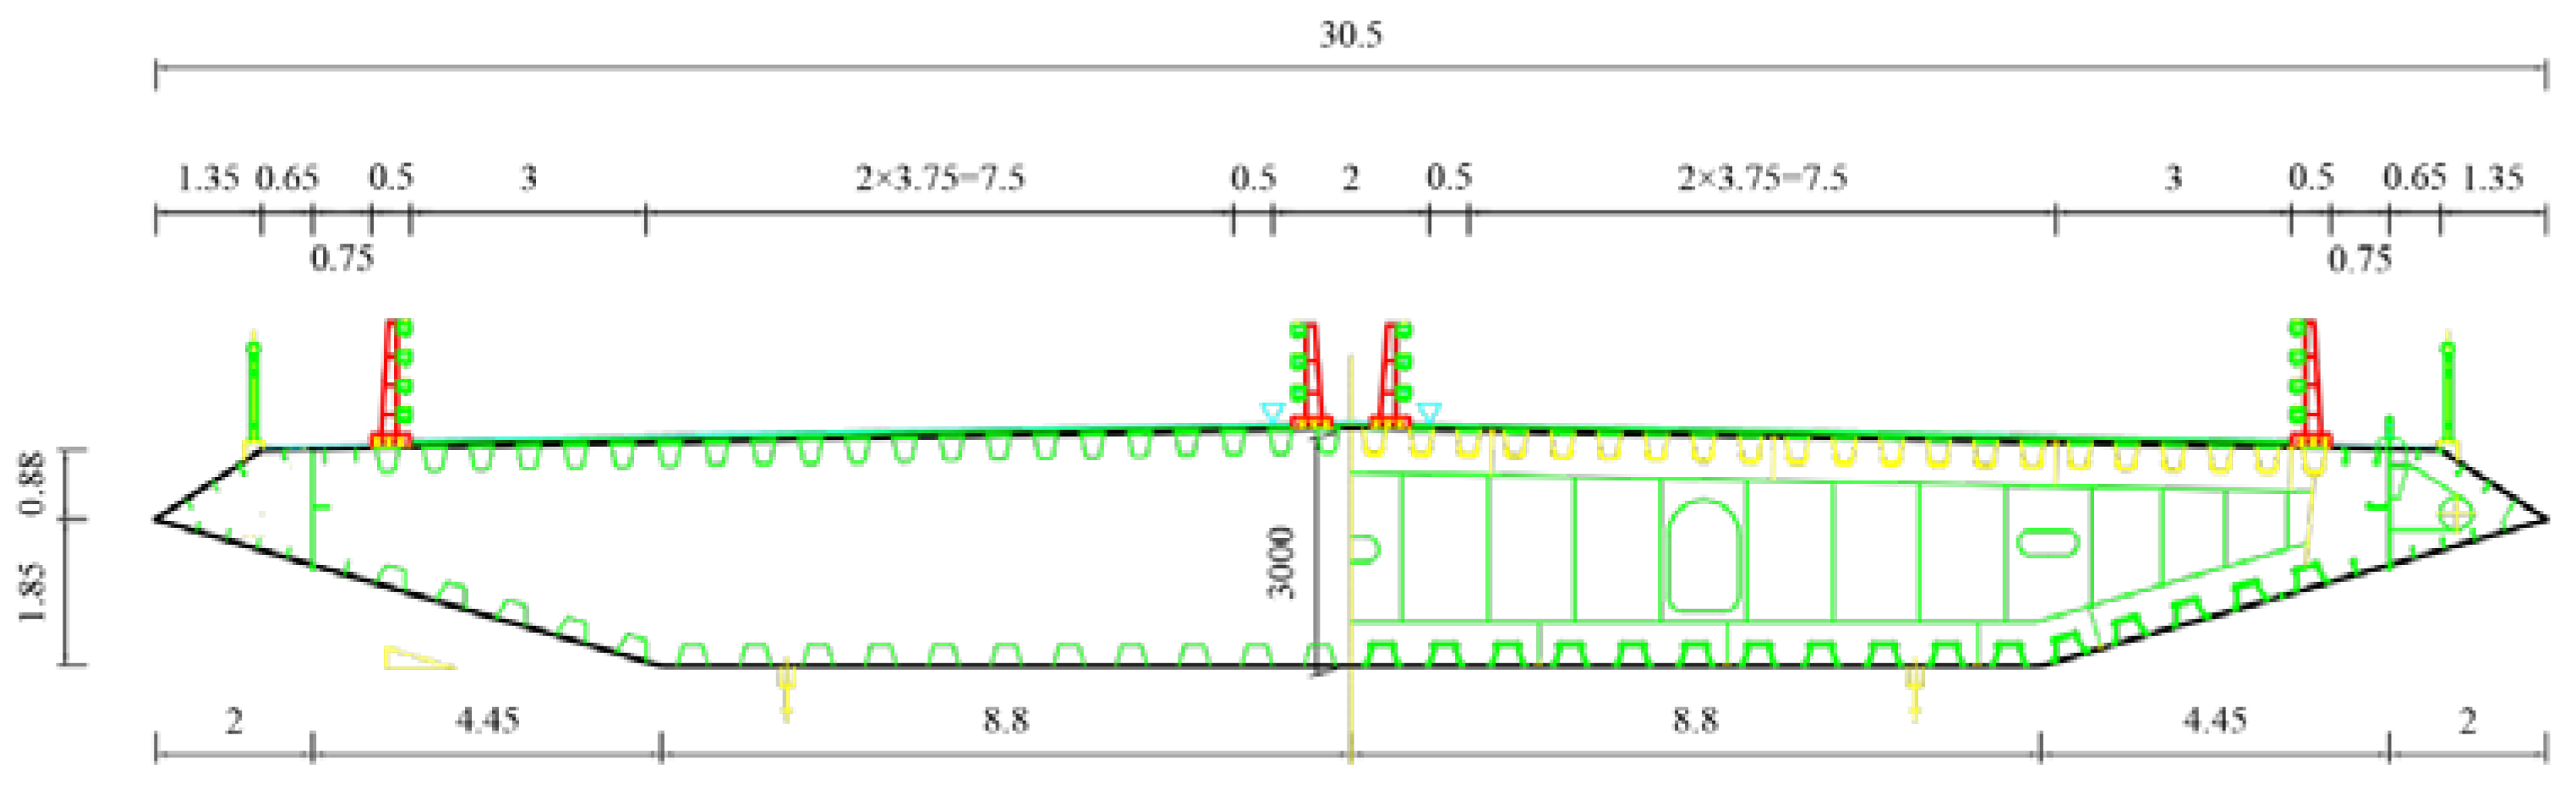
A long-span steel box girder suspension bridge was taken as an example to study in this paper. The main span of the bridge is 1020 m. The stiffening beam is an integral steel box girder with a width of 30.5 m and a height of 3.0 m. The tower height is 177.5 m, and the basic wind velocity is 25.0 m/s. The overall layout of the bridge structure is shown in
Figure 1, and the standard cross-section of the main girder is shown in
Figure 2.
3.2. Analysis of Structural Dynamic Characteristics
Structural dynamic characteristics constitute the premise of structural dynamic response analysis. Through the analysis of structural dynamic characteristics, the frequency distribution and mode shape characteristics of the structure can be understood, and parameters can be provided for the design of the wind tunnel test model. In this section, the ANSYS software is used to analyze and calculate the dynamic characteristics of the bridge.
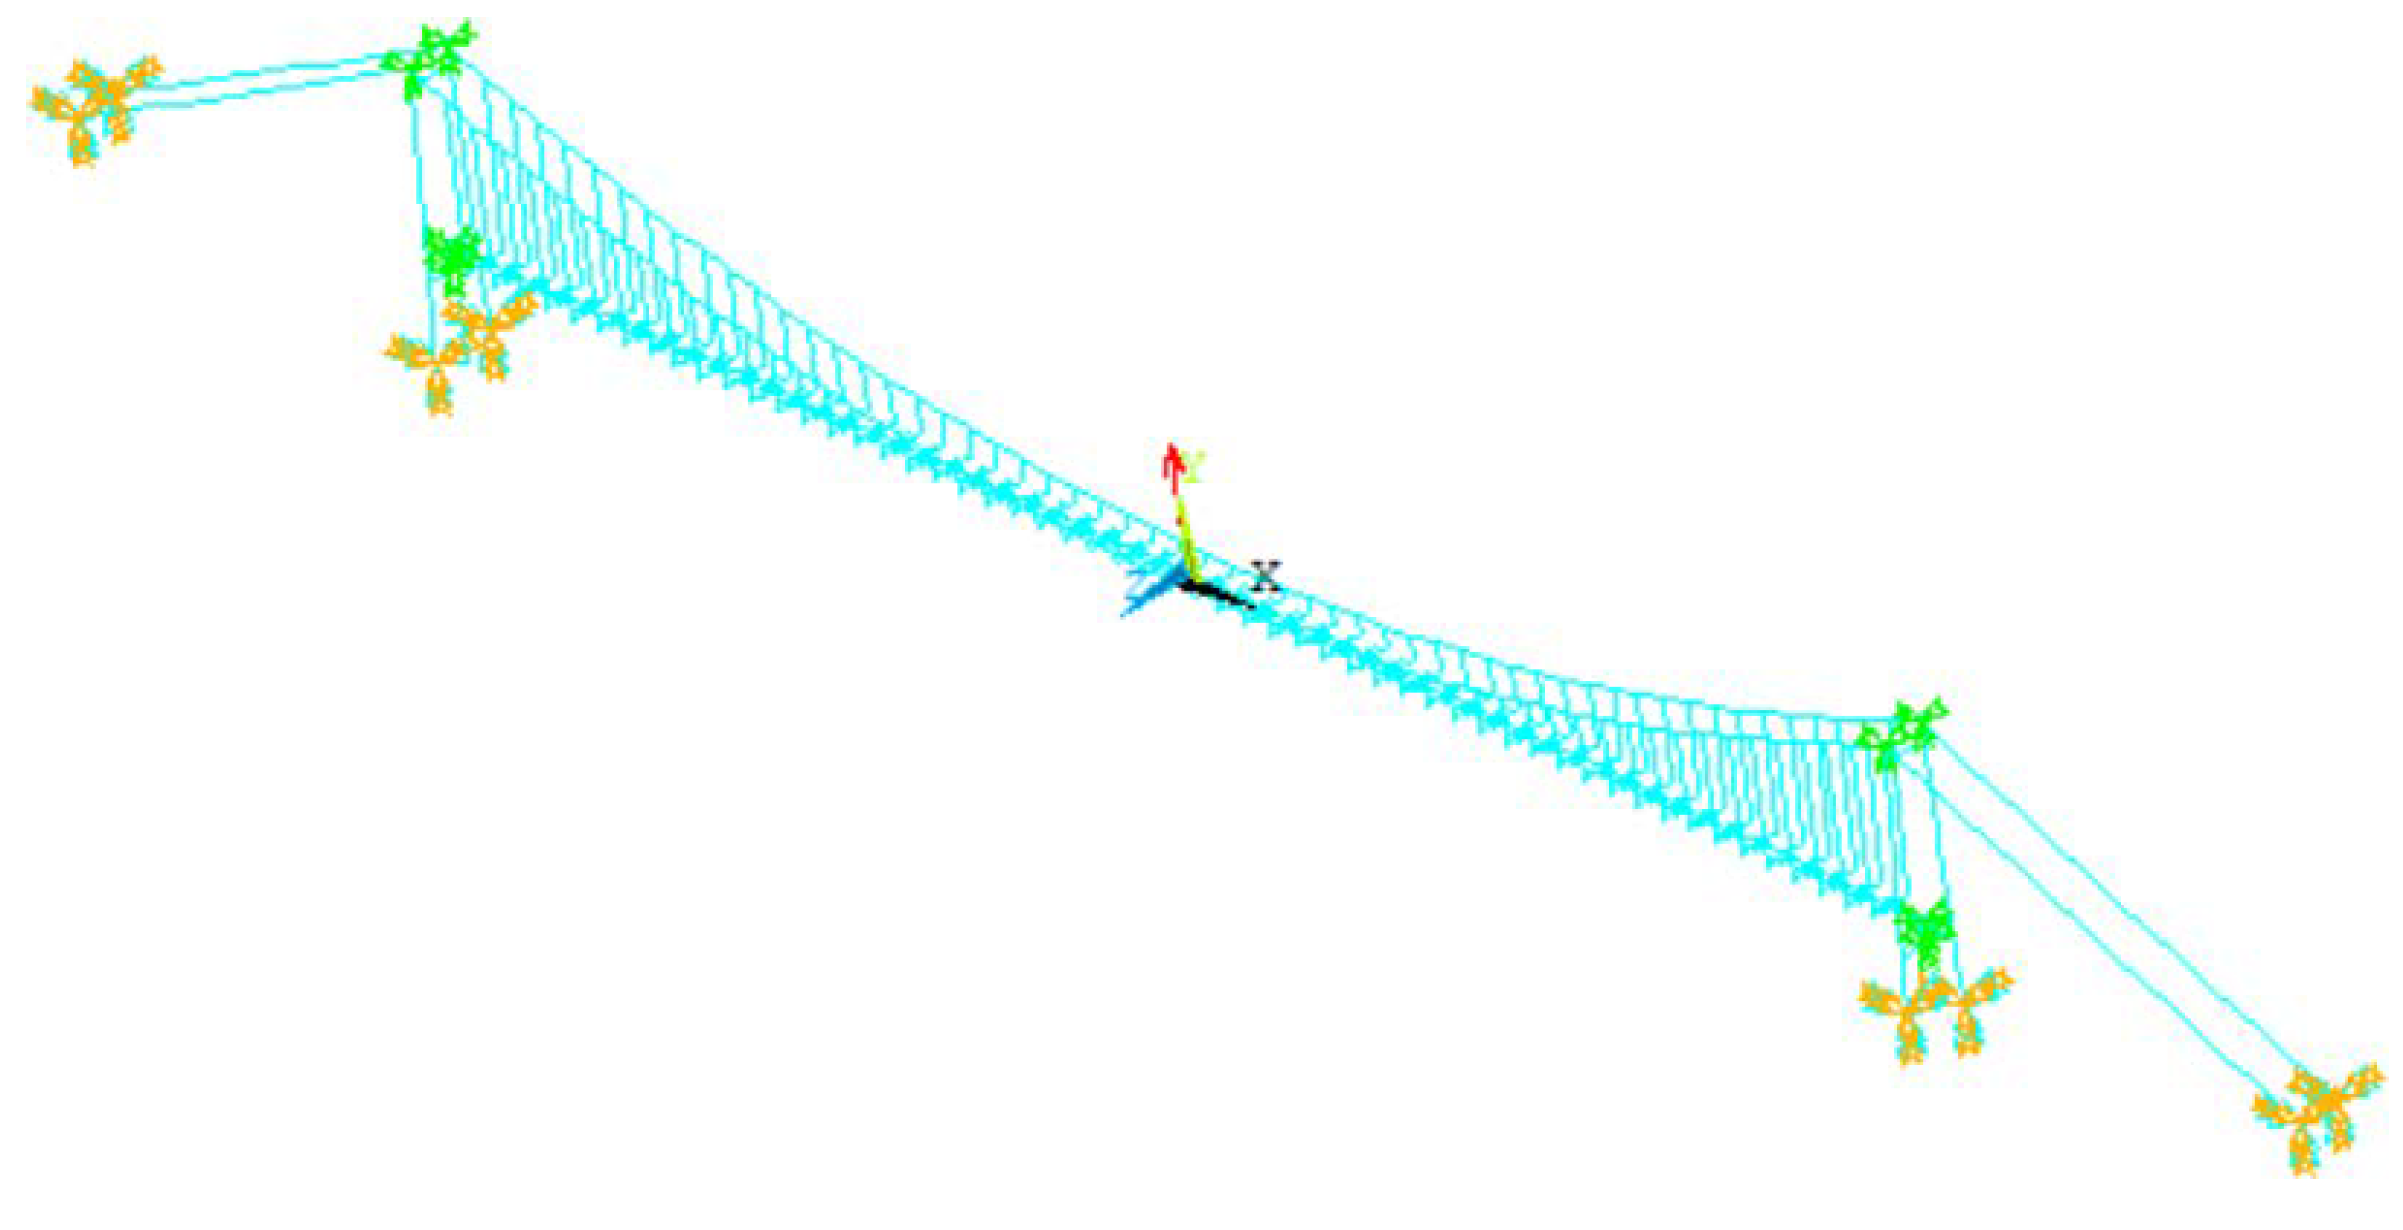
The calculation model of the bridge deck adopted the traditional “fishbone beam” model, as shown in
Figure 3. The main girder and tower were discretized into three-dimensional beam elements (Beam4) according to the actual spatial position, the cables were discretized into three-dimensional cable elements (Link10), and the piers and junction piers were also discretized into three-dimensional beam elements (Beam4). The section properties and material properties of each element were assigned for the calculation. The mass and mass moment of inertia of the main beam were simulated by mass point element (Mass21).
The boundary constraints in the model were set as follows:
(1) The bottom of the cable tower was embedded with the top surface of the cushion cap, that is, the degrees of freedom in six directions were restricted;
(2) The main cable was fixed at the anchorage; the top connection of the main tower was a master–slave relationship;
(3) The connection between the main beam and the main tower: The connection between the rotational degrees of freedom of the main beam in the transverse, vertical and around the bridge axis and the middle of the lower beam under the main tower was a master–slave relationship. The remaining three degrees of freedom were relaxed.
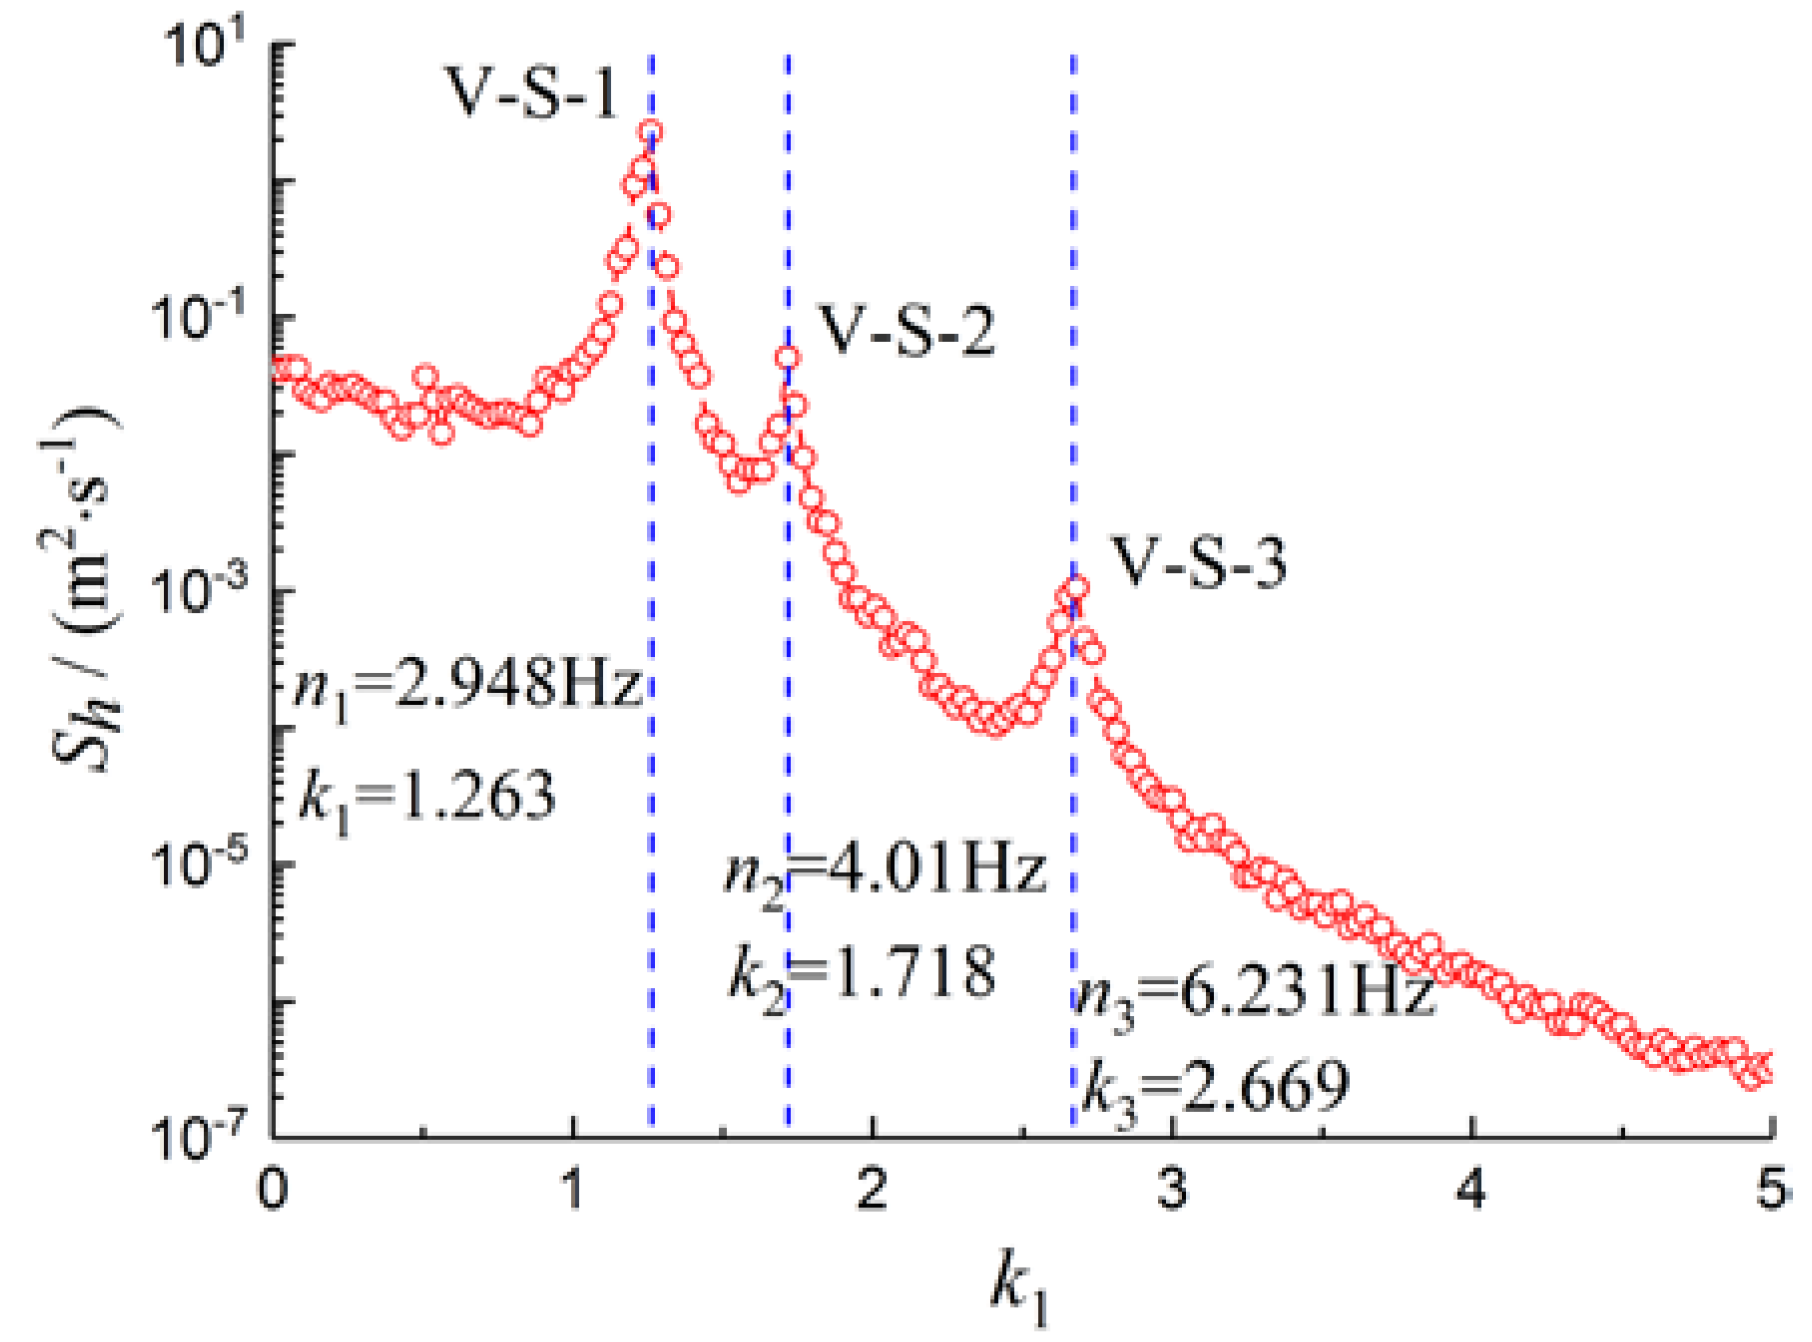
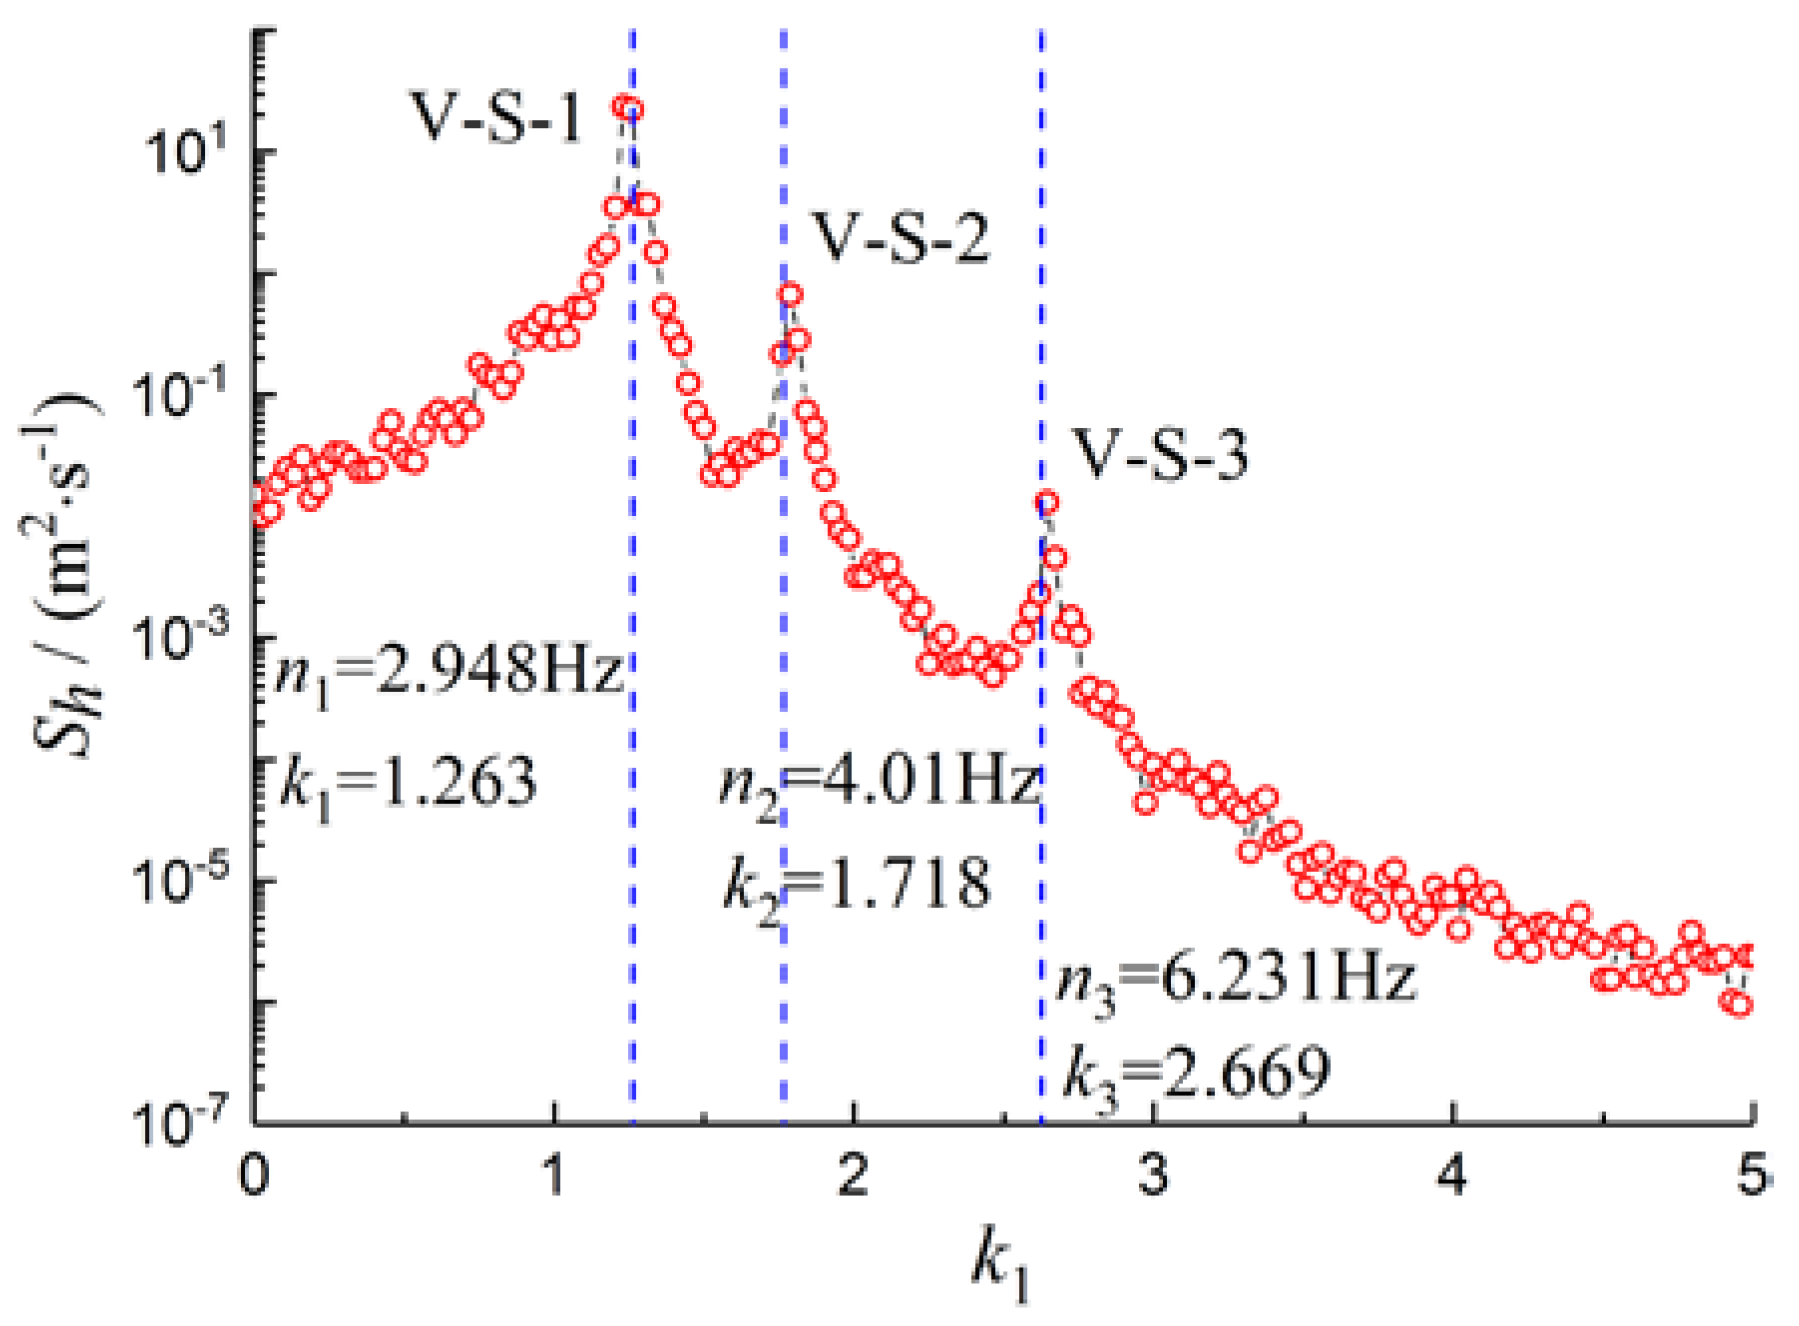
Using ANSYS software, the subspace iteration method was used to calculate the first 30-order frequencies and mode shapes of the bridge, which included three vertical modes: , and .
3.3. Test Equipment
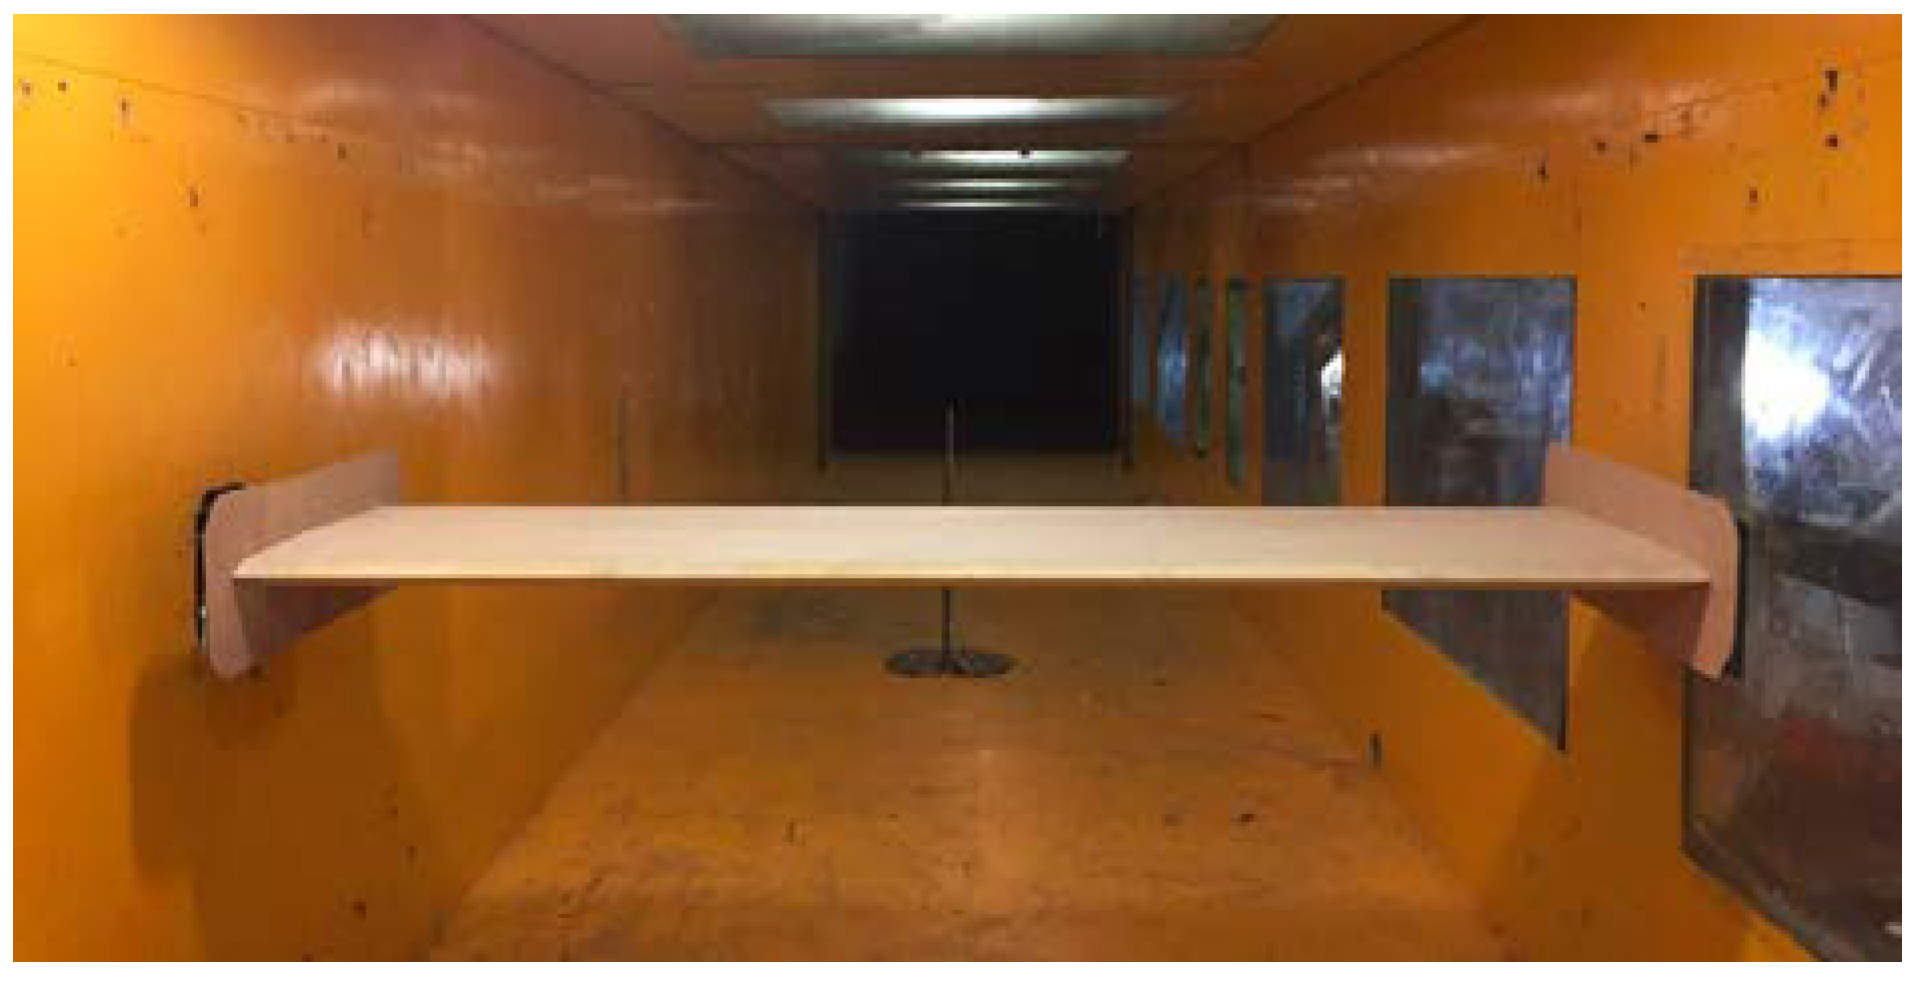
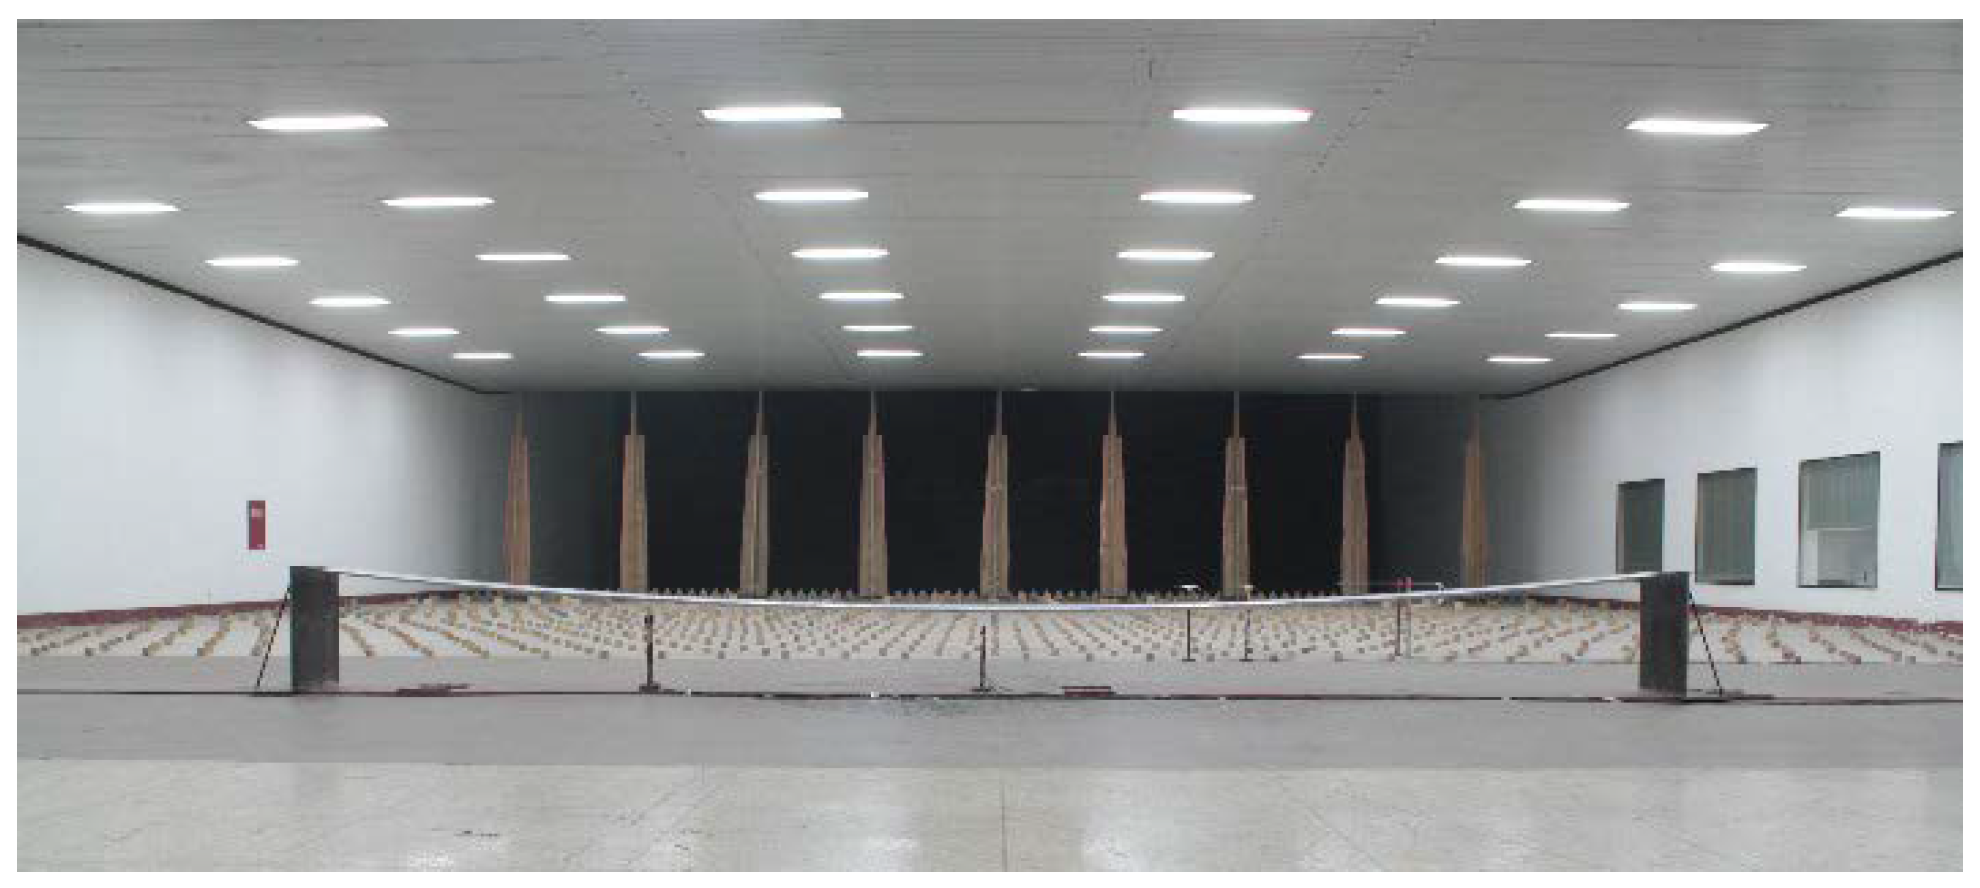
The sectional model test was conducted in the XNJD-1 wind tunnel at Southwest Jiaotong University. The size of the test section was 16 m (length) × 2.4 m (width) × 2.0 m (height), and the wind velocity could be adjusted within a range of 1.0 to 45.0 m/s. In the vacant state of the wind tunnel, the turbulence intensity of the incoming flow was less than 0.5%, and the average airflow deflection angles in both the longitudinal and vertical directions were less than 0.5°. The taut strip model test was conducted in the XNJD-3 wind tunnel of Southwest Jiaotong University. The size of the test section was 36 m (length) × 22.5 m (width) × 4.5 m (height), and the wind velocity could be adjusted within a range of 1.0 to 16.0 m/s. The turbulence intensity of the incoming flow in the vacant state of the wind tunnel was less than 1%, and the average airflow deflection angles in both the longitudinal and vertical directions were less than 1°.
The turbulent wind field characteristics were collected using a TFI Cobra three-dimensional fluctuating anemometer (Cobra Probe), which is a four-hole pressure probe measuring instrument that can measure the real-time dynamic three-component velocity (longitudinal, horizontal and vertical), pitch angle and yaw angle. Its linear frequency measurement range is 0 Hz (uniform flow) to 2000 Hz, and its measurable wind velocity range is 2 m/s to 100 m/s. Its allowable error for measured wind velocity is ±0.1 m/s, and its measurable wind direction angle range is ±45°. The buffeting force measurement was conducted using a high-frequency dynamic six-axis force ATI Gamma balance, whose horizontal and vertical force ranges were 65 N and 200 N, respectively, with respective corresponding accuracies of 1/80 N and 1/40 N. The displacement response measurement used a non-contact laser displacement measurement sensor with a range of 200 mm and a static test accuracy of 40 μm.
3.4. Turbulence Field Simulated
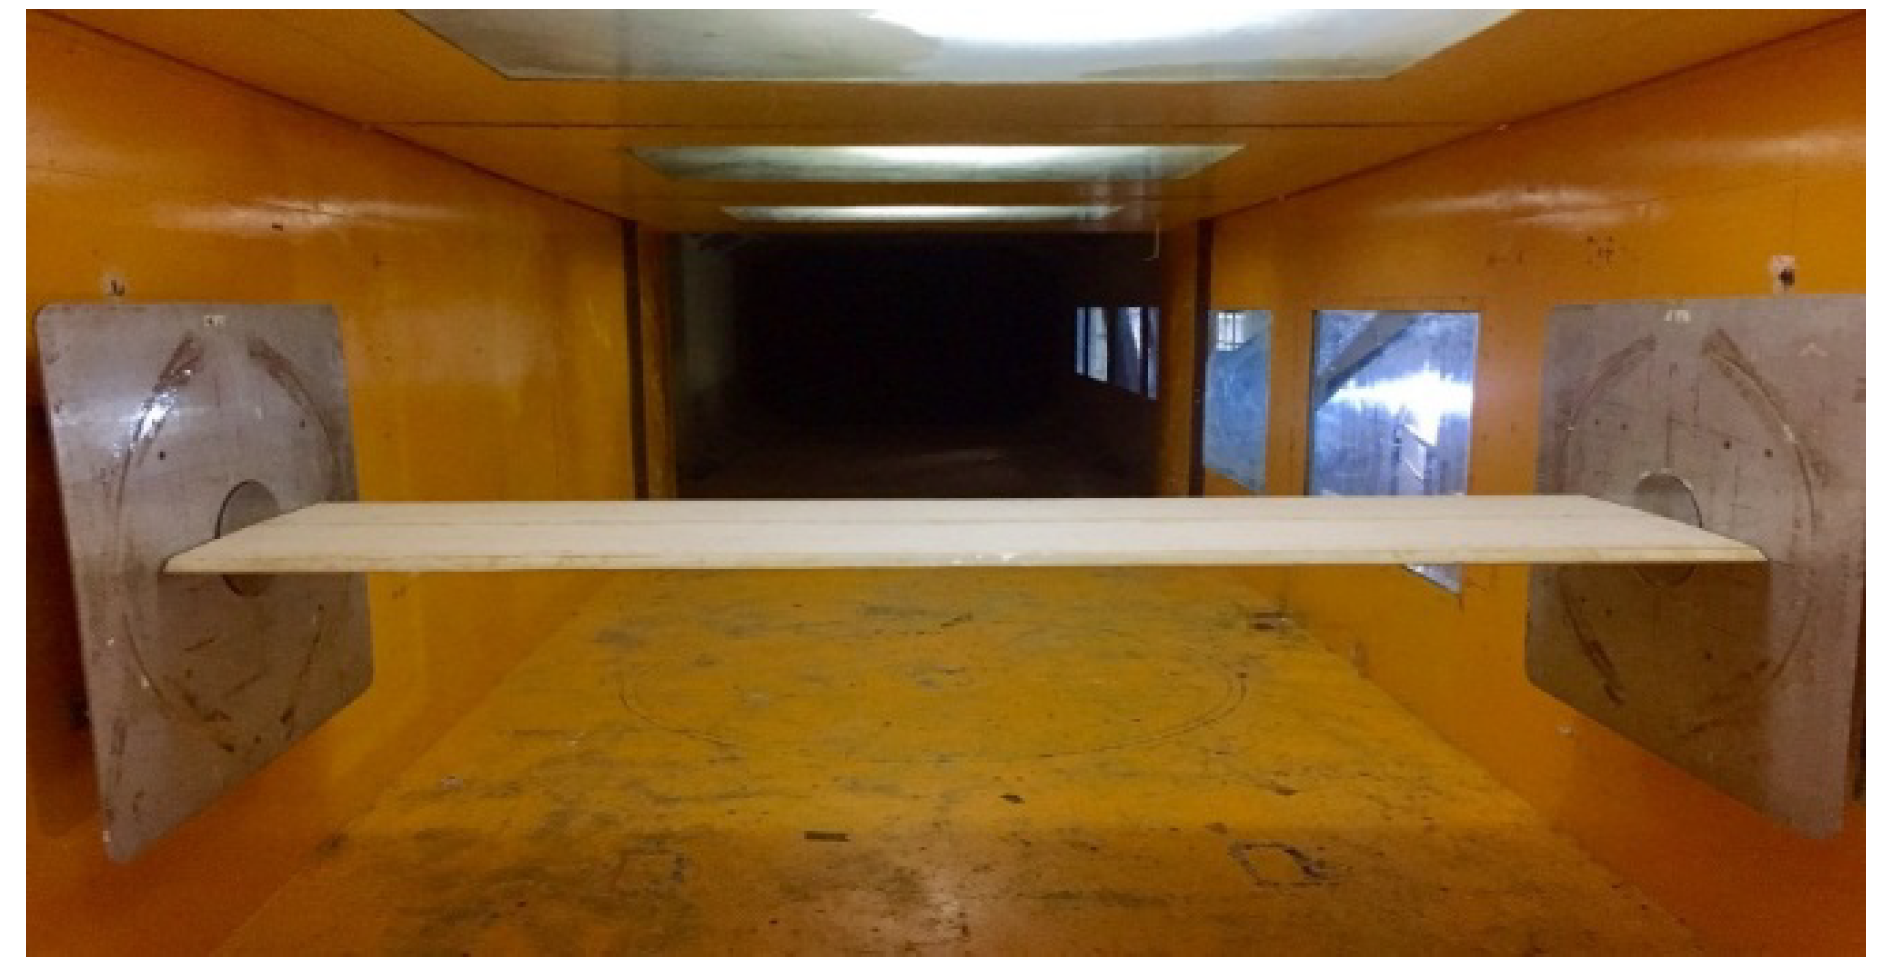
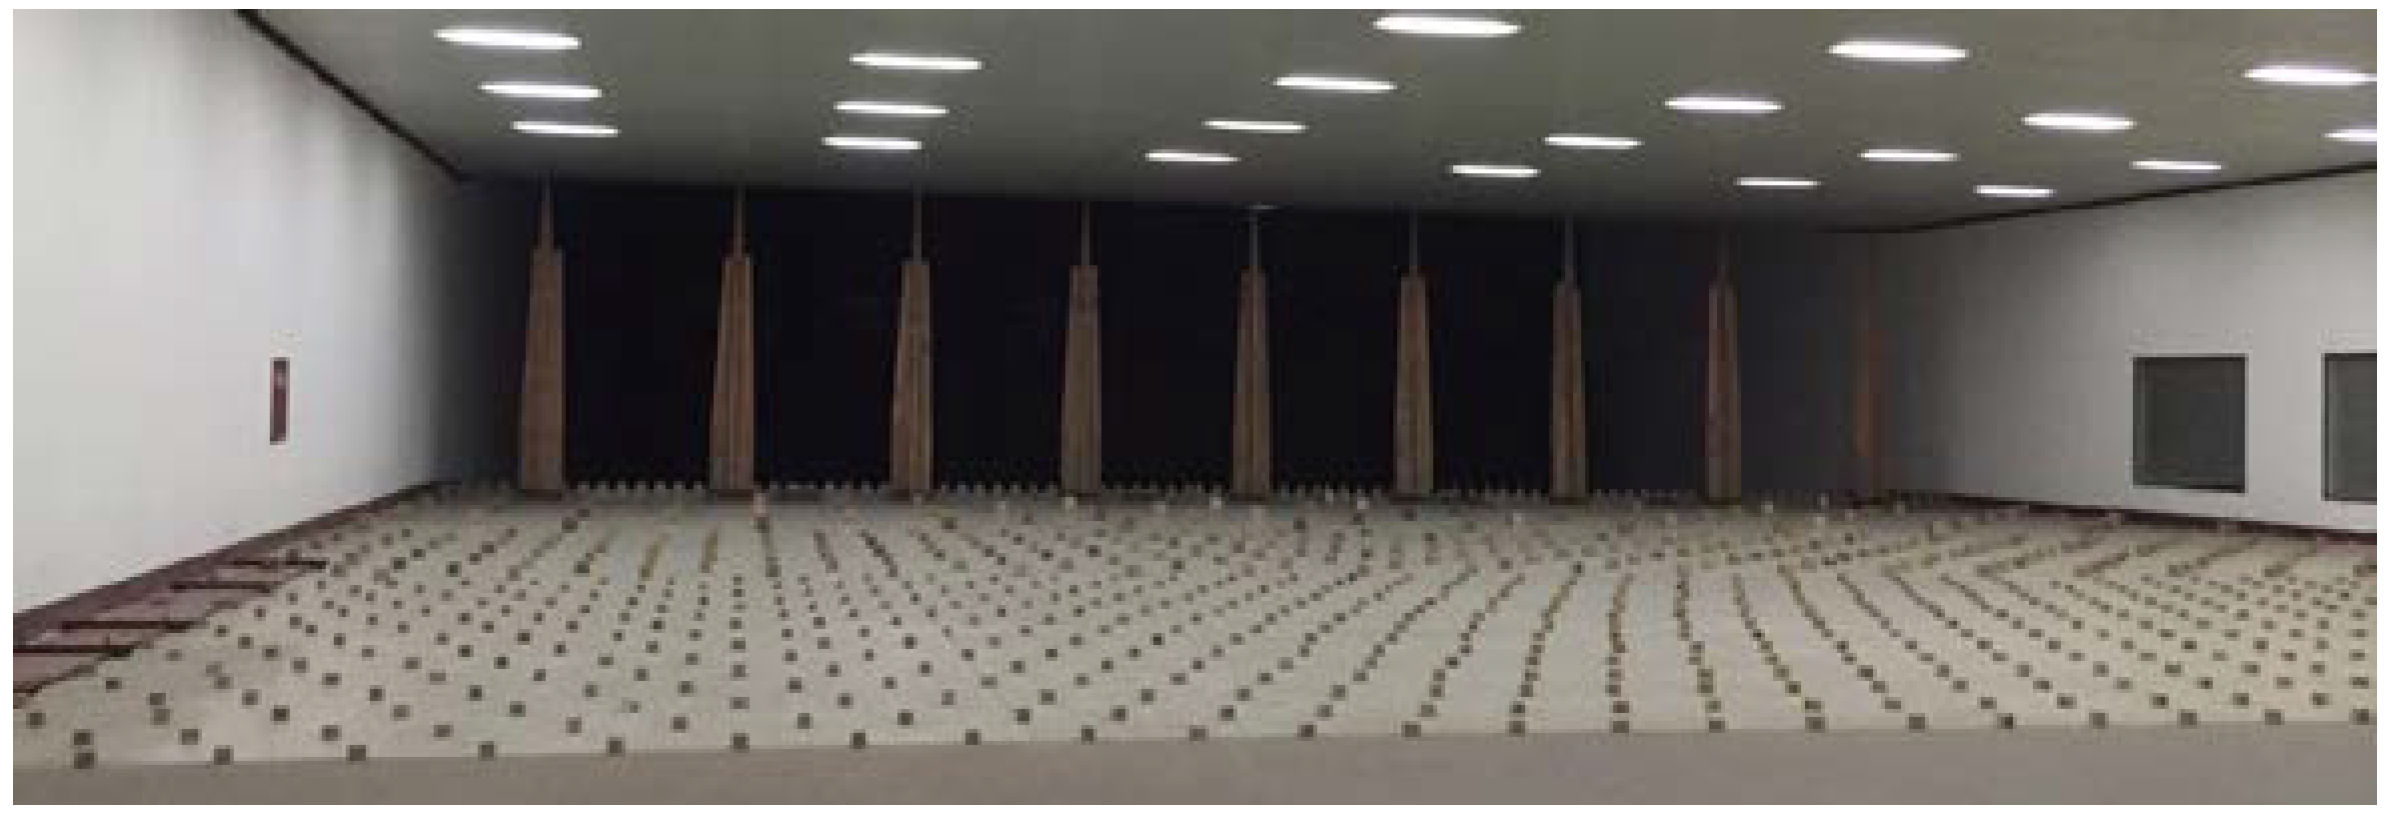
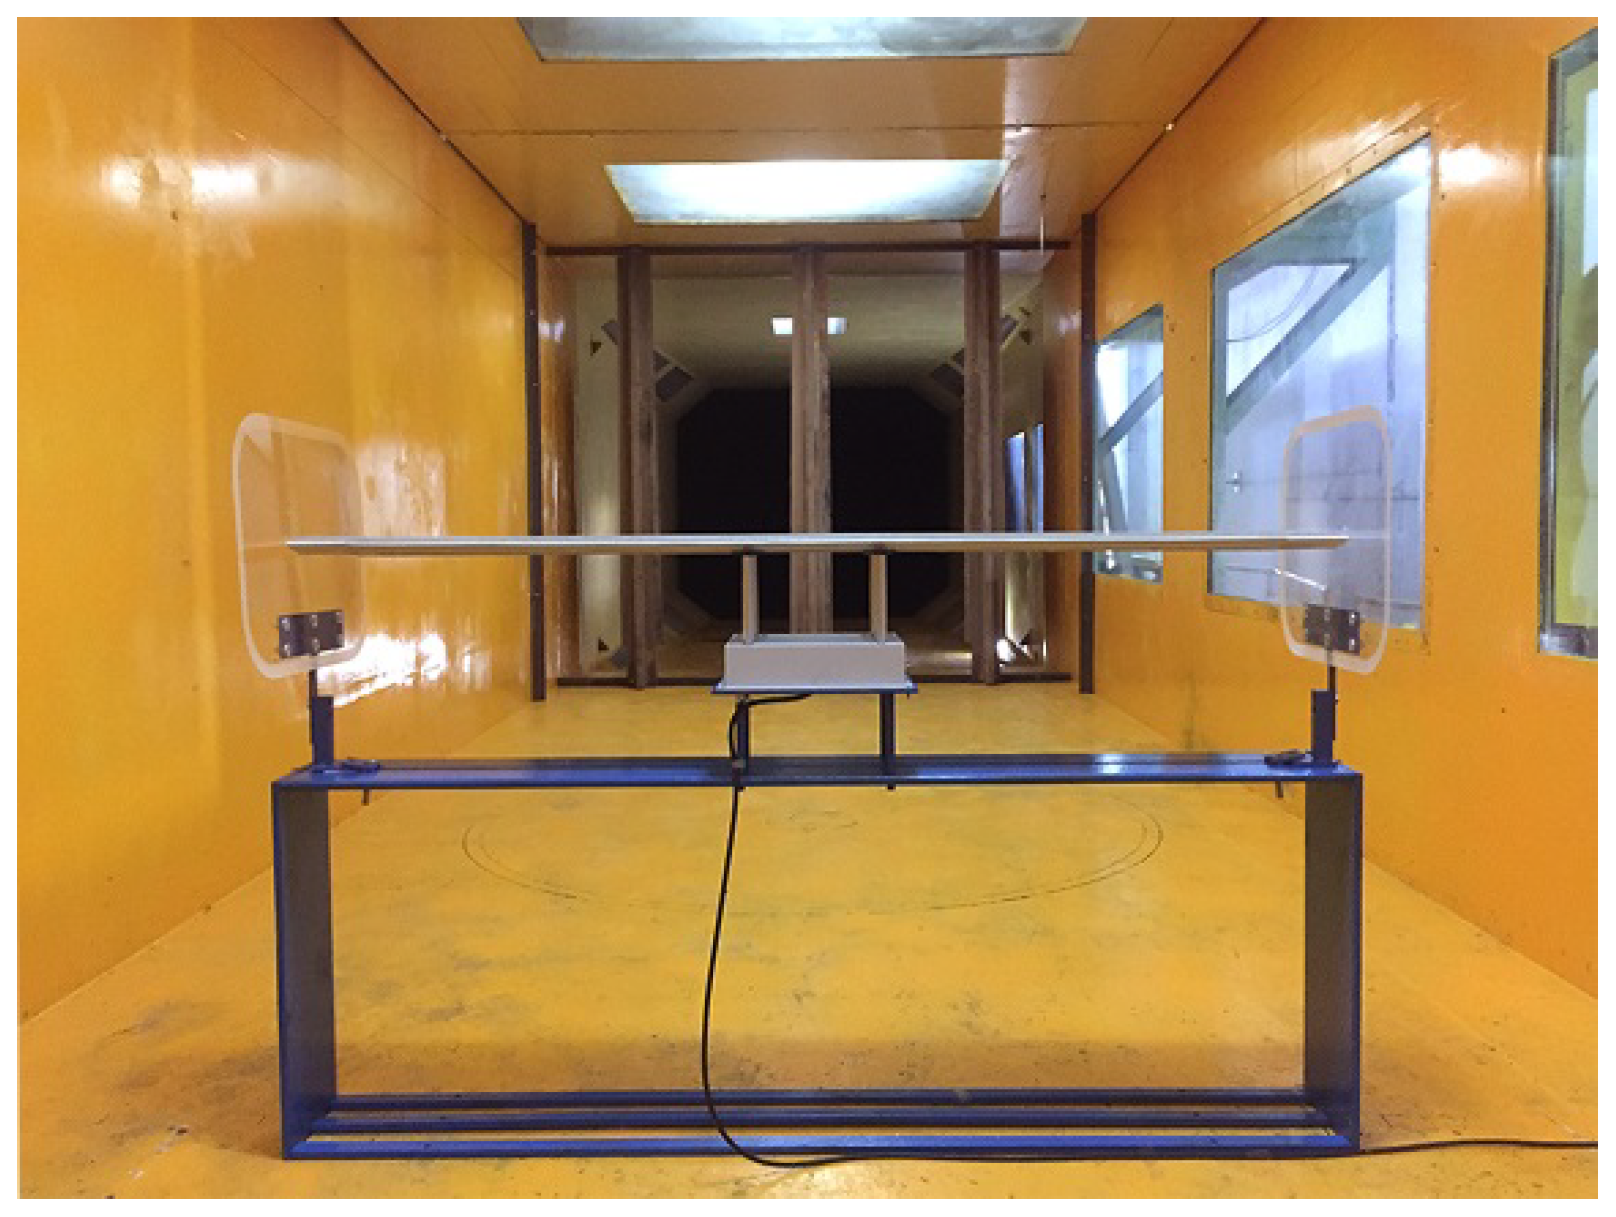
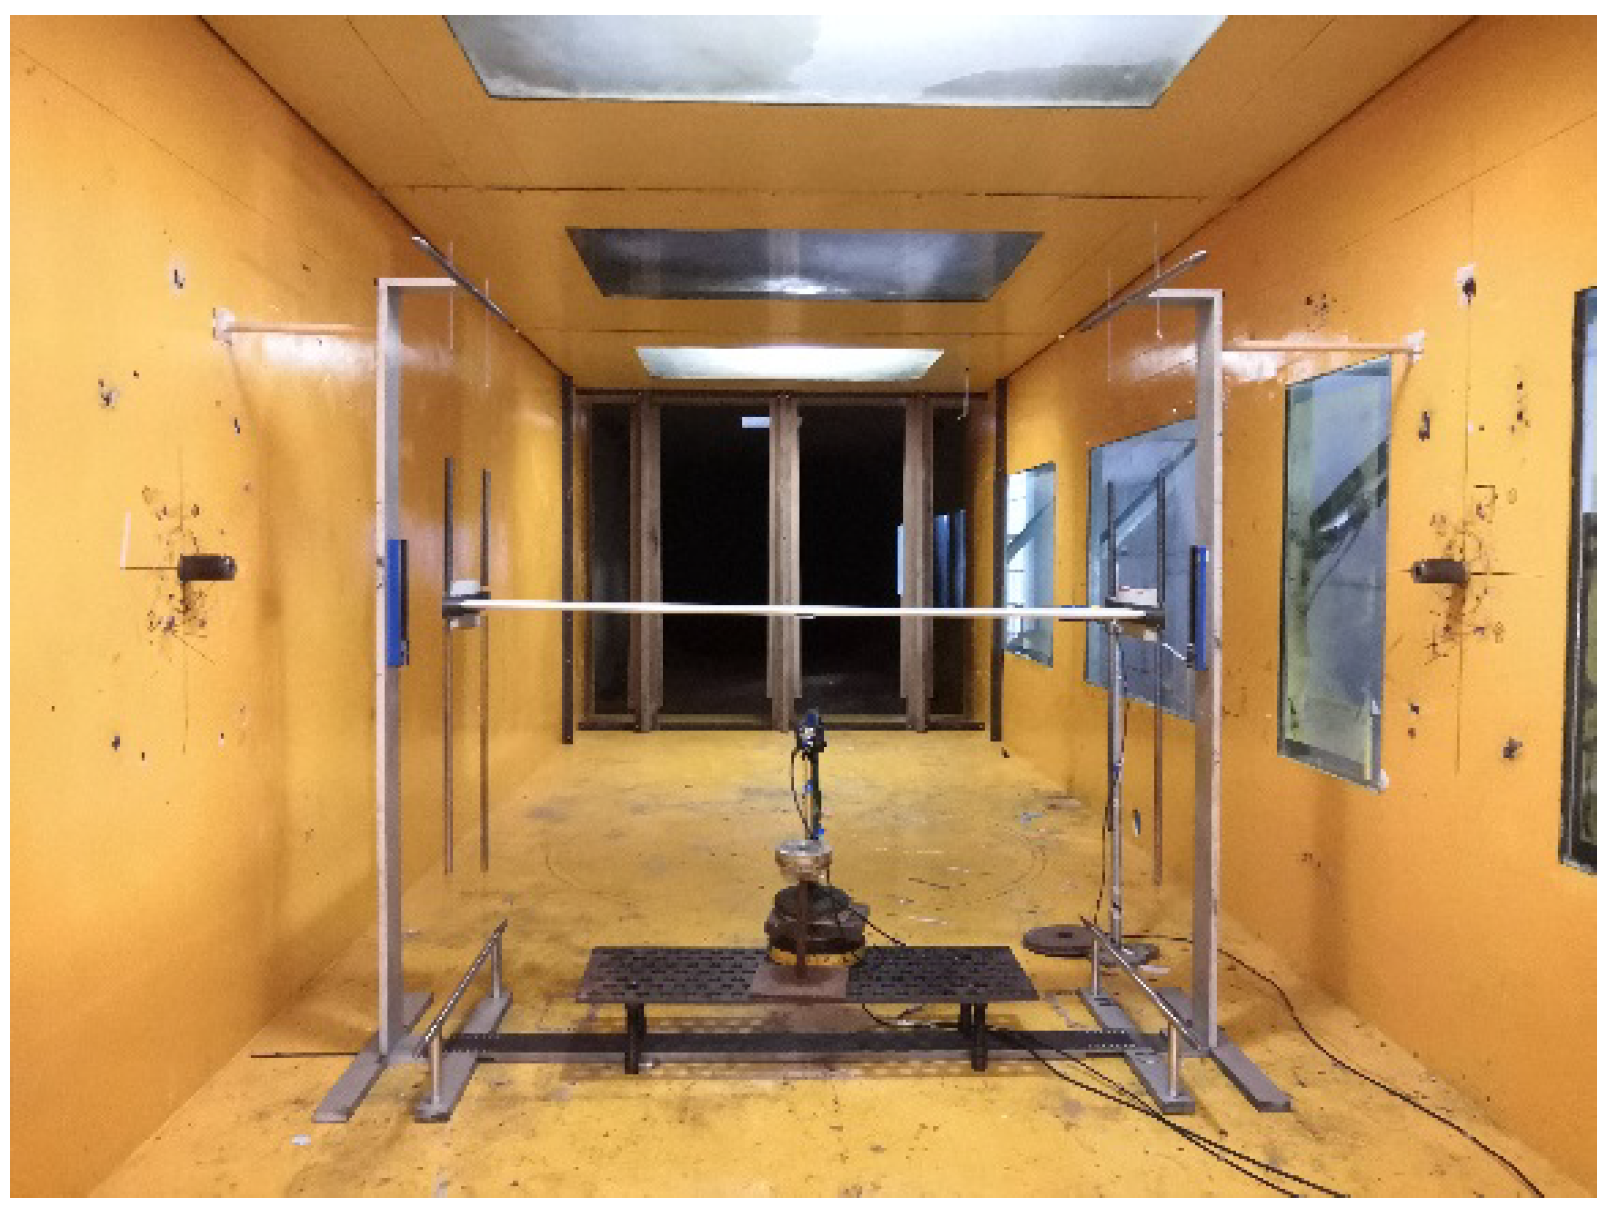
The taut strip model test was conducted in a large-scale wind tunnel, and passive simulation devices such as spires, baffles and rough elements were used to simulate the turbulent flow field, as shown in
Figure 4.
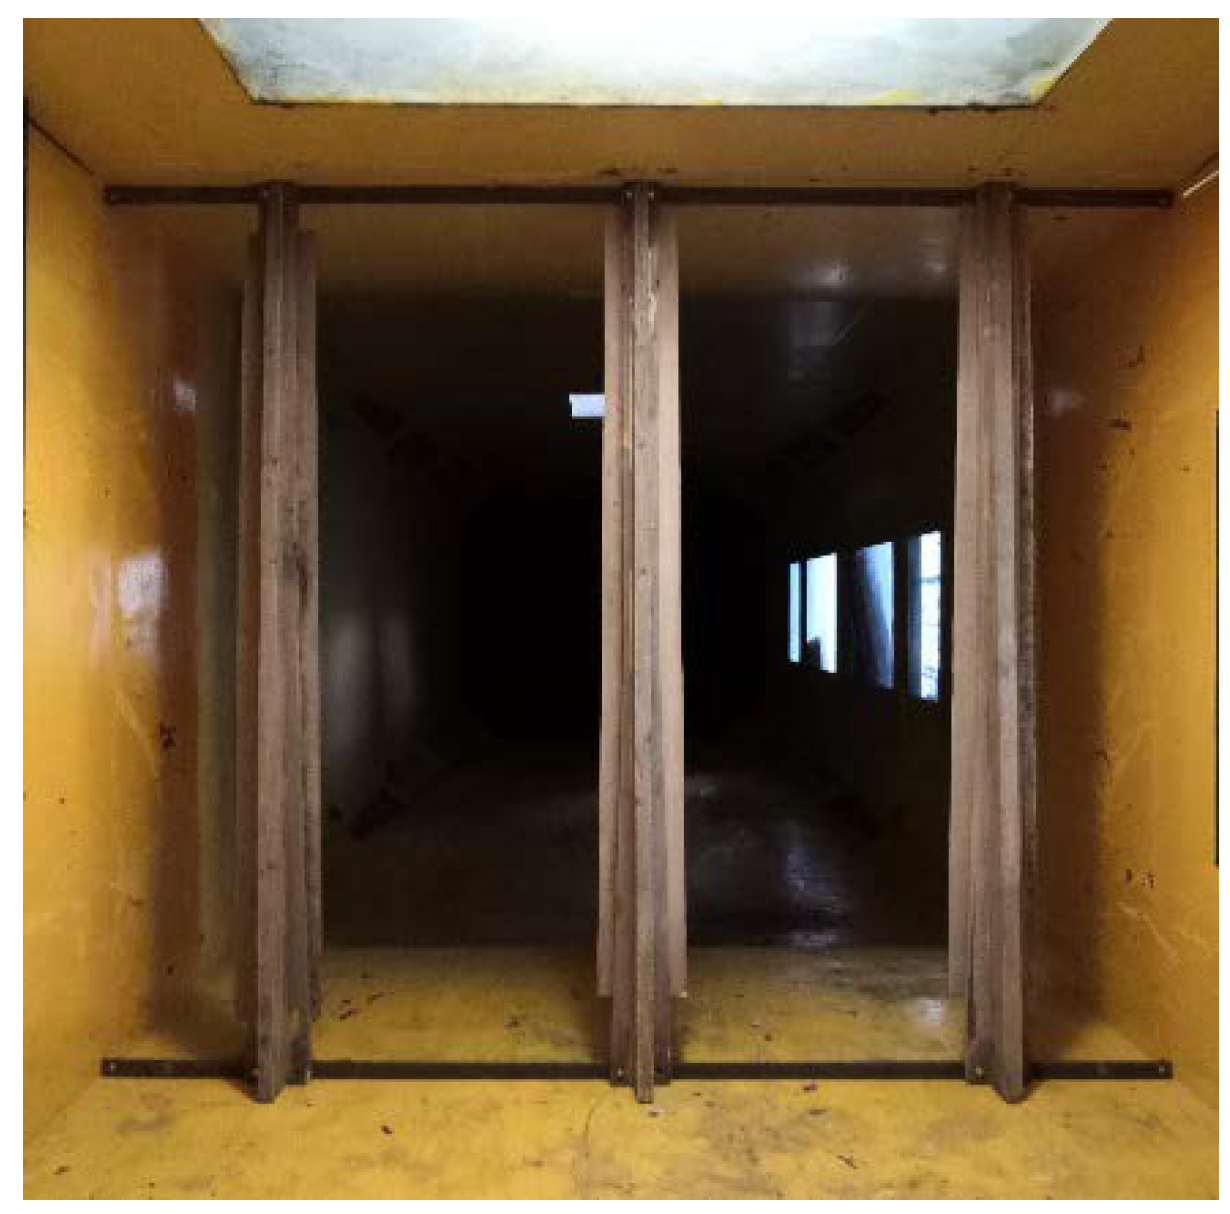
Because the turbulence integral scale simulated in the spire turbulence field is usually larger than that in the grid turbulence field, the test identification of the aerodynamic admittance and integrated transfer function of the structure were conducted in the simulated spire turbulence field, which can increase the ratio of the turbulence integral scale to the model width in order to minimize the influence of the turbulent three-dimensional effect. It can also simulate the shear layer characteristics, which is more convenient for analysis and comparison with the taut strip model test results. Therefore, the sectional model test was also conducted in a spire turbulence field, as shown in
Figure 5.
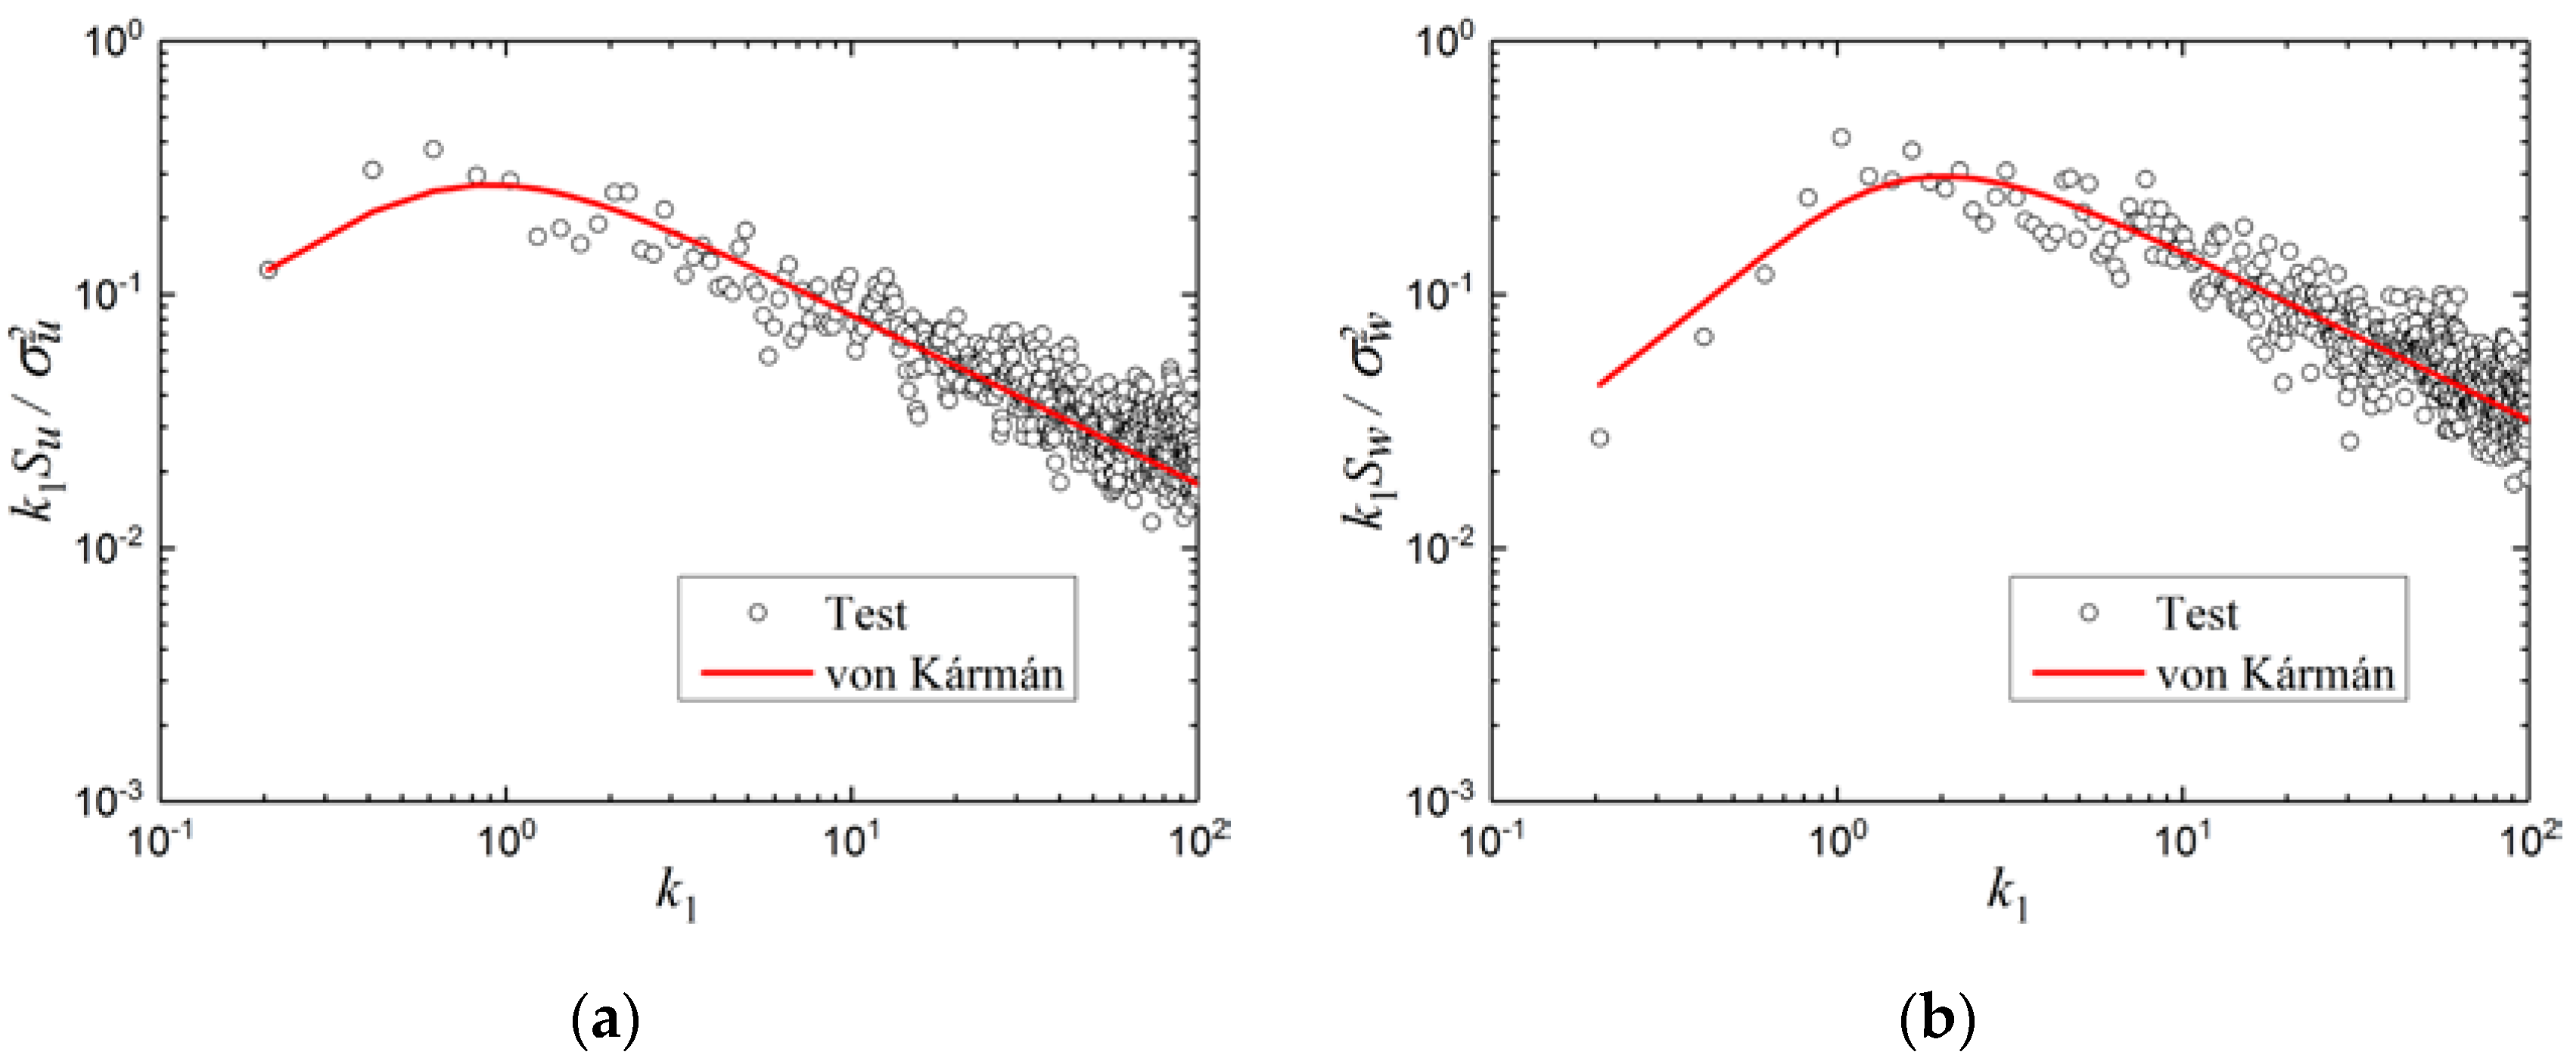
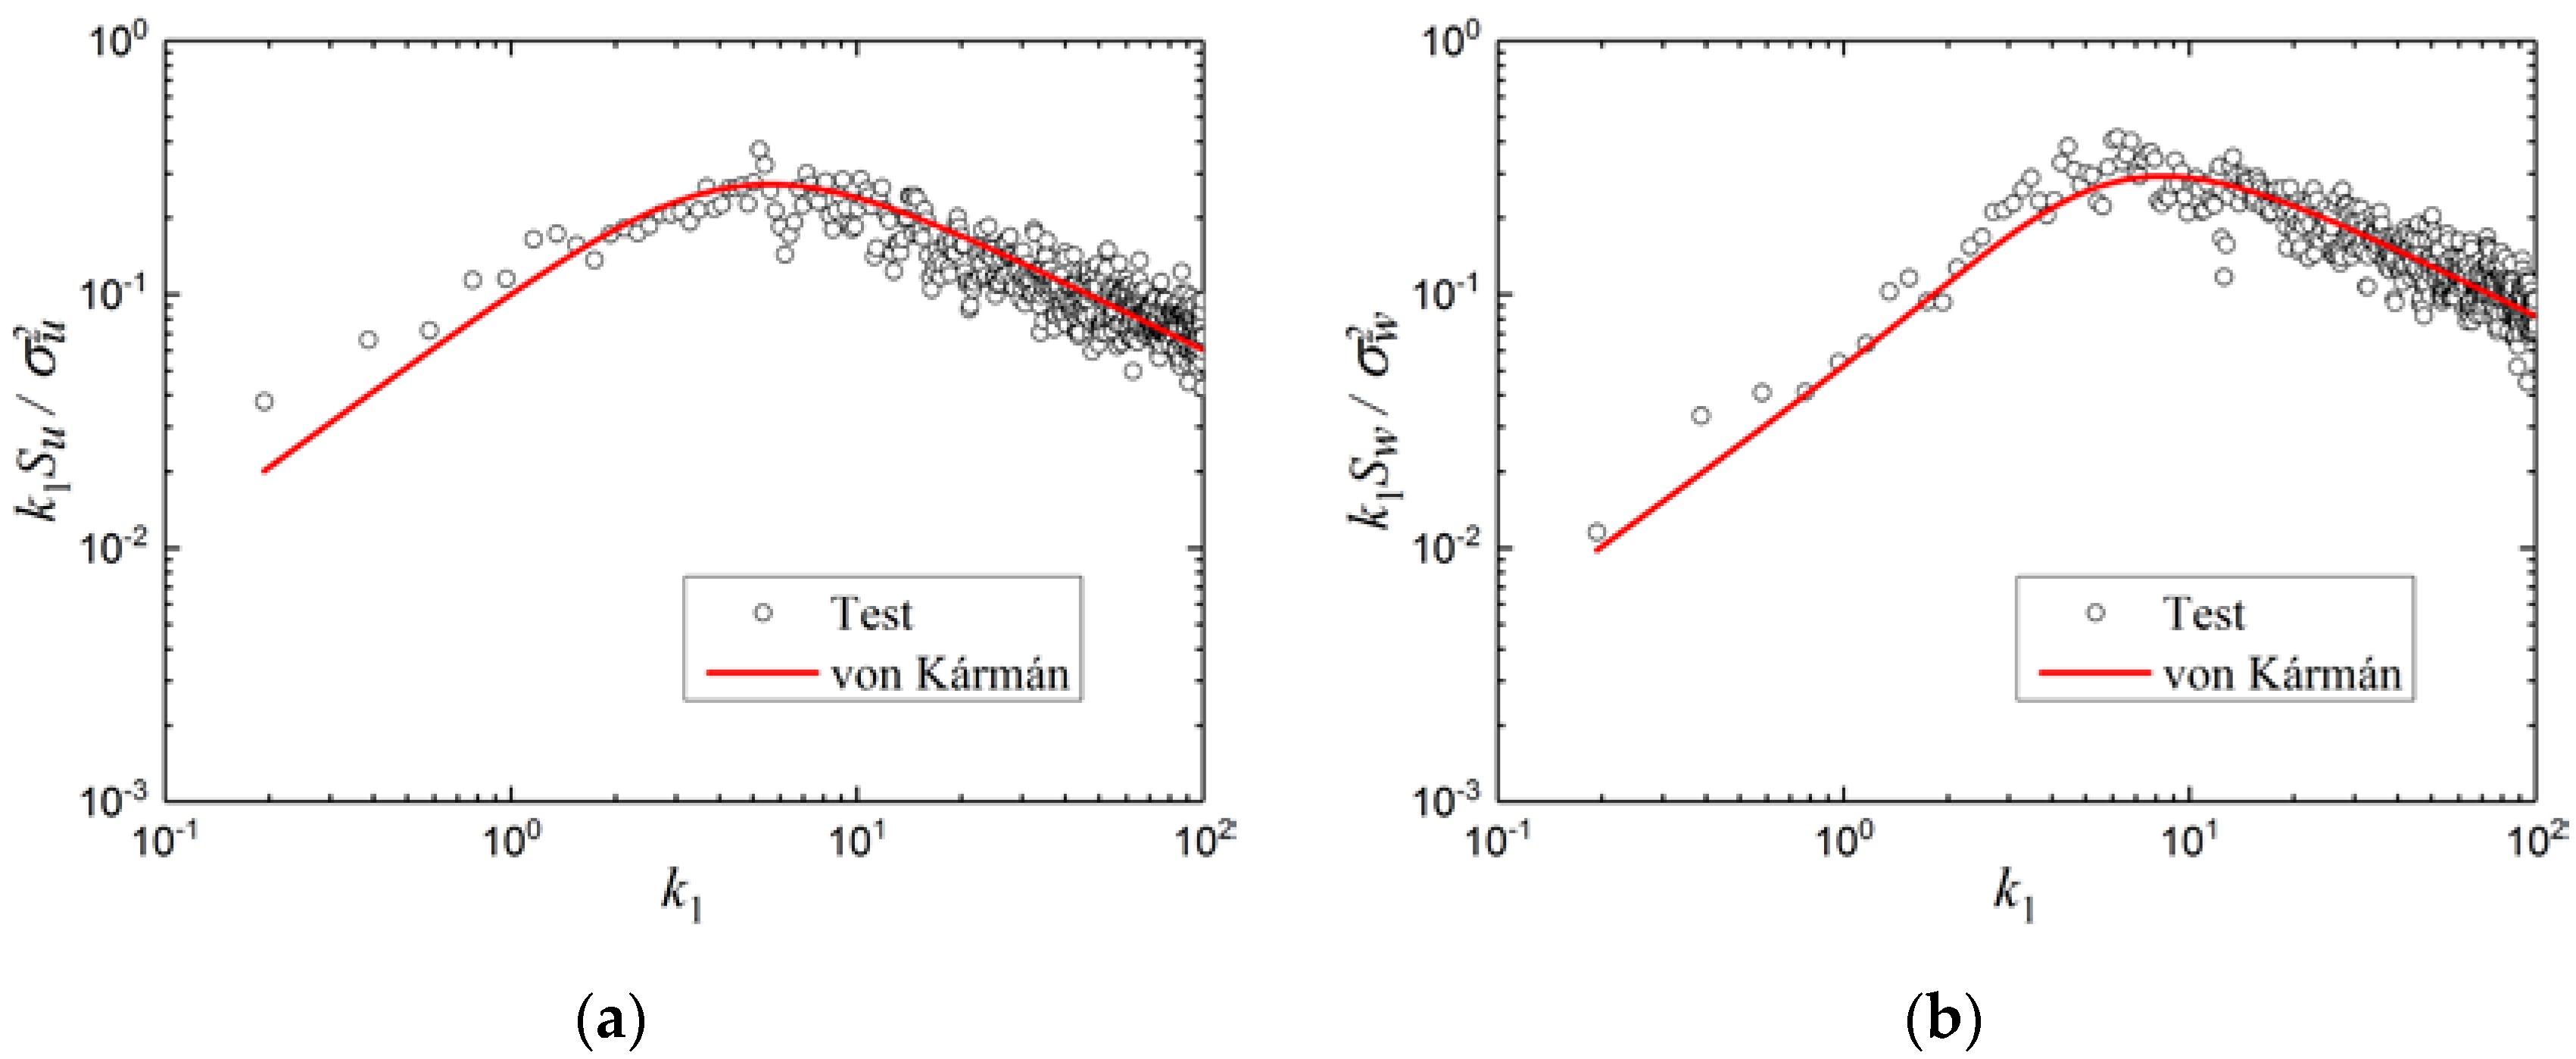
To study the buffeting response under the turbulence field, it is necessary to first measure the flow field quality to ensure the accuracy of the study. It should be noted that, according to the buffeting theory of long-span bridges, it is not difficult to find that the fluctuating components of the turbulence field along the transverse wind direction do not contribute to the calculation of the buffeting response, so the transverse turbulent fluctuating characteristics were not repeated here. Among many turbulent fluctuating wind velocity spectrum models, the von Kármán spectrum [
41], which is widely used in aviation and structural wind engineering, is more suitable for describing atmospheric turbulence higher above the ground and the turbulent characteristics simulated in a wind tunnel [
42,
43]. To ensure the quality of the simulated turbulence field in the test, it is usually fitted to the von Kármán spectrum.
Figure 6 and
Figure 7 show the longitudinal and vertical fluctuating wind velocity spectrum of the above turbulence fields, and the von Kármán spectrum was used to fit the results. The results show that the simulated fluctuating wind velocity spectra fit well with the von Kármán spectrum, and met the test requirements.
In addition,
Table 1 gives the other two important parameters of the turbulence field: turbulence intensity and turbulence integral scale. In
Table 1,
and
represent the turbulence intensity and turbulence integral scale, respectively, and the subscripts
and
represent the longitudinal and vertical directions of the turbulence field, respectively.
6. Buffeting Response Prediction and Analysis
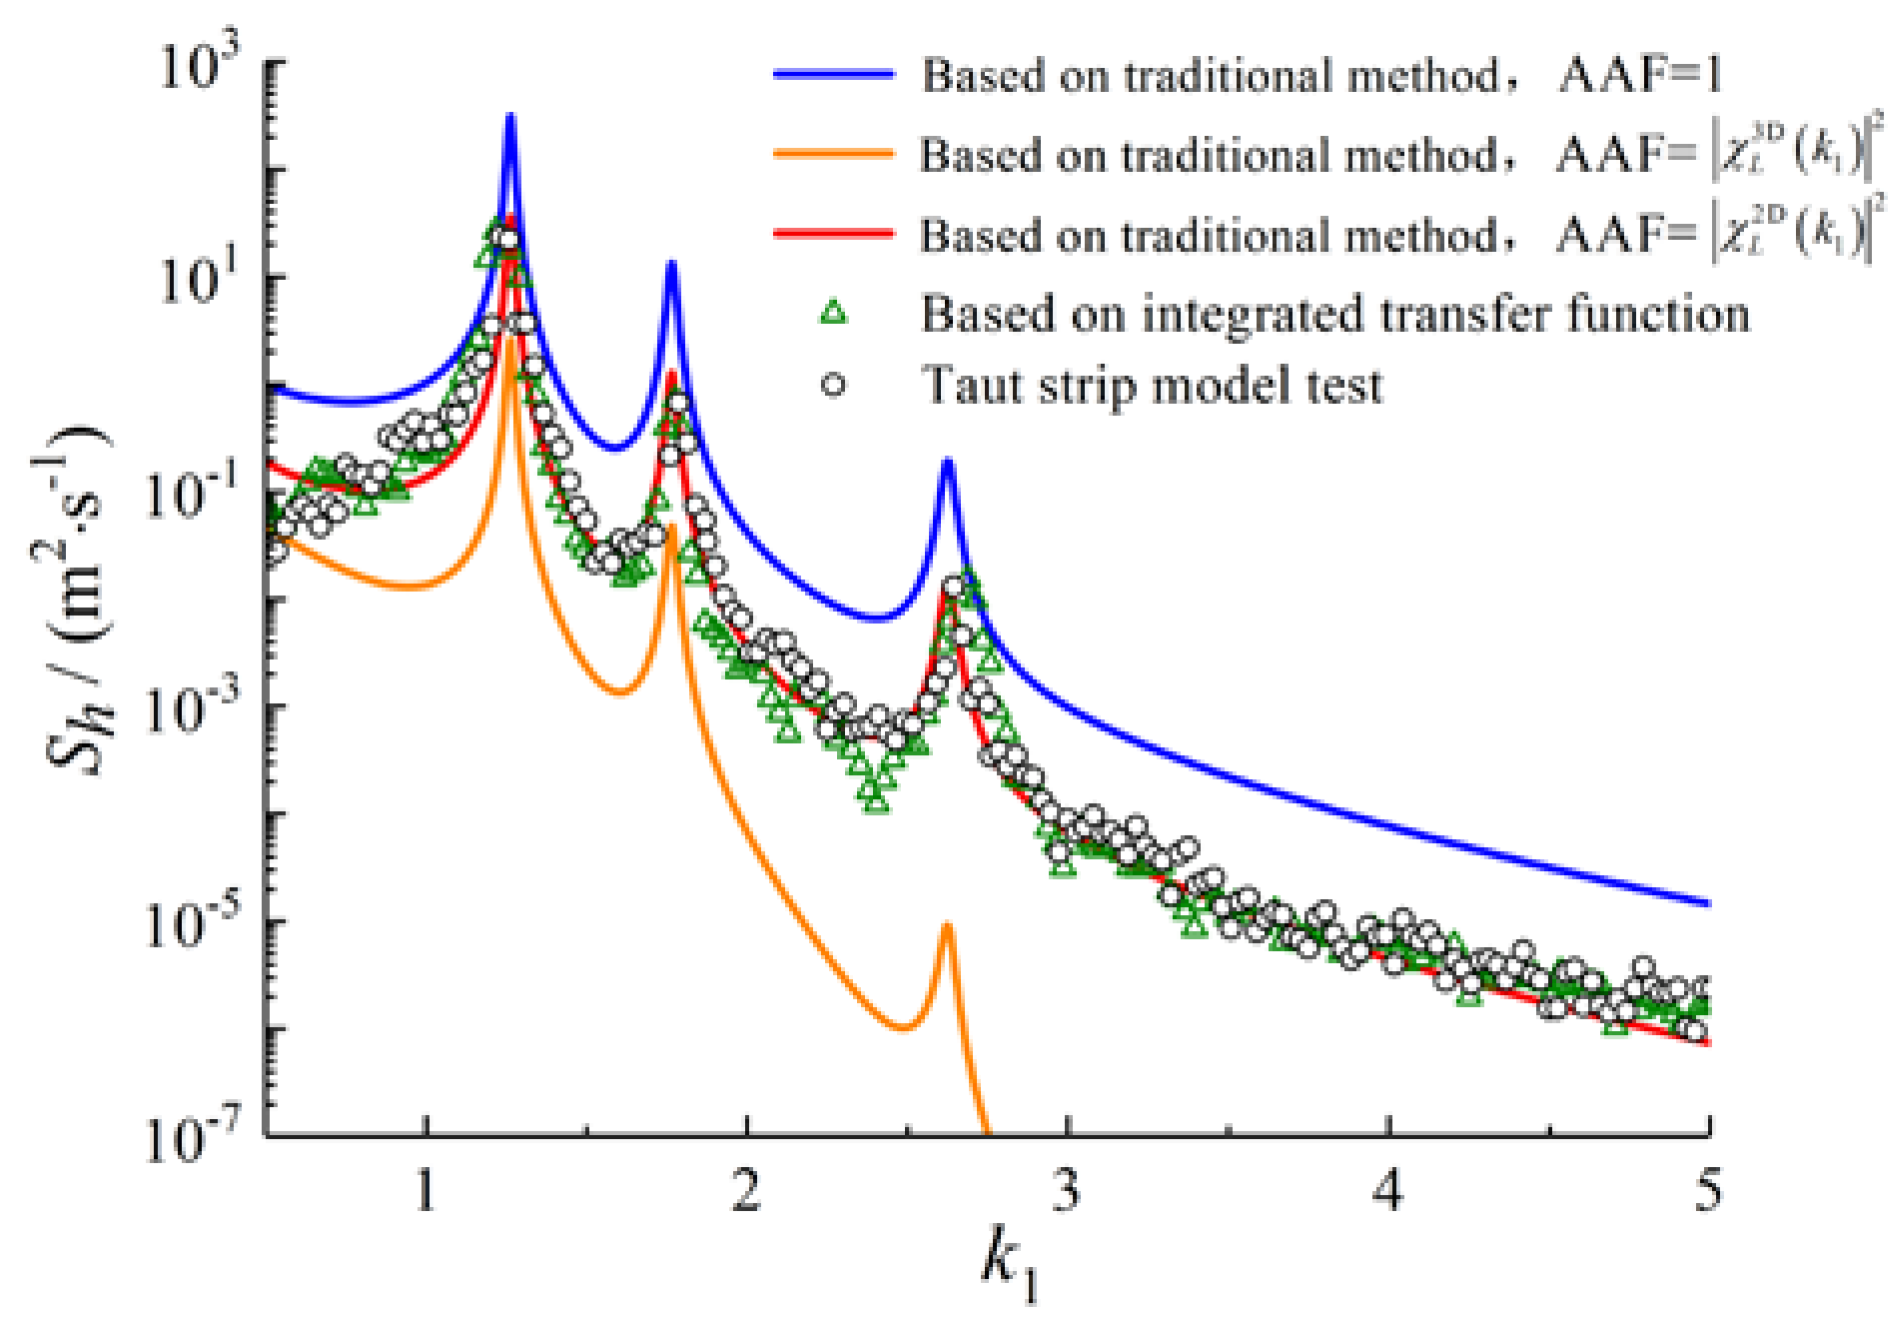
Relying on the aerodynamic admittance and aerodynamic derivative identified by the above sectional model test, the buffeting response result of the structure can be calculated according to Equations (1)–(3). Relying on the integrated transfer function identified by the sectional model vibration test, the prediction result of the buffeting response can be calculated according to Equation (7) and Equations (2) and (3). The buffeting response test result of the taut strip model can be calculated using Equation (8). A comparison of the three sets of results is shown in
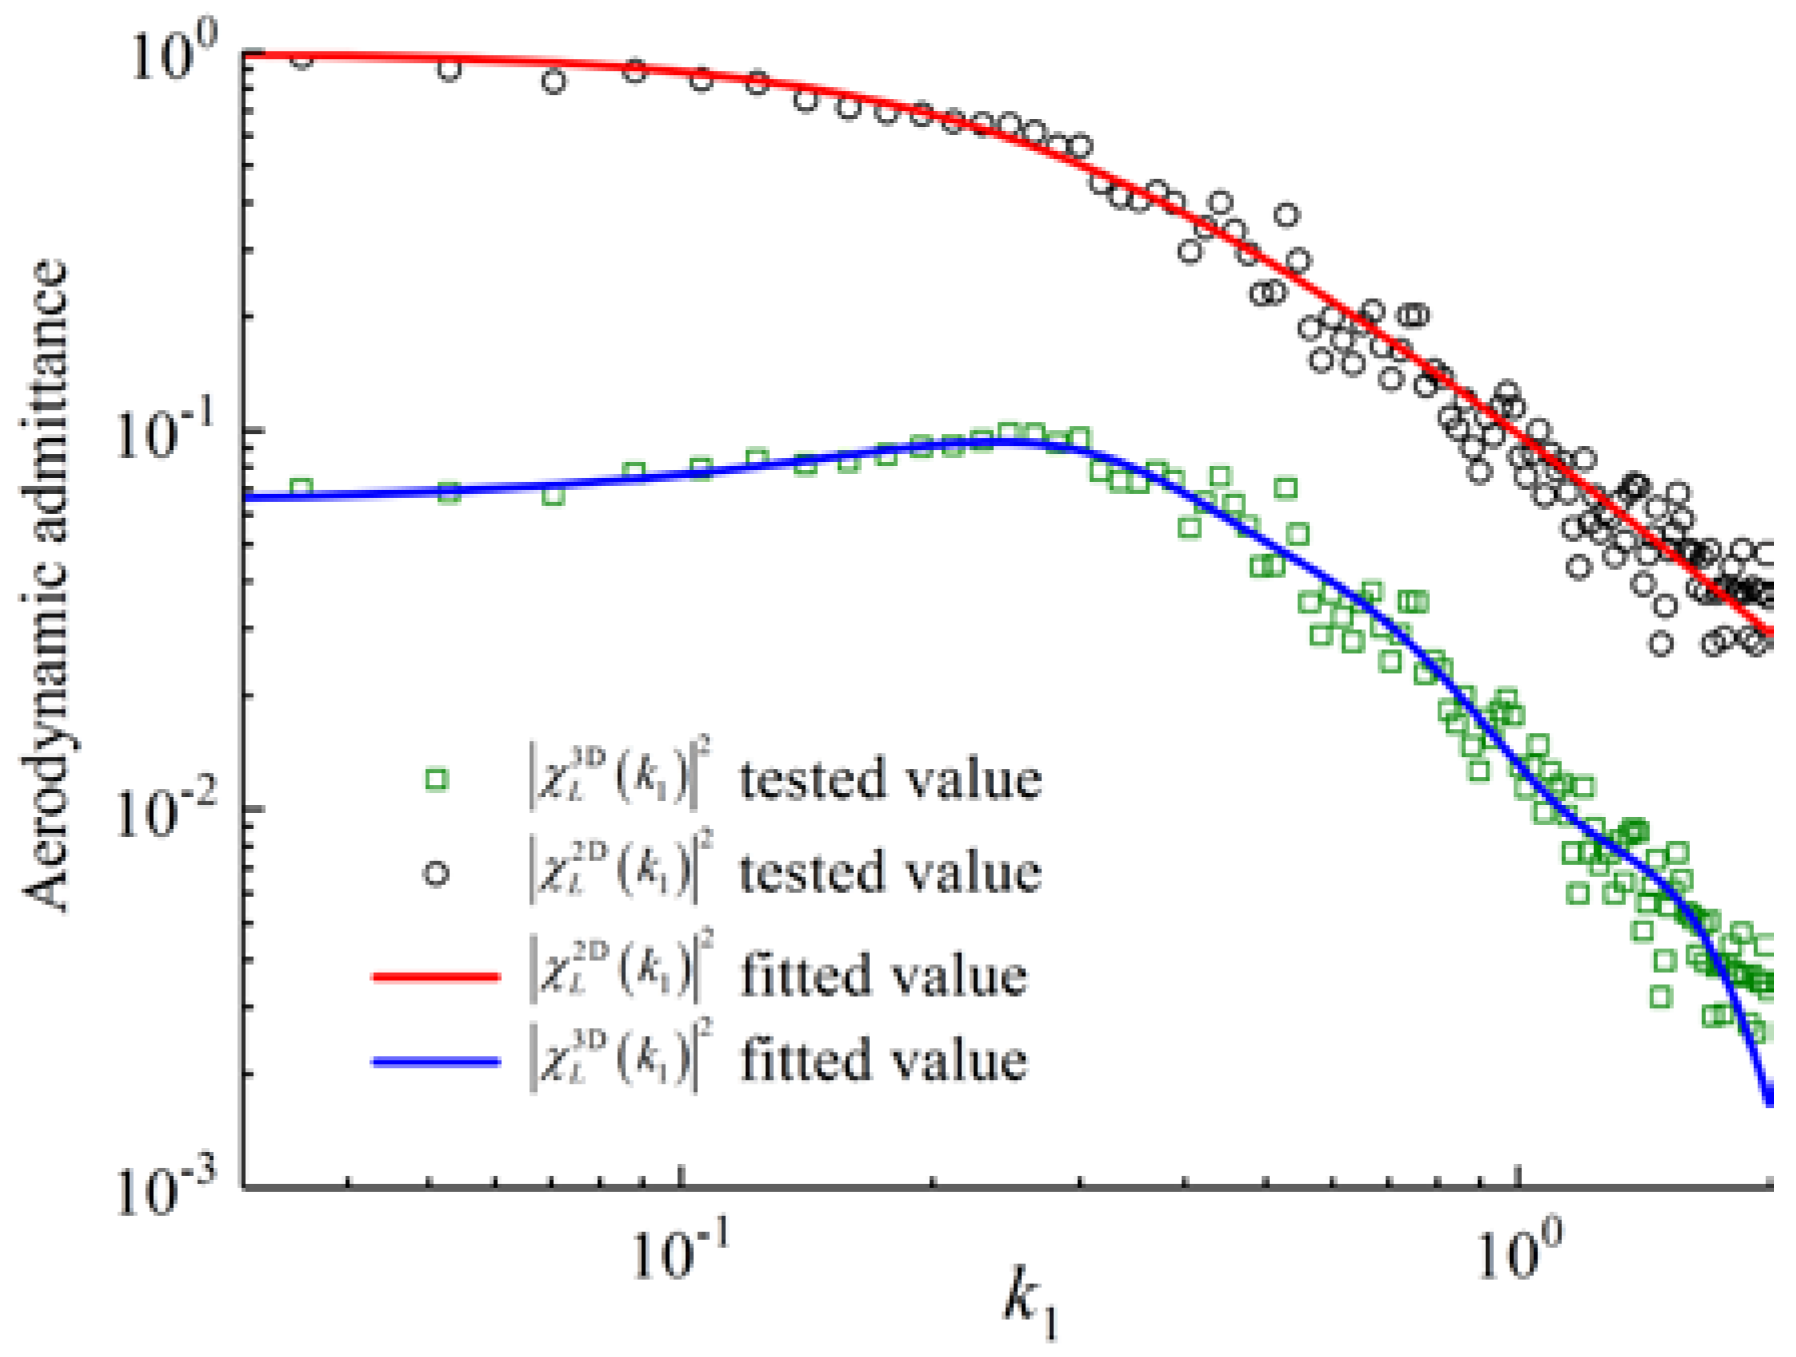
Figure 19. In addition, because the acquisition of the 2D aerodynamic admittance requires the identification of the 3D aerodynamic admittance, the results predicted using the 3D aerodynamic admittance and ignoring the influence of the aerodynamic admittance, based on the identification results of each aerodynamic admittance shown in
Figure 12, are also displayed for comparison.
In
Figure 18, the black and green scatter plots are the results of the taut strip model test and the prediction results based on the integrated transfer function, respectively. The solid curves with different colors are based on the traditional buffeting response calculation method, using the 2D and 3D aerodynamic admittances, respectively, and without considering the influence of the aerodynamic admittance. To facilitate this distinction and make the graph line clearer, the calculations based on the traditional method are based on the fitting formula of the aerodynamic admittance identification result.
As shown in the figure, there are three obvious main frequency peaks, which align well with the vertical natural frequency of the large-span bridge structure in the buffeting response prediction results obtained through different methods. The traditional buffeting response calculation method ignores the influence of the three-dimensional effect. Using the traditional sectional model test technique, which identifies the aerodynamic admittance without considering the influence of the model aspect ratio, the traditional method uses the correlation of the fluctuating wind instead of the correlation of the buffeting force, which will cause a certain deviation in the calculation results. However, based on the research of Li et al. [
27,
28,
29] regarding the influence of the aspect ratio on the accuracy of the strip assumption, it was found that when the integral scale is not much larger than the structure width, if the structural aspect ratio is sufficient, the three-dimensional effect can be ignored, and the strip assumption is accurate enough. At this time, the correlation of the fluctuating wind can be used to replace the correlation of the buffeting force; that is, the traditional buffeting response calculation method has high accuracy. Su et al. [
26] then proposed the concept of the integrated transfer function and used it as the basis for a method for predicting the buffeting response of long-span bridges. The taut strip model test is carried out under the premise of accurately simulating the dynamic characteristics of the bridge. As shown in
Figure 18, the buffeting response prediction results based on the identification of the 3D aerodynamic admittance and the integrated transfer function of the model with a large aspect ratio fit well with the taut strip model test results. We have reason to propose a reasonable sectional model test technique. That is, if the turbulence integral scale is not much larger than the structure width, the aspect ratio can be increased to make the traditional buffeting response calculation method and the method based on the integrated transfer function highly accurate. On the other hand, these two calculation methods are derived strictly based on Davenport’s theory, so the two calculation results fit well with the theoretical expectations. In addition, this result also verifies from the side that Davenport and Scanlan’s analysis methods based on the strip assumption apply to long-span bridges, and reveals the problems existing in the current identification methods for the aerodynamic parameters required in theory. A solution is also given, which is to select a reasonable aspect ratio to make the model.
On the other hand, the results show that the prediction results of the integrated transfer function identified based on the sectional model vibration test have high accuracy when using the effective test technique. This paper verifies the accuracy and applicability of the integrated transfer function proposed by Su et al. [
26] in the buffeting response prediction of long-span bridges through effective tests for the first time. This paper rarely realizes the prediction of the buffeting response of long-span bridges through sectional model vibration tests, which broadens the application scope of sectional model tests to a certain extent, and improves the long-span bridge buffeting response prediction efficiency. It is more conducive to the consideration of the buffeting performance of the bridge during the aerodynamic selection in the preliminary design stage of the structure.
In addition, the calculation results using the 3D aerodynamic admittance are obviously small and become smaller and smaller as the wavenumber increases. This shows that when using the 3D aerodynamic admittance directly identified by the test, there is a large error in calculating the buffeting response using the correlation of the fluctuating wind. It is again demonstrated that when the influence of the three-dimensional effect is considered, the correlation of the fluctuating wind should not be used instead of the correlation of the buffeting force. The research of Larose et al. [
32,
33,
34,
35,
36,
37] on the three-dimensional effect is also verified from the opposite side. When the correlation of the fluctuating wind is used instead of the correlation of the force to calculate the buffeting response, a small buffeting response will be obtained, leading to an unsafe result.
However, ignoring the influence of the aerodynamic admittance, that is, in the case of AAF = 1, the buffeting response calculation result is higher. At this time, this means that the unsteady characteristics of the buffeting force are not considered, and the buffeting force acting on the main beam of the bridge can be calculated according to the quasi-steady theory. Obviously, for a bridge in the atmospheric boundary layer, the buffeting force acting on the bridge girder has strong unsteady characteristics, and ignoring the aerodynamic admittance will result in a more conservative analysis result.
It should be noted that this paper takes the streamlined box girder section as an example to compare various buffeting response prediction methods, and obtains the expected results. Although overall positive in terms of scientific significance, in view of the increasingly complex cross-section forms of current long-span bridges, the conclusions of this paper still need further in-depth research to verify applicability for other bridge cross-section forms.
7. Conclusions
Taking a long-span suspension bridge as an example, this paper predicts the buffeting response of the bridge under the design wind velocity in the simulated large-scale turbulence field through different calculation methods based on different sectional model test techniques. The research results show the following:
(1) The feasibility of the method for predicting the buffeting response of long-span bridges based on the integrated transfer function has been verified by an effective wind tunnel test for the first time. Through reasonable test methods, the integrated transfer function can be identified through the sectional model vibration test to predict the buffeting response of long-span bridges with high accuracy;
(2) The problems existing in the current test methods for identifying the theoretically required aerodynamic parameters are pointed out, and an effective solution is proposed. That is, if the turbulence integral scale is not much larger than the structure width, increasing the model’s aspect ratio can effectively reduce the influence of the three-dimensional effect. This provides an effective technical means of predicting the buffeting response of long-span bridges in future sectional model tests;
(3) When the 3D aerodynamic admittance is used for the calculation of the buffeting response, if the correlation of the fluctuating wind is used instead of that of the buffeting force, a small buffeting response and an unsafe result will be obtained. Neglecting the effect of aerodynamic admittance will overestimate the buffeting response of long-span bridges and obtain a more conservative analysis result. The unsteady characteristics of the buffeting force should be considered when calculating the buffeting response of long-span bridges.
In conclusion, by adopting the reasonable test techniques (selecting a reasonable model aspect ratio for the test to reduce the influence of the 3D effect), the buffeting response prediction results obtained through the three kinds of wind tunnel tests aligned well with the expected results. Even so, there were still slight deviations in the results, which were mainly caused by reasons such as the coupling between modes being ignored in the sectional model vibration test, the influence of turbulence on self-excited forces and the motion state of structure being ignored in the rigid sectional model force test, the Reynolds number effect, etc. Considering that the wind tunnel test is still an indispensable method in the buffeting response prediction for bridges, more effective test techniques are required in subsequent research to further improve the accuracy of the prediction methods.


