1. Introduction
The frequency and the magnitude of extreme rainfalls have increased over many regions of the Earth [
1] Consequently, an increased hazard of flooding has been observed, accompanied by a vulnerability increase heavily related to the economic and social development in the floodplains [
2].
In order to provide a standard legal framework for the flood risk management within the European Union, the European Commission issued the Floods Directive 2007/60/EC, which aims at mitigating and managing the risks that floods pose to human health, the environment, cultural heritage, and economic activities. According to the Directive, all Member States must develop flood hazard and flooding risk mappings. These maps should represent the integrated knowledge base for further elaborating appropriate objectives and suitable measures that are normally dealt with in the Flood Risk Management Plans of the river basins [
3].
Urban areas can be flooded by riverine floods and by pluvial runoff [
4]. The pluvial floods in urban areas are generally produced by uncontrolled urban development accompanied by the increase of the urban impervious surfaces (when not accompanied by corresponding extensions of the drainage systems). Furthermore, climate changes are expected to worsen the flooding control within the cities by bringing in supplementary loads to existing urban storm drainage systems. After exceeding the carrying capacity of the existing urban drainage system, water flows directly along the streets (urban waterlogging), interacting with the overland flow [
5,
6]. Water that flows on the terrain can either fill the small natural retention areas, re-enter the sewer system, or flow across the terrain surface through preferential pathways [
7]. Flood prevention in urban areas comprises various floodproof measures, as issued from structural and non-structural concepts of preventing or reducing potential flood damages. The traditional urban solution is represented by sewage systems (grey solution), to which underground storage cisterns and pumping stations can be added; the surface water is drained into underground collectors, being subsequently evacuated into the outdoor environment. If the local morphologic conditions are favourable, detention ponds or storage tanks can also be used to cut the peak discharge and to reduce the pressure on the urban rainwater drainage network or on the receptor rivers [
8,
9].
As previously mentioned, classic stormwater management is based on the opportune off-flow of excess water towards neighbouring water bodies. However, the urban areas represent subsystems of river basins, and their water management is expected to support the overall water management of the entire basin [
10]. The drainage of large cities during strong rainfalls could bring significant flooding to their downstream areas. Sustainable Urban Drainage Systems (SUDS), known also as flood-planned city, Low Impact Development (LID), and Sponge City, represents an alternative to classic urban water management. The main goal of such systems is to transform the urban hydrological cycle, bringing it as close as possible to the natural hydrological cycle by properly addressing the source control, permeable conveyance, storage, and pollution management [
11]. Within this context, the spatial planning concepts must promote a more holistic, sustainable, and strategic view [
11]. Green infrastructure measures, as an alternative or complementary approach to SUDS, are used to augment the capacity of the urban stormwater management. A mixed approach of structural and non-structural flooding control, based on detention tanks (DTs) and LID facilities is currently widely adopted [
12]. While the DTs are meant to mainly cut the peak of the urban floods, the LID reduces and delays the flood peak, while having beneficial effects on water quality [
12]. Although they are different, Urban Drainage Systems (UDS), DTs, and LID are interconnected systems, working together for flood mitigation [
13]. The utilization of LID practices can lead to significant effects on reducing the surface runoff, the peak runoff, and the flood volume, but involves the replacement of important portions of the impervious urban area (25% in a study led by [
13]). In the quoted study, the best performances of LID practices were ranked as follows: bio-retention cell > rain garden > green roof > permeable pavement.
In principle, water companies need to develop a philosophy and culture of sustainable development, as do all contemporary companies [
14]. To achieve such a goal, the use of information systems is a must for the efficient operation of a company and for the support of sustainable practices [
14]. The information technologies are designed to perform tasks which largely exceed the capacity of the human brain, such as operating a very large volume of information, performing complex calculations, and controlling many simultaneous processes. Physically based models and GIS tools are the main pillars for simulating natural urban flooding and the delineation of the affected areas under torrential rainfall scenarios in a built-up environment.
Different models were developed to derive the flooded urban areas, depending mainly on the available computation capabilities. All models uniquely take into consideration both the overland flow and the flow through the urban sewage network. The urban drainage system was divided [
15] into a minor system (underground collectors of the sewage network) and a major system (streets, pathways connecting depression areas, or small water courses). Based on this concept, the dual drainage models 1D–1D generate the overland flow and consider the interaction with the sewage network through grate inlets [
5,
16]. Due to usual lack of reliable knowledge over the configuration and characteristics of the sewage system, that system is indirectly accounted for by considering its evacuated flow as corresponding to its designed frequency. Coupled (lumped or distributed) hydrological and (1D or 2D) hydraulic models provide the flood hydrograph along the streets or at the outlet points. In the case of distributed hydrological models, the spatial-temporal distribution of rainfall should be considered [
17].
The current trend in urban hydrology is to use integrated modelling of 2D urban surfaces and 1D sewer hydrodynamic processes [
18] due to the advantages they provide, including reliable simulation of 2D overland flow [
9], which leads to accurate flooding extension, water depths, and water velocity in raster format. For 2D models, the Digital Terrain Model (DTM) resolution of 1–2 m [
19,
20] with a vertical accuracy of 0.1 m [
21] is recommended. This resolution allows for a fair representation of the buildings, which can be included in the topographic map by raising the building footprint to the first-floor level (0.3–0.5 m or even higher) or considering a higher terrain roughness [
22]. At the same time, the roads network should be lowered by 0.10–0.15 m to preserve the main directions of the urban flow [
23].
Until recently, most of the urban flood simulations have been carried out at low spatial resolution due to the high computational cost involved. Now, GPU-accelerated hydrodynamic models can perform high-resolution simulations [
19]. Even though the GPU provides a significant reduction in simulation time for 2D hydrodynamic models, due to the ongoing increase of the quality and resolution of input data for large cities, the simulation time for these types of models appears to still be an important factor that requires the modeler’s attention.
Despite the technological progress (Lidar, Radar, GPU), there are still numerous situations with limited available basic data, such as a detailed digital terrain model, the extension of the flooded areas, or the series of sewage discharges [
24]. In these cases, some useful information (crowdsource data) can be collected from nonconventional (and usually less reliable) sources, including memories of local inhabitants, newspapers, social media, case histories of previous floods, etc.
Recent studies have shown that adopting a more complex approach for case studies without sufficient observations for calibration is not contradictory, while the added value of a continuous approach is significant in the characterization of the design hydrograph attributes [
25]. Alternatively, event-based approaches still represent a good solution for diminishing the uncertainties related to hydrologic modelling parametrizations [
26].
Despite the long rainfall time series available at Tulcea meteorological station, there were no data concerning both (i) the generated street flow during torrential rains and (ii) the corresponding discharges at the outlets of the urban sewage system. The only available information (photographs of flooded urban areas) was for two rainfall events. Consequently, the data used for calibration and validation were the volume stored in the depression areas as unique values (not a time series of the volume storage). The flood volume is more relevant than the peak discharge for flood extent evaluation, as well as for approaching different drainage solutions, in an urban environment. Since a continuous simulation involves the risk of model overparameterization, an event-based approach was adopted.
The main goal of our study was to obtain relatively reliable results using fast hydrological modelling coupled with a volume-based flood approach in order to reliably evaluate the flooded urban areas under extreme rainfall events. This approach is imposed by the limited input data compared to a distributed and coupled hydrological-hydraulic 2D model. Based on convenient simulation times, a large number of simulations could be undertaken, analysing a significant number of scenarios, mostly related to the functionality of the sewage system. For calibration and validation purposes, crowdsourced data (mainly photos) are used [
27,
28,
29]. Crowdsourced data, even if not at the desired resolution or accuracy, may contain relevant information concerning urban areas with important landmarks. Based on this type of data, a water level can be conveniently estimated, and by using GIS tools coupled with an area DTM, the flood extent and the flood volume can be obtained. Various ways of reducing and controlling surface runoff were reviewed. Upon their calibration, new scenarios for future urban developments or climate change conditions can be considered. It is considered that this approach can be easily implemented for urban conditions of other towns, where the sewerage outlets discharges are not registered.
This paper is organized as follows:
Section 2 introduces the Materials and Methods used in this study;
Section 3 provides a Case study and the description of the Mathematical model;
Section 4 contains the Results of the mathematical modelling;
Section 5 is devoted to Discussion; and
Section 6 presents Conclusions.
2. Materials and Methods
The modelling approach for the urban pluvial flooding (as proposed in this study) is based on a lumped hydrological model coupled with GIS analysis. In our simplistic case, no overland flow was simulated, and the flooded urban areas were obtained using GIS processing of the simulated runoff volumes. As per simulating the rainfall-generated flooding surface extent and surface flooding depths, the approach is quite similar to other volume-based methods such as RFSM (Rapid Flood Spreading Model) [
30].
The volume-based approach proposed in this study uses the runoff volumes simulated using hydrological modelling, which are distributed over the urban areas based on local topography and land depressions, as inputs. Subsequently, the flood extent and depth grids can be generated for the urban areas that can be further used by decision-making stakeholders.
For the volume-based approach to be implemented, a pre-process of the terrain is required. In this phase, a number of potential flooded areas (cells) corresponding to terrain depressions and areas where the water accumulates during urban flooding are delineated. For the urban areas, the delineation of the flood cell should also consider the street profile and the way the streets connect to each other, since they can convey or store the runoff volumes. For each flood cell, the level–volume curve, named also capacity curve, is determined. In the case of adjacent flood cells, the ridge elevation can be also determined. Its levels must be exceeded in order for the cells to become intercommunicating. Based on the simulated volumes from the hydrological model, the flood areas are filled using the capacity curve. If the maximum level of a flood area is exceeded (over the ridge level), part of the excess volume can be transferred to the neighbouring cell. The key steps used for delineating the flood cells are presented in the following chapters.
The volume-based approached was also used for calibrating the hydrological model. Based on the pictures or previous flooding marks, the flood elevation could be determined, and using the capacity curve, the volume of a flood event could be identified. This volume can be further used for model calibration for a certain urban pluvial flood event, in case no other data are available.
Regarding the second component of the approach, a lumped hydrological model was built using the software package MIKE by DHI, namely the UHM-MIKE11 hydrological module.
Studies undertaken at the event scale have suggested the NRCS-CN method would underestimate the peak discharge due to an inappropriate effect of the initial abstraction on the hyetograph peaks [
25]. A procedure which combines the Soil Conservation Service-Curve Number (SCS-CN) method and the Green–Ampt (GA) infiltration equation was developed by [
31], aiming at an improved estimation of the surface runoff volumes, with a sub-daily time resolution. Yet, this approach has introduced two new parameters:
, the saturated hydraulic conductivity (mm/h), and
, the soil moisture–tension parameter (mm). Considering the scarcity of the calibration data (only one value of the volume stored in the depression areas for each rainfall event) and the danger of over-parameterization, the classic SCS-CN method was herein applied. Two loss models were tested during the development of the study, namely thew proportional loss (based on runoff coefficient) and SCS-CN loss model. Upon their comparison, the SCS-CN was adopted, as it provided better results for the observed events. CN represents the curve number and is based on the basin’s hydrological soil group (A, B, C and D), land use, and antecedent moisture condition (AMC) of the basin at the beginning of the rainfall event. The SCS-CN model works with three levels of AMC based on the antecedent global rainfall in the previous 5-day period. The three AMC levels are defined as follows: AMC-I, dry soil conditions (close to wilting point); AMC-II, average moisture conditions; and AMC-III, saturated soil conditions [
32].
CN varies between 0, when no direct runoff is generated, and 100, when the runoff equals the global rainfall. For natural basins, the CN is usually in the range: 50 ≤ CN ≤ 100.
For the transfer function, the SCS dimensionless hydrograph was used (implemented in the software).
The soil infiltration losses and the hydraulic roughness coefficients were based on Copernicus land cover data and Copernicus Urban Atlas/CORINE land cover data, respectively.
For the calibration and validation of the model parameters, two pluvial events were available for the analysis, namely the 12–13 September 2013 and 14 June 2016 events. Due to the impossibility to appreciate the overland flow and the lack of discharge data through the sewage system, the volume-based approach (as described previously) based on the capacity curve was used for both events.
3. Case Study and Mathematical Model
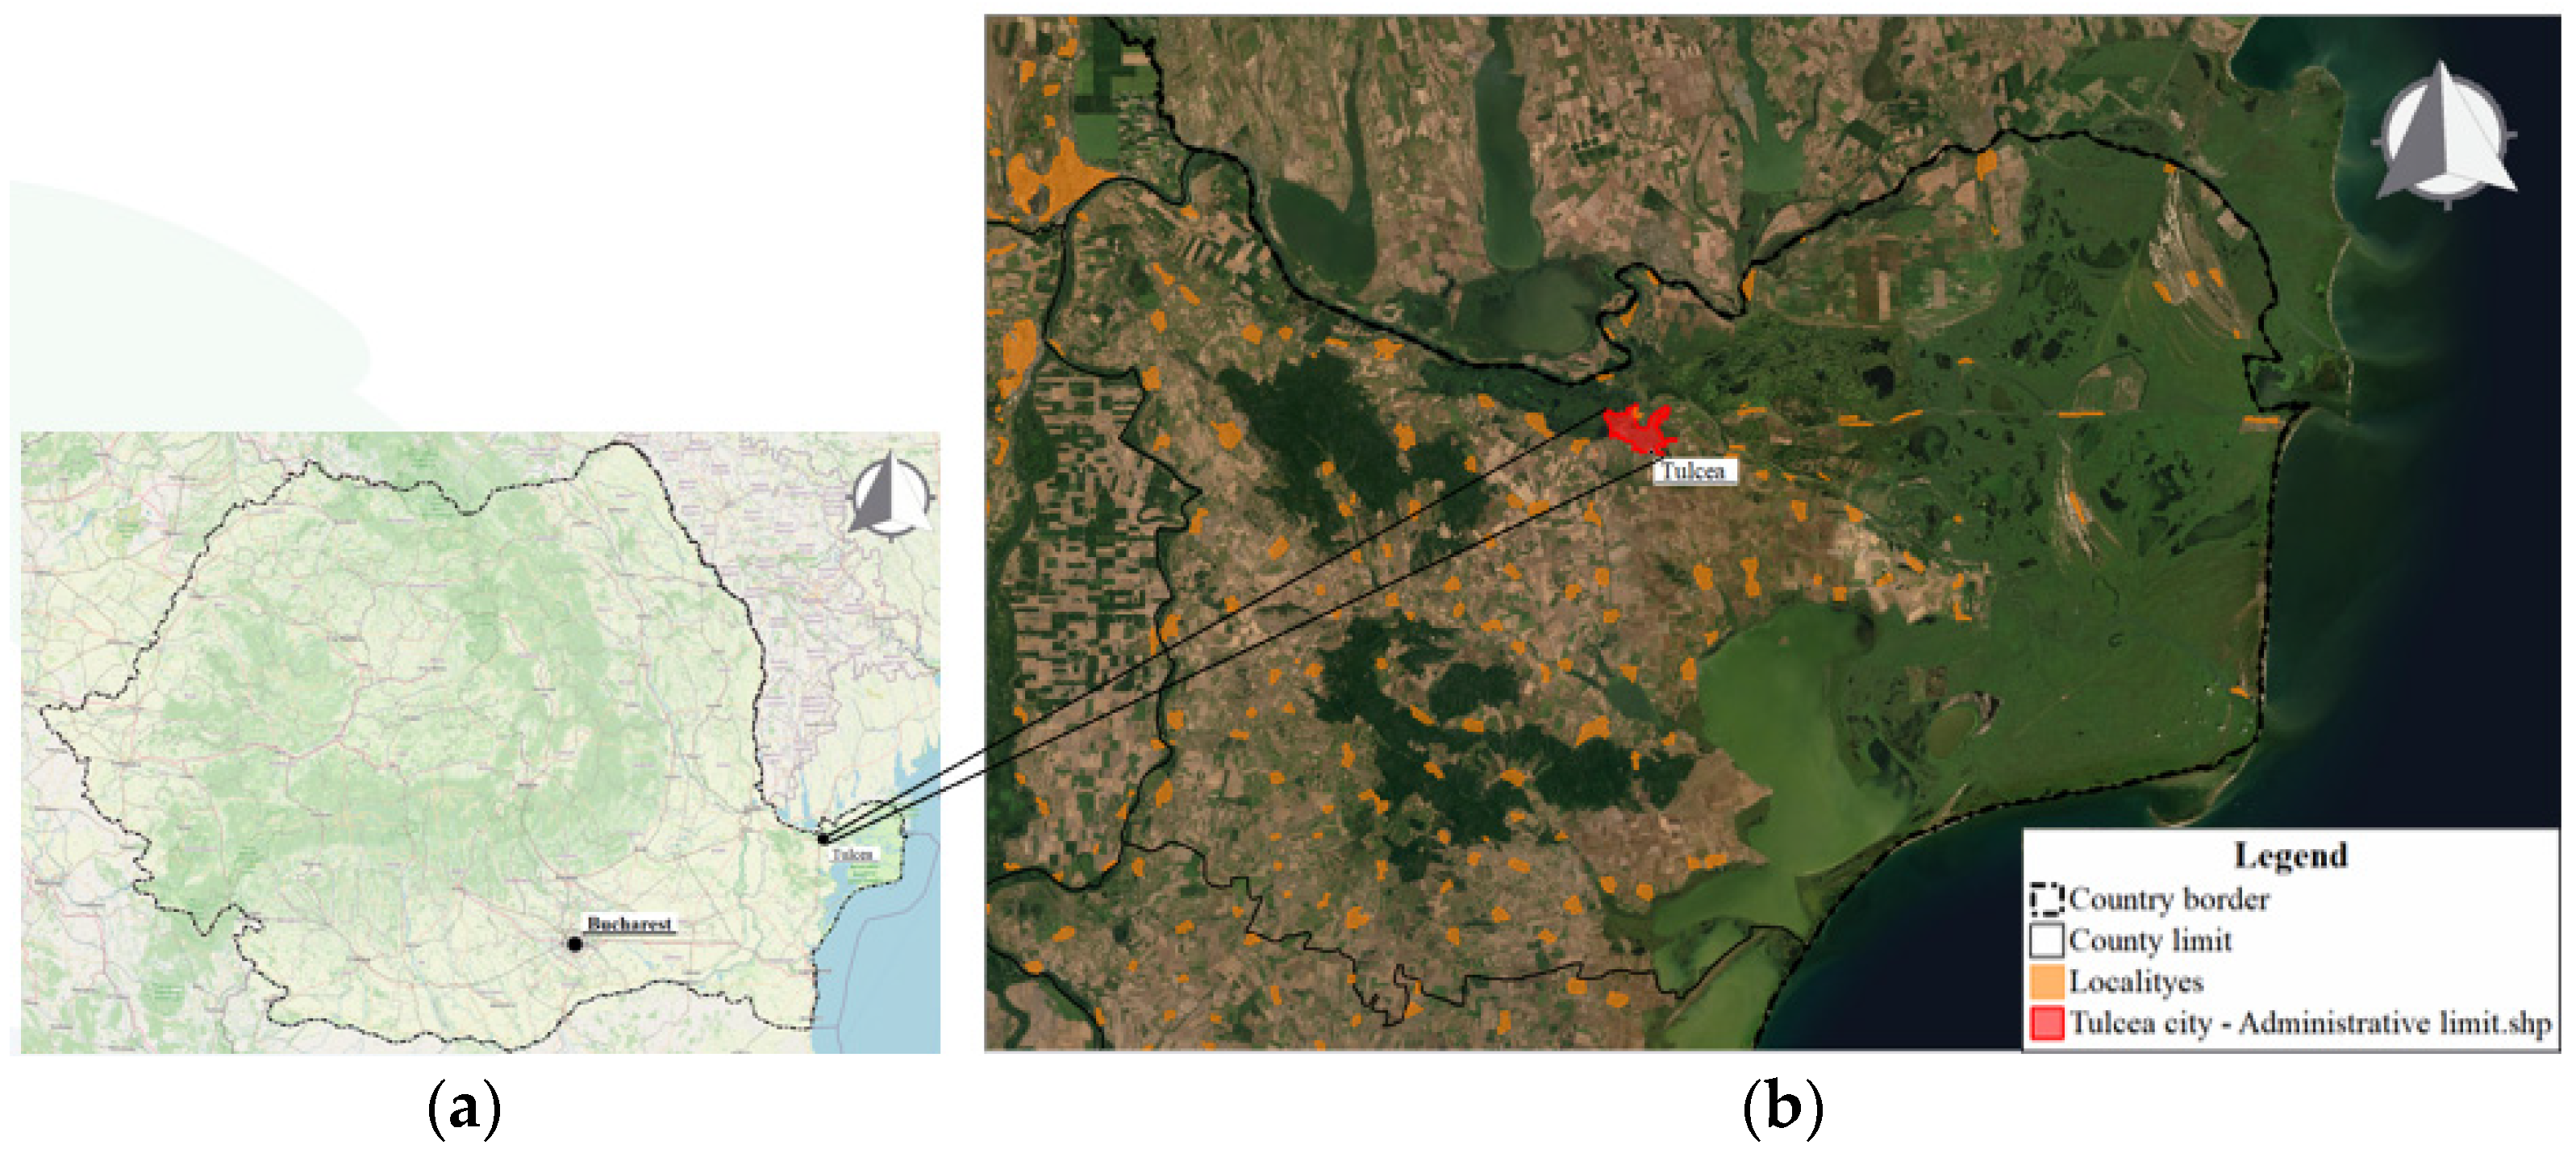
The municipality of Tulcea is located in the south-eastern part of Romania in Dobrogea County, on the right bank of the Danube River just prior to the initiation of the Danube Delta (
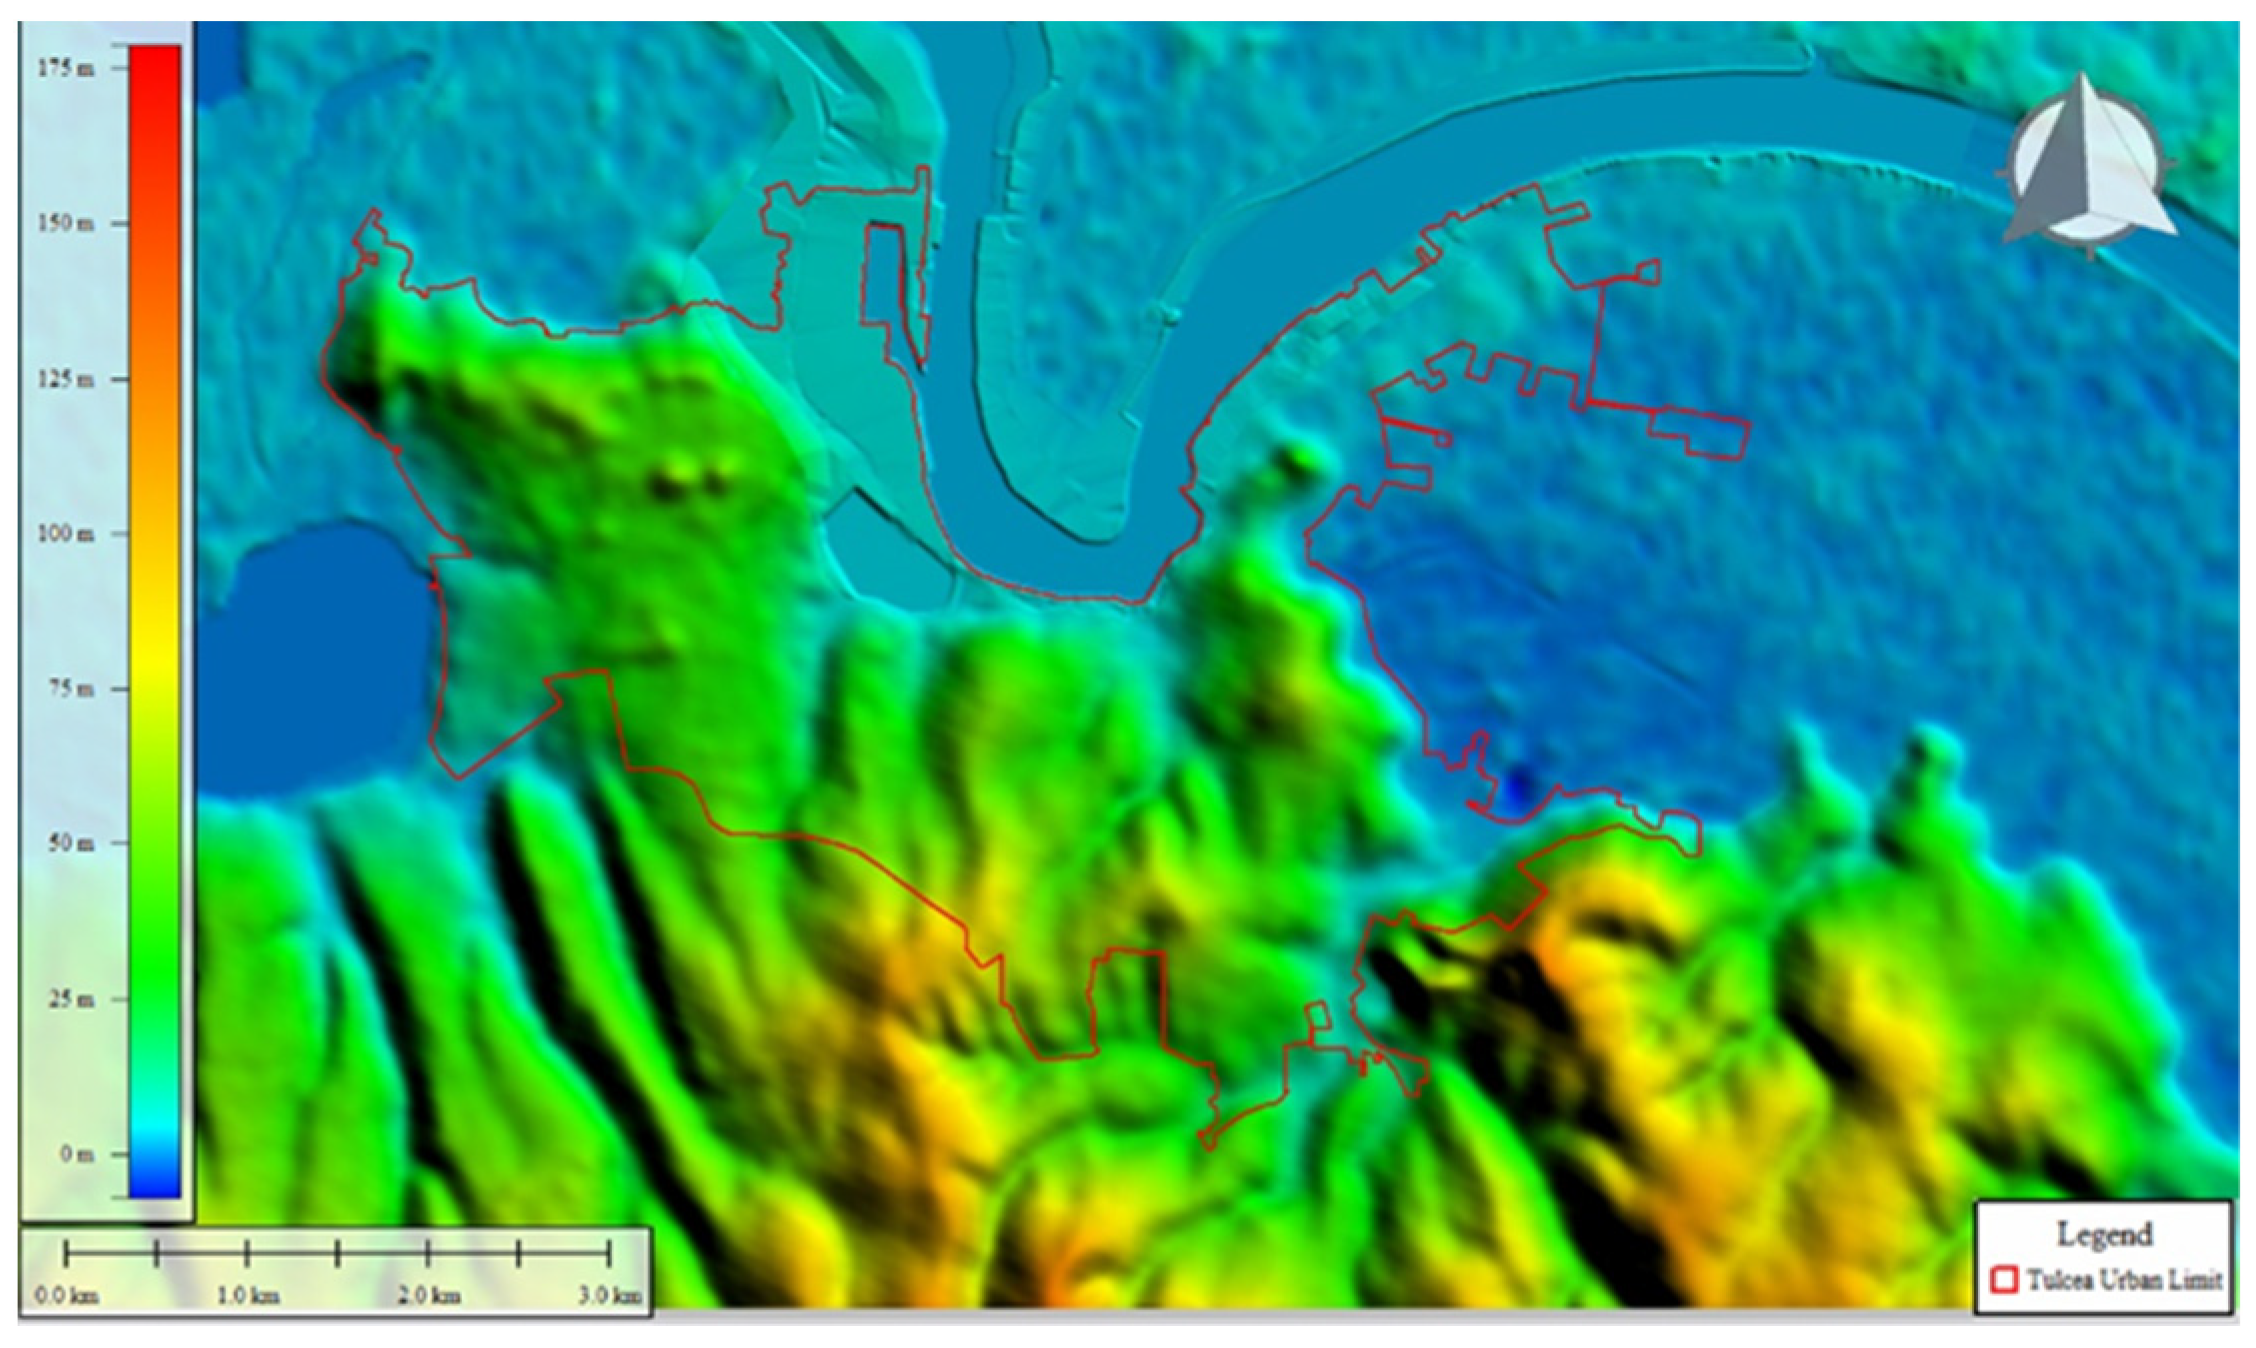
Figure 1). It is on a promontory of the north-Dobrogean slope (
Figure 2). The town is protected against the floods of the Danube River by a dike designed at 1% annual exceedance probability of the Danube’s maximum discharge. Between 1988–2013 the flooding level was exceeded twice, and the dike effectively protected the town.
However, the lower area of the town is frequently flooded (two to three times per year on average) by torrential rainfalls. The slopes of the surrounding hills (
Figure 2) are characterized by high runoff coefficients, and torrential rains generate flows exceeding the drainage capacity of the sewage system. The excess water is accumulated in the former meadow of the Danube River, which has become an urban area protected by dikes along the Danube. In the downtown area, the highest water level was 1.5 m above the ground, with flooding of commercial areas, hotels, and houses.
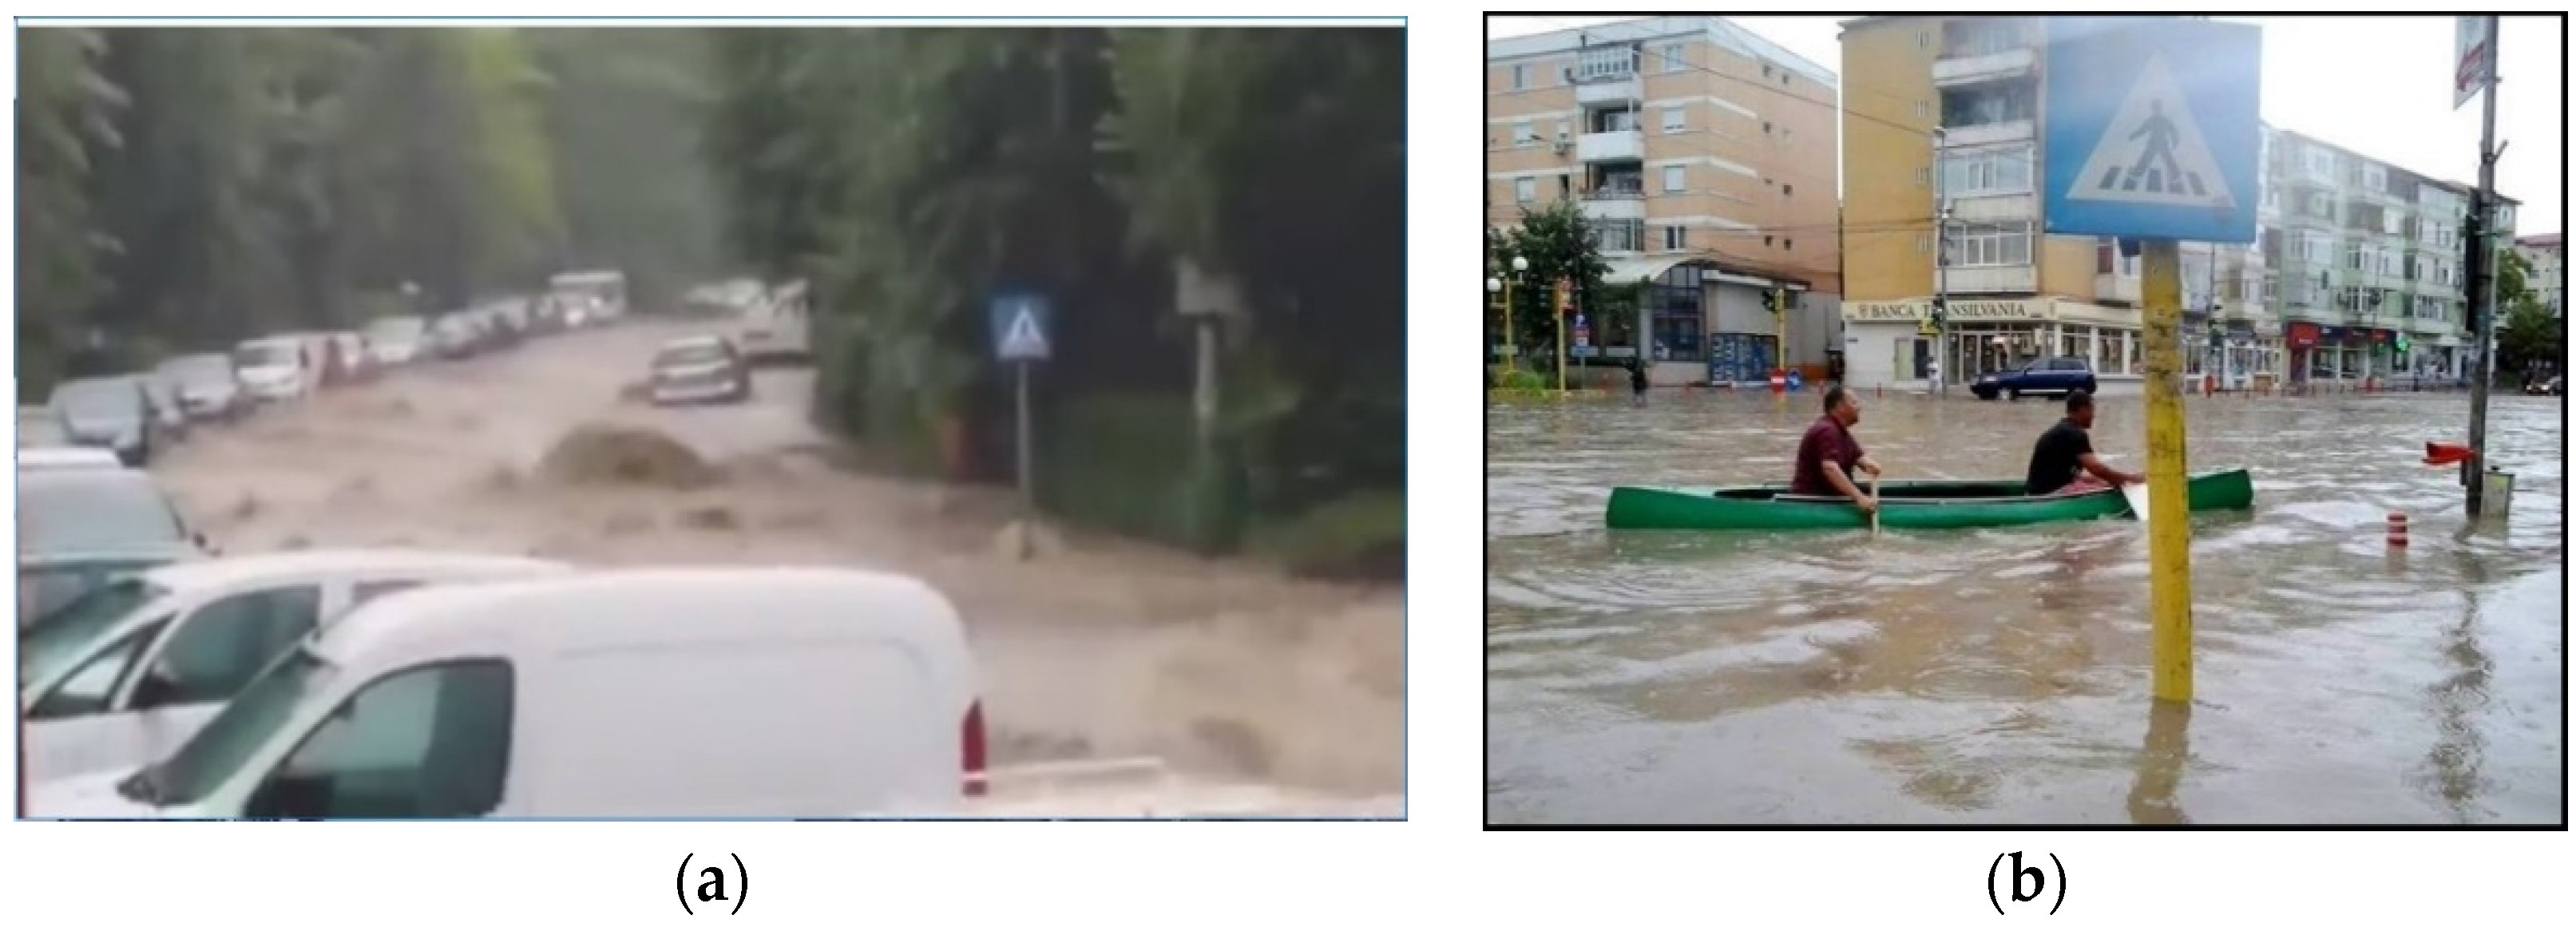
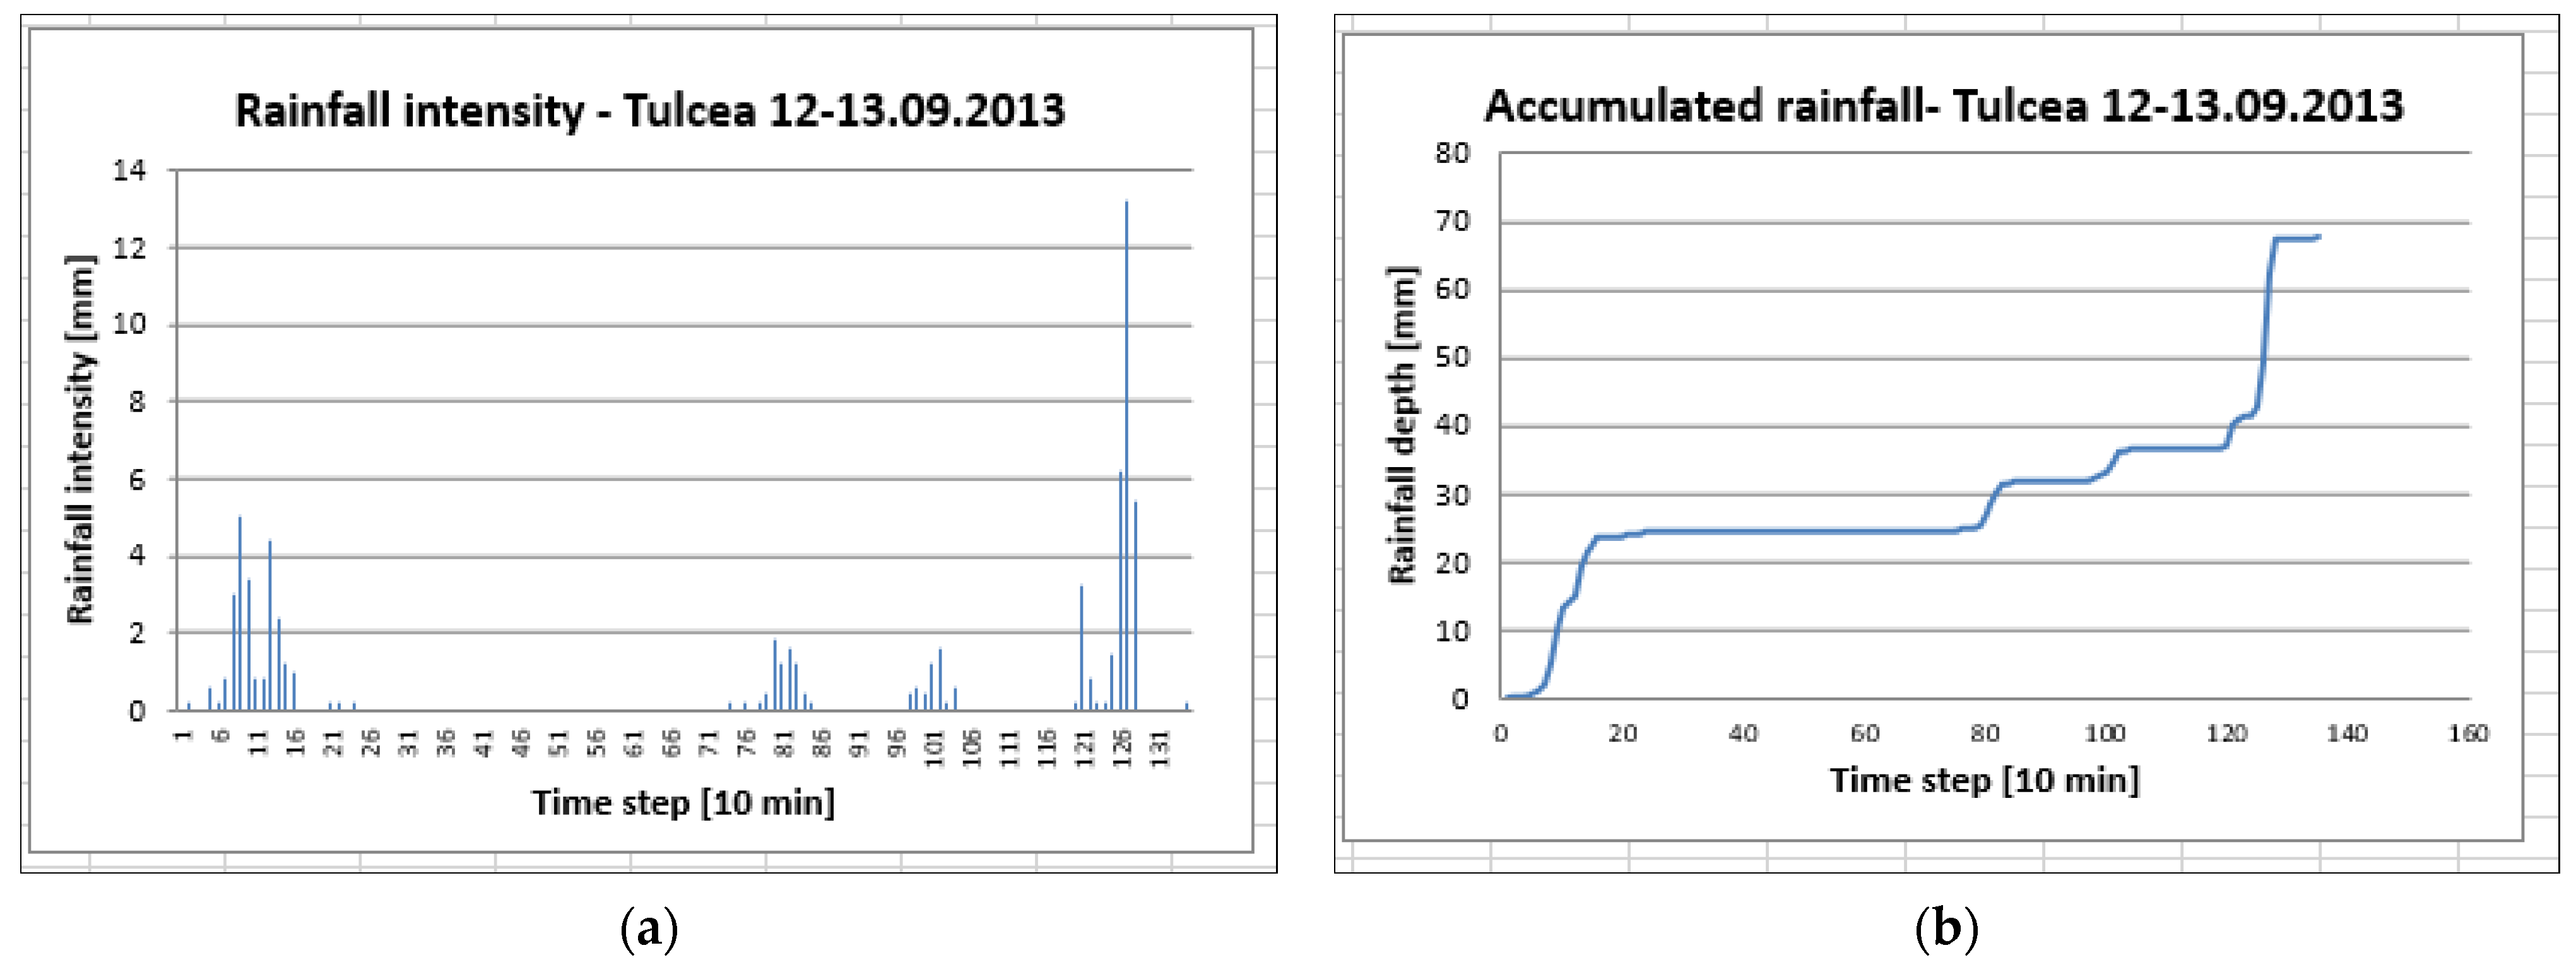
One of the highest torrential rains occurred on 12–13 September 2013, characterized by a duration of 1 h 25 min and a total precipitation of 67.8 mm. Another pluvial event took place on 14 June 2016. A series of images regarding the flooded areas in Tulcea were collected for these two urban flood events, utilising the internet as a source (
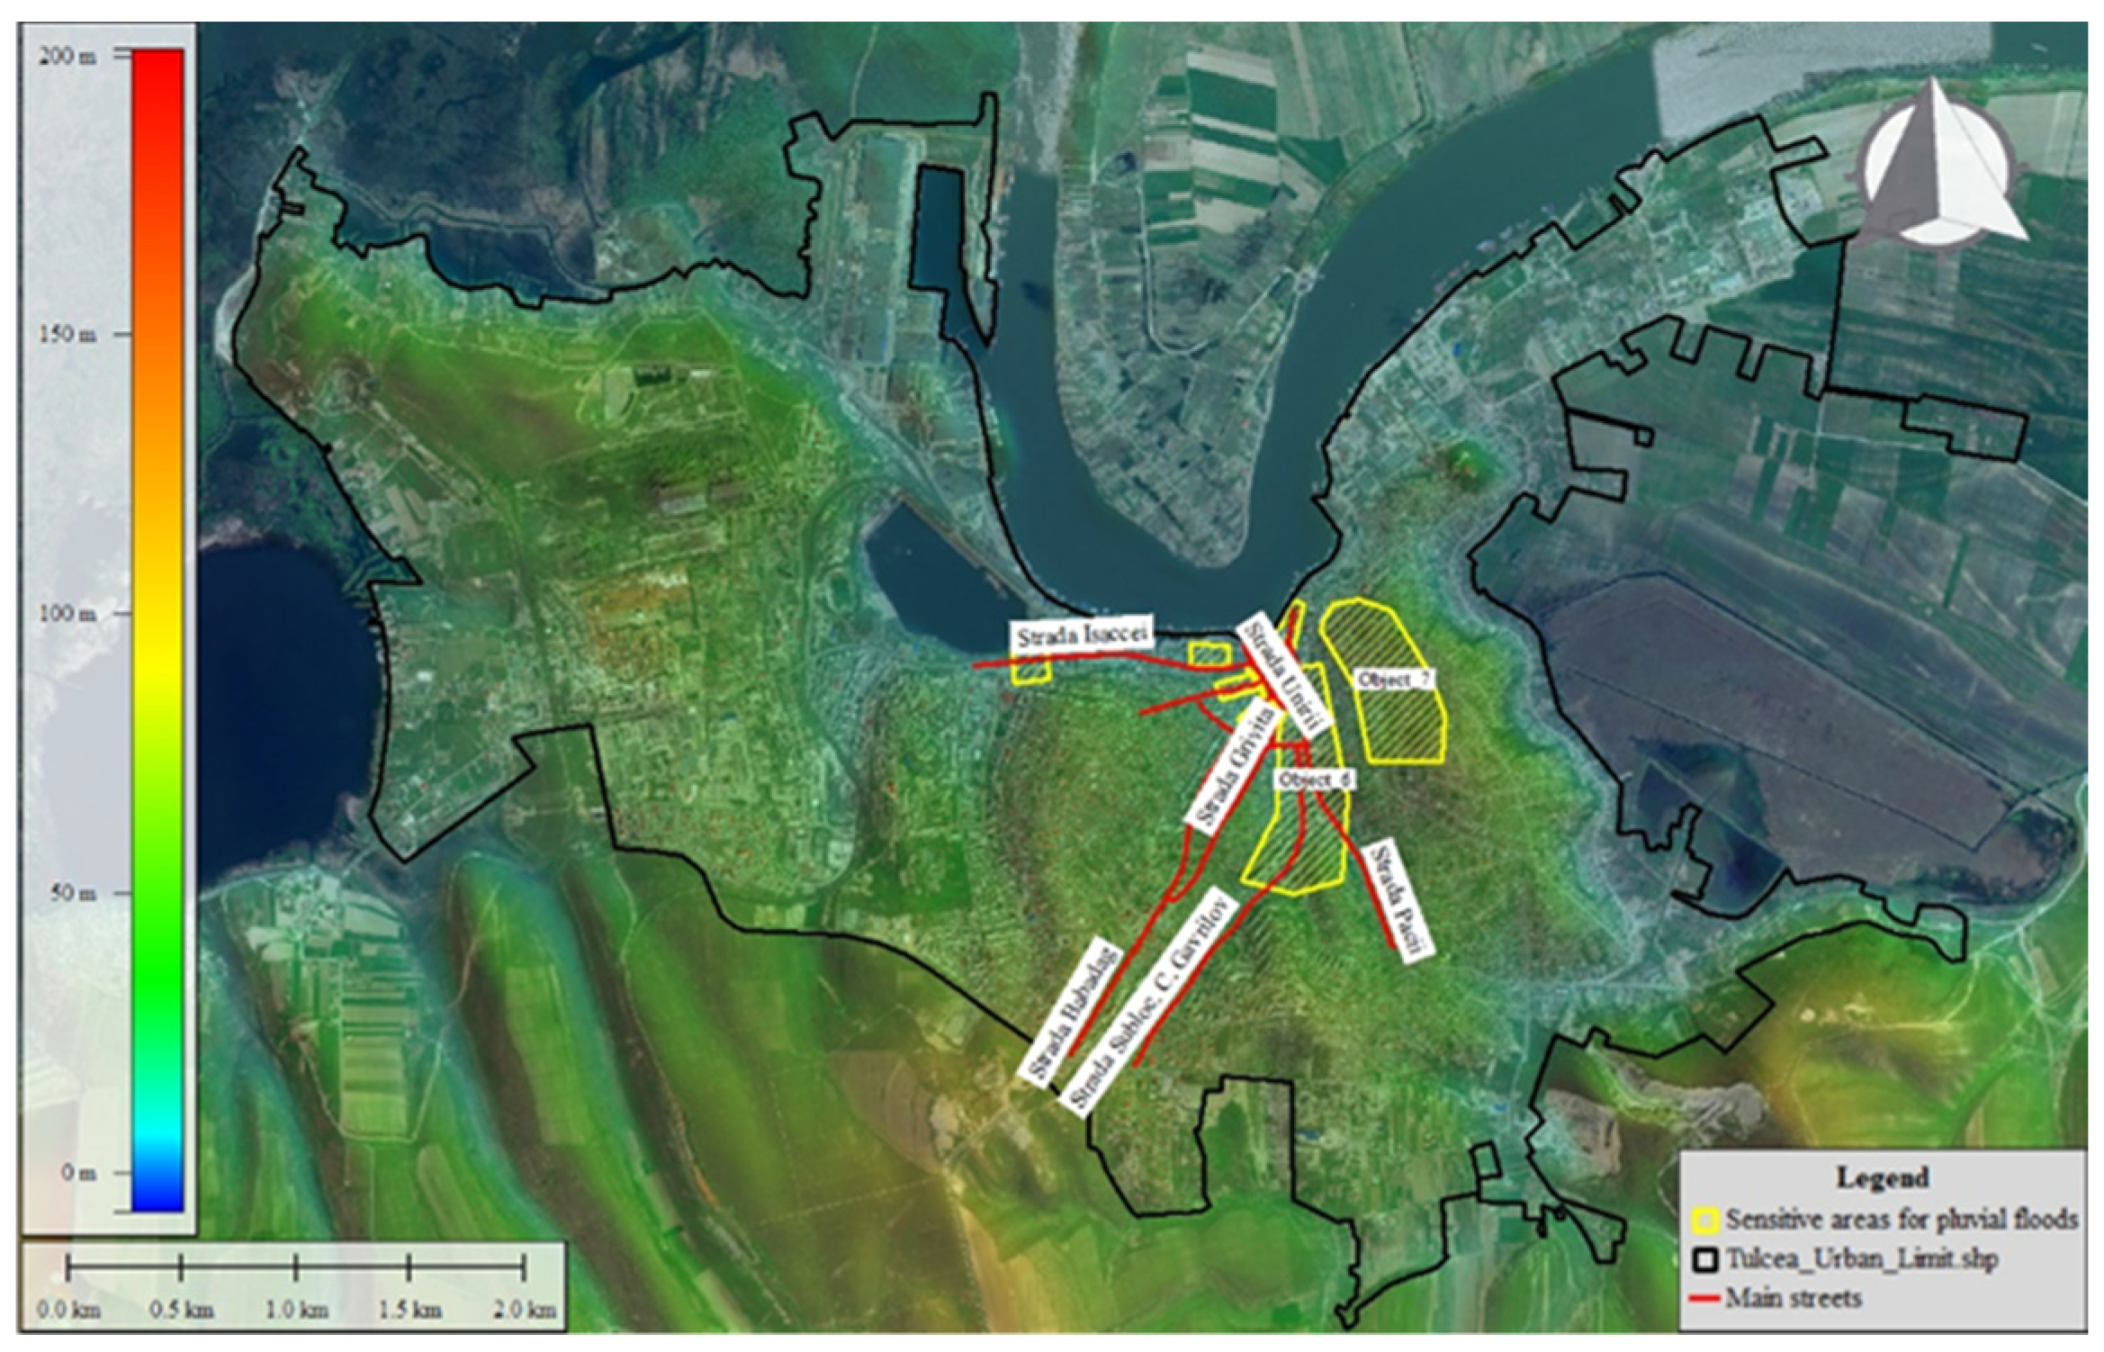
Figure 3). After exceeding the carrying capacity of the sewage network, the surface runoff along the streets (
Figure 3a) accumulated in the low areas of the municipality, mainly in the area of Isaccei street from its intersection with Pacii street (Delta hotel roundabout area) to the intersection with Podgoriilor street (Gara roundabout area), causing serious damages to trade and social activities (
Figure 3b). Exceeding the designed capacity can be caused by the overlapping of several factors, such as excess precipitation, change of slope (transition from a high gradient slope to a low gradient slope), and sudden changes in the direction of the main collectors. Thus, in the N–S direction, the slope of the land is between 6–10%, while in the meadow area, the slope varies in the range 0.5–3%. Because the sewage system generally follows the natural slope of the land, these slopes often generate unsatisfactory operation of the sewage system. The torrential precipitation produced on this rugged relief lead to the erosion of the slopes and solid transport downstream, reducing the active area of the grate inlets and the transport capacity of existing collectors.
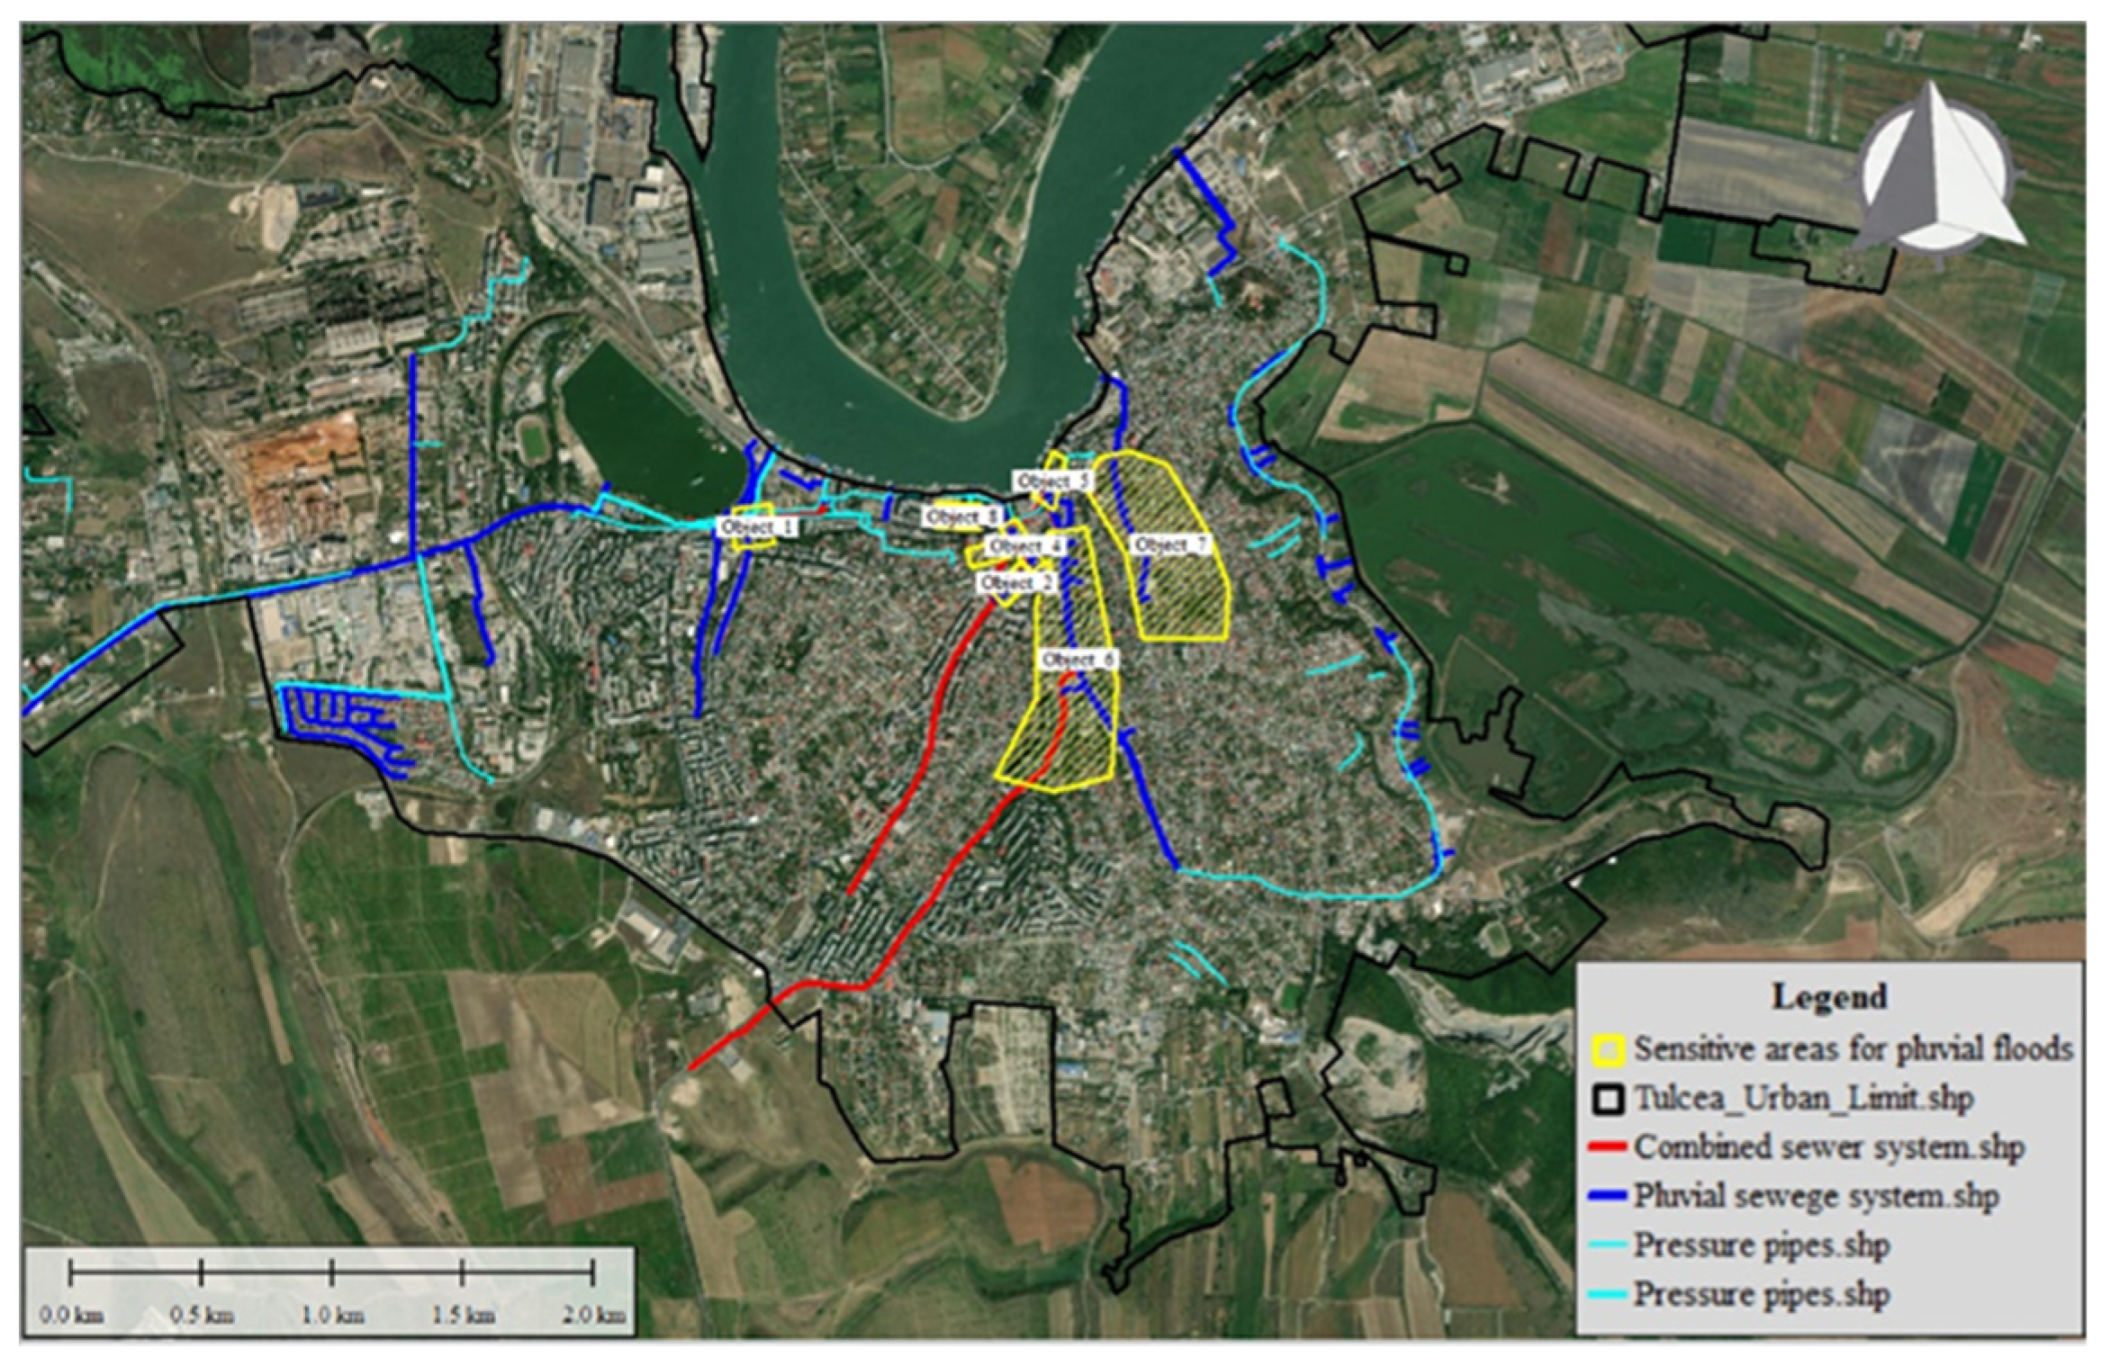
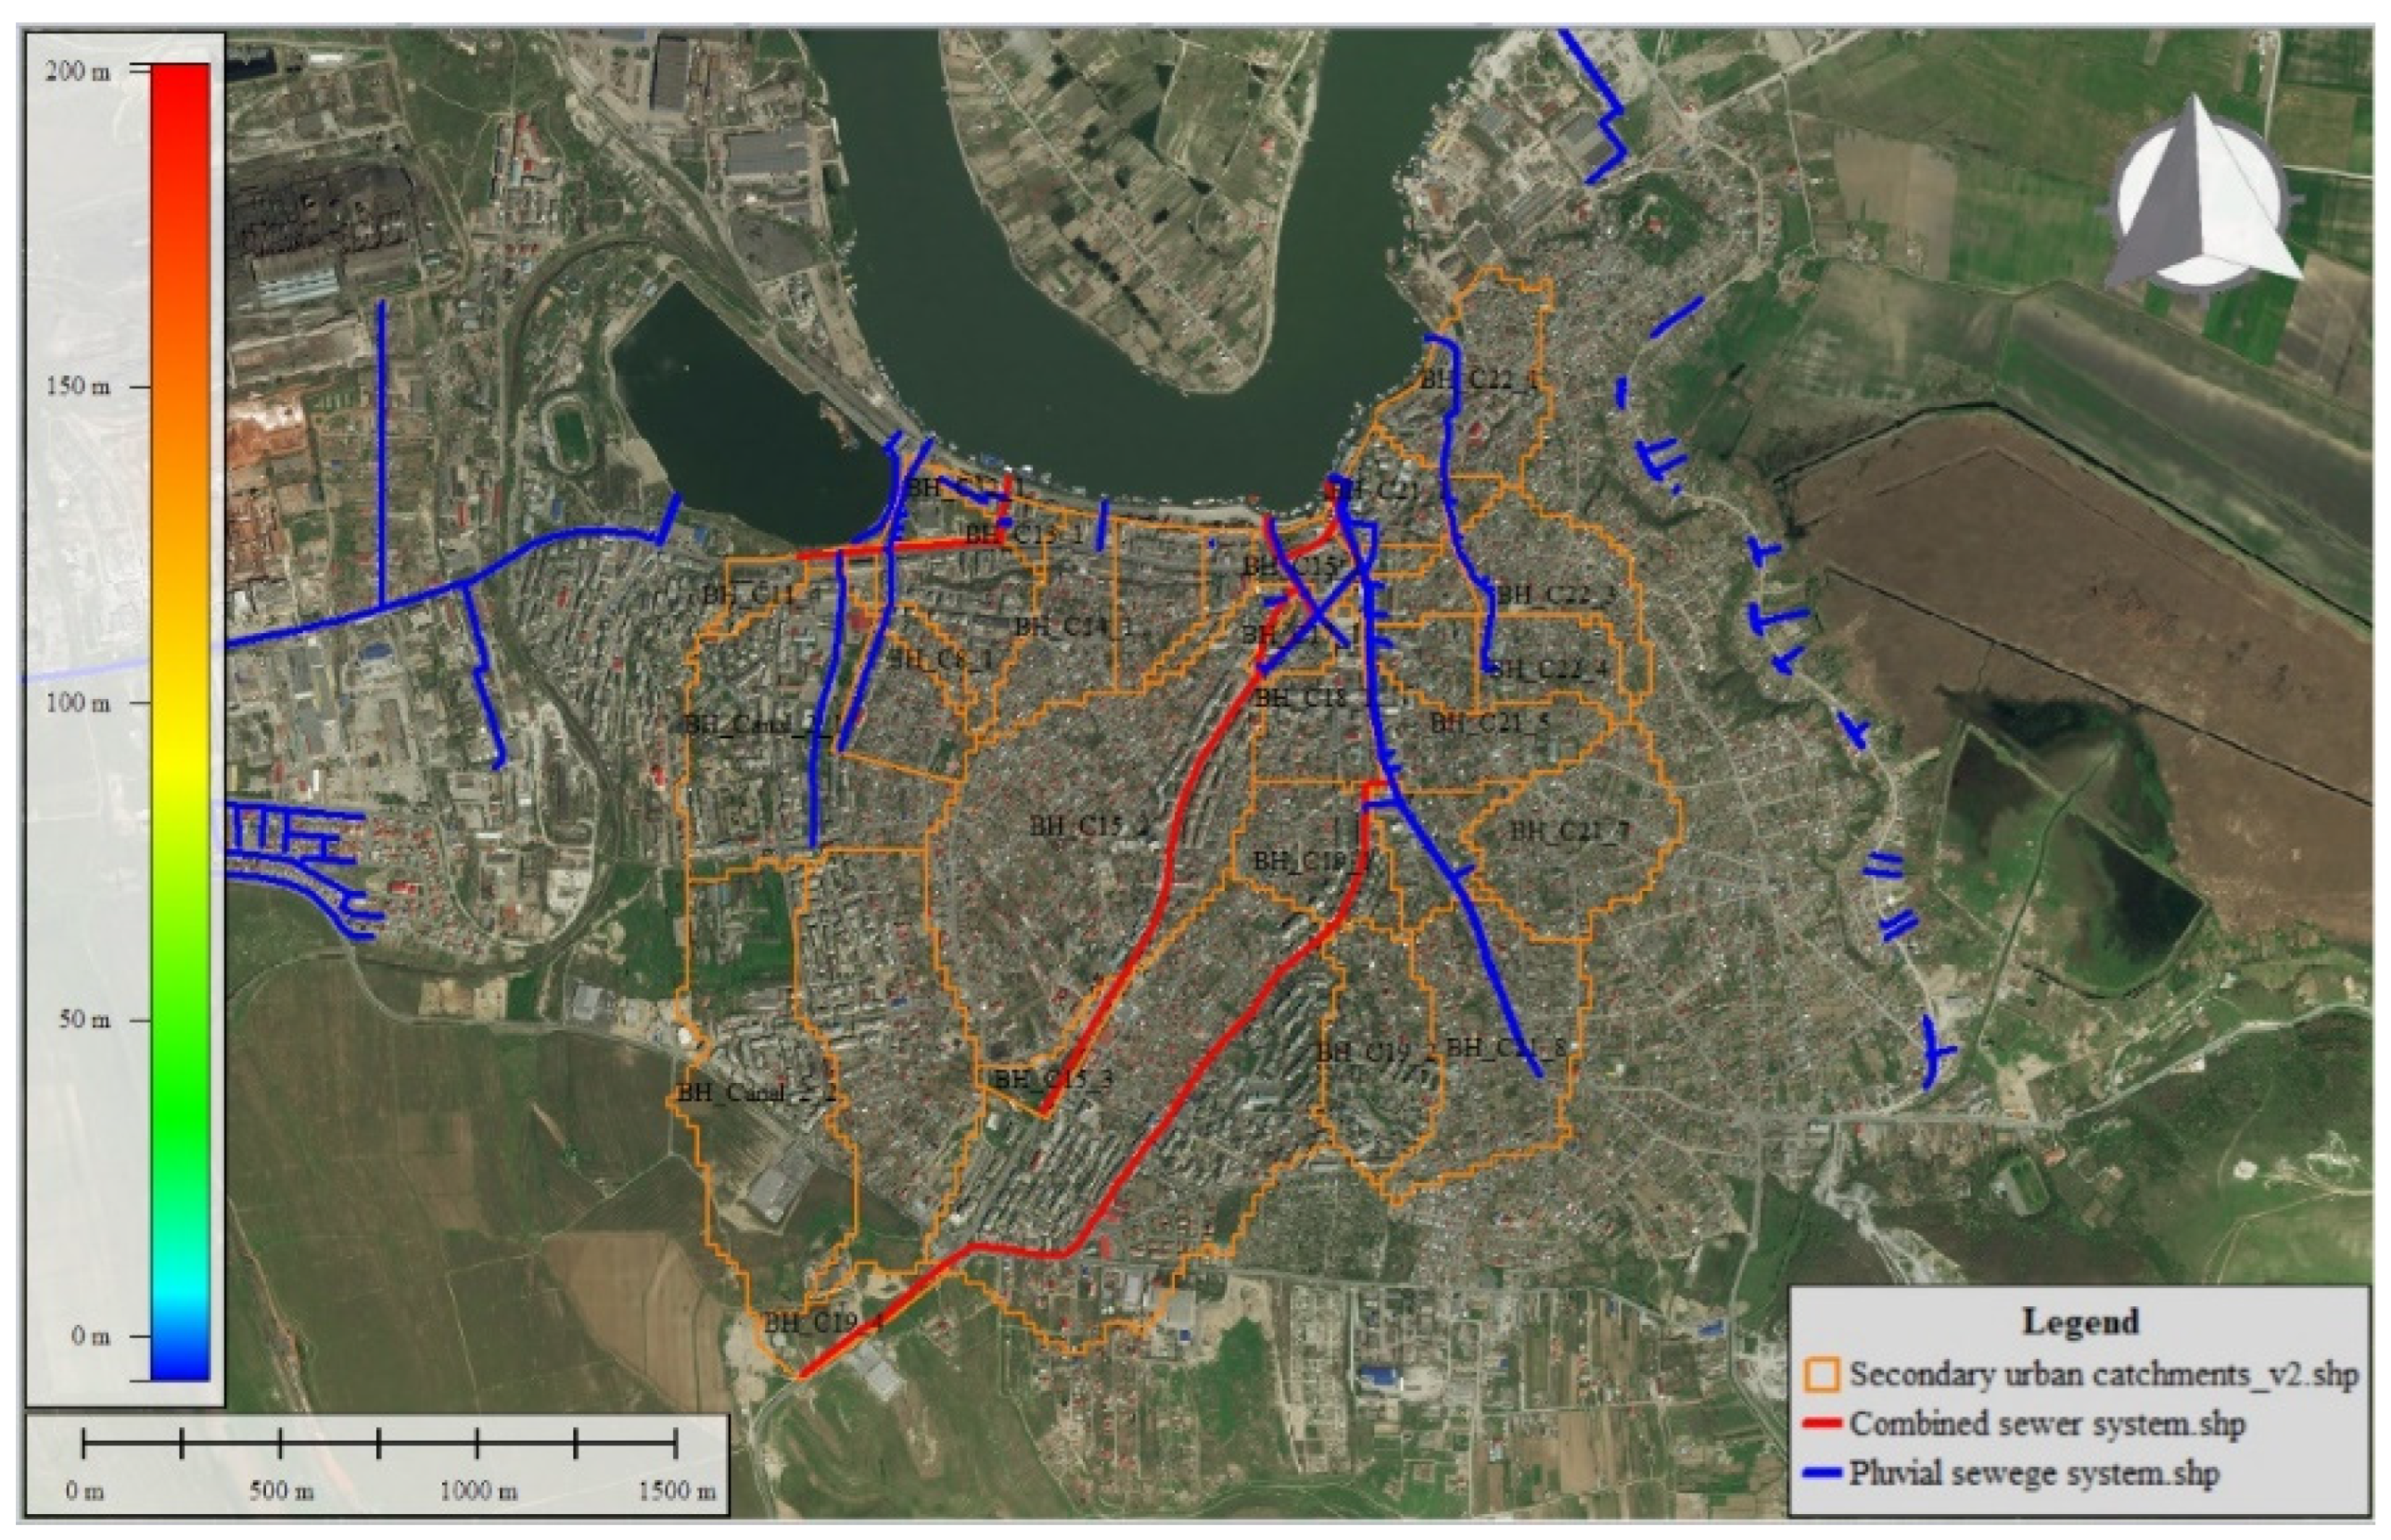
Partially, the existing sewage network is a combined system and separate system, respectively (
Figure 4). Images of the sewage network, in which the sensitive areas are marked with yellow, are presented in
Figure 5 and
Figure 6.
A number of longitudinal profiles along the frequently flooded streets are provided in
Figure 7.
It can be estimated that surface runoff accumulates either in the intersection of Isaccei street with Unirii and Pacii street or in the lower part of Babadag street (Civic Centre area), where the city elevations register the lowest level (around 5 m.a.s.l.). On streets such as Babadag or M. Kogalniceanu, surface runoff can originate from both the eastern slope and the western slope. At the same time, these streets are being flooded with pluvial waters sourced from the southern slope by Lieutenant Gavrilov, Grivitei, and Pacii streets.
3.1. Pluvial Sewage Network
The collection, carrying, and evacuation of pluvial waters are performed by:
A pluvial water network, which totals some 18.2 km, through collectors of diameters 250 and 1900 mm;
A unitary sewerage network, which transports pluvial water and domestic wastewater, has a total length of 6.0 km, and is made of concrete conduits with diameters between 400 and 1200 mm;
Five pluvial pumping stations which outflow water into the Danube.
It should be mentioned that in the periods with low water levels in the Danube, the pluvial pumping stations (except SPAP 5) are shut down, while the transport of water through the discharge collectors is gravitational.
3.2. Analysed Rainfall Events
For calibration and validation purposes, two important rainfall events were used:
The rainfall on 12–13 of September 2013 (
Figure 8), with a total amount of precipitation of 67.8 mm. The estimated frequency of the 2013 event (based on IDF curves for Tulcea meteorological station) was close to 1:10.
The maximum rainfall values were recorded around 7:10 a.m. on 13 September 2013 (at the end of event). Precipitation prior to the maximum affects the initial humidity in the study area, leading to the increase of the runoff coefficient.
The rainfall from 14 June 2016 (
Figure 9) had a total duration of approx. 3.5 h (between 11:00 a.m. and 14:30). The maximum intensity was recorded around 11:50 a.m., at the beginning of the event. The total amount of precipitation (approx. 25.6 mm) was relatively low compared to the situation of 12–13 September 2013, which raises questions about the proper functioning or maintenance of the sewerage system in Tulcea. The estimated frequency of the 2016 event (based on the same IDF curves) was close to 1:2.
3.3. Conceptual Model
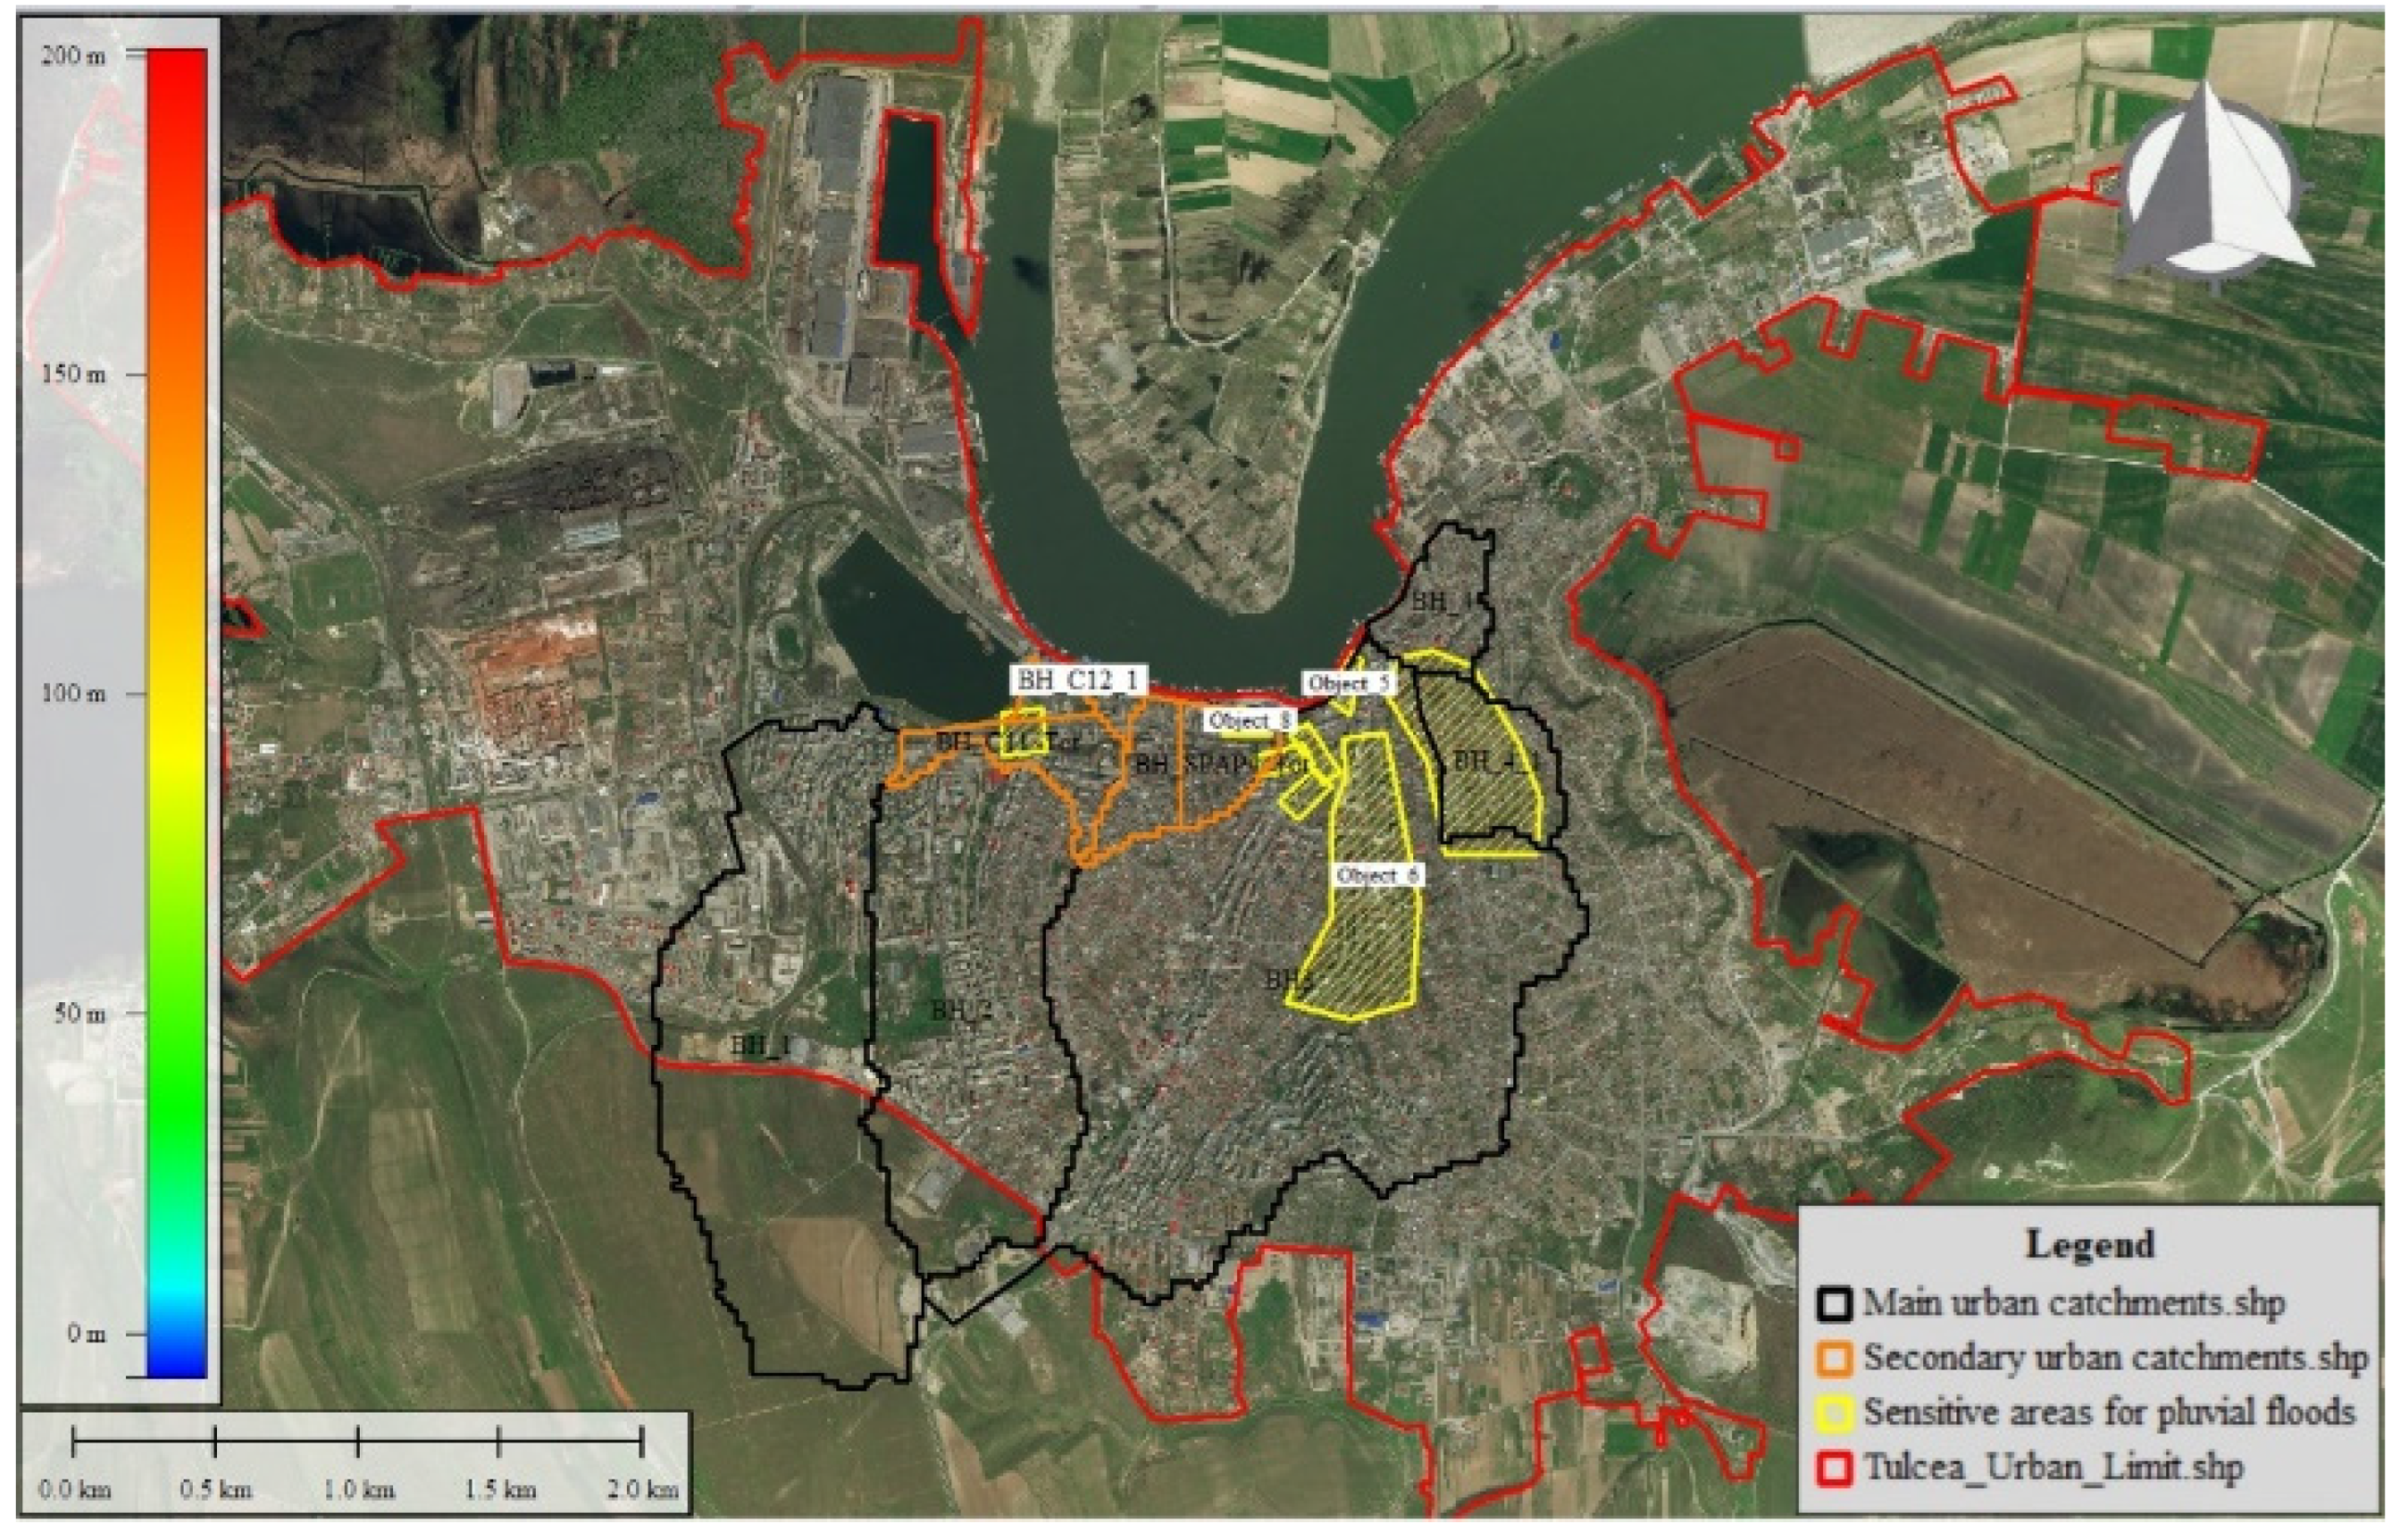
As a first step, the urban catchments for the Tulcea municipality were generated, identifying four main basins and six secondary basins (
Figure 10). The area of the main basins is 5.56 km
2, while the area of the secondary basins is 0.45 km
2. The most extended basin is BH3, having an area of 2.76 km
2. This basin contains most of the frequently flooded areas (most sensitive areas). The BH3 basin, due to its area, has the largest contribution to the generation of the volumes accumulated in the low area of the Tulcea municipality.
The next step was to divide the main basins into sub-basins, having as support the sewage network layers exported from the .dwg files. The division was performed with GIS tools, imposing the condition that the sub-basins should not be larger than 1000 cells (0.65 km
2). The division into sub-basins led to a realistic assessment of the flow direction imposed by the city’s topography and the location of the main collectors (
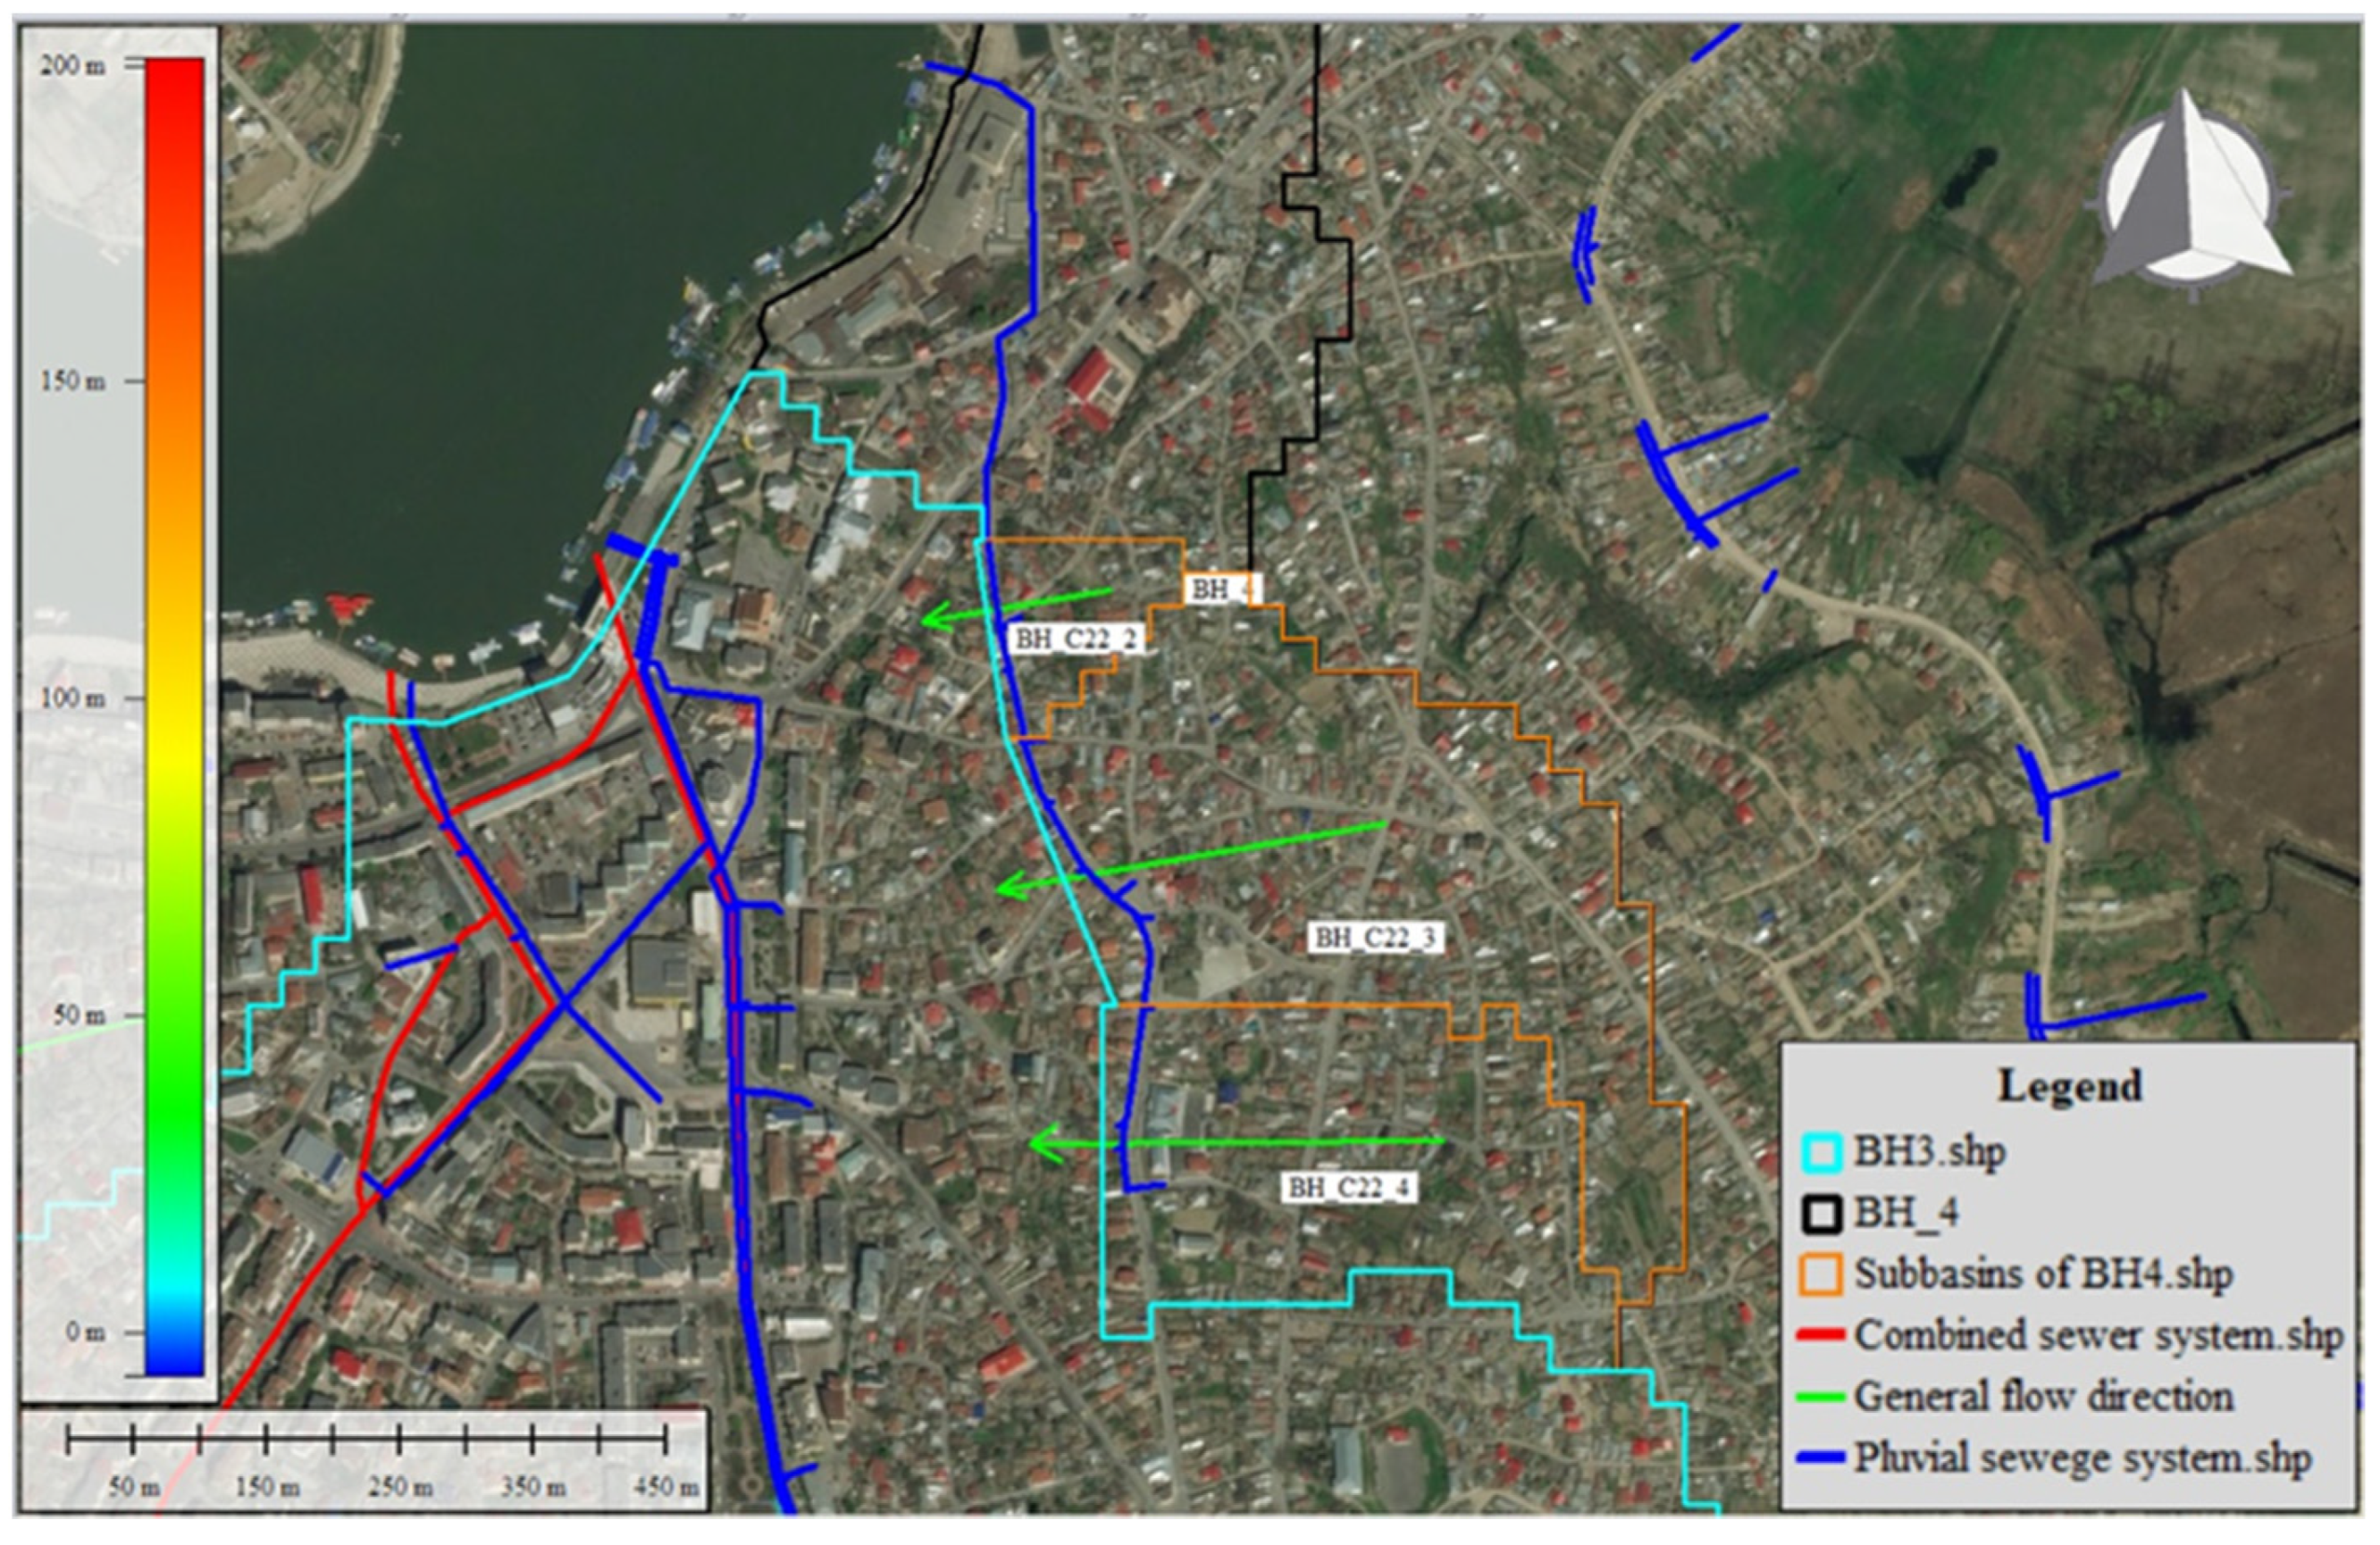
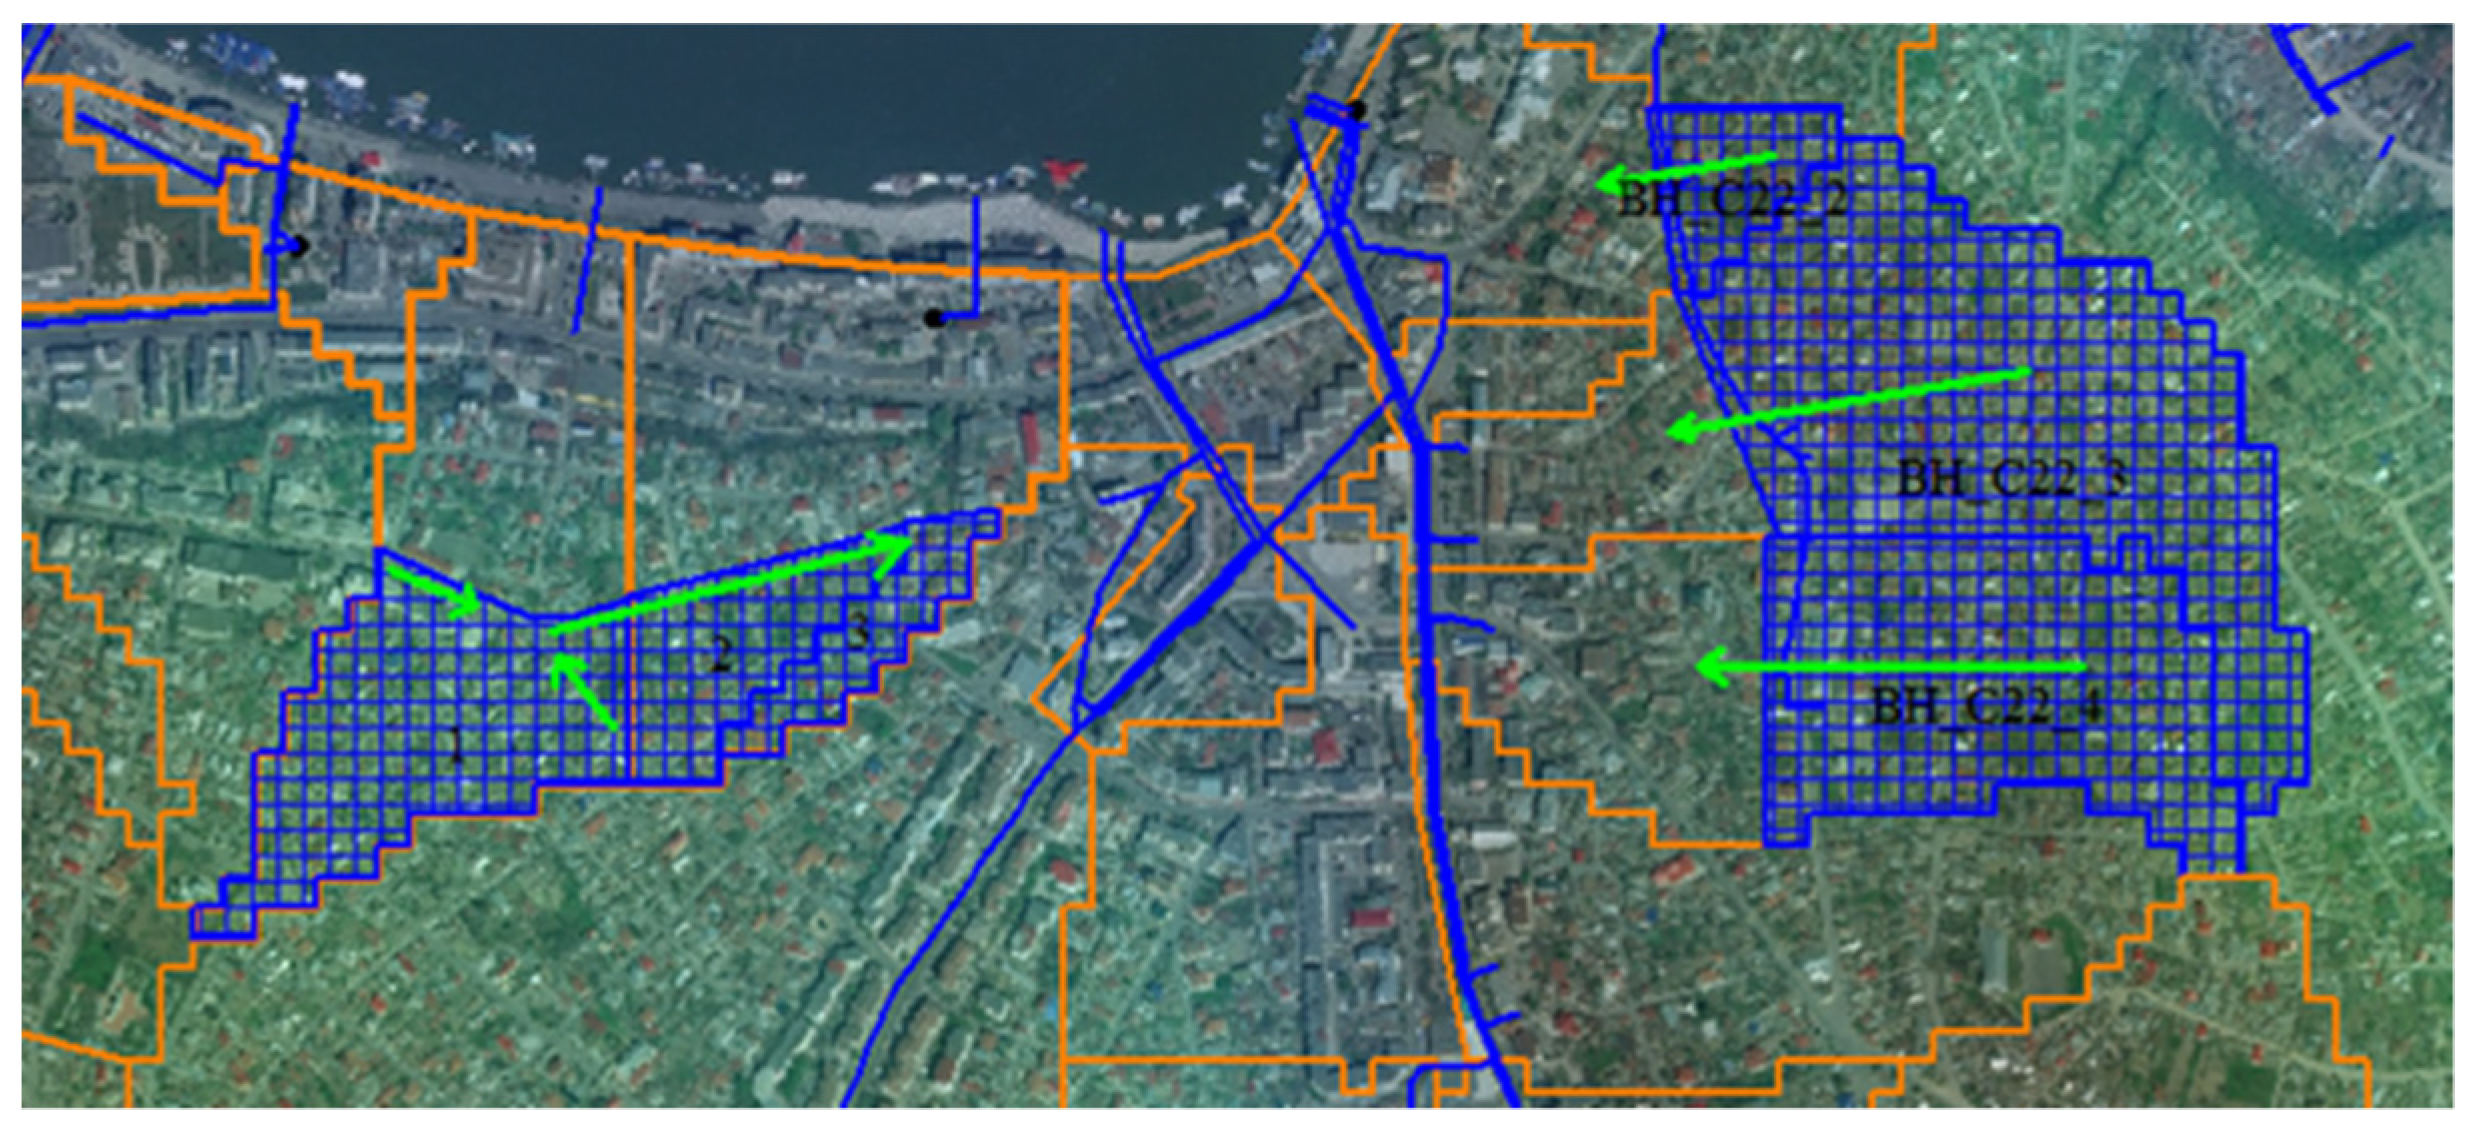
Figure 11).
A detailed topographic analysis of the urban surface highlighted the natural direction of flow on the slope, represented by green arrows (
Figure 12). If the carrying capacity of the collector corresponding to BH4 is exceeded, the overflow remaining on the ground surface will be directed to the sub-basins in BH3.
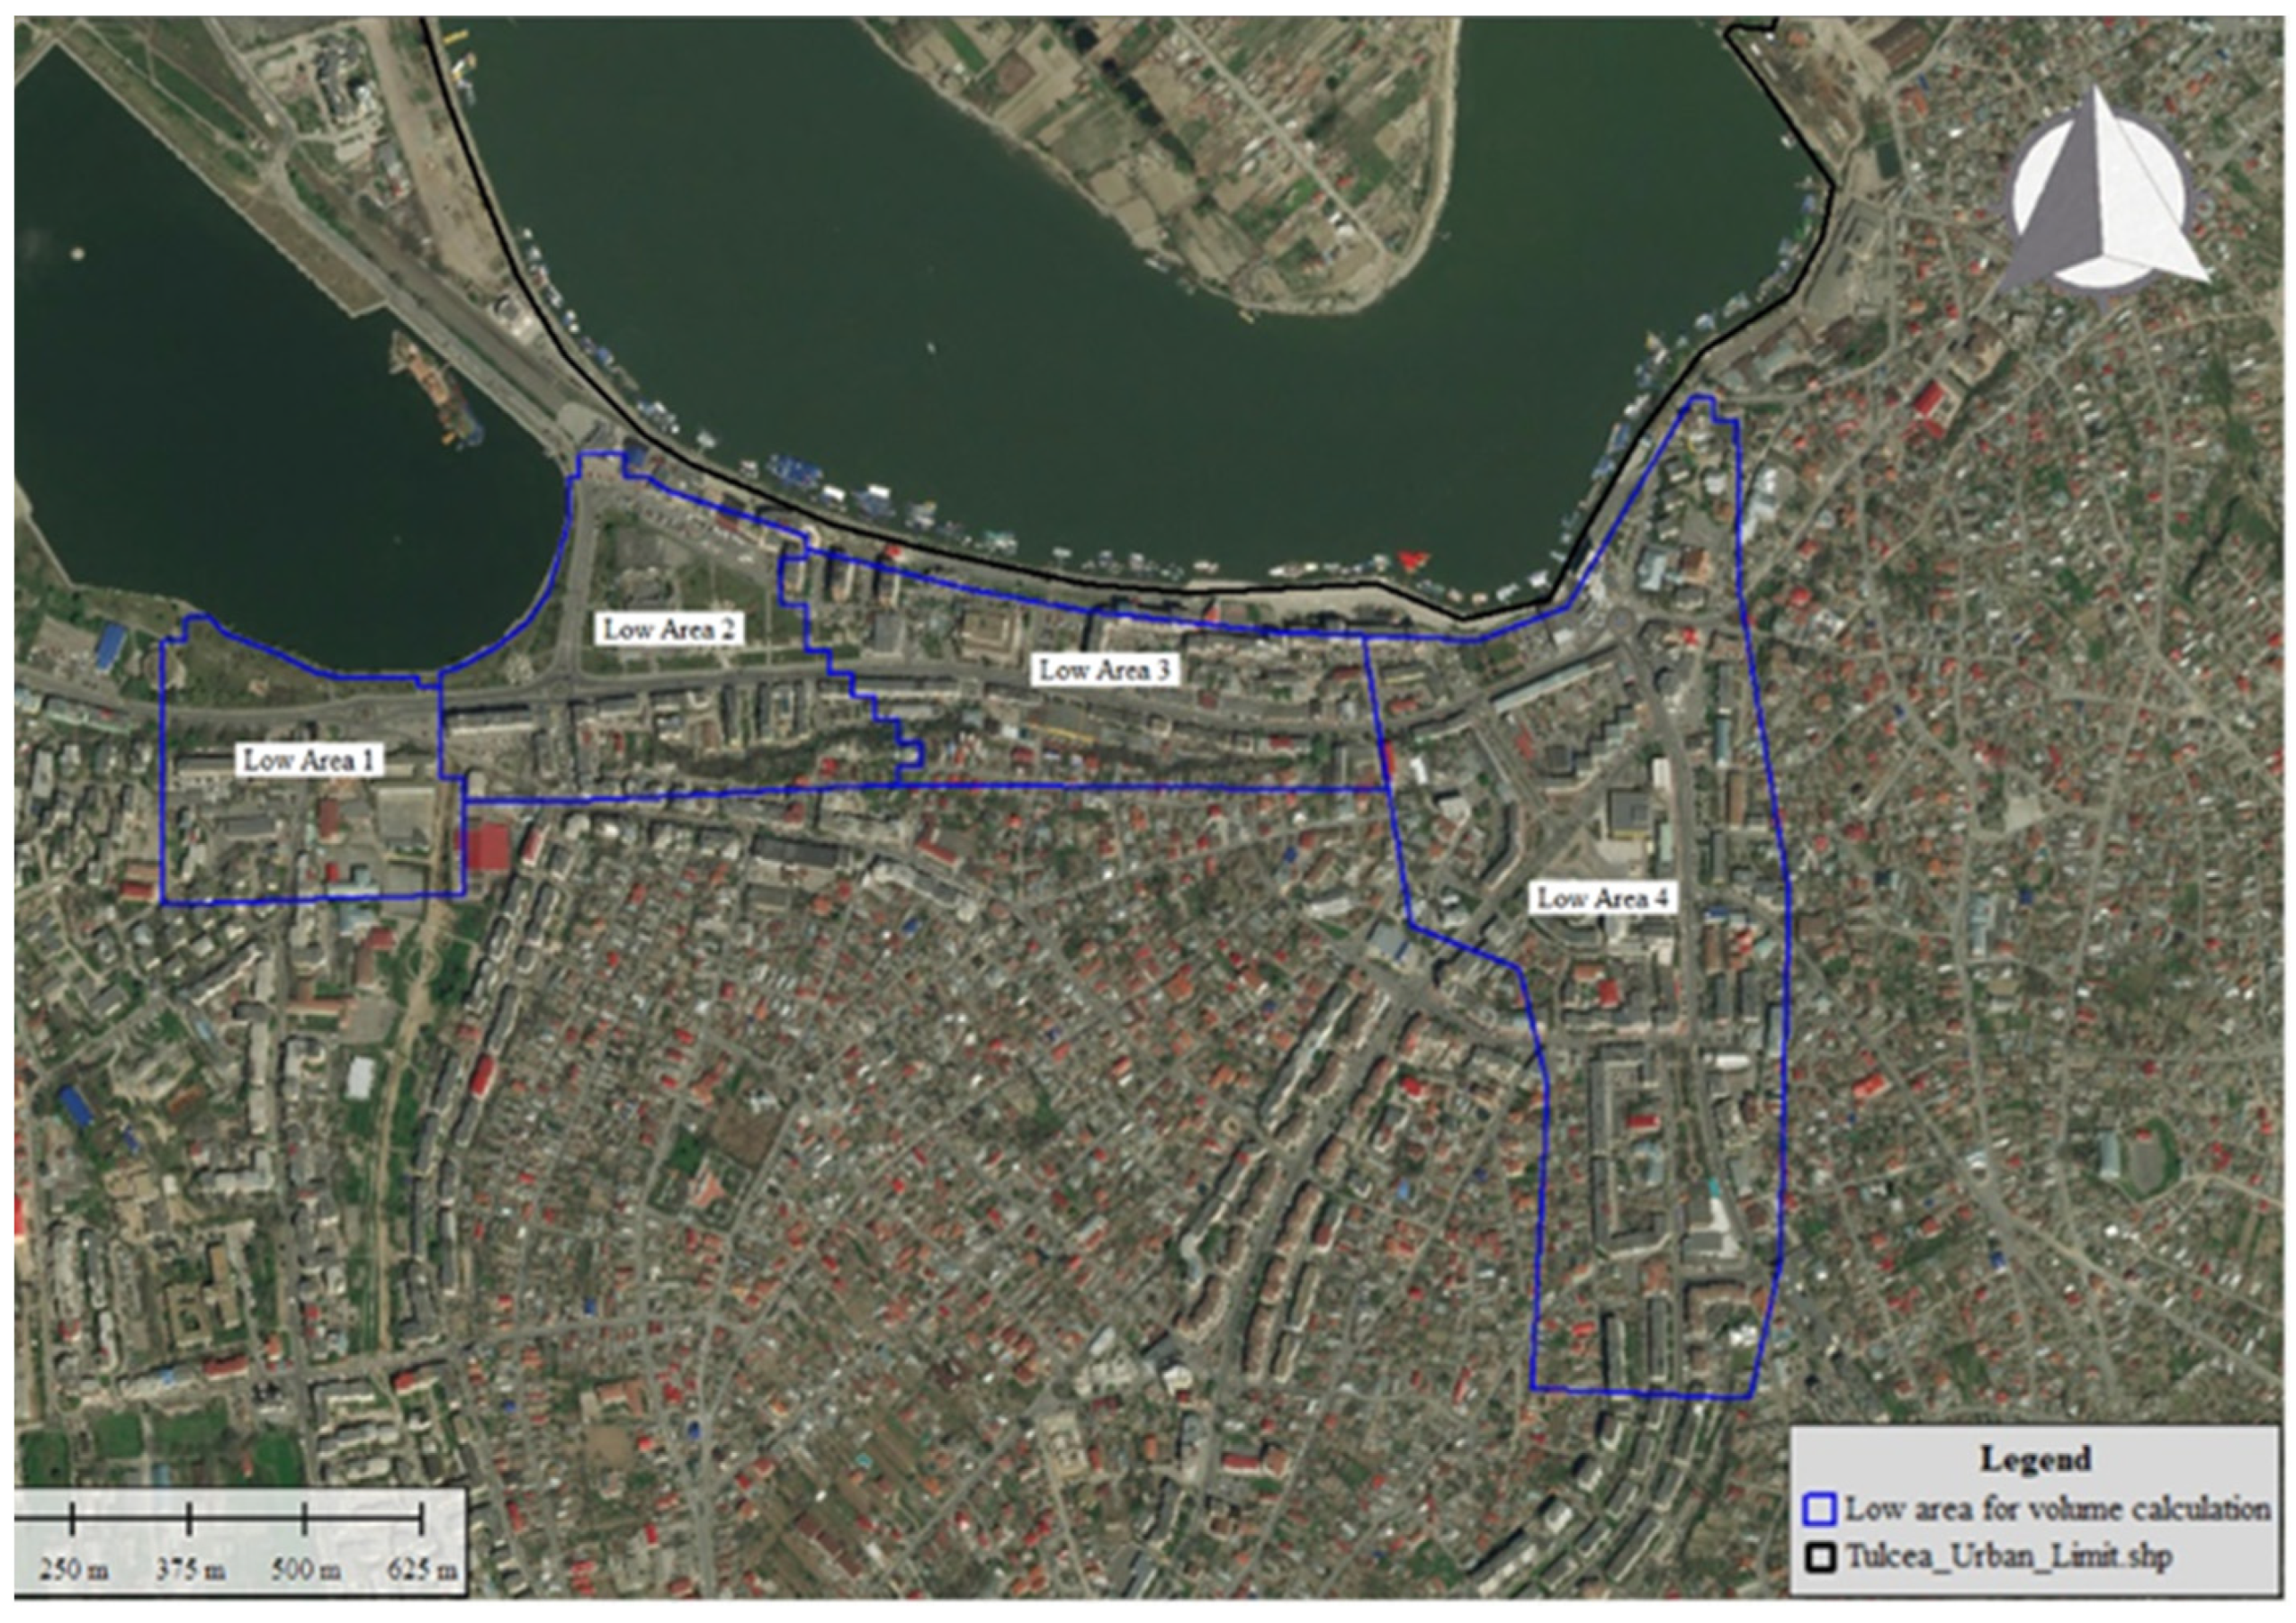
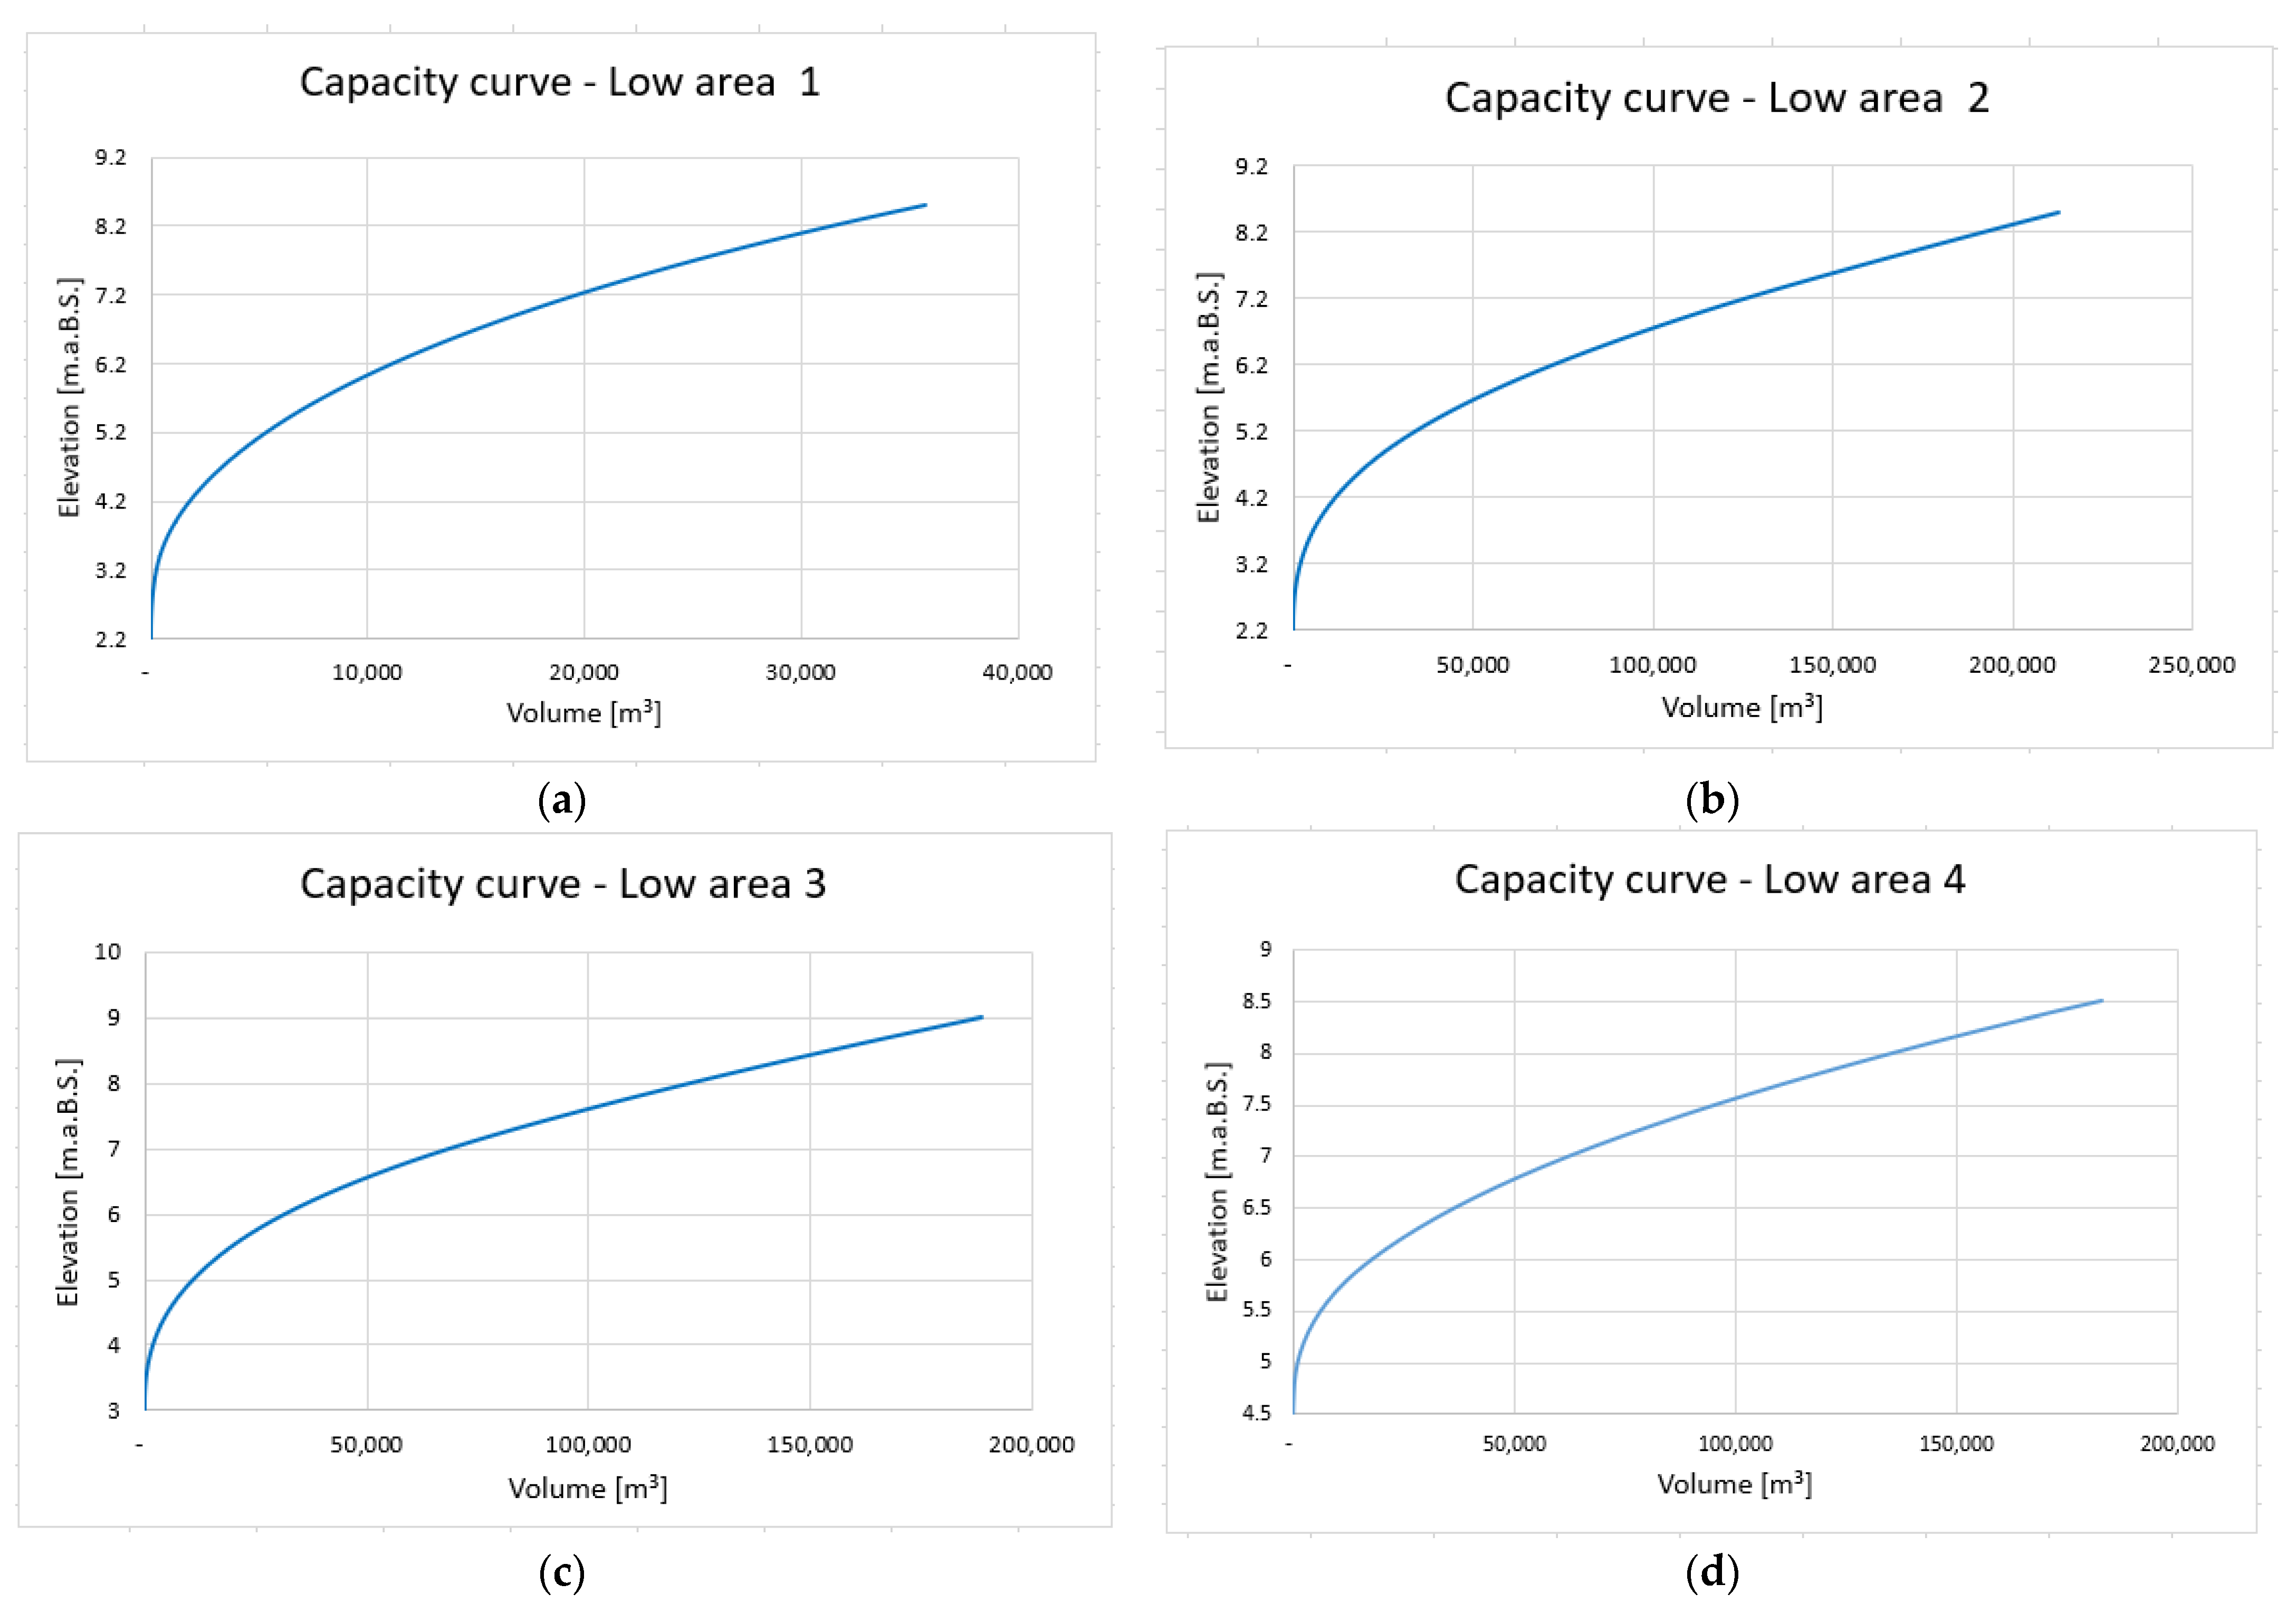
In order to evaluate the volumes generated by overflow and accumulated on the land surface, four capacity curves (elevation–volume relations of the depression areas) were determined corresponding to the location of the low areas in the Danube meadow. The locations of the four flood cells are shown in
Figure 13.
In general, the locations of the four flood areas (cells) are along Isaccea Street. The surface for Zone 4 is slightly larger, since it includes the depressions identified in the civic centre area. The capacity curves calculated based on DTM are presented in
Figure 14.
3.4. Mathematical Model
To set up the hydrological models for the Tulcea municipality, most of the data processing activities were performed using GIS tools based on a digital terrain model, ortho-photos, the administrative boundary of the Tulcea municipality, delineation of the urban catchments, pictures of the frequently flooded areas, and the sewage network in the .dwg format files. All the above elements used the Stereo 70 projection. Inside the urban limits, the majority of land cover is classified as a discontinuous urban area, followed by industrial units and parks or recreational areas (
Figure 15). Outside the urban limits, the land cover is mainly classified as orchards and wet areas. Based on this information, the values for the CN parameter were defined in the range 75–89, depending on the location of the urban catchment.
Usually, any hydrological model must be calibrated and validated using a set of recorded events at the urban catchments level. For a correct calibration besides the recorded precipitation, which represents the upstream boundary condition, registered flows at each collector output and/or at the pumping stations are necessary as the modelled downstream boundary condition. Because the multiple outputs from the system were not recorded, the calibration and validation were performed indirectly, using the storage–elevation curves and the extension of the flooded areas according to the various photos taken during the flood events. Of course, the water level in each case was approximated with variable accuracy depending on the available information. Thus, the calibration and validation are likely affected by incorporated uncertainties not yet quantified.
As previously mentioned, for the calibration of the parameters, the event between 12 September 2013 10:00 and 13 September 2013 8:20 was analysed. The total duration of the rainfall was approx. 22.3 h and the amount of precipitation was 67.8 mm. When the discharge capacity of the sewage system is exceeded, excess water flows or accumulates at the ground surface. The maximum water level in the depression areas was approximated based on photos and then the corresponding accumulated volume was estimated. The calibration was considered good when the computed volume was close to the estimated volume of the depression areas.
The validation was performed for the 14 June 2016 event, which had a 25.6 mm rain depth, but which also flooded the centre of the municipality.
It should be mentioned that a hydrological model does not answer the real problem of water movement at the ground surface; it only evaluates the amount of water generated by each basin or sub-basin. For an accurate simulation, a 2D hydrodynamic model coupled with a 1D model for the sewage system should be adopted [
33]. At the same time, a digital terrain model with a floodplain topography at 1-m or finer resolution and high horizontal and vertical accuracy is needed.
The simulations, both for the recorded events and for the design rainfall, were performed in two hypotheses:
Hypothesis 1 (H1). The sewage system is 100% non-operational (or the streets do not have a sewage system).
Hypothesis 2 (H2). The sewage system collects the overland flow up to the limit of its designed capacity.
The simulations considering the design storm were based on the information contained in the Intensity–Duration–Frequency (IDF) curves. The IDF curves are derived through a frequency analysis of the rainfall measurements. Each year, the maximum precipitation of duration D is selected. Hence, resulting statistical series have a number of values equal to the number of years. The duration D is valued in the range 5–1440 min, with a time step of 5 min for the first 2 h and greater time steps moving forward. Each statistical series is usually analysed with the Gumbel distribution, joining the points corresponding to the same frequency results in the IDF curves. The IDF curves provided by the Tulcea meteorological station were used for the case study.
The rainfall duration (40 min) was considered to be equal to the concentration time of the catchment, and was obtained from the basin characteristics of slope and hydraulic length. Concerning the design storm structure, multiple methods have been developed over recent decades; consequently, selecting a suitable design storm can be seen as subjective. There are two main categories of methods for deriving the design storm [
34,
35], namely frequency-based methods (derived from IDF curves) and mass curve methods (based on observed rainfalls). The most popular frequency-based methods are the Chicago design storm or Alternating Block Method (ABM). Among the mass curve methods, the most common are the SCS design storm, Huff’s curves, and the Pilgrim and Cordery method. Although the frequency-based methods are widely used in hydrological modelling or for stormwater drainage system design, they do not represent the registered temporal patterns for a specific area. Hence, in the current paper, the design storm was based on the structure of the observed 2013 storm event in order to have a better temporal representation of the region.
For this purpose, the recorded values of the 2013 event were scaled both on the abscissa and on the ordinate, while keeping the total amount of precipitation derived from the IDF curves unchanged, for the previously computed concentration time of the urban basin.
In the present study, simulations for design rainfalls corresponding to the frequencies 1:2; 1:5; 1:10, and 1:100 were run.
4. Results
The simulations were performed at the level of each sub-basin, and the results are presented both at the local level (meaning sub-basins) and globally at the level of the four main urban basins (BH1, …, BH4). In the following, only the results obtained for BH3, which has the largest area (2.76 km
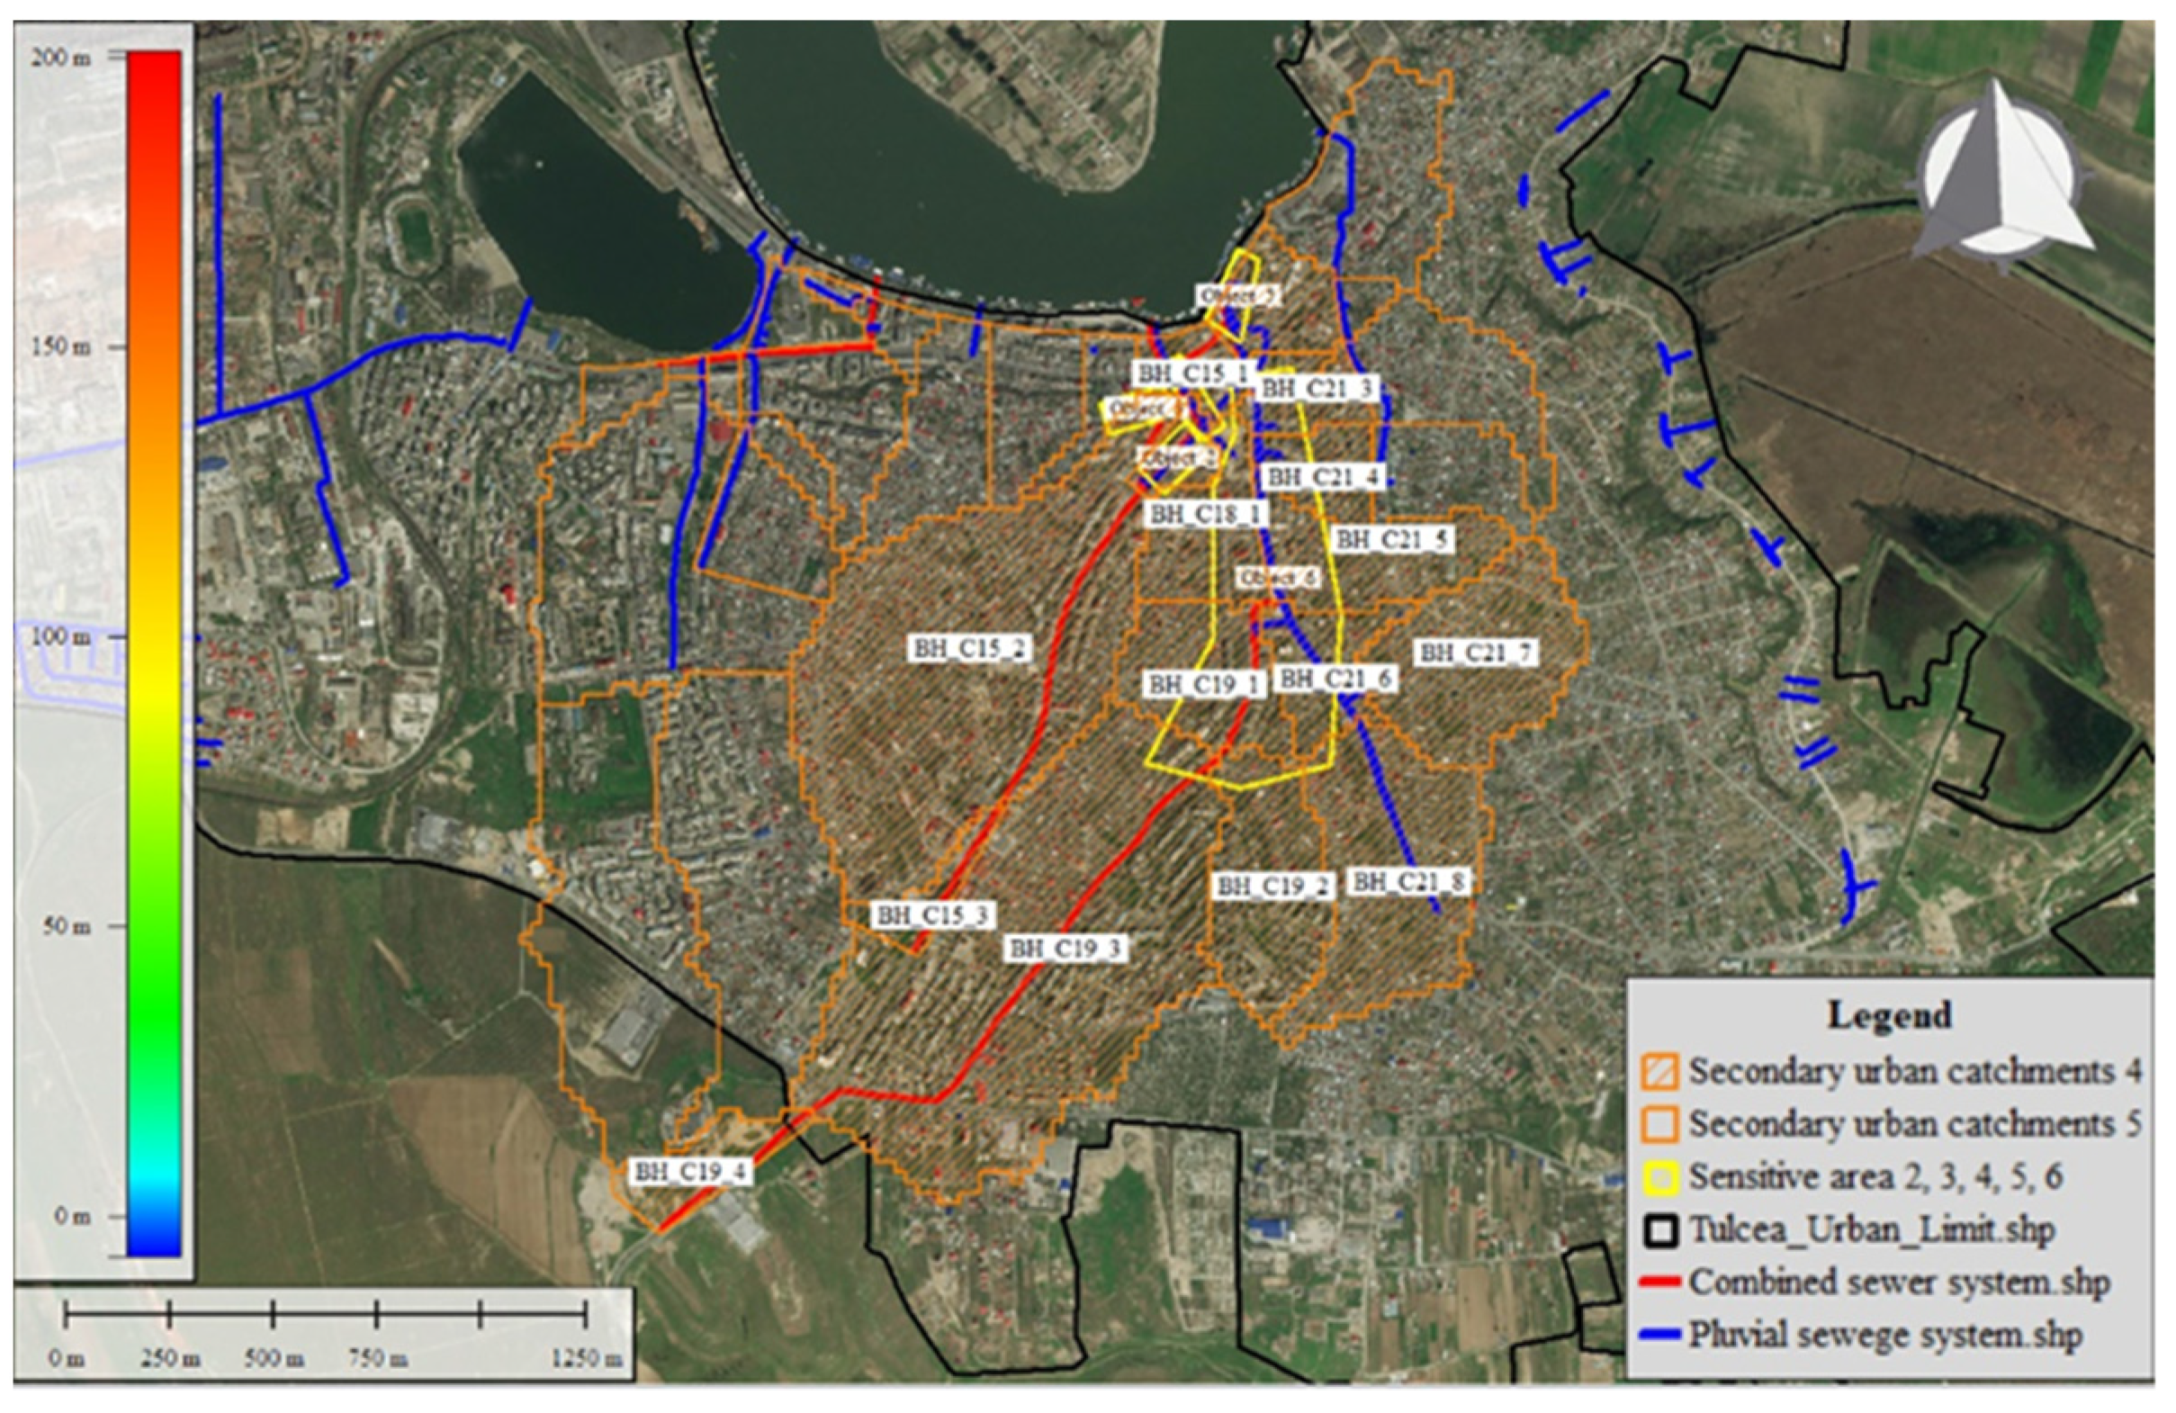
2), are provided. In this urban basin, there is an important number of areas flooded by torrential rainfall, namely the Objects 2, 3, 4, 5, and 6 (Babadag, Victoriei, Unirii, Păcii streets and Parcul Carol). The urban basin BH3 contains a large number of sub-basins, marked by hatches in
Figure 16.
It should be mentioned that in addition to the hatched surfaces from the previous figure, due to the street plot, water originating from some neighbouring basins is accumulated in the area of the five objects.
The surfaces that generate an additional flow are shown in
Figure 17.
The water fluxes from the left side of the image are directed towards Object 3 (Victoriei street). The flows from the right side are directed towards Pacii Street (Object 6), and from here accumulate in the Delta hotel roundabout and in the Carol Park areas.
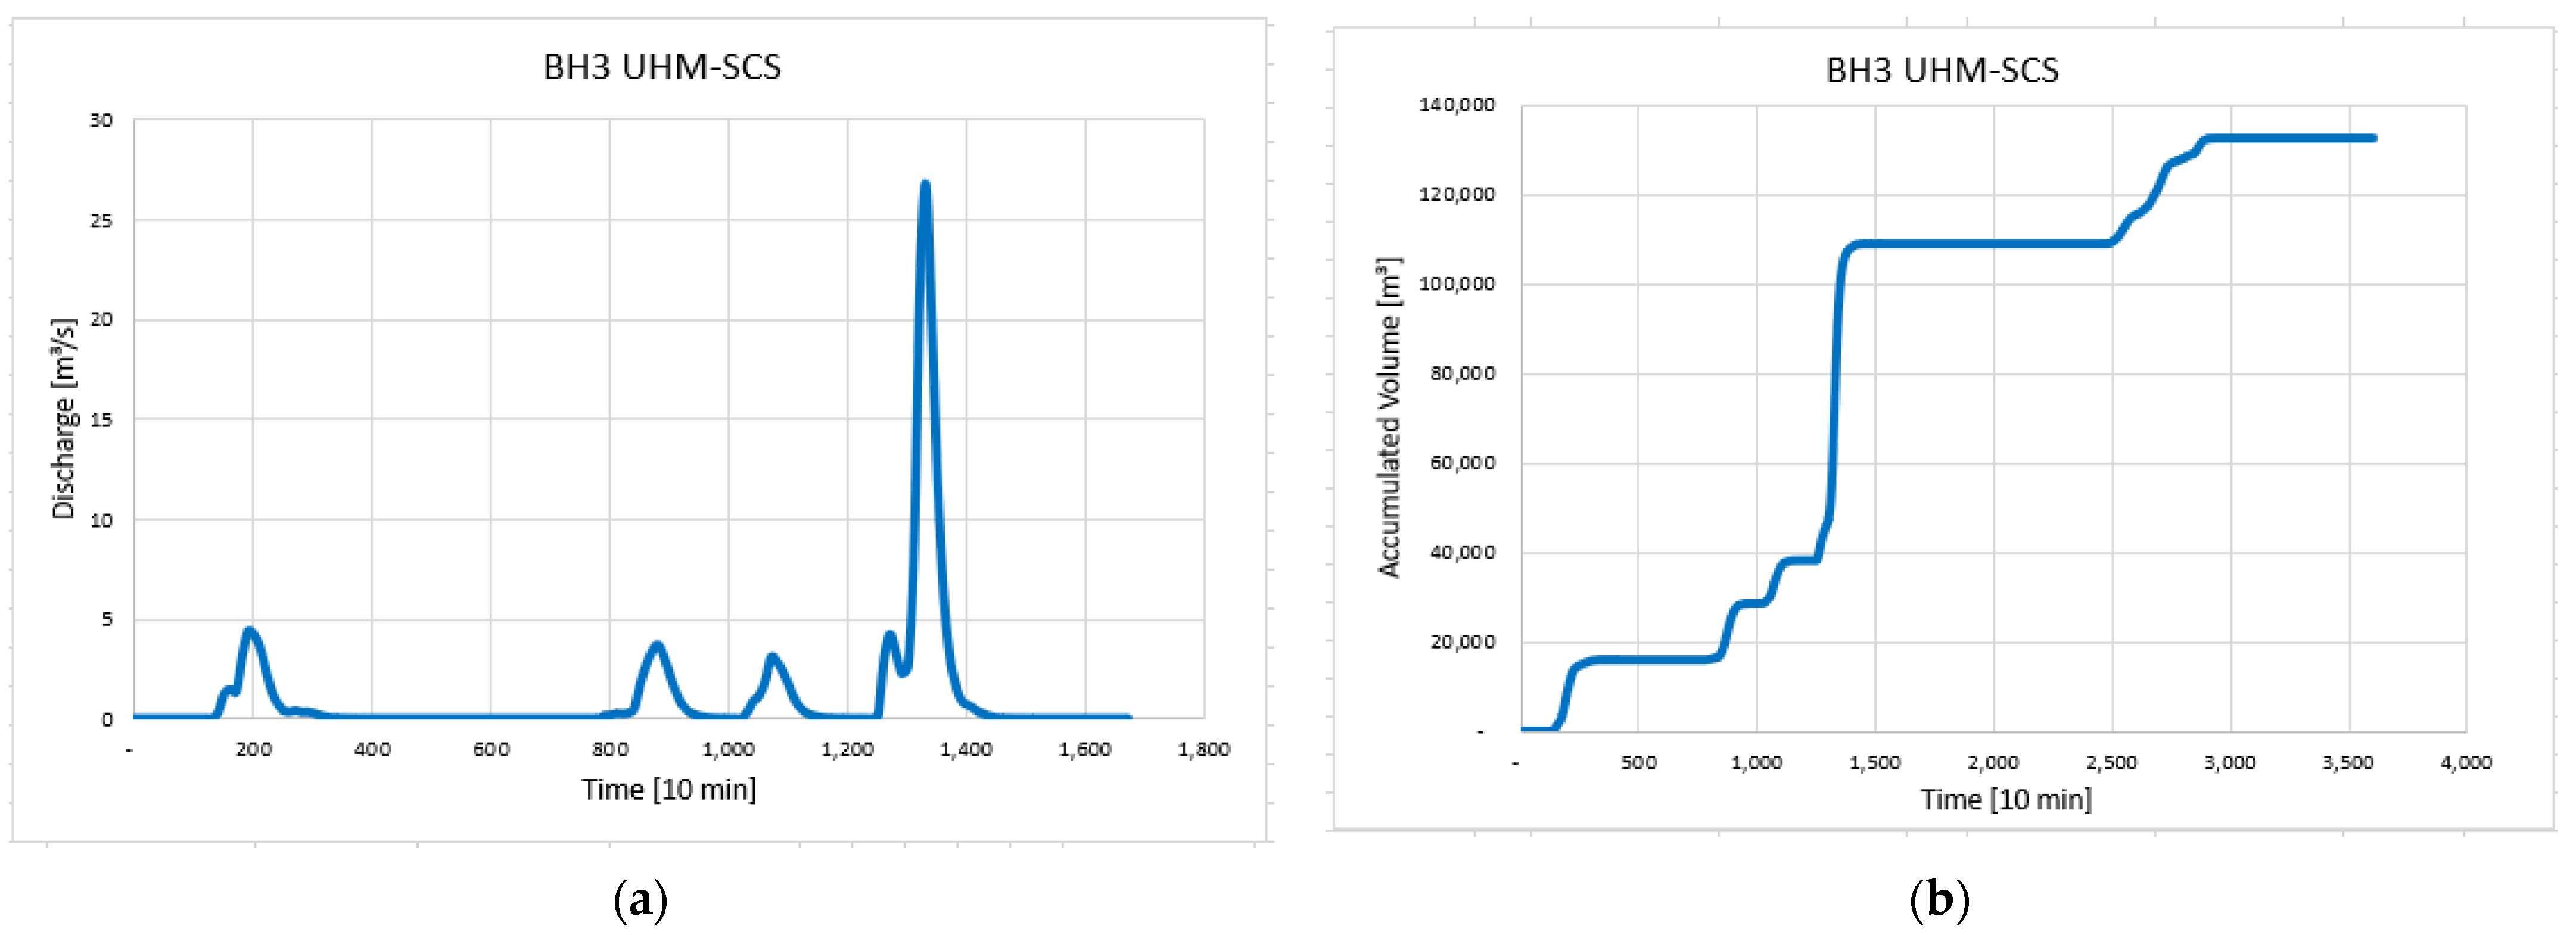
The calibration was made considering the 12–13 September 2013 rainfall event. The flood hydrograph in Hypothesis 1 (the sewage system is 100% non-functional) at the most downstream section (
Figure 18) represents the contribution of all upstream sub-basins, including flood composition and propagation. The maximum discharge simulated for the 2013 event in Hypothesis 1 is 26.8 m
3/s, while the accumulated volume in depression areas is 132,400 m
3.
In Hypothesis 2 (designed capacity of the corresponding sewage branch is 6.47 m3/s), the maximum discharge simulated for the 2013 event was 20.3 m3/s, while the accumulated volume in depression areas was 33,660 m3.
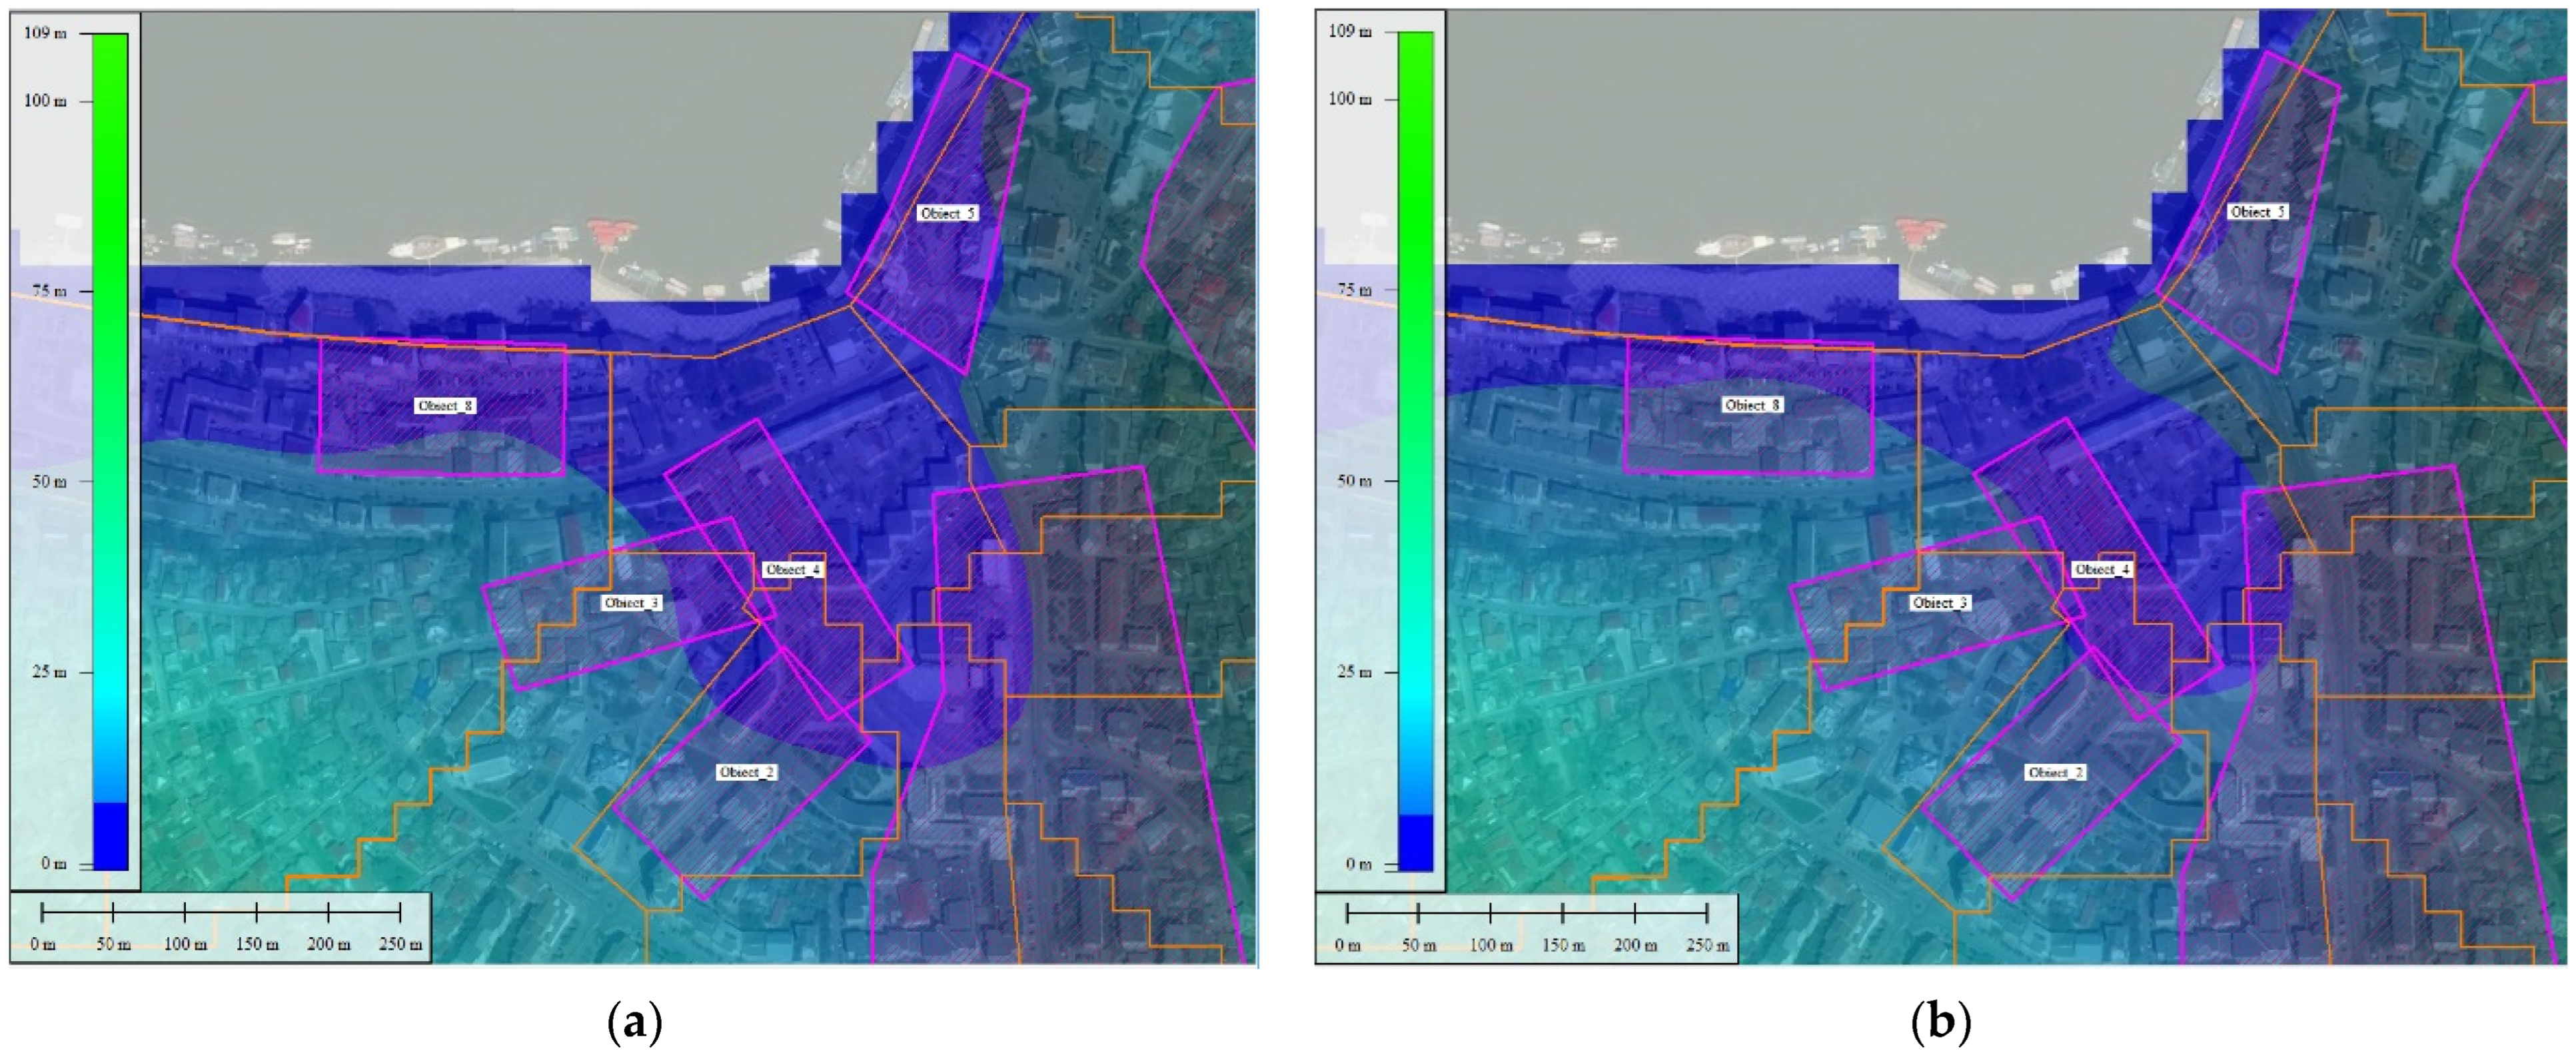
The modelled extension of the flooded areas for the 12–13 September 2013 event (for the two hypotheses, with regard to the functionality of the sewage system) is presented in
Figure 19. The actual extension of the flooded area at the 2013 event is closer to the situation modelled in Hypothesis 1, which shows that the sewage system did not work at its designed capacity.
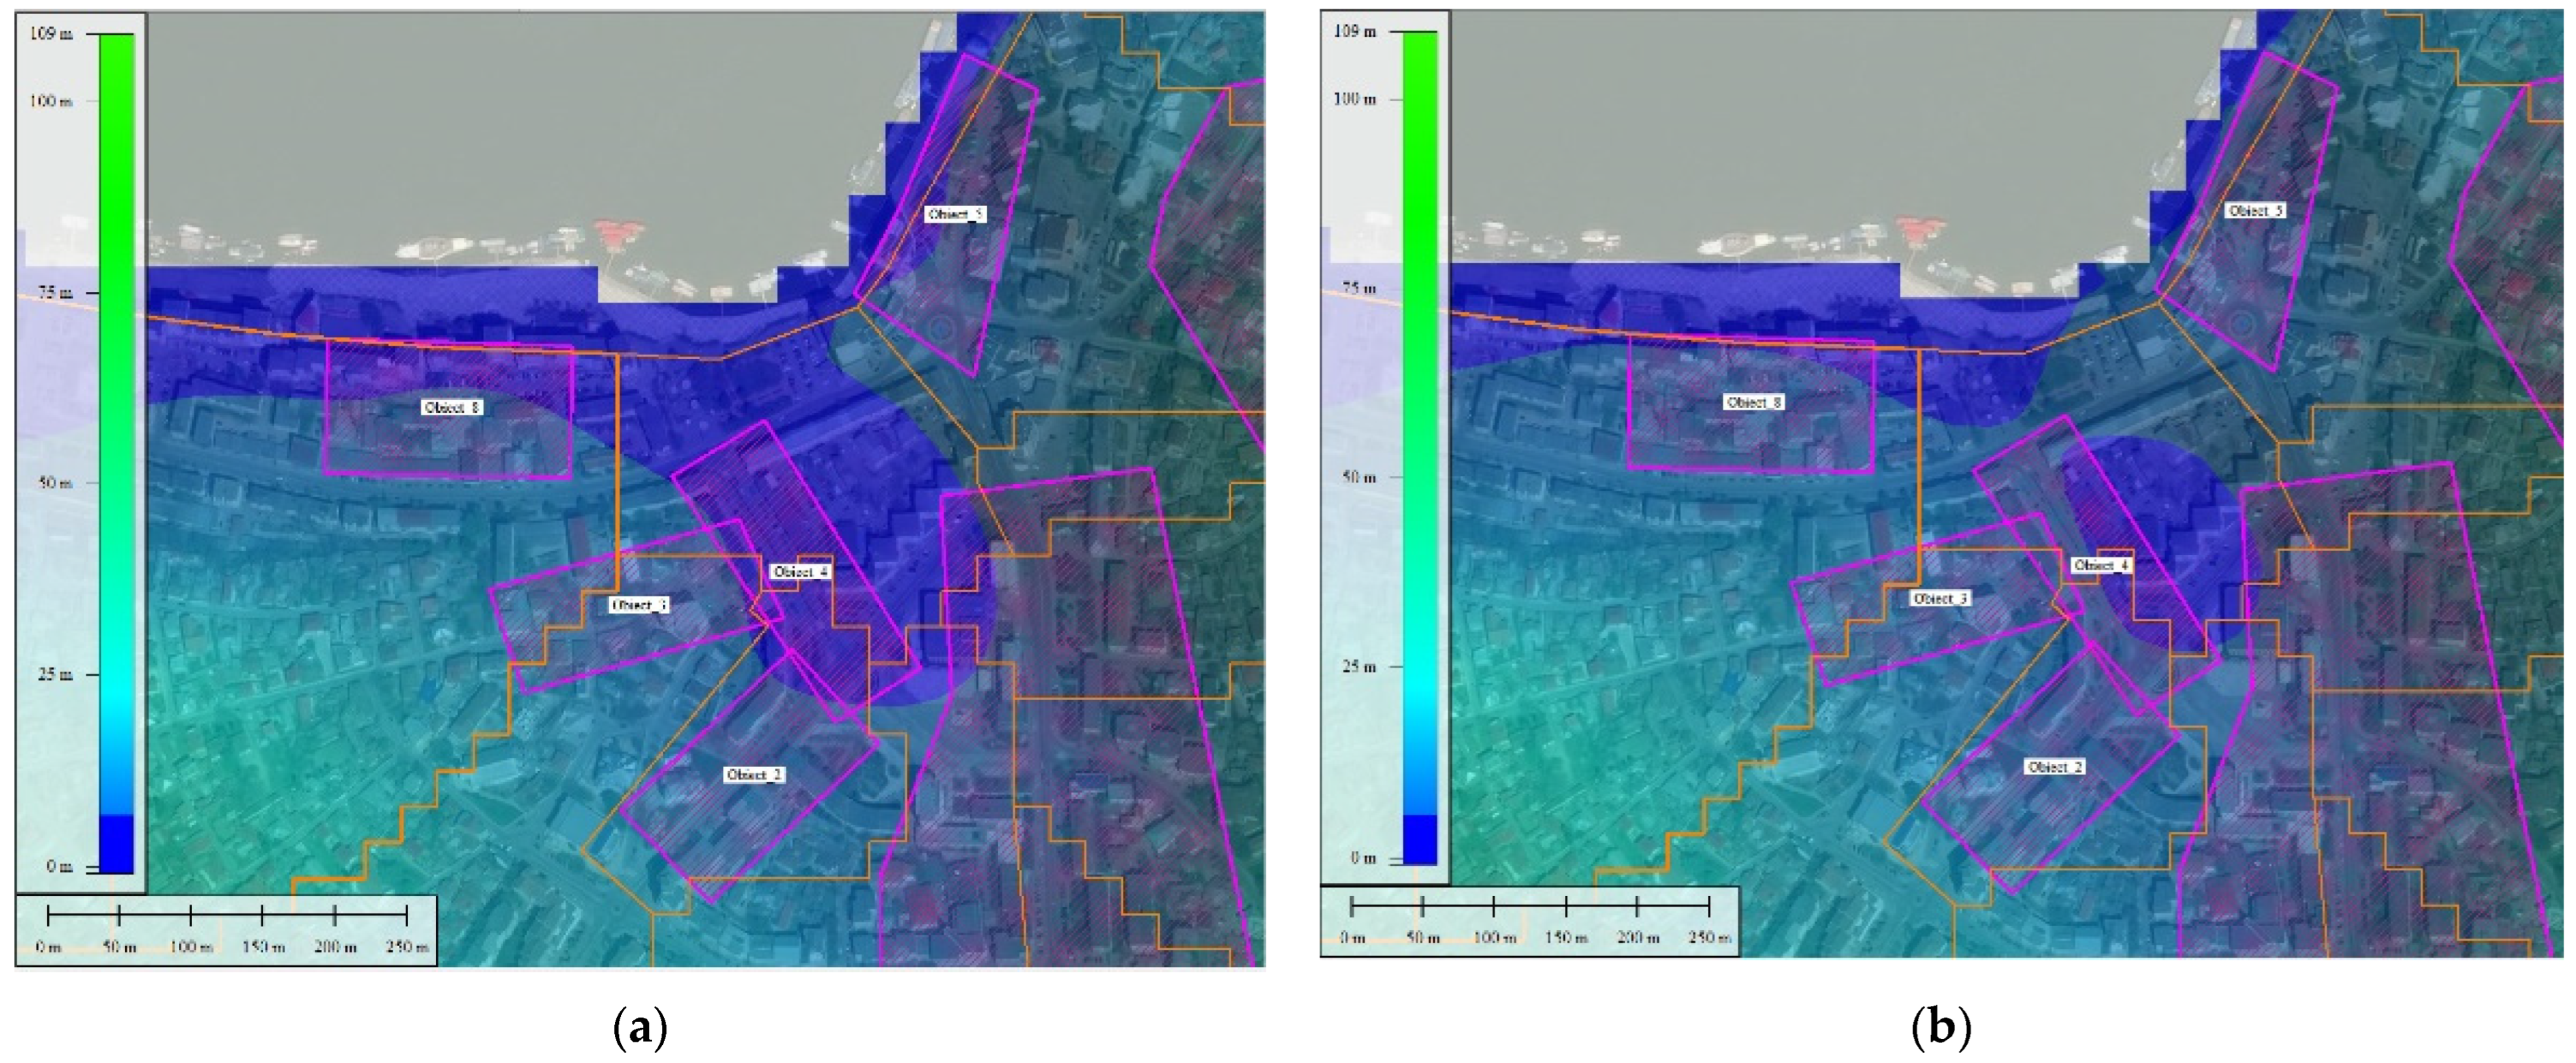
Similar results were obtained for the 14 June 2016 rainfall event. In Hypothesis 1, the simulated maximum discharge was 11 m
3/s and the volume was 42,835 m
3, while in Hypothesis 2 the corresponding values were 4.57 m
3/s and 9350 m
3, respectively. The extensions of the flooded areas are presented in
Figure 20.
In Hypothesis 2, the flooded area is much smaller than in Hypothesis 1, with a relatively large water accumulation in the area of Unirii Street. Compared to the flooded areas during the 2016 event, the results corresponding to Hypothesis 2 did not match the actual flooded area, suggesting again that the sewage system was not fully operational. The grate inlets were probably blocked by floating debris, and the collectors partially clogged.
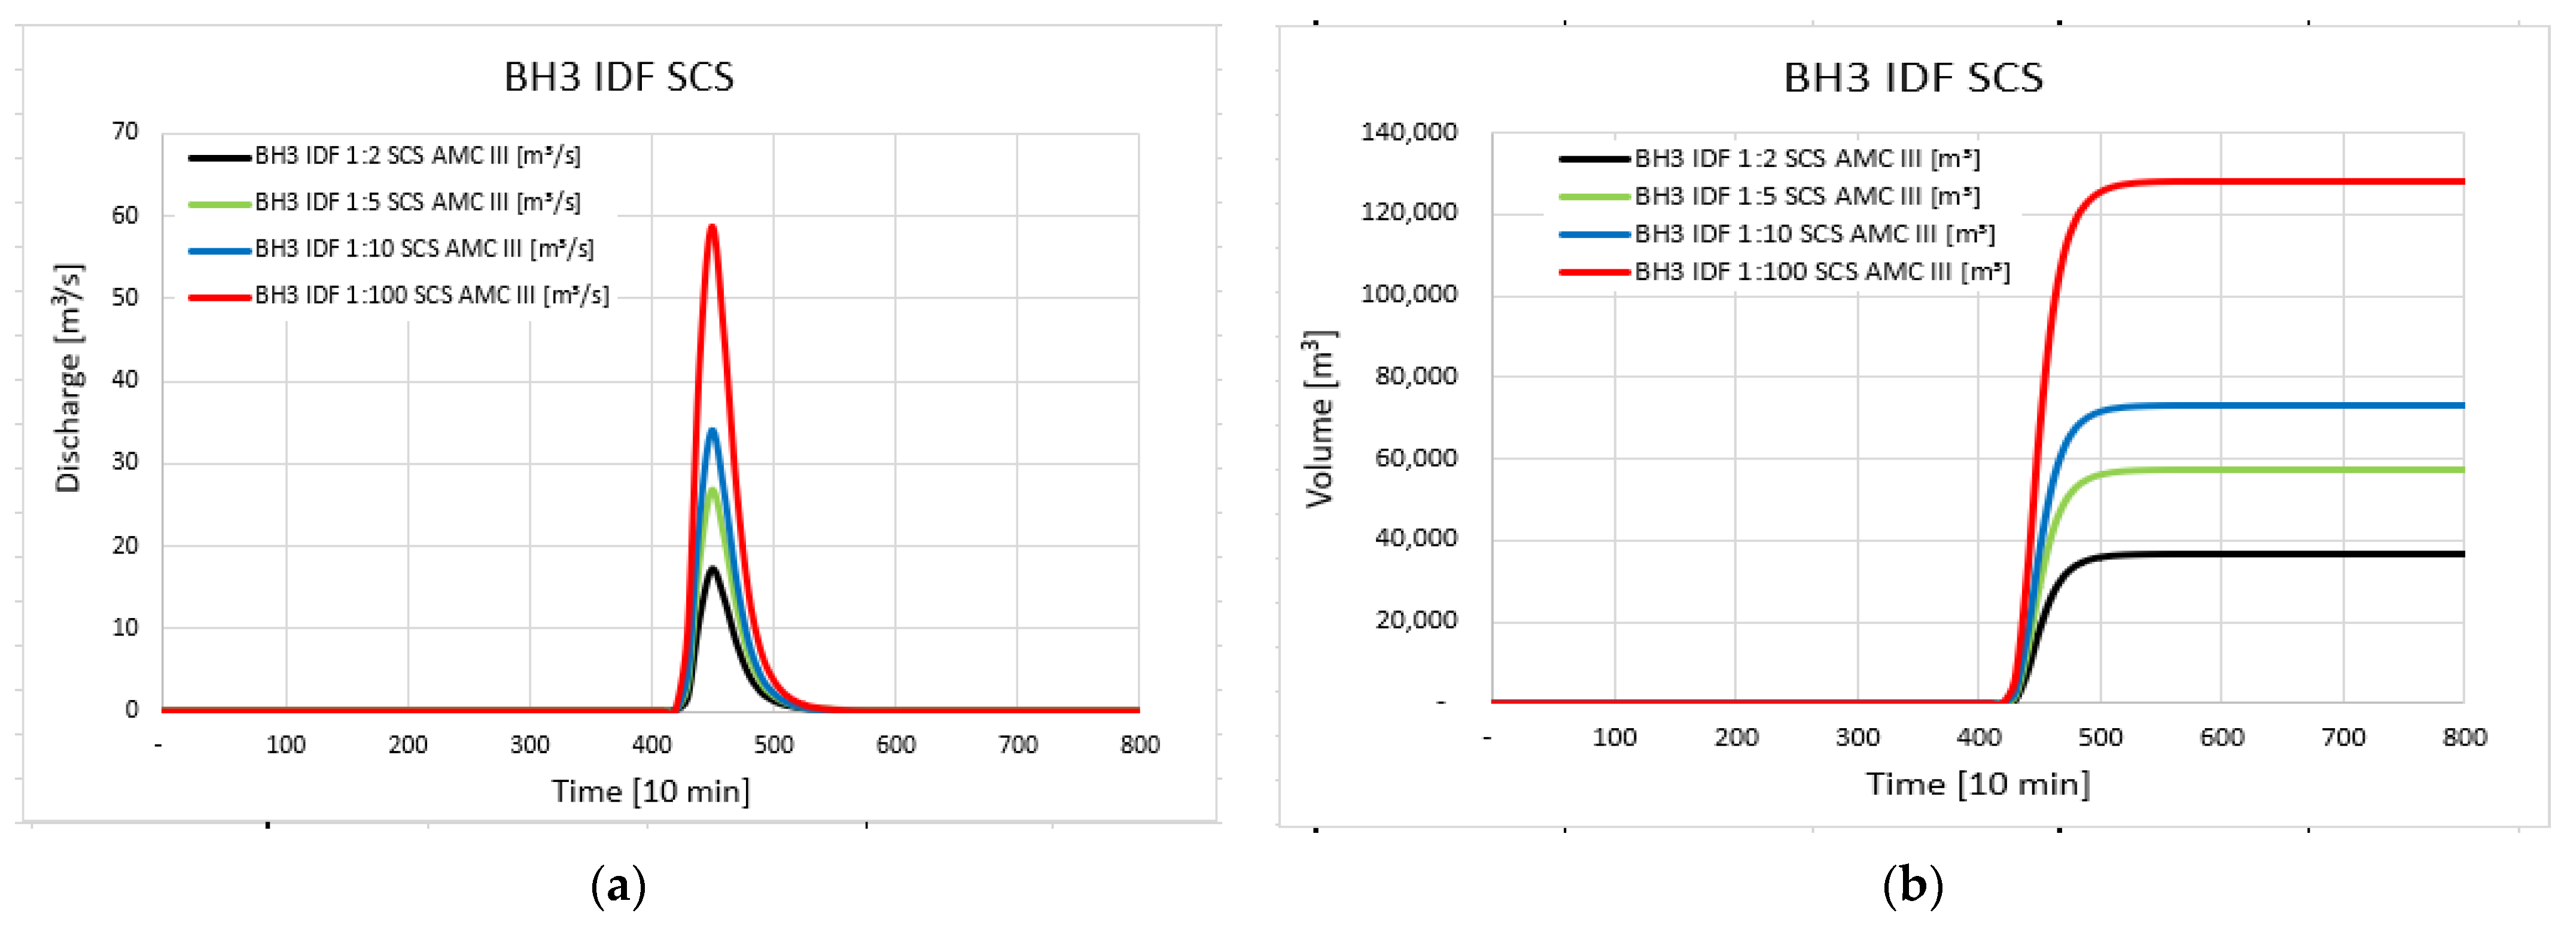
Following the calibration and validation stage, simulations for design storm corresponding to the frequencies 1:2; 1:5; 1:10; and 1:100 were performed in both hypotheses of functionality of the sewage system: (a) Hypothesis 1, 100% non-operational and (b) Hypothesis 2, fully functional. The duration of precipitation was 40 min, and the precipitation structure corresponded to the event of September 2013. The AMC-III condition was used in the simulations.
The results obtained for the design rainfalls corresponding to the above-mentioned frequencies for Hypothesis 1 are presented in
Figure 21 and
Table 1.
If a comparison is made of the flows and volumes obtained for the rainfalls occurring in 2013 and 2016, it can be seen that the event of September 2013 has a maximum discharge close to that generated by a rainfall with a frequency of 1:5, while its volume is similar to that generated by a rain with a frequency of 1:100. For the June 2016 event, the maximum discharge is below the flow generated by the 1:2 frequency design rainfall, while the volume is above the volume equivalent to the 1:2 frequency design rainfall.
Even if the system is operating at full capacity, it is not able to fully discharge the flood flow, and significant volumes of water remain in the low areas or behind the Danube dike (
Table 2).
5. Discussion
To reduce the risk of flooding in the central area of Tulcea, the best approach would be a Sponge City solution. However, it was considered that, due to the high slopes of the hills and the short concentration time, such a solution does not offer spectacular and immediate results. A partial solution with lasting effects can be obtained by developing a curtain of vegetation on the hills around the city and by increasing the number of green areas in the municipality. The introduction of interception collectors at the middle of the slope is another solution to reduce the flow that reaches the base of the slope. They must be designed so that they can fully take over the upstream flow. However, the local administration demanded quick results, opting for a grey infrastructure solution accompanied by the development of green solutions over time.
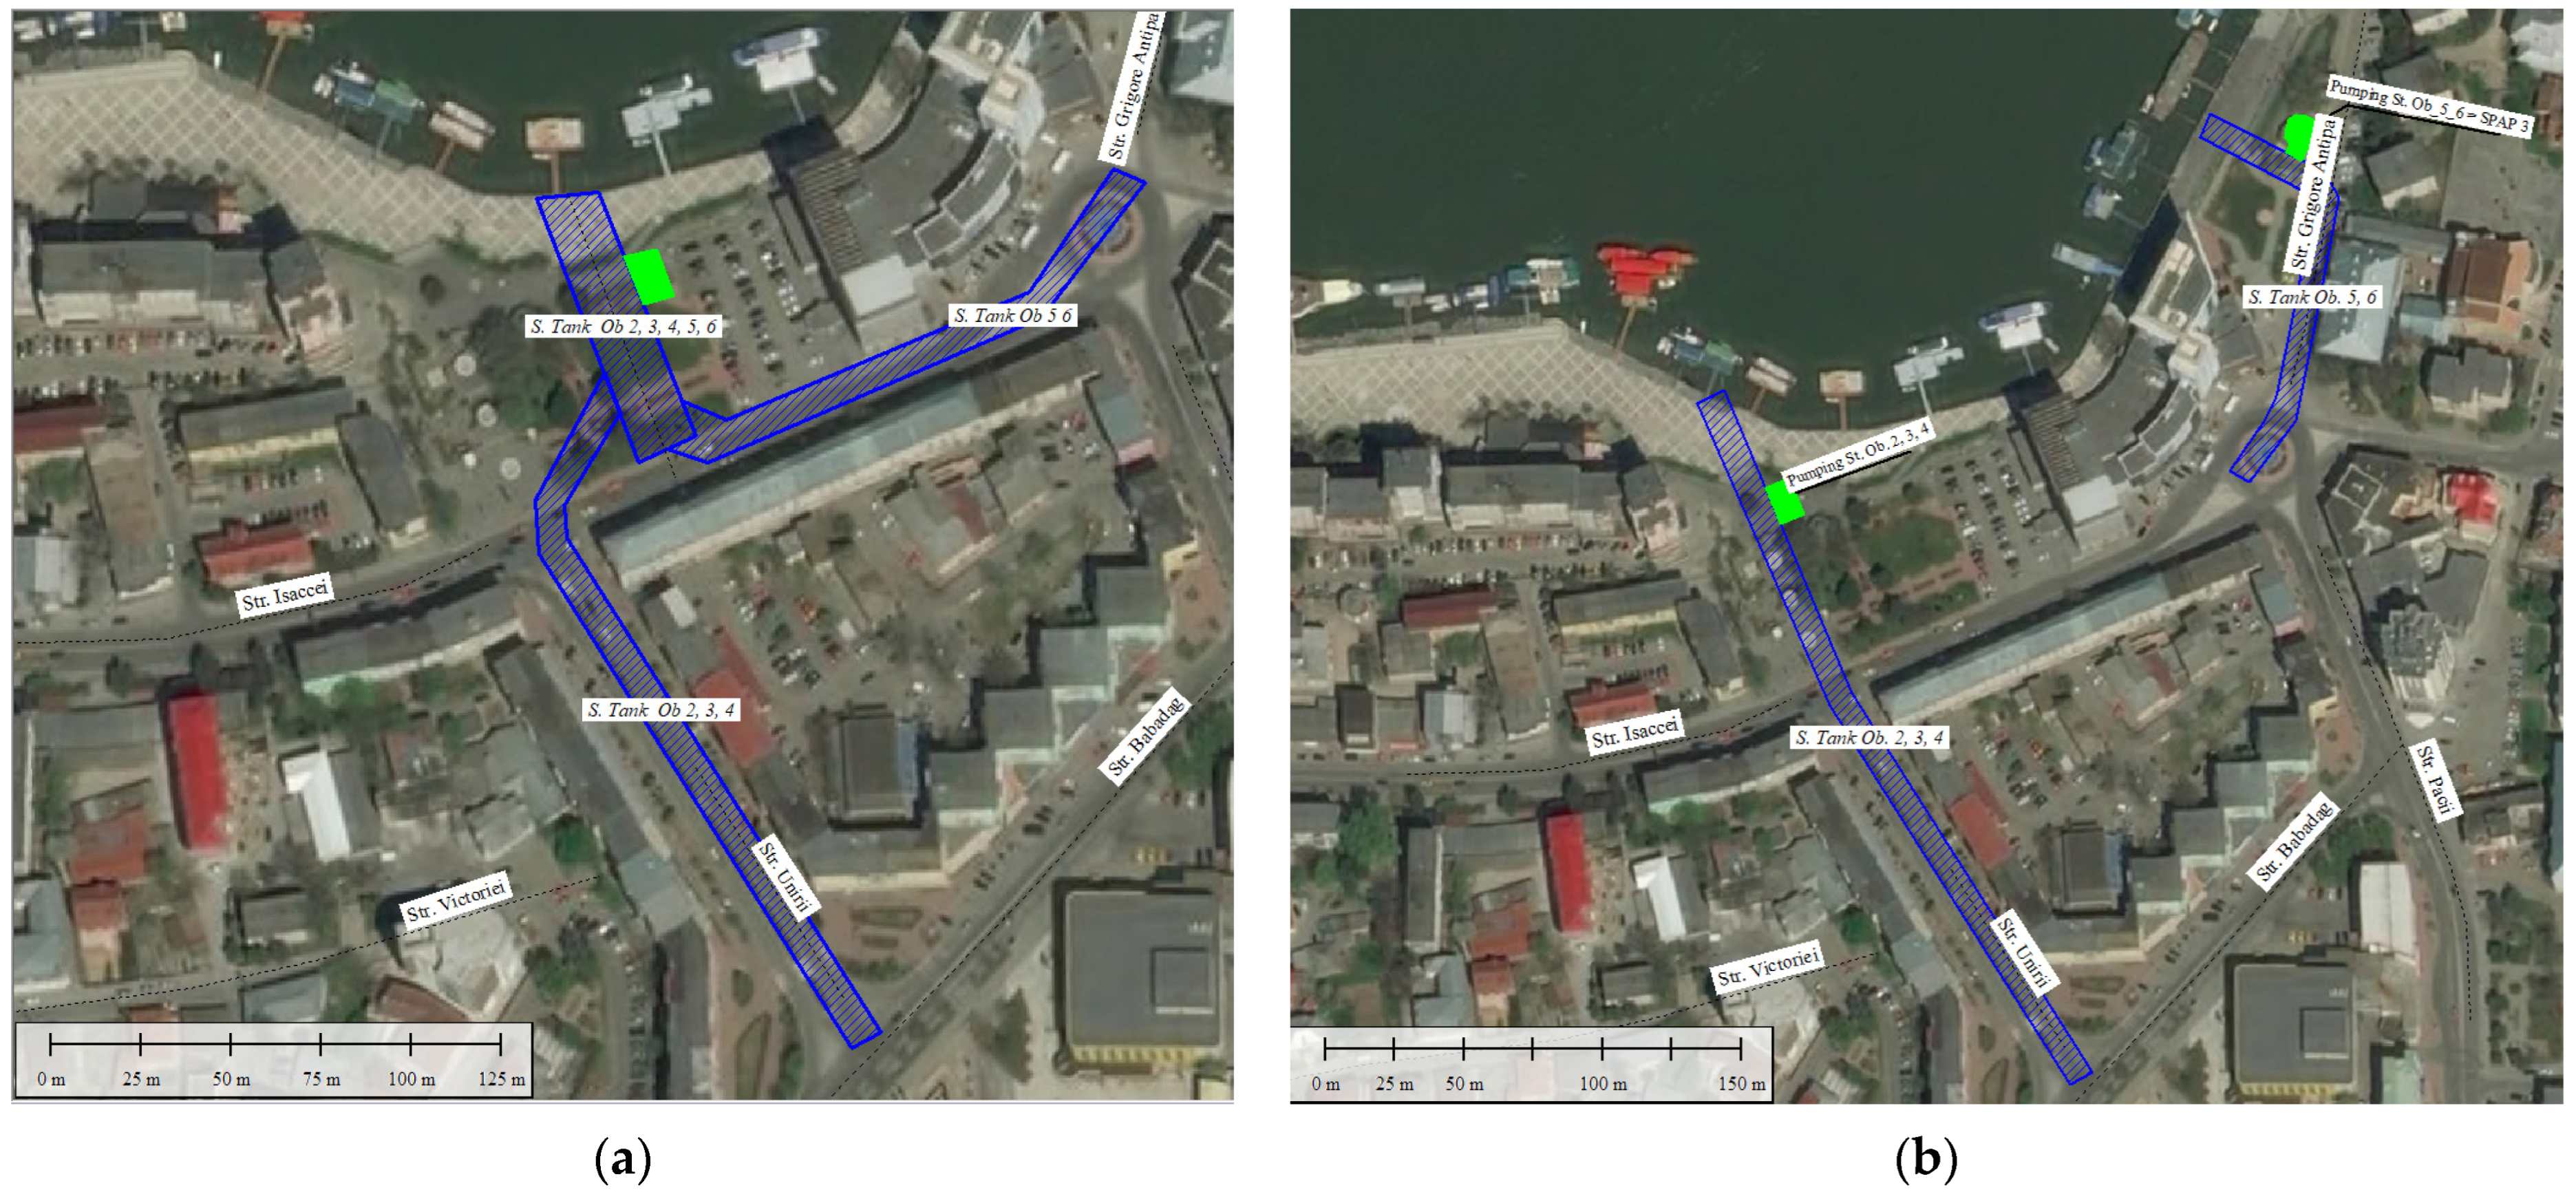
The results obtained with IDF 1:5 design rainfall were used as a basis for proposing discharging or temporary retention solutions. Two solutions which utilise underground storage tanks at the most sensitive areas of Tulcea, namely the areas of objects 2, 3, 4, 5, 6, and 7, have been proposed (
Figure 22). The tanks, equipped with pumping stations, are located under the streets in the area of the previously mentioned objects.
In Solution-1, runoff urban water flow from the two urban areas which have experienced flooding problems (Babadag–Unirii and Pacii–Antipa-Isaccei) is collected at the same point, and only one pumping station is attached to the urban sewage system. Powerful pumps must be considered in order to deal with various situations that may arise in operation (e.g., increased water levels in the Danube or higher flood volumes than the volume of the tank). In Solution-2, it is potentially possible to use the existing pumping station (SPAP 3), but this must certainly be reviewed. In this configuration, the tanks are independent and do not intercommunicate. A slightly unfavourable situation compared to Solution-1 is given by the lack of a tank in the Isaccea street, in the urban sector confined between Unirii and Păcii streets.
The analysis and pre-sizing of the proposed tanks were broken down, depending on the area in which they are located. In Solution-1, the length of the tank under Unirii street (for objects 2, 3, and 4) is approx. 209 m, with an inner height of 3 m, and an inner width of 10 m (the street width). The carrying capacity of this tank is 14.7 m3/s. The tank on Isaccea street (objects 5 and 6) has the following dimensions: length 146 m, inner height 3 m, and 8 m width, with a carrying capacity of 10.8 m3/s. The two previous tanks are connected to the third tank located near the Delta Hotel parking (Objects 2, 3, 4, 5, and 6) so that the flow rates and volumes will be summed up for proper dimensioning. The carrying capacity should be 25.5 m3/s. As it is located in the wider park near Delta hotel, its inner width can be 16 m, the interior height 3 m, and the length is 76 m. The slope of all the tanks is 0.5%, chosen according to the average level of the Danube.
A similar analysis was performed for Solution-2. Being less favourable than Solution-1, its tank dimensions are not detailed herein. The total volume that can be accumulated in the tanks in Solution-1 is Vtotal = 13,422 m3, as compared to Solution-2, where Vtotal = 12,240 m3. In both cases, pumping stations are required in the downstream area.
Both solutions proposed for discharging the urban runoff towards the Danube must be accompanied by additional works (a better drainage of surface water into the sewer system and resizing of collectors, especially on streets such as Lieutenant Gavrilov, etc.). Particular attention should be paid to the limited (non-clogged) drainage capacity of the grate inlets, which is only 11 L/s. Thus, for the reception basin upstream of the Delta hotel, at a maximum flow of 16.2 m3/s, almost 1500 grates would be necessary at the rainfall frequency of 1:2, and 2300 grates at a frequency of 1:5.
Complementary solutions for improving the present situation are provided in the following. A careful monitoring performed at least once every 3 months and after each torrential rainfall should remove the debris on the grate inlets and of the sewage collectors. The use of road grates, with metal grills placed transversely on the entire width of the street to keep out debris, is also a good solution, but their location must consider the preferential drainage routes. The problem in this case is the grate clogging in a rather short time; hence, ongoing maintenance would be necessary.
6. Conclusions
As stated by Grimaldi et al. (2021), the ungauged basins are those basins completely or partially lacking hydrometric observations and, consequently, unable to support calibration procedures for hydrological modelling. In the case of the Tulcea municipality, no outlet discharges had been measured in the past two decades. This is likely the situation with other towns in Romania and in other countries.
The urban floods in the Tulcea municipality are due to a combination of influencing factors: torrential rains, city topography (sudden transition from a high slope to a lower slope), complicated street pattern, faulty sewerage design, and maintenance of old sewer collectors (angles of 90 degrees along the sewage system and insufficient designed capacity). The floods generated by torrential rainfalls occur in the meadow area, which is characterized by a lower slope vs. the slope of the surrounding hills. The runoff rainwater is directed quickly to the lower urban parts, where waters lose their speed and stagnate on the surface of the land.
Regarding the applicability of the herein presented method, a major issue is the reliance solely on crowdsourced data for calibrating the outcome of the hydrological models, as no reliable information exists regarding the discharge series at the outlets of the urban storm drainage system. The use of crowdsourced data for calibrating the urban hydrological models, based mainly on the accumulated runoff volumes in the depression areas and not necessarily on peak discharge, is a quite recent approach. The case study on the Tulcea municipality and the corresponding model plainly reveal key aspects of the method and its possibilities for application. Such insights refer to the use of crowdsourced data circumstantially obtained by various means (mass-media, internet, social media, etc). For instance, the landmarks or other relevant elements with known heights (such as cars and first-floor levels) in a specific area are valuable information to estimate the water level or the water height. Based on the Digital Terrain Model and GIS tools, the estimated water levels within the urban environment can be mapped and the flood extent can be obtained, allowing various runoff volume analyses. Depending on the local topography, the low areas (depressions) where the water is expected to accumulate can be parcelled out at the water divide, in a number of so-called flood cells, for which a volume–elevation curve can be predetermined using DTM. A flood cell can be fed by one or multiple urban catchments. The volume–elevation curve determined for each flood cell can be used to obtain the flood extent for various scenarios (use of different design storms with various frequencies, changes in runoff, or CN values, implementation of green measures, or complementary SUDS in different sub-catchments, etc.).
The accuracy of this approach (calibrating the hydrological model by using crowdsourced data, together with DTM pre-processing) is mainly preserved by the accuracy of the generated DTM (horizontal resolution/vertical accuracy) and by the type of the hydrological model employed. An increase in the DTM resolution and vertical accuracy will provide more accurate results regarding flood extent and potential runoff volumes accumulated on the terrain surface. If a simple hydrological model is used (case in this paper), the results will have a lesser accuracy. A distributed hydrological model, linked with the storm urban drainage system, will always provide better results in terms of accuracy, but at the same time will require a significant amount of data and greater computational power and time. The approach proposed in this paper has been conceived as a methodology that uses a minimum amount of data while providing reasonably good results in the shortest time period.
This lack of measured functional discharges at the outlets of the urban sewage system may generate quite significant uncertainties regarding the obtained result quality as well as the effectiveness of the approach. For this case study, only two flooding events were available, and more crowdsourced data would be necessary to guarantee the stability of the derived parameters. In order to compensate for the lack of outlet discharge information, two extreme rainfall scenarios were analysed, considering the functionality of the urban drainage system (1) as entirely out of function and (2) as operating at its design capacity, respectively.
The calibration and validation were based on only the estimated volumes in the depression areas, meaning a DTM which has an adequate horizontal resolution and vertical accuracy is compulsory. Better DTM data will ensure a better representation of the flooding extent and of the accumulated volumes on the terrain surface, even if only crowdsourced data are available. Another major reason for using a high-quality DTM is for accurately deriving the surface flow directions (through GIS analysis). The urban configuration does usually bring in major deviations to the runoff flow directions. Hydrological analysis in a natural catchment does not necessarily require a high-resolution DTM, but the same analysis in urban areas does require a high-quality DTM.
For the evaluation of the excess rainfall, a lumped hydrological model used in conjunction with a volume-based overland flood analysis was preferred due to the lack of detailed data related to the sewage network and the fast still-reliable results that can be obtained over a large number of simulations. Considering the results based on the available data, it can be considered that the models are satisfactorily calibrated. The accuracy of the results is indirectly confirmed by the extension of the flooded areas determined for the September 2013 event.
The results obtained for the event of June 2016 show a deficient functioning of the sewage system in the area of objects 2, 3, 4, 5, and 6 due to multiple causes, such as flow exceeding the carrying capacity of the system or partial clogging of the inlet grills or of system’s various collectors.
Under the specific conditions of the Tulcea municipality, large-capacity retention tanks (equipped with powerful pumps to discharge rainwater directly into the Danube), were considered for the lower part of the municipality where the capacity of the drainage network appears to be exceeded. This solution will be progressively supported by a set of green measures, with their due implementation over time. The implementation of LID measures, by considering retrofitting opportunities for the local land use, will improve the efficiency of the proposed DTs, with the expected knowledge benefit especially in the perspective of climate change.


