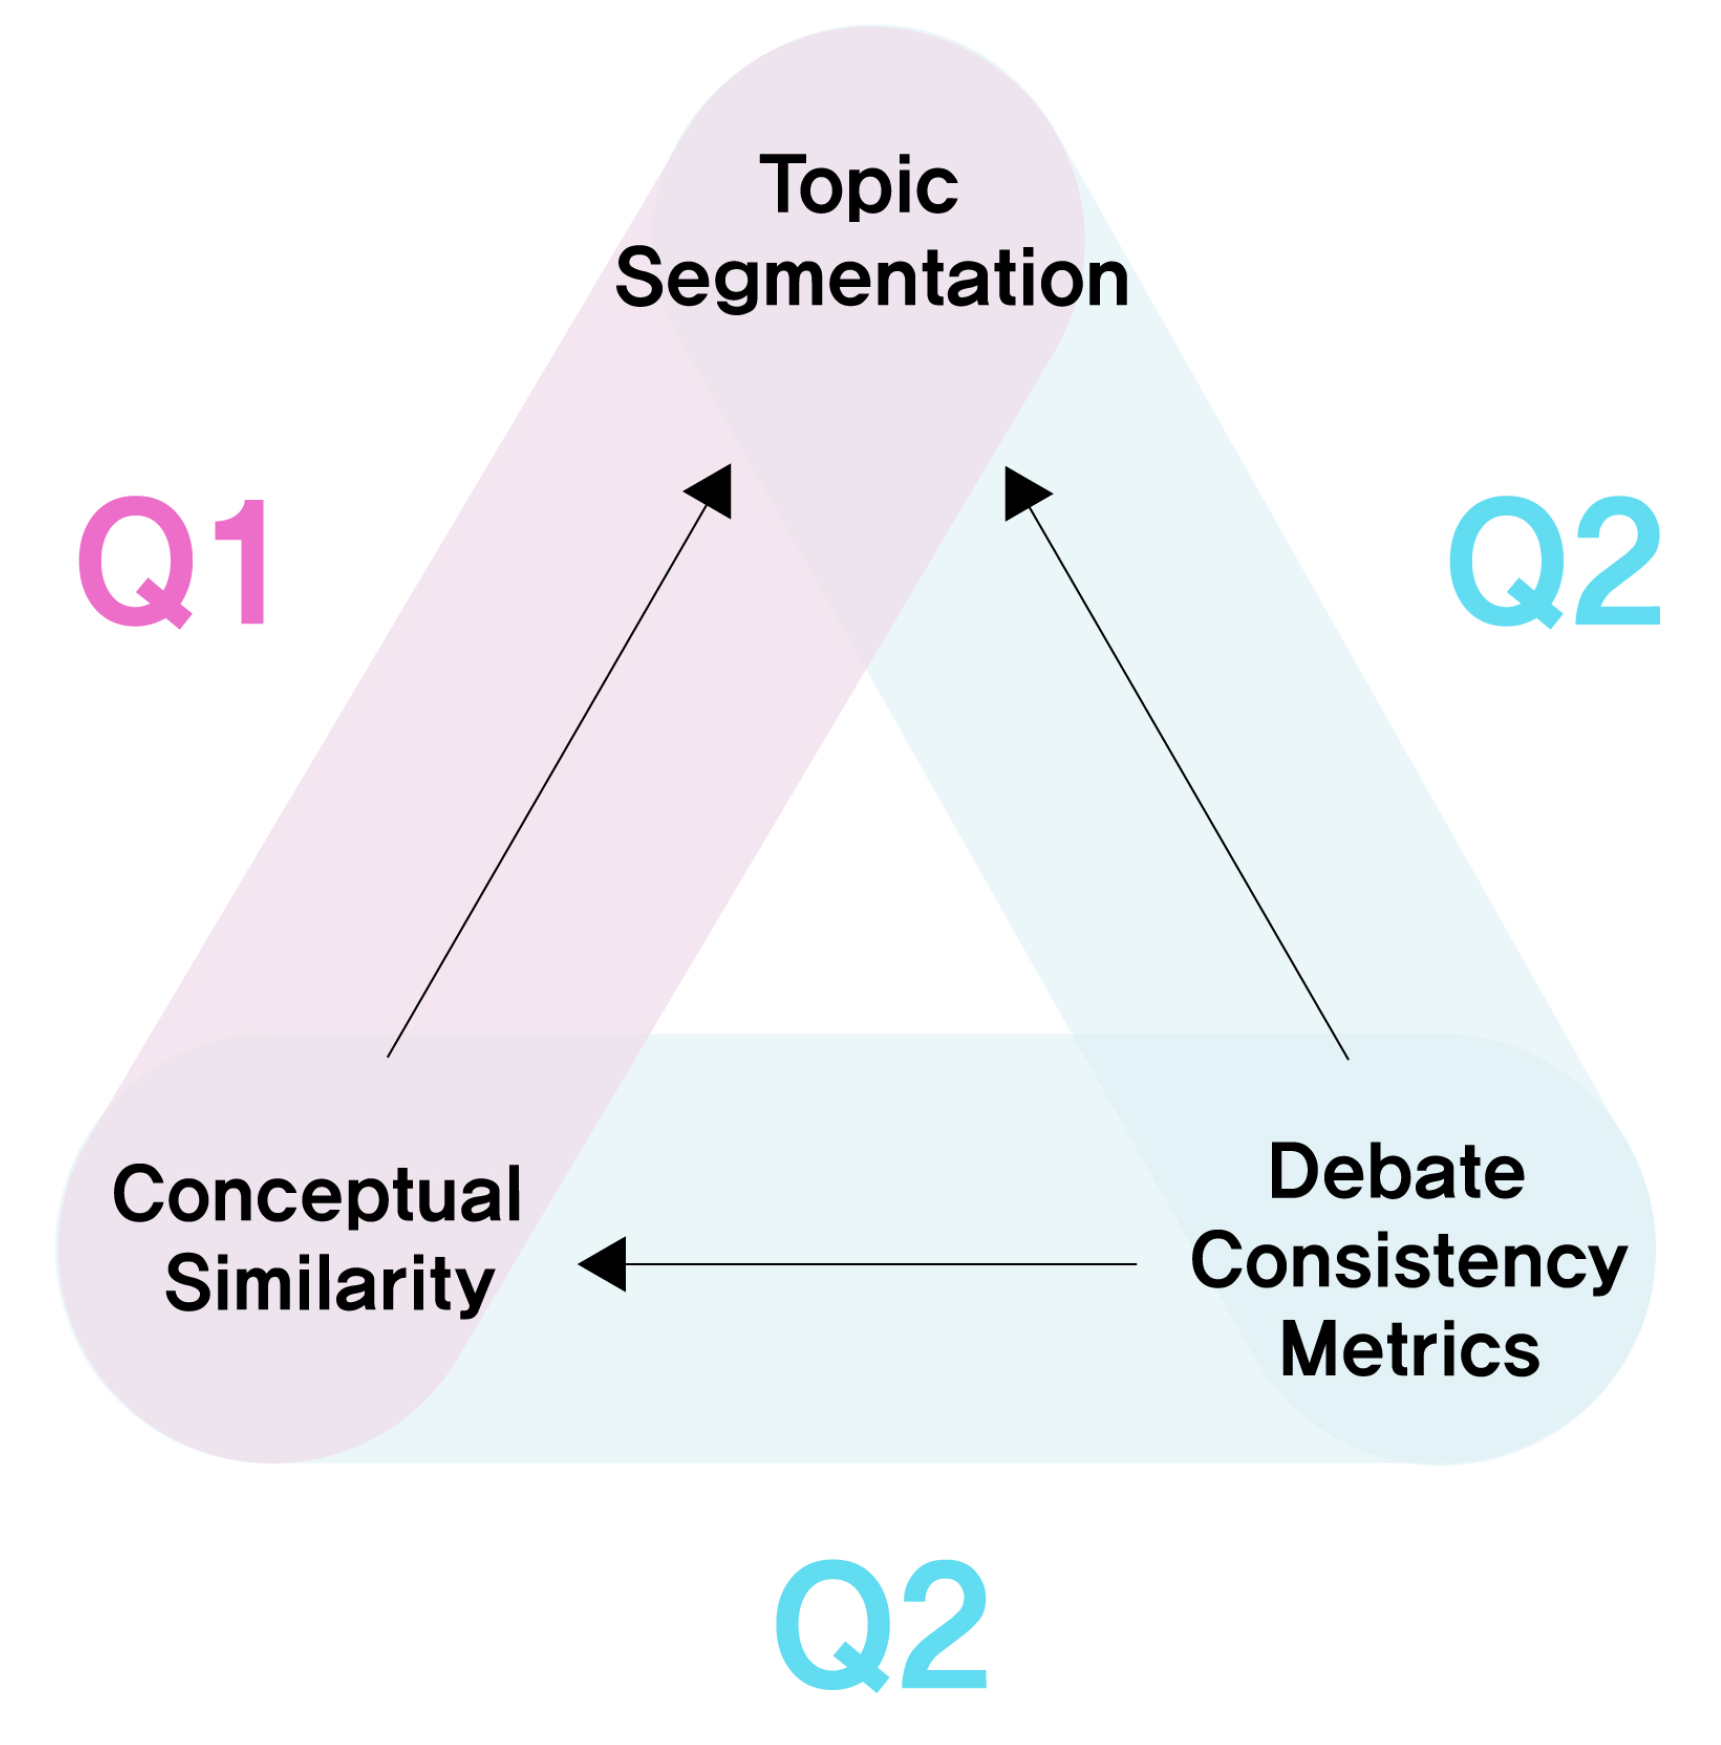
Article

Using Conceptual Recurrence and Consistency Metrics for Topic Segmentation in Debate

1
Lifemedia Interdisciplinary Program, Ajou University, Suwon 16499, Korea
2
Department of Software and Computer Engineering, Ajou University, Suwon 16499, Korea
3
Department of Artificial Intelligence, Ajou University, Suwon 16499, Korea
4
Department of Digital Media, Ajou University, Suwon 16499, Korea
*
Author to whom correspondence should be addressed.
Appl. Sci. 2022, 12(6), 2952; https://doi.org/10.3390/app12062952
Submission received: 5 February 2022 / Revised: 10 March 2022 / Accepted: 11 March 2022 / Published: 14 March 2022
(This article belongs to the Special Issue Application of Machine Learning in Text Mining)

Abstract

:
We propose a topic segmentation model, CSseg (Conceptual Similarity-segmenter), for debates based on conceptual recurrence and debate consistency metrics. We research whether the conceptual similarity of conceptual recurrence and debate consistency metrics relate to topic segmentation. Conceptual similarity is a similarity between utterances in conceptual recurrence analysis, and debate consistency metrics represent the internal coherence properties that maintain the debate topic in interactions between participants. Based on the research question, CSseg segments transcripts by applying similarity cohesion methods based on conceptual similarities; the topic segmentation is affected by applying weights to conceptual similarities having debate internal consistency properties, including other-continuity, self-continuity, chains of arguments and counterarguments, and the topic guide of moderator. CSseg provides a user-driven topic segmentation by allowing the user to adjust the weights of the similarity cohesion methods and debate consistency metrics. It takes an approach that alleviates the problem whereby each person judges the topic segments differently in debates and multi-party discourse. We implemented the prototype of CSseg by utilizing the Korean TV debate program MBC 100-Minute Debate and analyzed the results by use cases. We compared CSseg and a previous model LCseg (Lexical Cohesion-segmenter) with the evaluation metrics P k and W D . CSseg had greater performance than LCseg in debates.

1. Introduction

Debate is an act of discourse in which debaters with different opinions try to persuade the other party to solve a proposed problem [1]. In particular, TV debate plays a major role in influencing public opinion because it deals with social issues such as political campaigns and elections in the public sphere [2]. Among the various research approaches for analyzing debate is visual analytics, an automated technique of analysis using interactive visualizations to integrate human judgment into the data analysis process [3,4]. In visual analytic research on debate, there have been attempts to explore topics of debate. Among them, conceptual recurrence, which analyzes multi-party conversations, facilitates automatically splitting the transcript of debate into smaller subtopics by calculating the similarity of utterances quantitatively as a value called conceptual similarity. We investigate its relationship with topic segmentation, finding that conceptual similarity reflects the connection between words and utterances like existing topic segmentation methods do.
In research that conducted social scientific analyses of debate, internal consistency, which is coherence that appears due to the interaction of the discussion, was analyzed. The properties that affect the debate internal consistency are: “semantic coherence”, which refers to the consistency of the central topic across successive utterances; “other-continuity”, which refers to the coherence between successive utterances made by different speakers; “self-continuity”, which means consistency between an individual speaker’s utterances; “chain of arguments and counterarguments”, which means consistency generated by successive arguments and counterarguments; and “topic guide of the moderator”, which is consistency reflecting the introduction of the topic by the moderator. Since internal consistency is the coherence that appears through the interaction of the discussion, and the conceptual similarity of conceptual recurrence also indicates the similarity between utterances that appears through the interaction between utterances, we found that both are attributes that indicate the interaction of the debaters. Based on this, we establish a research question on the relationship between conceptual similarity and the internal consistency of a debate.
However, in the cases of topic segmentation research that automatically divides text or record into smaller subtopics, it has not been easy to separate the subtopics of multi-party discourse. This is because, in a multi-party conversation, people can judge topics differently [5]. Multi-party discourse means a series of utterances that are exchanged by different distinct speakers for a particular subject. Debate is also a multi-party discourse. As an approach to solve this problem, we propose a user-driven topic segmentation model from the perspective of visual analytics that analyzes it through user interaction. This is an approach in which the user adjusts the properties representing the interaction of the debaters in a visualization environment of conceptual recurrence to separate transcripts and explore topics.
We examine the relationship between topic segmentation, the conceptual similarity of conceptual recurrence, and the properties that influence internal consistency of debate. We present two research questions Q1 and Q2 as shown in Figure 1:
  • Q1: Whether conceptual similarity affects topic segmentation. A segment with relatively high conceptual similarities is formed as a topic, and the topic segmentation point includes the main utterance that leads the debate topic.
  • Q2: Whether the properties that affect the internal consistency of debate affect the conceptual similarities and thus the topic segmentation. Properties that increase the internal consistency of debate have a positive effect on the corresponding conceptual similarities, and properties that impair the internal consistency of debate have a negative effect on the corresponding conceptual similarities.
Based on these research questions, we use quantitative metrics representing properties that affect the internal consistency of debate and conceptual recurrence to calculate the similarity between utterances, and based on these research questions, we propose a user-driven topic segmentation model in which the user adjusts the attributes representing the interactions of debaters.
First, we propose three methods of calculating similarity cohesion that aggregate conceptual similarities for topic segmentation: Plane, Line, and Point. In addition, we propose a combined method that considers all three methods. We also propose quantitative metrics as properties that affect the internal consistency of debate and conceptual similarity. Metrics that increase the consistency of debate include other-continuity, the chains of arguments and counterarguments, and topic guide of moderator; the conceptual similarities corresponding to these metrics are positively affected. A metric that undermines the consistency of the debate is self-continuity. The conceptual similarities corresponding to the “self-continuity” metric are negatively affected. The proposed model, CSseg, alleviates the problem of each person judging the topic segmentation points differently in debate and multi-party discourse by allowing the user to adjust the weights of the “similarity cohesion calculation method” and “debate consistency metrics.” The prototype of CSseg can be accessed at https://conceptual-map-of-debate.web.app/, accessed on 10 March 2022.
The contributions of our research are as follows:
  • We propose “similarity cohesion calculation methods” that calculate the degree of cohesion of conceptual similarities to quantify the similarity between utterances to automatically divide the debate transcript into sub-topics.
  • We propose “debate consistency metrics” that quantify properties that affect internal coherence, which appears through the interaction of the debaters, in order to separate transcripts according to the properties. Based on the results of social science studies that analyze the properties affecting the internal consistency of debate, we construct the conditions of each property to derive metrics that can be fused to a topic segmentation method.
  • We propose a user-centered topic segmentation method by allowing users to adjust the weights of the “similarity cohesion calculation method” and the “debate consistency metrics” through the interactions of the visual analytics tool.

2. Related Works

2.1. Visual Analytics of Debate and Discourse

Visual analytics studies to analyze debate and discourse have been continuously conducted. In this section, we address the attempts in this line of research to analyze topics, particularly those to explore topics of debate and discourse among these studies.
First, we investigate visual analytics research analyzing debates. Gold, Rohrdantz, and El-Assady (2015) [6] proposed lexical episode plots that visualize the distribution of keywords along with the transcript of debate based on lexical episodes representing the cohesiveness of the same words. Through the distribution of words, the lexical episode plots identify topics (thematic clusters) within a transcript of debate. El-Assady et al. (2016) [7] proposed ConToVi, which can analyze over time to which topic each utterance belongs, suggesting the need to explore topics over time in debate analysis. El-Assady et al. (2017) [8] proposed NEREx to analyze debate in terms of the relationship between entities composed of keywords including category information. To understand topics, they mentioned the necessity to categorize the entities in a given corpus. South et al. (2020) [9] proposed DebateVis to analyze debate for non-expert users. They suggested agree, attack, defense, and neutral reference as factors for comparing the meaning of dialogue between speakers, showing the possibility of exploring topics through the interactions between the speakers.
Second, we investigated visual analytics studies of discourse. Angus, Smith, and Wiles (2011) [10] proposed a conceptual recurrence plot that represents similarity between utterances as conceptual similarity. They presented the possibility of grouping the utterances using conceptual similarities. In particular, CSseg was devised based on it, so it is described in detail in Section 2.2. Viet-An Nguyen et al. (2013) [11] proposed Argviz to analyze changes of topics in multi-party conversation. Shi et al. (2018) [12] proposed MeetingVis to summarize meetings based on the idea that the change of topics over time can be analyzed by using the topic bubbles among elements representing narrative flow. Chandrasegaran et al. [13] proposed TalkTraces to analyze the content of discourse contextually using topic modeling and word embedding. It shows the topic distribution for each utterance. It shows the topic distribution for each utterance. Lim et al. (2021) [14] proposed a narrative chart to analyze the flow of discussion and a topic map to analyze broad contents in meetings, which offers the possibility of analyzing topics by categorizing agendas in meetings.
In research on the visual analytics of debate and discourse, there have been attempts to analyze discourse by topics that allow us to identify the need to explore topics in the visual analytics of debates and discourses. Unlike existing studies, CSseg approaches visual analytics as topic segmentation in debate.

2.2. Conceptual Recurrence

We investigated the studies of conceptual recurrence plots to find clues for segmenting transcripts of discourse.
Angus et al. (2011) [10,15] proposed conceptual recurrence, which is a technique and visual analytic to represent the similarity between utterances. Based on this method, various discourses occurring in broadcast interviews [16], hospitals [17,18], and other contexts have been analyzed using conceptual recurrence. We judged that as debate is also included in discourse, conceptual recurrence can be applied in debate analysis as well.
Conceptual recurrence constructs a visualization based on conceptual similarity, which is a computed value of the similarity between utterances. It derives an engagement block pattern, a visual pattern for users to understand discourse by grouping utterances based on conceptual similarity. It thus represents the possibility of grouping utterances.
There have been studies that attempted to explore topics through conceptual recurrence. Angus et al. (2013) [19] proposed extracted themes composed of key terms for each specific utterance section based on conceptual similarities that indicate the possibility of understanding topics by the main keywords along the text stream. Angus et al. (2012) [20] calculated and visualized changes in discourse to visually analyze where conversations change.
Meanwhile, other studies have proposed quantitative metrics based on conceptual recurrence. Angus, Smith, and Wiles (2012) [21] analyzed the metrics of conceptual recurrence by time scale, time direction, and speaker type. Tolston et al. (2019) [22] proposed and analyzed metrics for conceptual similarities across the global discourse and for each concept showing conceptual similarities.
Studies of conceptual recurrence have presented and analyzed conceptual similarity-based visual patterns, extraction of keywords for themes, discursive changes, and quantitative metrics to explore topics. Through these, we found the possibility of segmenting a transcript by topics based on conceptual similarity in the debate. Unlike existing studies, our proposed CSseg approaches conceptual recurrence as topic segmentation in multi-party discourse.

2.3. Topic Segmentation in Discourse

Topic segmentation is an automatic method to divide the text into shorter, topically coherent segments [5]. We show that the conceptual similarity of conceptual recurrence has a similar property to elements of the existing topic segmentation models.
Hearst [23,24,25] proposed a topic segmentation method, TextTiling, that segments text based on the frequency of the same words between text blocks, which represent a set of token sequences. Galley et al. (2003) [26] proposed LCseg to segment multi-party discourse. It segments a transcript of discourse based on simplified lexical chains connecting the same words. Purver et al. (2006) [27] proposed a model based on Bayesian inference that segments discourse according to which segment the words are assigned to based on Bayesian probabilities. Hsueh, Moore, and Renals (2006) [28] showed that a lexical cohesion-based topic segmentation model has good performance when dividing the discourse into small units. Sherman and Liu (2008) [29] proposed a model based on hidden Markov models to segment meeting transcripts. It is trained by sentence sequence. Nguyen, Boyd-Graber, and Resnik (2012) [30] introduced a hierarchical Bayesian model that does not specify the number of topics as a parameter. It segments discourse based on the connection between utterances using the speaker-specific information. Joty, Carenidi, and Ng (2013) [31] proposed unsupervised and supervised models for asynchronous conversations such as email and blogs. It separates text based on the graph connectivity of quoted fragments. Song et al. (2016) [32] proposed a model that computes the similarity between utterances with word embedding, which combines query and reply. Takanobu et al. [33] proposed a reinforcement learning model that includes a hierarchical LSTM consisting of a word-level LSTM and a sentence-level LSTM. It segments goal-oriented dialogues based on the connections of words and sentences.
Topic segmentation models have applied various techniques, but the basis of these techniques is the connectivity between words, sentences, or utterances. The conceptual similarity of conceptual recurrence also indicates the connectivity between words and utterances. Since both conceptual recurrence and existing topic segmentation methods have a common point of the connectivity of words and utterances, we propose a topic segmentation model based on conceptual recurrence.
In other words, the method we propose to find the points with the highest cohesion of conceptual similarity is the method of analyzing changes in lexical distribution, which is the main insight of existing studies, through conceptual similarity. This is because utterances consist of conceptualized words, conceptual similarity is the similarity between utterances, and the cohesion of conceptual similarity can be a lexical distribution of conceptualized words.
Even so, there are topic segmentation models that can form visualization in the form of a two-dimensional matrix like conceptual recurrence. Reynar (1994) [34] 196 separated text based on the similarities of word repetitions and visualized it in a matrix form. Choi [35] separated the text and visualized the matrix based on the computed values processed by the image ranking algorithm for the similarity between sentences. Malioutov [36] proposed a model that forms a graph based on the similarity between sentences and separates lecture transcripts. Unlike previous studies that can visualize a matrix form, CSseg is a new topic segmentation approach that applies metrics that improve the consistency of debate based on the conceptual similarity of conceptual recurrence. In addition, it is a user-driven model that adjusts the weights of the similarity cohesion methods and debate consistency metrics through user interactions.

2.4. Social Science Analysis of Consistency of Debate

We investigated studies of social science analysis of debate. Specifically, studies analyzing TV debates including “100-Minute Debate” used in the prototype implementation of CSseg and communication theories involving the interaction of speakers were investigated. Through these, we organize the properties that maintain the consistency of debate related to topic segmentation, and these properties are to be applied to CSseg.
There are studies that analyze the stages of TV debates. Park’s (1997) [37] analysis showed that at the stage of discussion, where the debate begins in earnest, a large topic is discussed from various angles or divided into several subtopics, and Lee [1] found that the debaters discuss a topic after dividing it into various controversial issues. This characteristic of debate divided into subtopics serves as the basis for topic segmentation in debate.
Kim (2009) [38] analyzed how internal consistency implies interaction patterns in TV debates and determined properties that affect the internal consistency, finding that the higher the internal consistency, which is the coherence that appeared by the interaction of the debaters, the higher the interactivity between utterances. Properties that affect the internal consistency of debate include semantic coherence, other-continuity, self-continuity, and chains of arguments and counterarguments.
Semantic coherence is the consistency of the main topic between successive utterances. The higher the semantic coherence, the higher consistency between utterances. Kerbrat-Orecchioni (1990) [39] found that for the interactions between the debaters to be considered a true dialogue, their discourse must be mutually determined in terms of content. These characteristics show that a section with high conceptual similarities of conceptual recurrence representing the interactivity between utterances can be considered one conversation, that is, one topic.
Other-continuity is coherence between utterances made in succession by different speakers. The higher the other-continuity, measured by considering the other’s utterances with each other, the higher the internal consistency. Self-continuity is coherence between different utterances of an individual speaker. Internal consistency decreases as self-continuity increases, intensifying disconnection from others’ utterances while continuing to state only one’s own arguments.
A chain of arguments and counterarguments is a phenomenon in which arguments and counterarguments appear in succession. Interactive, continuous arguments and counterarguments to the other’s utterances improve internal consistency. Lee (2010) [1] showed that the contents of discussions intensify as the arguments and counterarguments proceed.
We found that the topics of the debate can be segmented based on the parts in which the internal consistency, the coherence between utterances, is high. This is because even in the studies of topic segmentation in the past, texts were separated based on the connectivities between words, sentences, or utterances, that is, consistency.
Additionally, in TV debates where the role of the moderator is emphasized concerning the progress of the discussion, the topics are sometimes introduced by the moderator. Na (2003) [40] stated that one of the main roles of the moderator is to raise issues to be discussed by the debaters. Lee (2010) [41] stated that the moderator presents topics, organizes the debate, and adjusts the direction of the discussion. Based on these points, we also included the topic guide of moderator as a property that affects the internal consistency of debate.
Moreover, while examining communication theories that analyze the interactions of speakers, we found a correspondence between these theories and the properties that influence the internal consistency of debate. Communication theory is a theory that analyzes the process by which messages create meaning [42,43].
Of these, Fisher’s narrative paradigm, a symbolic interaction theory, analyzes human communication with the concept of “narrative”, that is, “story” [44,45]. Fisher argued that narrative rationality is maintained only when narrative coherence, which is the internal consistency of narrative, is maintained. Since debate is also narrative, this corresponds to the need to maintain the internal consistency of debate.
Among studies on conversational analysis that analyzes interactions in discourse, Grice proposed the cooperative principle between speakers for their talk to have conversational coherence [46]. Among the principles of achieving cooperation, the principle of relevance means that an individual’s opinion must be appropriate for conversation in a situation at every moment, and that relevance is violated when an opinion that is irrelevant in the conversation is made. The principle of relevance corresponds to other-continuity considering the other person’s discourse, and self-continuity of only speaking one’s own words rather than considering the other side’s discourse.
Studies of the functional theory of decision making in group communication have suggested functionalist conditions that must be satisfied for good decision making  [47,48,49]. Among these are the condition of “establishing goals and objectives”, which corresponds to the attribute that the moderator introduces topics and establishes the goals and objectives of debate, and the condition of “evaluating positive and negative attributes related to alternative choices”, corresponding to evaluating positive and negative attributes related to alternative choices through a chain of arguments and counterarguments in debate.

3. Research Objectives and Methods

Based on the research question of whether there is a relationship between topic segmentation in debate, conceptual recurrence, and the properties influencing the internal consistency of debate, our purpose is to investigate the effect of topic segmentation in debates using the conceptual similarity of conceptual recurrence and metrics influencing the internal consistency of debate. Based on this investigation, we provide users ways to adjust the weights of similarity cohesion methods that aggregate conceptual similarities, and debate consistency metrics that quantify the properties that affect the internal consistency, thereby suggesting a user-driven topic segmentation model. Through this model, it is intended to alleviate the problem of judging the topic segmentation points differently for each person in debate and multi-party discourse.
As shown in Figure 2, methods to achieve this research purpose are as follows. First, preprocessing is performed to refine data for implementation of CSseg. Based on the collected debate transcript, errors in the transcript are removed, and a data structure is created by morphological analysis and sentiment analysis. Based on these refined data, conceptual recurrence is implemented.
Second, based on the pre-processed data, we suggest similarity cohesion methods “Plane”, “Line”, “Point”, and “Plane + Line + Point”, which are methods to aggregate conceptual similarities, and implement a topic segmentation model based on these methods.
Third, based on the pre-processed data, we suggest quantified metrics of “other-continuity”, “self-continuity”, “chain of arguments and counterarguments”, and “topic guide of moderator”, which are attributes that affect internal consistency for influencing topic segmentation.
Fourth, we implement the user-driven topic segmentation model CSseg by providing users ways to adjust the weights of similarity cohesion methods and debate consistency metrics. CSseg is designed based on the social science studies of the debate analysis, especially internal consistency properties, but there were no direct collaborations with domain experts such as journalists or social scientists in the design process due to some constraints in the experimental environment.
CSseg can also be used in asynchronous debates because the properties affecting internal consistency, which are the basis of debate consistency metrics, arise from the interactions of the participants even under non-real-time condition. On the other hand, since the properties affecting internal consistency of debate is shown in the interactions between the participants, it can only be used in dialogues, not monologues.
Fifth, we evaluate how consistent CSseg is with people’s topic segmentation points, and further evaluate the comparative evaluation with LCseg, a topic segmentation model for existing multi-party discourse. Finally, through a case analysis of debate consistency metrics, we analyze the contents of sub-topics divided by the properties that affect the internal consistency of debate.

4. Data and Preprocessing

We selected transcripts of the Korean TV debate program MBC 100-Minute Debate as data for a prototype implementation of CSseg. Participants in the debate usually consist of one moderator and four (or six) debaters. The MBC 100-Minute Debate is a public discourse that takes place within the constraints of the number of participants, the order of speeches, and time, and is a planned discourse in which a topic likely to arouse controversy in politics, economy, society, and culture is given in advance [38]. The MBC 100-Minute Debate has the characteristics of the results analyzed in the social science research on TV debates as follows. In the TV debates, one topic is dealt with from various aspects, or the topic is divided into several subtopics to exchange opinions [37]. When arguments and counterarguments abound, and an argument expands to a local problem, the debate may deviate from the given topic or out of context. In these cases, a new topic can be introduced by the debaters or moderator [38].
The transcripts are provided on its home page [50]. We preprocessed the transcripts to fit the Korean language. We used Korean, but conceptual recurrence and CSseg can theoretically be implemented in both English and Korean languages. The difference in implementation is that in Korean, it is easy to consider morphological analysis to find unique words.
The original transcripts had errors in which the same contents were repeatedly written, so these were corrected using regular expressions. Based on the corrected transcript, we organized a data structure for each speaker’s utterance unit, as shown in Figure 3.
We made a term list of words to be used in conceptual recurrence based on the organized data of the transcript. In English, the term list consists of all unique words, excluding stopwords and punctuation that do not separate sentences according to the existing method proposed by Angus, Smith, and Wiles (2011) [10].
In addition, since transcripts of MBC 100-Minute Debate are written in Korean, we made a term list suitable for Korean. First, Korean morphological analysis was conducted on the utterance contents of the transcript as in the case of Figure 4. The morphological analysis automatically predicts the types of morphemes, which is the smallest meaningful unit. We put morphemes corresponding to general nouns (NNG) or proper nouns (NNP) among the morphemes produced by morphological analysis into the term list to be used for conceptual recurrence because, in Korean morphological analysis, these morphemes are the main semantic elements of sentences, including the stems of verbs, adjectives, and adverbs in addition to nouns. Further, morphemes that were judged not to cover the main contents of the debate, such as “talking”, “today”, and “now”, were treated as stopwords even if they were included in the NNG and NNP, and were excluded from the term list.
We conducted the Korean morphological analysis using an open API that provides artificial intelligence technology and data developed through the R&D project of the Ministry of Science and ICT of Korea to be used for research purposes [51]. The results of morphological analysis were produced from the BERT (Bidirectional Encoder Representations from Transformers) language model developed by reflecting the characteristics of Korean.
Next, we collected positive and negative sentiment information for each sentence of utterances using a machine learning model for sentiment analysis of Google’s natural language API [52]. Each sentence has a sentiment value between −1 and 1. The closer the value is to −1, the more negative sentiment it has, and the closer it is to 1, the more positive sentiment it has; the closer it is to 0, the more neutral it is. This sentiment information is used to find parts of utterances where arguments and counterarguments continue, as shown in Section 6.3.3.

5. Conceptual Recurrence and Conceptual Similarity

Since we propose a topic segmentation model based on conceptual recurrence, we implemented conceptual recurrence following the implementation method suggested by Angus, Smith, and Wiles (2011) [10]. Conceptual recurrence is a technique and visualization method to analyze the similarity between utterances.
In conceptual recurrence, an utterance is expressed as a vector consisting of key terms. The value for each key term is calculated by conceptualizing the word, and this value is obtained by combining words that are conceptually similar even if they are not the same word. The dot product of two vectors representing utterances is the conceptual similarity, indicating the similarity between the two utterances. Conceptual recurrence can be visualized as in Figure 5 based on conceptual similarities.
Conceptual similarity is a value that quantifies the similarity between two utterances, such that the higher the value of conceptual similarity, the higher the similarity between the two utterances. Conceptual similarity depends on how well the two utterances match the values of key terms representing the debate. Specifically, an utterance is expressed as a vector consisting of values for key terms, and the dot product of the vectors yields conceptual similarity.

6. CSseg Algorithm

We propose a topic segmentation method with the basis of the research questions Q1 and Q2. Section 6.1 and Section 6.2 describe the approach to Q1. Section 6.3 describes the approach to Q2. Section 6.4 describes the result of combining Q1 and Q2.
  • Q1: Relationship between topic segmentation and conceptual similarity.
  • Q2: Relationship between topic segmentation and debate consistency metrics.
The outline of the topic segmentation model CSseg is as follows. First, CSseg finds small sets of topic segments for segmenting the utterances (Section 6.1). The topic segment means a part of the utterances segmented from the utterances of the entire transcript as a single topic, while a small set of topic segments means that two adjacent topic segments are referred to as one unit. Second, CSseg calculates the similarity cohesion for each small set of topic segments (Section 6.2). The similarity cohesion is a value indicating how cohesive the conceptual similarities are. Third, CSseg reflects the debate consistency metrics on similarity cohesion (Section 6.3). Fourth, it finds the small set of topic segments with the highest similarity cohesion, and the topic segments of the small set become newly separated topic segments (Section 6.4). The topic segments are then derived by iterating the above four steps (Section 6.1, Section 6.2, Section 6.3 and Section 6.4).

6.1. To Find Small Sets of Topic Segments

CSseg finds small sets of topic segments for segmenting the utterances. A small set of topic segments means a set having two topic segments. As shown in Figure 6, if the number of utterances is six, four small sets of topic segments are generated. The reason for finding such small sets of topic segments is to search for a boundary between topic segments.

6.2. Similarity Cohesion

As discussed in Section 2.4, we judged segments with high conceptual similarities as referring to the same topic based on semantic consistency and interactions of debaters. Semantic consistency is the coherence of a central theme between successive utterances. The higher the semantic consistency, the higher the internal consistency between utterances. In order for the interaction between debate participants to be considered a genuine dialogue, their discourse must be mutually determined in terms of content. These characteristics are the basis for positing that a segment with high conceptual similarities of conceptual recurrence indicating reciprocity of utterances can be considered as one conversation, that is, one topic.
The basic idea of calculating the degree of cohesion of conceptual similarities, that is, similarity cohesion, is to divide the sum of conceptual similarities for a topic segment by the number of conceptual similarities as shown in the following equation:
( similarity cohesion of a topic segment ) = s u m ( t ) c o u n t ( t )
where t denotes a topic segment, s u m is a function that calculates the sum of conceptual similarities, and c o u n t is a function that counts the number of conceptual similarities. The function s u m is covered in detail in Section 6.2.1, and the function c o u n t is covered in detail in Section 6.2.2.

6.2.1. Sum of Conceptual Similarities

The sum of the conceptual similarities corresponds to the numerator in the formula for calculating the similarity cohesion. We propose three methods for calculating the sum of the conceptual similarities of a topic segment: Plane, Line, and Point. Through these, we additionally propose a method of combining the properties of the three methods.

Method 1: Plane

The Plane method is a method to sum all conceptual similarities in a topic segment as shown in Figure 7.
The formula for calculating the sum of the conceptual similarities of the Plane method is as follows:
( sum of conceptual similarities by Plane method ) = j = 2 N i = 1 j 1 p l a n e ( i , j ) · S ( i , j )
i means the row index, and j the column index. N is the number of utterances in a topic segment. S ( i , j ) is a conceptual similarity between the i-th utterance and the j-th utterance. p l a n e ( i , j ) is a function that assigns a weight to the conceptual similarity between the i-th and j-th utterances. The formula for p l a n e ( i , j ) is as follows:
p l a n e ( i , j ) = p l a n e W e i g h t
In the Plane method, all conceptual similarities are added, so the conceptual similarities for all i and j are included. p l a n e W e i g h t means the weight to be applied to the conceptual similarity in the Plane method. Since CSseg is a topic segmentation model through the user interaction from the perspective of visual analytics, the p l a n e W e i g h t can be specified by the user.

Method 2: Line

The Line method is a method of adding conceptual similarities belonging to the edge of a topic segment’s area in the form of “L”, as shown in Figure 8. We devised the Line method by discovering a pattern of high conceptual similarities between major utterances and other utterances in adjacent time zones. This has the effect of separating a transcript based on major utterances that are similar to other utterances.
The formula for calculating the sum of the conceptual similarities of the Line method is as follows:
( sum of conceptual similarities by Line method ) = j = 2 N i = 1 j 1 l i n e ( i , j ) · S ( i , j )
i is the row index, and j the column index. N is the number of utterances in a topic segment. S ( i , j ) is a conceptual similarity between i-th utterance and j-th utterance. l i n e ( i , j ) is a function that assigns a weight to the conceptual similarity between the i-th and j-th utterances. The formula for l i n e ( i , j ) is as follows:
l i n e ( i , j ) = l i n e W e i g h t , if 1 i N 1 & j = N l i n e W e i g h t , if i = 1 & 2 j N 0 , otherwise
l i n e W e i g h t means the weight to be applied to the conceptual similarity in the Line method. It can be specified by the user.

Method 3: Point

The Point method is a method of selecting one conceptual similarity at the bottom left of a topic segment area, as shown in Figure 9. We devised the Point method by discovering a pattern of high conceptual similarity between major utterances with high similarity to other utterances. It has the effect of separating a transcript based on major utterances that are similar to other utterances.
The formula for calculating the sum of the conceptual similarities of the Point method is as follows:
( sum of conceptual similarities by Point method ) = j = 2 N i = 1 j 1 p o i n t ( i , j ) · S ( i , j )
i is the row index, and j the column index. N is the number of utterances in a topic segment. S ( i , j ) is a conceptual similarity between i-th utterance and j-th utterance. p o i n t ( i , j ) is a function that assigns a weight to the conceptual similarity between the i-th and j-th utterances. The formula for p o i n t ( i , j ) is as follows:
p o i n t ( i , j ) = p o i n t W e i g h t , if i = 1 & j = N 0 , otherwise
p o i n t W e i g h t means the weight to be applied to the conceptual similarity in the Point method. It can be specified by the user.

Method 4: Plane + Line + Point

In the history of computer science algorithms, some approaches combine the properties of each method when there are several meaningful methods. For example, when managing memory for a process, a method of combining the properties of a fixed-size partitioning method, “paging”, and a logical partitioning method, “segmentation”, can be advantageously combined. Inspired by this idea, we created a combined method that can apply all the properties of the Plane, Line, and Point methods as shown in Figure 10.
The formula for calculating the sum of the conceptual similarities of the combined method is as follows:
s u m ( t ) = j = 2 N i = 1 j 1 ( p l a n e ( i , j ) + l i n e ( i , j ) + p o i n t ( i , j ) ) · S ( i , j )
i is the row index, and j the column index. N is the number of utterances in a topic segment. S ( i , j ) is a conceptual similarity between the i-th utterance and j-th utterance. p l a n e ( i , j ) , l i n e ( i , j ) , and p o i n t ( i , j ) are functions for the Plane, Line, and Point methods described in Methods 1–3 in Section 6.2.1. These functions assign weights to the conceptual similarity between the i and j-th utterances. The equation of the combined method (Plane + Line + Point) corresponds to the function s u m ( t ) representing the sum of the conceptual similarities introduced in Section 6.2.

6.2.2. Count of Conceptual Similarities

The count of the conceptual similarities corresponds to the denominator in the formula for calculating the similarity cohesion. The count varies for each method of summing conceptual similarities, Plane, Line, and Point, because the conceptual similarities used for each method are different. In the case of the Plane method, the count of conceptual similarities is ( N 1 ) · N / 2 , where N is the number of utterances in a topic segment. In the case of the Line method, the count of conceptual similarities is 2 N 3 . In the case of the Point method, the count of conceptual similarities is 1.
Since CSseg can combine the Plane, Line, and Point methods, the count of conceptual similarities is affected by the weight of each method. The formula for calculating the count of conceptual similarities is as follows:
c o u n t ( t ) = ( N 1 ) · N 2 × p l a n e W e i g h t + ( 2 N 3 ) × l i n e W e i g h t + p o i n t W e i g h t
p l a n e W e i g h t , l i n e W e i g h t , and p o i n t W e i g h t are weights applied to the conceptual similarities used in each Plane, Line, and Point method described in Methods 1–3 in Section 6.2.1.This expression corresponds to the function c o u n t ( t ) representing the count of conceptual similarities introduced in Section 6.2 above.

6.3. Debate Consistency Metrics

As we saw in Section 2.4, some properties indicate the debate internal consistency that can affect topic segmentation. These properties are other-continuity, self-continuity, chain of arguments and counterarguments, and topic guide of moderator. In this study, we propose these properties as metrics (quantified numbers.)

6.3.1. Other-Continuity

Other-continuity is the consistency between utterances made in succession by different speakers. The higher the other-continuity, which reflects a debater considering the interlocutor’s utterance, the higher the internal consistency representing the interactional aspect of the debate. We applied the other-continuity metric to the conceptual similarities between different speakers. As shown in Figure 11, if the weight value of the other-continuity metric is increased, the weight of conceptual similarities with others having a close distance is increased. The equation for other-continuity is:
o t h e r ( i , j ) = a p p l i e d W e i g h t , if s p e a k e r ( i ) s p e a k e r ( j ) & a p p l i e d W e i g h t > 1 1 , if s p e a k e r ( i ) s p e a k e r ( j ) & a p p l i e d W e i g h t 1
where , a p p l i e d W e i g h t = o t h e r W e i g h t d i s t a n c e ( i , j ) α
o t h e r ( i , j ) is a function that assigns a weight of other-continuity metric to the conceptual similarity between the i and j-th utterances. s p e a k e r ( i ) represents the speaker of the i-th utterance. o t h e r W e i g h t means a weight to be applied to the conceptual similarities corresponding to other-continuity; it is user-configurable. d i s t a n c e ( i , j ) is a function that calculates the distance between the i and j-th utterances; it returns 0 for adjacent utterances, and it returns after incrementing by 1 whenever another utterance is entered between the i and j-th utterances. The a p p l i e d W e i g h t is a value adjusted so that the smaller the distance between the utterances is, the higher the weight of the other-continuity metric. α is a value designating the degree to which the closer the distance between utterances is, the greater the effect on other-continuity. We applied a l p h a = 10 to the prototype. A comprehensive formula for the similarity cohesion by applying this function o t h e r ( i , j ) is given in Section 6.3.5.

6.3.2. Self-Continuity

Self-continuity is the consistency between an individual speaker’s utterances. When self-continuity increases, where the disconnect from the previous statement is deepened by only speaking one’s own words rather than considering the other person’s utterances, internal consistency decreases. We applied self-continuity to the conceptual similarity between utterance of the same talker. As shown in Figure 12, if the weight value of self-continuity is lowered, the weight of the conceptual similarities corresponding to self-continuity decreases as the distance between utterances increases. The equation for self-continuity is:
s e l f ( i , j ) = s e l f W e i g h t , if s p e a k e r ( i ) = s p e a k e r ( j ) & a p p l i e d W e i g h t s e l f W e i g h t a p p l i e d W e i g h t , if s p e a k e r ( i ) = s p e a k e r ( j ) & a p p l i e d W e i g h t > s e l f W e i g h t & a p p l i e d W e i g h t < 1 1 , if s p e a k e r ( i ) = s p e a k e r ( j ) & a p p l i e d W e i g h t > s e l f W e i g h t & a p p l i e d W e i g h t 1
where , a p p l i e d W e i g h t = 1 + β d i s t a n c e ( i , j ) α
s e l f ( i , j ) is a function that assigns a weight of self-continuity metric to the conceptual similarity between the i and j-th utterances. s p e a k e r ( i ) represents the speaker of the i-th utterance. s e l f W e i g h t means a weight to be applied to the conceptual similarities corresponding to self-continuity; it is user-configurable. d i s t a n c e ( i , j ) is a function that calculates the distance between the i and j-th utterances. It returns 0 for adjacent utterances. Then it returns after incrementing by 1 whenever another utterance is entered between the i and j-th utterances. The a p p l i e d W e i g h t is a value adjusted so that the greater the distance between the utterances, the more it is affected by the weight of self-continuity metric. α is a value designating the degree to which the greater the distance between utterances, the greater the effect on self-continuity. β is a value that specifies the distance between utterances at which self-continuity is applied. We applied α = 10 and β = 10 to the prototype. A comprehensive formula for the similarity cohesion by applying this function s e l f ( i , j ) is given in Section 6.3.5.

6.3.3. Chain of Arguments and Counterarguments

The chain of arguments and counterarguments is a phenomenon in which assertions and rebuttals appear consecutively. Reciprocal and continuous arguments and counterarguments of the other’s utterances improve internal consistency. As shown in Figure 13, if the weight value of the chain of arguments and counterarguments is increased, the weight of conceptual similarities composed of utterances that are the arguments and the counterarguments increases. The red squares near the light green squares are conceptual similarities corresponding to arguments and counterarguments. We propose a chain of arguments and counterarguments by arranging the conditions of argument and counterargument. The conditions are as follows:
  • An utterance containing a counterargument refutes the utterance of the other party. Lee (2010) [41] reported that participants with opposing views on a topic were divided into two sides in the debate program, each claiming the legitimacy of their own opinion and adducing the problems of the other’s opinion based on logical grounds. This means that the participants rebut the utterance of the other party.
  • The utterance of the counterargument has negative sentiment. There is a high possibility of using negative emotional words and sentences such as “no” when refuting the other person’s argument. Kim (2009) [38] stated that while making arguments and counterarguments, the debaters explicitly raise the inconsistency of the opposing debater’s argument. As per Lee (2010) [1], debaters point out and attack the weak points or contradictions of the other side’s position when making arguments and counterarguments. This characteristic means that there may be negative emotional vocabulary in the utterances of counterarguments, and further implies that the emotions of utterances may be judged as negative.
  • An utterance attacked by the other speaker has significant length. Kim (2009) [38] posited that a counterargument is based on the content of the opposing debater’s argument. We thus judged that if an utterance has an argument, it has a certain length.
  • Meaningful counterargument leads to a high conceptual similarity between the utterances of the argument and counterargument. Kim (2009) [38] posited that a speaker inserts the other speaker’s words into his/her utterance to make a counterargument. In this case, arguments or lexical elements that seem specific to the disputing speaker are cited. These properties imply that the argument speaker’s utterance and counterargument speaker’s utterance have the same words or concepts. Through this, we judged that a meaningful counterargument can be achieved only when the conceptual similarity between the argument speaker’s utterance and the counterargument speaker’s utterance is of a certain magnitude.
  • An utterance containing a counterargument is at a certain distance from an utterance containing an argument. Kim (2009) [38] posited that counterarguments from ongoing conversations improve internal consistency rather than conversations that have taken place in the past. Based on this, we judged that a meaningful counterargument is only to be judged so when the distance between the argument’s utterance and the counterargument’s utterance is small.
The formula for selecting the conceptual similarities corresponding to the argument and the counterargument based on these conditions is as follows:
c h a i n ( i , j ) = c h a i n W e i g h t , if s i d e ( i , j ) n e g a t i v e ( j ) l o n g ( i ) s i m i l a r i t y ( i , j ) c l o s e ( i , j ) r i g h t ( i , j ) 1 , otherwise
c h a i n ( i , j ) is a function that searches for conceptual similarities when the i-th utterance contains an argument and the j-th utterance contains a counterargument. A weight c h a i n W e i g h t is given to conceptual similarities with conditions corresponding to argument and counterargument; this weight is user-configurable. ∧ stands for “logical and”; it returns “true” only if both the left and right conditions are true, and “false” for all other conditions. The formulas for the conditional functions s i d e ( i , j ) , n e g a t i v e ( j ) , l o n g ( i ) , s i m i l a r i t y ( i , j ) , c l o s e ( i , j ) , r i g h t ( i , j ) that search for assertions and refutations are as follows:
s i d e ( i , j ) = T r u e , if speaker of u i and speaker of u j are not on the same side F a l s e , otherwise
n e g a t i v e ( j ) = T r u e , if k = 1 l s e n t e n c e S e n t i m e n t ( k ) α F a l s e , otherwise
where , s e n t e n c e S e n t i m e n t ( k ) = s e n t i m e n t S c o r e , if s e n t i m e n t S c o r e β 0 , otherwise
l o n g ( i ) = T r u e , if ( number of characters of i - th utterance ) γ F a l s e , otherwise
s i m i l a r i t y ( i , j ) = T r u e , if S ( i , j ) δ F a l s e , otherwise
c l o s e ( i , j ) = T r u e , if d i s t a n c e ( i , j ) ϵ F a l s e , otherwise
r i g h t ( i , j ) = T r u e , if k = i + 1 j 1 i s C h a i n ( k , j ) = 0 F a l s e , otherwise
where , i s C h a i n ( i , j ) = 1 , if s i d e ( i , j ) n e g a t i v e ( j ) l o n g ( i ) s i m i l a r i t y ( i , j ) c l o s e ( i , j ) r i g h t ( i , j ) 0 , otherwise
s i d e ( i , j ) is a function that returns “true” if the speaker of the i-th utterance u i and the j-th utterance u j are on the other side, and “false” otherwise. This is specified manually rather than automatically calculated by the machine. n e g a t i v e ( j ) is a function to judge whether the j-th utterance has negative sentiment. In n e g a t i v e ( j ) , l is the number of sentences in an utterance. s e n t e n c e S e n t i m e n t ( k ) is a function that returns a negative sentiment value or probability of k-th sentence less than β . Its value or probability varies depending on the type of sentiment analysis model. If the sum of all negative sentiment scores of the sentences in the utterance is less than α , it is determined that the utterance has a negative sentiment. For the prototype, α = 0.5 and β = 0.25 are specified based on Google’s natural language sentiment analysis model. l o n g ( i ) is a function that determines whether the length of the i-th utterance is long enough to be refuted. The unit of utterance’s length in l o n g ( i ) is the number of characters. In the prototype, γ = 100 . s i m i l a r i t y ( i , j ) is a function that determines whether the conceptual similarity between the argument’s utterance and the counterargument’s utterance is higher than a certain level of δ . In the prototype, δ = 0.3 . c l o s e ( i , j ) is a function that determines whether an utterance containing a counterargument is at a certain distance from an utterance containing an argument. In c l o s e ( i , j ) , d i s t a n c e ( i , j ) is a function that calculates the distance between the i-th and j-th utterances. The distance between adjacent utterances returns 0 and increases by 1 each time another utterance is entered between the i and j-th utterances, and then returns. ϵ is a value that determines whether the distance is small, and it is set to 10 for the prototype. r i g h t ( i , j ) is a function that searches for the conceptual similarity of argument and counterargument among the utterances u i + 1 u j 1 . We devised r i g h t ( i , j ) because if there is an utterance that has already been refuted, it is difficult to directly refute an utterance earlier than that. Constants of Greek letter α , β , γ , δ , ϵ are judged during the prototype implementation process, because these constants only need to maintain a certain level of value. For example, ϵ , which indicates the level at which the distance between utterances is judged to be close, may be slightly different for each debate and may be judged differently by each implementer. A comprehensive formula for the similarity cohesion by applying this function c h a i n ( i , j ) is given in Section 6.3.5.

6.3.4. Topic Guide of Moderator

The topic guide of moderator is the property whereby the moderator gives debaters the direction of the topic of the debate. Na (2003) [40] stated that one of the main roles of the moderator is to raise issues to be discussed by the debaters. Lee (2010) [41] analyzed the moderator as presenting the topic, organizing the debate, and adjusting the direction of the debate. Based on these studies, we propose a metric for the topic guide of moderator. We judged that the probability of presenting a topic is high if the moderator speaks a large enough utterance to present a topic. As shown in Figure 14, if the weight value of the topic guide of moderator is increased, the weights of the conceptual similarities including moderator’s utterance are increased. The equation for the topic guide of moderator is:
m o d e r a t o r ( i , j ) = m o d e r a t o r W e i g h t , if i s M o d e r a t o r ( i ) l o n g ( i ) m o d e r a t o r W e i g h t , if i s M o d e r a t o r ( j ) l o n g ( j ) 1 , otherwise
where , i s M o d e r a t o r ( k ) = T r u e , if k th utterance is spoken by moderator F a l s e , otherwise
where , l o n g ( i ) = T r u e , if ( number of characters of i th utterance ) γ F a l s e , otherwise
m o d e r a t o r W e i g h t means the weight to be applied to the conceptual similarities that correspond to the topic guide of moderator; it is user-configurable. i s M o d e r a t o r ( k ) is a function that determines whether the k-th utterance is that of the moderator. l o n g ( i ) represents a function that determines whether the length of the i-th utterance is sufficient to present a topic, and the unit of utterance’s length is the number of characters. For the prototype, the γ value of l o n g ( i ) was specified as 100. A comprehensive formula for the similarity cohesion by applying this function m o d e r a t o r ( i , j ) is given in Section 6.3.5.

6.3.5. Similarity Cohesion Applied to Debate Consistency Metrics

If we redefine the equation by applying the debate consistency metrics to the function s u m ( t ) that calculates the sum of conceptual similarities described in Method 4 in Section 6.2.1, the formula is as follows:
s u m ( t ) = j = 2 N i = 1 j 1 ( p l a n e ( i , j ) + l i n e ( i , j ) + p o i n t ( i , j ) ) · ( o t h e r ( i , j ) · s e l f ( i , j ) · c h a i n ( i , j ) · m o d e r a t o r ( i , j ) ) · S ( i , j )
s u m ( t ) refers to a function that calculates the sum of the conceptual similarities of the topic segment t by applying the debate consistency metrics. ( p l a n e ( i , j ) + l i n e ( i , j ) + p o i n t ( i , j ) ) is a formula that combines the methods of calculating the sum of conceptual similarities described in Method 4 in Section 6.2.1. ( o t h e r ( i , j ) · s e l f ( i , j ) · c h a i n ( i , j ) · m o d e r a t o r ( i , j ) ) is a formula for the debate consistency metrics described in Section 6.3.1, Section 6.3.2, Section 6.3.3 and Section 6.3.4. S ( i , j ) indicates the conceptual similarity between the i-th utterance and the j-th utterance.

6.4. To Find the Small Set of Topic Segments with the Highest Similarity Cohesion

So far, in the previous section, we have described the similarity cohesion of one topic segment, such as (sum of conceptual similarities)/(count of conceptual similarities). However, in practice, CSseg’s topic segmentation method is to calculate the similarity cohesion in units of a small set of topic segments and find the small set of topic segments with the highest degree of similarity cohesion. As shown in Figure 15, the two red squares represent t 1 and t 2 . The blue square represents t. The two red squares are collectively called the small set of topic segments. This means that CSseg does not calculate similarity cohesion of one topic segment, but calculates the similarity cohesion for the small set of two adjacent topic segments. To find the point at which the transcript splits, we judged that the case with the highest similarity cohesion before and after the split point is most likely to be the point at which the topic changes. This means that the similarity cohesion for the part before and the part after of the split point should be considered at the same time. The formula for calculating the similarity cohesion of a small set of topic segments is as follows:
( similarity cohesion of a small set of topic segments ) = ( s u m ( t 1 ) + s u m ( t 2 ) ) ( c o u n t ( t 1 ) + c o u n t ( t 2 ) ) × c o u n t ( t )
A small set of topic segments consists of two adjacent topic segments t 1 and t 2 . s u m is a function that calculates the sum of conceptual similarities (Section 6.3.5), and the c o u n t is a function that calculates the count of conceptual similarities (Section 6.2.2). t denotes a parent topic segment that includes the two topic segments t 1 and t 2 of a small set of topic segments. A count of conceptual similarities of the parent topic segment t is included in the formula to preferentially divide the transcript in a larger area. A graphical representation of similarity cohesion is shown in Figure 16.
The split point of the topic segments in a small set of topic segments with the highest similarity cohesion becomes the topic segmentation point. If this process is repeated n times, n topic segmentation points and n + 1 topic segments are generated. This method expressed in pseudocode is shown in Appendix A.

7. User Interface

The user interface consists of three parts: the controller, conceptual recurrence visualization, and transcript viewer. First, a controller with functions that affect topic segmentation is shown in Figure 17a. (a-1) controls the number of topic segments. (a-2) can adjust the weights of the similarity cohesion calculation methods described in Section 6.2.1. “Plane” controls p l a n e W e i g h t , “Line” controls l i n e W e i g h t , and “Point” controls p o i n t W e i g h t . (a-3) can adjust the weights of debate consistency metrics. In (a-3), the user can adjust the weights described in Section 6.3. “Other-continuity” controls the weight of other-continuity, “Self-continuity” controls the weight of self-continuity, “Chain of arguments and counterarguments” controls the weight of chain of arguments and counterarguments, and “Topic guide of moderator” controls the weight of topic guide of moderator.
The visualization of conceptual recurrence representing all utterances, conceptual similarities, and topic segments is shown in Figure 17b. (b-1) is one utterance of a participant. To distinguish each participant, a different color is assigned to each participant. The colors for conceptual recurrence are motivated by previous studies. But to help the user recognize the positions of the debaters on the flow of debate, blue range colors are assigned to the debaters who have one opinion, and red range colors are assigned to the debaters who have the other opinion. The moderator is assigned achromatic black. For example, in the MBC 100-Minute Debate “Is the era of basic income really coming?”, debaters in favor of basic income are assigned the blue range colors including cyan and blue, and debaters who opposed it are allocated the red range colors including orange and purple. The user can view the contents of the utterance when mouse over the utterance square. If the user clicks on an utterance square, only conceptual similarities formed by the participant can be filtered and viewed. If the user clicks two utterance squares, only conceptual similarities between the two participants can be viewed in the filter. For example, as shown in Figure 18, the user can check only the conceptual similarities between Jaemyung Lee and Sehun Oh by clicking their participant squares.
(b-2) is the conceptual similarity, indicating the similarity of utterances, where the deeper the color saturation, the higher the conceptual similarity value. Since areas with high conceptual similarities become topic segments, conceptual similarities with high values are highly color-saturated so that users can understand why topic segments are formed. When the user changes a weight in the controller, the color saturation of the conceptual similarities of the property related to the weight also changes. If topic segments have changed, the user can recognize the reason through the distribution of color saturation of the changed conceptual similarities. If the user mouseovers conceptual similarity, the user can check details of conceptual similarity such as conceptual similarity value, applied weights of consistency metrics, the index i, j, and key terms in the order that affects the conceptual similarity the most, as shown in Figure 19. (b-3) is a topic segment into which CSseg automatically divided the transcript. (b-4) is terms derived from the most frequently mentioned within utterances of a topic segment. These terms are called the labels of a topic segment.
Figure 17c represents the transcript viewer showing the content of the participants’ utterances. All contents of utterances are shown in chronological order.

8. Performance Comparison and Evaluation

We compared the topic segmentation results of CSseg with the topic segmentation results generated by human judgment and evaluated the results of the existing topic segmentation model LCseg [26] for multi-party discourse. In addition to the combined method (Plane + Line + Point), CSseg was evaluated for the similarity cohesion calculation methods Plane, Line, and Point, individually, and the results of applying the weights of debate consistency metrics twice for these methods were also evaluated. We used P k  [53] and W D  [54] as metrics for comparing topic segmentation points.

8.1. Experiment Environment

The debates used in the experiment are the three debates, “Is the era of basic income really coming?” (basic income), “The re-emergence of the volunteer military system controversy” (military), and “Controversy over expanding the College Scholastic Ability Test: What is fair?” (SAT), of the MBC 100-Minute Debate. To increase the concentration of the subjects in the experiment, we selected the amount of time for the experiment from the beginning of the debate until the audiences’ opinion is introduced.
We collected points where the subjects separated the transcript into sub-topics as they watched the video of the debate. For each debate, seven subjects were recruited to split the transcript of the debate into sub-topics. The subjects were Koreans, comprising male and female adults in their 20 s and 50 s who can speak Korean and are living in Korea and are current with Korean society.
We explained to the subjects that the purpose of the experiment is to find the topic segmentation point while watching one episode of the MBC 100-Minute Debate TV program from the beginning to the suggested point. In addition, the experiment was started after explaining that topic segmentation in a debate is the act of dividing the flow of conversation into issues or sub-topics, and asking the subject to find and mark an appropriate topic segmentation point in their opinion.
The user interface for conducting the experiment consists of as shown in Figure 20. When the subjects watched the TV debate in the interface environment and judged that it was a topic segmentation point, they marked a checkbox in each sentence of the transcript on the right. The colors painted on the transcript represent sub-topics.
The topic segmentation points of subjects derived through this experiment are shown in Figure 21, Figure 22 and Figure 23. Each horizontal line indicates the topic segmentation points of one subject, and each number indicates the sentence index of the topic segmentation point. The colored sentence index is the point at which three or more subjects divided transcript in the same place within one sentence or less.
Based on Litman and Passonneau’s [53] analysis that three out of seven coincident topic segmentation points can be judged as the main topic segmentation point, the topic segmentation points of the seven subjects were aggregated, and three or more matching points were selected as human topic segmentation points. In this way, as shown in Figure 24, the number of topic segments was seven for “basic income”, eight for “volunteer military system”, and nine for “SAT”. At this time, although CSseg is an utterance-based topic segmentation model, we received the topic segmentation points in sentence units from the subjects to ensure more specific results, and the LCseg model to be compared is a sentence-based topic segmentation model. In addition, topic segmentation points with a difference of one sentence were judged to be separated at almost the same places, and when the topic segmentation results were combined, they were calculated as the same topic segmentation point.

8.2. Evaluation Metrics

We compared CSseg and LCseg through the comparative evaluation metrics P k  [54], W D  [55] based on the subjects’ topic segmentation points. Smaller values of P k and W D metrics denote higher agreement between subject and model. P k is a metric whose value decreases as there are more points where subject and model’s results indicate that the topic changes at a similar position. W D is similar to P k , but it has the characteristic of more sensitively searching for differences between the results of subject and model within the topic segmentation measurement range.
P k ( r e f , h y p ) = 1 N k i = 1 N k ( δ ( r e f i , r e f i + k ) δ ( h y p i , h y p i + k ) )
W D ( r e f , h y p ) = 1 N k i = 1 N k | b ( r e f i , r e f i + k ) b ( h y p i , h y p i + k ) |
N is the total count of sentences. k is probe interval. The δ ( i , i + 1 ) of P k is 1 if the i-th sentence and i + k -th sentence are determined to be the same topic, and 0 if they are determined to be different topics. ⊕ is the XOR symbol which returns 1 if they are different and 0 if they are equal. b ( i , i + k ) of W D is the number of topic segmentation points in the i i + k -th sentence. For example, in Figure 25, b of r e f returns 1 in (a), 0 in (b) and (c), and 2 in (d).

8.3. LCseg

LCseg is a representative topic segmentation model for multi-party discourse based on simplified lexical chains [56] that forms a chain by connecting the same words that appear in sentences with similar positions. Since the debate is also included in the multi-party discourse, we intend to evaluate the performance of the two models, CSseg and LCseg, in the debate.
The implementation method of LCseg is as follows. p ( m i ) is the possibility of topic segmentation at i-th sentence index. This allows the selection of topic segmentation points in the order of p ( m i ) .
p ( m i ) = 1 2 [ L C F ( l ) + L C F ( r ) 2 × L C F ( m ) ]
The sentence index m is the currently specified index, l is the left index of m, and r is the right index of m. L C F (Lexical Cohesion Function) is a function that calculates the degree of cohesion between sentence windows A and B based on lexical chains. A sentence window is a set of adjacent sentences that moves one sentence at a time when moving to the next sentence window. The number of sentences included in each sentence window was set to 2, as in the previous study. The formula for LCF is:
L C F = c o s i n e ( A , B ) = i w i , A × w i , B i w 2 i , A i w 2 i , B
where , w i , Γ = s c o r e ( R i ) if R i overlaps Γ { A , B } 0 otherwise where , s c o r e ( R i ) = f r e q ( t i ) × l o g ( L L i )
R i is a lexical chain of a word. The lexical chains used here are simplified as shown in Figure 26. s c o r e ( R i ) is a function that calculates the score for the lexical chain of a word in both sentence windows A and B. f r e q ( t i ) means the total frequency of the i-th term in the transcript. L means the total number of sentences in the transcript. L i means the number of sentences with t i . Finally, hiatus, the distance value separating the lexical chain, was set to 11 as in the previous study.
CSseg was implemented in the way described in Section 6. Among the methods of CSseg to be applied in the experiment, when the similarity cohesion calculation methods Plane, Line, and Point were combined, the weights of each method were applied in a 1:1:1 ratio. To increase the internal consistency of the debate, when applying the weight of the debate consistency metrics, the weights of other-continuity, chain of arguments and counterarguments, and topic guide of moderator were set at 2 ( o t h e r W e i g h t , c h a i n W e i g h t , m o d e r a t o r W e i g h t ), and the weight of self-continuity s e l f W e i g h t at 0.5.

8.4. Experimental Results

We conducted experiments based on the description in the sections above. The P k and W D values were derived after unifying the number of topic segmentation points in CSseg and LCseg according to the number of topic segmentation points aggregated from the subjects. First, the method for calculating similarity cohesion is a combined method in which the weights of Plane, Line, and Point are applied in a 1:1:1 ratio. The weights of other-continuity, chain of arguments and counterarguments, and topic guide of moderator are all 2, and the weight of self-continuity is 0.5. Table 1 shows the P k and W D values of CSseg to which all properties of CSseg are applied, and LCseg, the existing topic segmentation model for multi-party discourse. CSseg leads LCseg by about 5–6% on “basic income”, about 4–5% on “volunteer military system”, and about 2–3% on “SAT”. For all three debates, CSseg showed good results.
Figure 27 shows the topic segments of CSseg for which Plane, Line, and Point are combined and the debate consistency metrics are applied. The red squares represent topic segments divided by CSseg, and the blue squares represent the topic segments aggregated by seven subjects. Figure 28 shows the topic segments of LCseg. The yellow squares represent topic segments divided by LCseg, and the blue squares represent the topic segments aggregated by seven subjects.
Next, we derived P k and W D by applying each method and debate consistency metric separately to determine how CSseg’s method of calculating similarity cohesion and each debate consistency metric affect the topic segmentation result. Table 2 shows P k and W D for each similarity cohesion calculation method without applying the debate consistency metric. CSseg’s Plane was the method that consistently and best derived the values of P k and W D in the three debates.
Table 3 shows the P k and W D values for CSseg by applying 2 to the weights of other-continuity, chain of arguments and counterarguments, and topic guide of moderator, and 0.5 to the weight of self-continuity, which are the debate consistency metrics. CSseg with Plane + Line and Line + Point were the methods that consistently and best derived the values of P k and W D in the three debates.
Table 4 shows CSseg P k and W D values with the weight of other-continuity applied as 2. None of the three debates consistently yielded the best values of P k and W D .
Table 5 shows the CSseg P k and W D values with the weight of self-continuity set to 0.5. CSseg Line was the method that consistently and best derived the values of P k and W D in the three debates.
Table 6 shows the CSseg P k and W D values with the weight of chain of arguments and counterarguments set to 2. None of the three debates consistently yielded the best values of P k or W D .
Table 7 shows the CSseg P k and W D values with the weight of topic guide of moderator set to 2. CSseg Line and Line + Point were the methods that consistently and best derived the values of P k and W D for the three debates. In addition, when the weight of topic guide of moderator was set, it resulted in more topic segmentation points similar to the points aggregated by the subjects.
Summarizing the experimental results, the cases with the lowest P k and W D in the three debates were Plane + Line and Line + Point, to which all debate consistency metrics were applied, and Line and Line + Point, to which the topic guide of moderator was applied. The result of applying twice the weight of “topic guide of moderator” metric had the effect of becoming similar to the results of the subjects in the three debates. In the case of applying double the weights of “other-continuity”, “self-continuity”, and “chain of arguments and counterarguments” metrics, it was difficult to prove the effect as a criterion ( P k , W D ) for measuring the number of coincident topic segmentation points. However, the effect of each debate consistency metric is given to the conceptual similarities to derive the topic segmentation result, which we analyzed through the use case analysis in the next section.

9. Use Case Analysis

In the use case analysis, to analyze effect of debate consistency metrics in greater depth, the user controls a prototype of CSseg; we describe the characteristics of the topic segmentation results of this process. We analyzed the results of topic segmentation by giving weights to the metrics that affect the internal consistency of debate: “other-continuity and self-continuity”, “chain of arguments and counterarguments”, and “topic guide of moderator”. By comparing the topic segmentation results for the cases where each metric that affects internal consistency of debate was applied with the topic segmentation result when all metrics were weighted, we analyzed which properties mainly affected each section of the debate.
The debate used for the use case is “The re-emergence of the volunteer military system controversy” (military) of the MBC 100-Minute Debates. Among the participants in the debate, there were Jong-dae Kim and Gyeong-tae Jang, who were in favor of a volunteer military system, and Hwi-rak Park and Jun-seok Lee, who were opposed. In Section 8, the debate “military” was used as an experiment, and the number of topic segments derived from subjects was eight. We controlled the number of topic segments for each use case to eight to focus on the effect of debate consistency metrics. The weights of the similarity cohesion methods Plane, Line, and Point were controlled at a ratio of 1:1:1.
For comparison with cases where a weight of each metric is applied, a controller when all weights of debate consistency metrics are applied is shown in Figure 29, and this result of topic segmentation is shown in Figure 30.
Figure 31 shows a result of comparing the case where the weight of topic guide of moderator was doubled and the case where all the weights of debate consistency were applied. Except for two topic segments at the end of the debate, the locations of the topic segmentation points coincided. Among the topic segments that coincided with each other, those in which the moderator initiates a conversation on the topic and those in which the values of conceptual similarities including the moderator are maintained to some extent are A, B, and C.
We analyzed the contents of transcripts of topic segments A, B, and C. In topic segment A, the moderator presented a topic to elicit the panelists’ positions on an imposition of the volunteer military system, and the panelists responded accordingly. For example, the moderator presented the topic, “We will briefly listen to the opinions of debaters on the imposition of volunteer military system, and then proceed with the debate in earnest”. Jong-dae Kim responded to the topic suggested by the moderator by saying, “Unless it is converted into an army that fights based on professionalism, I believe that if we continue to adhere to the current draft system into the future, we will be destroyed”.
In topic segment B, the moderator presented the topic of whether or not the volunteer military policy issue had been raised for electoral purposes, and the panelists responded. For example, to the topic, “That’s why there are suspicions that the volunteer military system was ultimately for elections. What do you think?” Hwi-rak Park responded by saying, “Isn’t that how politicians calculated whether it would help them get some votes or not?”
In topic segment C, the moderator presented the topic of the correlation between the population cliff and the adoption of a volunteer military system, and the panelists responded. For example, the moderator stated, “I asked a question about why the volunteer military system should be adopted when it is a population cliff”. Jong-dae Kim responded to the topic suggested by the moderator by saying, “The smart army should be based on creativity, but this has to be supported by professionalism”. Thus, it could be seen that in topic segments A, B, and C, there are cases where the moderator presented a topic.
Figure 32 shows the result of comparing the case where double weight of “chain of arguments and counterarguments” was applied and the case where all weights of debate consistency were applied. In the middle of the debate, two topic segments were found to be consistent.
We analyzed the contents of the transcripts of topic segments D and E. In topic segment D, arguments and counterarguments continued on the topic of the reduction and elitism of the military. For example, Gyeong-tae Jang insisted, “A volunteer military system leads to soldiers being able to fight properly with protective equipment”, which Hwi-rak Park refuted by saying, “The volunteer military system first and then the quality army later, I don’t think it’s right”.
In topic segment E, arguments and counterarguments continued on the topic of approaches to resolving the problem of arms reduction and youth issues through the volunteer military system. For example, Jong-dae Kim insisted, “This military experience is very valuable to young people who have broken the ladder of class and can’t build their skills because their fathers don’t have money”, and Jun-seok Lee refuted by saying, “The paradox of this is that if the economy is good, volunteer military system is not possible”.
Figure 33 shows the result of comparing the case where a double weight of “other-continuity” and a half weight of “self-continuity” were applied, and the case where all weights of debate consistency were applied. In the middle of the debate, two topic segments D, E were found to be consistent. These overlapping topic segments D, E coincide with the overlapping topic segments D, E when the doubly weighted “chain of arguments and refutation” is applied, which occurs because in the process of refuting the opposing party’s argument, the debater frequently quoted parts of the other side’s utterances.
The topic segments A, B, and C at the beginning of the debate “military” were mainly affected by the “topic guide of moderator”, while topic segments D and E in the middle were mainly influenced by “chain of arguments and counterarguments” and “other-continuity”. Based on the use case analysis results, after applying the metric weight indicating the internal consistency of the debate, it was confirmed that the corresponding property is generally contained in the utterance content when it has high conceptual similarity.

10. Conclusions

Based on the research question of whether there is a relationship between topic segmentation in debate, conceptual recurrence, and the properties affecting the debate internal consistency, we investigated the effect of topic segmentation in debate by using the conceptual similarity of conceptual recurrence and debate consistency metrics, providing a user-centered topic segmentation result by having the user adjust the similarity cohesion calculation methods that aggregate the conceptual similarities and the weights of the debate consistency metrics so as to alleviate the problem of each person judging the topic segmentation points differently in debate and multi-party discourse.
We proposed a topic segmentation method using methods of calculating similarity cohesion based on the conceptual similarities of conceptual recurrence: Plane, Line, Point, and a method combining them, as well as properties indicating the debate internal consistency: other-continuity, self-continuity, chain of arguments and counterarguments, and topic guide of moderator. We conducted a performance comparison experiment by recruiting subjects to segment three Korean TV debates. In the experiment, a combined method (Plane + Line + Point) and the debate consistency metrics which were doubly weighted in the direction of improving internal consistency were applied to CSseg. As a result, CSseg showed good performance in comparison with LCseg. In addition, we determined the contents of the sub-topics segmented based on each property by analyzing use cases where the topic is divided based on properties that affect the debate internal consistency. Based on these use cases, it was confirmed that the corresponding property is generally contained in the utterance content when it has high conceptual similarity.
We propose a semi-automated topic segmentation model in which user and machine can interact. It allows the machine to automatically calculate similarity cohesion, and with the help of the machine, the user can adjust the properties that affect the debate internal consistency and analyze the corresponding topic segmentation results. It is thus a model in which humans and machines cooperate with each other.
The limitations of this study are as follows. Debaters argue fiercely to justify their opinions. Although CSseg can explore sub-topics of debate through visualization based on conceptual recurrence, there is a limitation in that it does not analyze the opinions of each debater for each sub-topic.
CSseg can be used by, e.g., journalists, social scientists, or domain experts on their own. Furthermore, if experiments are conducted with domain experts, it is expected that a more abundant analysis of the research results will be possible. There is a possibility to discover more quantifiable features of conversation beyond debate. If these features are applied to a conversation-related model, it is possible that various application models can be applied in addition to topic segmentation. For example, if prosodic features including cue phrases and participants’ voice tone, stress, facial expression, and motion are considered together, more detailed analysis will be possible due to richer data, and it will have a positive effect on topic segmentation results.
In future research, it will be possible to conduct research on technology and visualization that can explore and analyze each person’s opinions by sub-topic of debate. For example, as the metric weights representing the internal consistency of the debate change, the corresponding conceptual similarities are weighted accordingly. The utterances related to the conceptual similarities to which the weight is applied can be expressed as a vector composed of key terms, and a weight can be applied to the element values of the vector. As these vector values are applied according to these weights, research that constructs relationships and information that can indicate the context of the progress of the debate as well as technology and visualizations that allow exploration and analysis of the key terms of each debater may be implemented.
We would like to suggest other possible follow-up studies. First, the metrics that affect the internal consistency of the debate proposed in the study are used as features of artificial intelligence for conversational skills that analyze the internal elements of a conversation, so that it can be used to create a model that analyzes the internal elements of a conversation. Second, there is a possibility of investigating whether the analysis factors for a given topic, which are derived based on the conceptual similarities and debate consistency metrics, affect the next topic. This is because in debates and discourse, previous topics can influence the following topics. Third, there is a possibility for a debate to be analyzed by clustering the most similar utterances rather than segmenting the transcripts in chronological order. Among debaters, there is a tendency to recap their own arguments by referring back to previous content, which is part of the self-continuity that affects the internal consistency of the debate. Accordingly, it might be possible to proceed with a study that takes a clustering approach that groups the most similar utterances in addition to a topic segmentation method that separates the transcript in chronological order.

Author Contributions

Conceptualization, J.H., S.-W.L. and K.L.; methodology, J.H. and K.L.; software, J.H.; validation, J.H., H.H., S.-W.L. and K.L.; formal analysis, J.H. and H.H.; investigation, J.H., H.H. and S.-W.L.; resources, J.H. and K.L.; data curation, J.H.; writing—original draft preparation, J.H., H.H. and K.L.; writing—review and editing, J.H., S.-W.L. and K.L.; visualization, J.H., H.H. and K.L.; supervision, K.L.; project administration, J.H. and K.L.; funding acquisition, S.-W.L. All authors have read and agreed to the published version of the manuscript.

Funding

This work was supported by the BK21 FOUR program of the National Research Foundation of Korea funded by the Ministry of Education(NRF5199991014091) and the Basic Science Research Program through the National Research Foundation of Korea (NRF) funded by the Ministry of Science and ICT (NRF-2020R1F1A1075605).

Data Availability Statement

The data for prototype of CSseg are in https://drive.google.com/drive/folders/17VVbehCkjGbji6juiznL_7YqTUiEkrzO?usp=sharing, accessed on 10 March 2022.

Acknowledgments

This paper is based on dissertation research completed at Ajou University under the direction of Kyungwon Lee. We would like to thank Rita Sevastjanova and her lab’s members. She introduced us to her lab’s studies of visualization of natural language processing. Their studies inspire us.

Conflicts of Interest

The authors declare no conflict of interest. The funders had no role in the design of the study; in the collection, analyses, or interpretation of data; in the writing of the manuscript, or in the decision to publish the results.

Appendix A. Pseudo Code of CSseg

Algorithm A1 m a k e T o p i c S e g m e n t s .
  • Input  c o n c e p t u a l S i m i l a r i t i e s G r o u p
  •                 n u m b e r O f T o p i c S e g m e n t s
  • Output t o p i c S e g m e n t s
  • Note that the algorithm m a k e T o p i c S e g m e n t s is main algorithm of CSseg. c o n c e p t u a l S i m i l a r i t i e s G r o u p is an array of arrays consisting of conceptual similarities. The conceptual similarities in c o n c e p t u a l S i m i l a r i t i e s G r o u p are formed by total utterances of a debate. The data structure shape of c o n c e p t u a l S i m i l a r i t i e s G r o u p is as follows.
  • conceptualSimilaritiesGroup = [
  •   [ c 1 ],
  •   [ c 2 , c 3 ],
  •   ...
  •   [ ..., c n 1 , c n ]
  • ]
  • c 1 , c 2 , ..., c n are conceptual similarities.
  • n u m b e r O f T o p i c S e g m e n t s is the number of topic segments that the user requests. t o p i c S e g m e n t s is a set of topic segments. A topic segment has same data structure shape as c o n c e p t u a l S i m i l a r i t i e s G r o u p because a topic segment is a part of c o n c e p t u a l S i m i l a r i t i e s G r o u p . Function l e n g t h returns the count of elements of a collection.
1:
topic_segments ← { conceptual_similarities_group }
2:
 
3:
while l e n g t h ( t o p i c S e g m e n t s ) < n u m b e r O f T o p i c S e g m e n t s do
4:
     { n e w T o p i c S e g m e n t s , o l d T o p i c S e g m e n t }
5:
      f i n d N e w T o p i c S e g m e n t s ( t o p i c S e g m e n t s )
6:
    
7:
     t o p i c S e g m e n t s t o p i c S e g m e n t s { o l d T o p i c S e g m e n t }
8:
     t o p i c S e g m e n t s t o p i c S e g m e n t s n e w T o p i c S e g m e n t s
9:
end while
10:
 
11:
return t o p i c _ s e g m e n t s
Algorithm A2 f i n d N e w T o p i c S e g m e n t s .
  • Input  t o p i c S e g m e n t s
  • Output { n e w T o p i c S e g m e n t s , o l d T o p i c S e g m e n t }
  • Note that the algorithm f i n d N e w T o p i c S e g m e n t s is to find new topic segments for finer ones. n e w T o p i c S e g m e n t s is a set consisting of 2 topic segments. o l d T o p i c S e g m e n t is the topic segment from which n e w T o p i c S e g m e n t s originated.
1:
l o c a l M a x S m a l l S e t s is an array (size: l e n g t h ( t o p i c S e g m e n t s ) ).
2:
l o c a l M a x C o h e s i o n s is an array (size: l e n g t h ( t o p i c S e g m e n t s ) ).
3:
 
4:
i t e r a t o r I n d e x 0
5:
for each t o p i c S e g m e n t in t o p i c S e g m e n t s  do
6:
     { s m a l l S e t s O f T o p i c S e g m e n t s , s i m i l a r i t y C o h e s i o n s }
7:
      g e t S m a l l S e t s O f T o p i c S e g m e n t s ( t o p i c S e g m e n t )
8:
    
9:
     m a x I n d e x g e t I n d e x O f M a x ( s i m i l a r i t y C o h e s i o n s )
10:
     l o c a l M a x S m a l l S e t s [ i t e r a t o r I n d e x ]
11:
      s m a l l S e t s O f T o p i c S e g m e n t s [ m a x I n d e x ]
12:
     l o c a l M a x C o h e s i o n s [ i t e r a t o r I n d e x ]
13:
      s i m i l a r i t y C o h e s i o n s [ m a x I n d e x ]
14:
    
15:
     i t e r a t o r I n d e x i t e r a t o r I n d e x + 1
16:
end for
17:
 
18:
t o t a l M a x I n d e x g e t I n d e x O f M a x ( l o c a l M a x C o h e s i o n s )
19:
n e w T o p i c S e g m e n t s l o c a l M a x S m a l l S e t s [ t o t a l M a x I n d e x ]
20:
o l d T o p i c S e g m e n t t o p i c S e g m e n t s [ t o t a l M a x I n d e x ]
21:
 
22:
return { n e w _ t o p i c _ s e g m e n t s , o l d _ t o p i c _ s e g m e n t }
Algorithm A3 g e t S m a l l S e t s O f T o p i c S e g m e n t s .
  • Input  t o p i c S e g m e n t
  • Output { s m a l l S e t s O f T o p i c S e g m e n t s , s i m i l a r i t y C o h e s i o n s }
  • Note that the algorithm g e t S m a l l S e t s O f T o p i c S e g m e n t s is to find candidates for new topic segments. s i m i l a r i t y C o h e s i o n s is array consisted of similarity cohesions. The length of these arrays is l e n g t h ( t o p i c S e g m e n t ) 2 · m i n T o p i c S e g m e n t S i z e . m i n T o p i c S e g m e n t S i z e is minimum size of topic segment, set to prevent very small topic segments.
1:
s m a l l S e t s O f T o p i c S e g m e n t s is an array.
2:
s i m i l a r i t y C o h e s i o n s is an array.
3:
m i n T o p i c S e g m e n t S i z e 4
4:
 
5:
for i m i n T o p i c S e g m e n t S i z e to l e n g t h ( t o p i c S e g m e n t ) 1 m i n T o p i c S e g m e n t S i z e do
6:
     c a n d i d a t e 1 m a k e T o p i c S e g m e n t B y I n d e x (
7:
      t o p i c S e g m e n t ,
8:
      0,
9:
      i + 1 ,
10:
    )
11:
     c a n d i d a t e 2 m a k e T o p i c S e g m e n t B y I n d e x (
12:
      t o p i c S e g m e n t ,
13:
      i + 1 ,
14:
      l e n g t h ( t o p i c S e g m e n t ) ,
15:
    )
16:
    
17:
     s u m 1 g e t S u m O f C o n c e p t u a l S i m i l a r i t i e s ( c a n d i d a t e 1 )
18:
     s u m 2 g e t S u m O f C o n c e p t u a l S i m i l a r i t i e s ( c a n d i d a t e 2 )
19:
     c o u n t 1 g e t C o u n t O f C o n c e p t u a l S i m i l a r i t i e s ( c a n d i d a t e 1 )
20:
     c o u n t 2 g e t C o u n t O f C o n c e p t u a l S i m i l a r i t i e s ( c a n d i d a t e 2 )
21:
     c o u n t 0 g e t C o u n t O f C o n c e p t u a l S i m i l a r i t i e s ( t o p i c S e g m e n t )
22:
     s i m i l a r i t y C o h e s i o n ( ( s u m 1 + s u m 2 ) / ( c o u n t 1 + c o u n t 2 ) ) × c o u n t 0
23:
    
24:
     s m a l l S e t s O f T o p i c S e g m e n t s [ i m i n T o p i c S e g m e n t S i z e ]
25:
      { c a n d i d a t e 1 , c a n d i d a t e 2 }
26:
     s i m i l a r i t y C o h e s i o n s [ i m i n T o p i c S e g m e n t S i z e ]
27:
      s i m i l a r i t y C o h e s i o n
28:
end for
29:
 
30:
return { s m a l l S e t s O f T o p i c S e g m e n t s , s i m i l a r i t y C o h e s i o n s }
Algorithm A4 m a k e T o p i c S e g m e n t B y I n d e x .
  • Input  t o p i c S e g m e n t
  •              s t a r t
  •              e n d
  • Output f i n e r T o p i c S e g m e n t
  • Note that the algorithm m a k e T o p i c S e g m e n t B y I n d e x is to find a finer topic segment from the original topic segment. s t a r t is first index for finer topic segment. e n d is last index for finer topic segment.
1:
f i n e r T o p i c S e g m e n t is an array of arrays. (size: e n d s t a r t )
2:
 
3:
for j s t a r t to e n d 1 do
4:
    for  i s t a r t toj do
5:
         f i n e r T o p i c S e g m e n t [ j s t a r t ] [ i s t a r t ] t o p i c S e g m e n t [ j ] [ i ]
6:
    end for
7:
end for
8:
 
9:
return finerTopicSegment
Algorithm A5 g e t S u m O f C o n c e p t u a l S i m i l a r i t i e s .
  • Input  t o p i c S e g m e n t
  • Output s u m
  • Note that the algorithm g e t S u m O f C o n c e p t u a l S i m i l a r i t i e s is to calculate sum of conceptual similarities. Functions p l a n e , l i n e , p o i n t represent methods of sum of conceptual similarities. The description of these functions is in Section 6.2. Functions o t h e r , s e l f , c h a i n , and m o d e r a t o r represent debate consistency metrics. The description of these functions is provided in Section 6.3.
1:
s u m 0
2:
 
3:
for j 0 to (length of t o p i c S e g m e n t ) 1  do
4:
    for  i 0 to (length of t o p i c S e g m e n t ) 1  do
5:
         w e i g h t e d S i m i l a r i t y ( p l a n e ( i , j ) + l i n e ( i , j ) + p o i n t ( i , j ) ) · ( o t h e r ( i , j ) · s e l f ( i , j ) · c h a i n ( i , j ) · m o d e r a t o r ( i , j ) ) · t o p i c S e g m e n t [ j ] [ i ]
6:
         s u m s u m + w e i g h t e d S i m i l a r i t y
7:
    end for
8:
end for
9:
 
10:
return s u m
Algorithm A6 g e t C o u n t O f C o n c e p t u a l S i m i l a r i t i e s .
  • Input  t o p i c S e g m e n t
  • Output c o u n t
  • Note that the algorithm g e t C o u n t O f C o n c e p t u a l S i m i l a r i t i e s is to calculate the count of conceptual similarities. p l a n e W e i g h t , l i n e W e i g h t , p o i n t W e i g h t are weights controlled by the user. The description is in Section 6.2.1. The reason that the code of c o u n t O f P l a n e , c o u n t O f L i n e , and c o u n t O f P o i n t looks different from the formula in Section 6.2 is because index i and j of Section 6.2 also include participant squares as in Figure 5. So it should be noted that topicSegment is a two-dimensional array consisting only of conceptual similarities.
1:
c o u n t O f P l a n e p l a n e W e i g h t · ( l e n g t h ( t o p i c S e g m e n t )
2:
  · ( l e n g t h ( t o p i c S e g m e n t ) + 1 ) / 2
3:
c o u n t O f L i n e l i n e W e i g h t · ( 2 · l e n g t h ( t o p i c S e g m e n t ) 1 )
4:
c o u n t O f P o i n t p o i n t W e i g h t
5:
 
6:
if p l a n e W e i g h t > 0 or l i n e W e i g h t > 0 then
7:
     c o u n t c o u n t O f P l a n e + c o u n t O f L i n e + c o u n t O f P o i n t
8:
else
9:
     c o u n t c o u n t O f P o i n t · ( l e n g t h ( t o p i c S e g m e n t )
10:
      · ( l e n g t h ( t o p i c S e g m e n t ) + 1 ) / 2
11:
end if
12:
 
13:
return c o u n t

References

  1. Lee, G.J. A Study on Dialogue Tactics in TV Discussion Program: Focusing on Attack and Defense Among Debaters. Master’s Thesis, The Graduate School Ewha Womans University, Seoul, Korea, 2010. [Google Scholar]
  2. Livingstone, S.; Lunt, P. Talk on Television: Audience Participation and Public Debate; Routledge: London, UK, 2002. [Google Scholar]
  3. Keim, D.; Andrienko, G.; Fekete, J.D.; Görg, C.; Kohlhammer, J.; Melançon, G. Visual analytics: Definition, process, and challenges. In Information Visualization: Human-Centered Issues and Perspectives; Springer: Berlin/Heidelberg, Germany, 2008; pp. 154–175. [Google Scholar]
  4. Cui, W. Visual analytics: A comprehensive overview. IEEE Access 2019, 7, 81555–81573. [Google Scholar] [CrossRef]
  5. Purver, M. Topic Segmentation. In Spoken Language Understanding; John Wiley & Sons, Ltd.: Hoboken, NJ, USA, 2011; Chapter 11; pp. 291–317. [Google Scholar]
  6. Gold, V.; Rohrdantz, C.; El-Assady, M. Exploratory text analysis using lexical episode plots. In Eurographics Conference on Visualization (EuroVis)—Short Papers; The Eurographics Association: Cagliari, Sardinia, Italy, 25–29 May 2015; pp. 85–90. [Google Scholar]
  7. El-Assady, M.; Gold, V.; Acevedo, C.; Collins, C.; Keim, D. ConToVi: Multi-Party Conversation Exploration using Topic-Space Views. Comput. Graph. Forum 2016, 35, 431–440. [Google Scholar] [CrossRef] [Green Version]
  8. El-Assady, M.; Sevastjanova, R.; Gipp, B.; Keim, D.; Collins, C. NEREx: Named-Entity Relationship Exploration in Multi-Party Conversations. Comput. Graph. Forum 2017, 36, 213–225. [Google Scholar] [CrossRef]
  9. South, L.; Schwab, M.; Beauchamp, N.; Wang, L.; Wihbey, J.; Borkin, M.A. DebateVis: Visualizing political debates for non-expert users. In Proceedings of the 2020 IEEE Visualization Conference (VIS), Salt Lake City, UT, USA, 25–30 October 2020; pp. 241–245. [Google Scholar]
  10. Angus, D.; Smith, A.; Wiles, J. Conceptual recurrence plots: Revealing patterns in human discourse. IEEE Trans. Vis. Comput. Graph. 2011, 18, 988–997. [Google Scholar] [CrossRef] [PubMed]
  11. Nguyen, V.A.; Hu, Y.; Boyd-Graber, J.; Resnik, P. Argviz: Interactive visualization of topic dynamics in multi-party conversations. In Proceedings of the 2013 NAACL HLT Demonstration Session, Atlanta, Georgia, 9–14 June 2013; Association for Computational Linguistics: Atlanta, GA, USA, 2013; pp. 36–39. [Google Scholar]
  12. Shi, Y.; Bryan, C.; Bhamidipati, S.; Zhao, Y.; Zhang, Y.; Ma, K.L. Meetingvis: Visual narratives to assist in recalling meeting context and content. IEEE Trans. Vis. Comput. Graph. 2018, 24, 1918–1929. [Google Scholar] [CrossRef]
  13. Chandrasegaran, S.; Bryan, C.; Shidara, H.; Chuang, T.Y.; Ma, K.L. TalkTraces: Real-time capture and visualization of verbal content in meetings. In Proceedings of the 2019 CHI Conference on Human Factors in Computing Systems, Scotland, UK, 4–9 May 2019; Association for Computing Machinery: New York, NY, USA, 2019. CHI’19. pp. 1–14. [Google Scholar]
  14. Lim, S.; Park, C.; Han, H.; Ho, J.; Hong, J.; Lee, S.; Lee, K. A study on interface design to provide effective meeting summary information: Focused on narrative chart and topic map visualization. Arch. Des. Res. 2021, 34, 115–131. [Google Scholar]
  15. Angus, D. Recurrence methods for communication data, reflecting on 20 years of progress. Front. Appl. Math. Stat. 2019, 5, 54. [Google Scholar] [CrossRef] [Green Version]
  16. Angus, D.; Fitzgerald, R.; Atay, C.; Wiles, J. Using visual text analytics to examine broadcast interviewing. Discourse Context Media 2016, 11, 38–49. [Google Scholar] [CrossRef]
  17. Angus, D.; Watson, B.; Smith, A.; Gallois, C.; Wiles, J. Visualising conversation structure across time: Insights into effective doctor-patient consultations. PLoS ONE 2012, 7, e38014. [Google Scholar] [CrossRef]
  18. Watson, B.M.; Angus, D.; Gore, L.; Farmer, J. Communication in open disclosure conversations about adverse events in hospitals. Lang. Commun. 2015, 41, 57–70. [Google Scholar] [CrossRef]
  19. Angus, D.; Rintel, S.; Wiles, J. Making sense of big text: A visual-first approach for analysing text data using Leximancer and Discursis. Int. J. Soc. Res. Methodol. 2013, 16, 261–267. [Google Scholar] [CrossRef]
  20. Angus, D.; Rooney, D.; McKenna, B.; Wiles, J. Visualizing punctuated equilibria in discursive change: Exploring a new text analysis possibility for management research. J. Bus. Manag. Landscapes 2012, 1, 1–16. [Google Scholar]
  21. Angus, D.; Smith, A.E.; Wiles, J. Human communication as coupled time series: Quantifying multi-participant recurrence. IEEE Trans. Audio Speech Lang. Process. 2012, 20, 1795–1807. [Google Scholar] [CrossRef]
  22. Tolston, M.T.; Riley, M.A.; Mancuso, V.; Finomore, V.; Funke, G.J. Beyond frequency counts: Novel conceptual recurrence analysis metrics to index semantic coordination in team communications. Behav. Res. Methods 2019, 51, 342–360. [Google Scholar] [CrossRef] [Green Version]
  23. Hearst, M.A. TextTiling: A Quantitative Approach to Discourse Segmentation; Technical Report; University of California: Berkeley, CA, USA, 1993. [Google Scholar]
  24. Hearst, M.A. Multi-paragraph segmentation of expository text. In Proceedings of the 32nd Annual Meeting on Association for Computational Linguistics, Las Cruces, NM, USA, 27–30 June 1994; ACL’94. Association for Computational Linguistics: Atlanta, GA, USA, 1994; pp. 9–16. [Google Scholar]
  25. Hearst, M.A. TextTiling: Segmenting text into multi-paragraph subtopic passages. Comput. Linguist. 1997, 23, 33–64. [Google Scholar]
  26. Galley, M.; McKeown, K.R.; Fosler-Lussier, E.; Jing, H. Discourse segmentation of multi-party conversation. In Proceedings of the 41st Annual Meeting of the Association for Computational Linguistics, Sapporo, Japan, 7–12 July 2003; Association for Computational Linguistics: Sapporo, Japan, 2003; pp. 562–569. [Google Scholar]
  27. Purver, M.; Körding, K.P.; Griffiths, T.L.; Tenenbaum, J.B. Unsupervised topic modelling for multi-party spoken discourse. In Proceedings of the 21st International Conference on Computational Linguistics and 44th Annual Meeting of the Association for Computational Linguistics, Sydney, Australia, 17–21 July 2006; Association for Computational Linguistics: Sydney, Australia, 2006; pp. 17–24. [Google Scholar]
  28. Hsueh, P.Y.; Moore, J.; Renals, S. Automatic segmentation of multiparty dialogue. In Proceedings of the 11th Conference of the European Chapter of the Association for Computational Linguistics, Online, 19–23 April 2006; Association for Computational Linguistics: Atlanta, GA, USA, 2006; pp. 273–280. [Google Scholar]
  29. Sherman, M.; Liu, Y. Using hidden Markov models for topic segmentation of meeting transcripts. In Proceedings of the 2008 IEEE Spoken Language Technology Workshop, Goa, India, 15–19 December 2008; pp. 185–188. [Google Scholar]
  30. Nguyen, V.A.; Boyd-Graber, J.; Resnik, P. SITS: A hierarchical nonparametric model using speaker identity for topic segmentation in multiparty conversations. In Proceedings of the 50th Annual Meeting of the Association for Computational Linguistics (Volume 1: Long Papers), Jeju Island, Korea, 7 July 2012; Association for Computational Linguistics: Jeju Island, Korea, 2012; pp. 78–87. [Google Scholar]
  31. Joty, S.; Carenini, G.; Ng, R.T. Topic segmentation and labeling in asynchronous conversations. J. Artif. Intell. Res. 2013, 47, 521–573. [Google Scholar] [CrossRef]
  32. Song, Y.; Mou, L.; Yan, R.; Yi, L.; Zhu, Z.; Hu, X.; Zhang, M. Dialogue session segmentation by embedding-enhanced TextTiling. arXiv 2016, arXiv:1610.03955. [Google Scholar]
  33. Takanobu, R.; Huang, M.; Zhao, Z.; Li, F.; Chen, H.; Zhu, X.; Nie, L. A weakly supervised method for topic segmentation and labeling in goal-oriented dialogues via reinforcement Learning. In Proceedings of the Twenty-Seventh International Joint Conference on Artificial Intelligence (IJCAI-18), Stockholm, Sweden, 13–19 July 2018; pp. 4403–4410. [Google Scholar]
  34. Reynar, J.C. An automatic method of finding topic boundaries. In Proceedings of the 32nd Annual Meeting of the Association for Computational Linguistics, Las Cruces, NM, USA, 27–30 June 1994; Association for Computational Linguistics: Las Cruces, NM, USA, 1994; pp. 331–333. [Google Scholar]
  35. Choi, F.Y.Y. Advances in domain independent linear text segmentation. In Proceedings of the 1st North American Chapter of the Association for Computational Linguistics Conference, Seattle, WA, USA, 29 April–4 May 2000; Association for Computational Linguistics: Stroudsburg, PA, USA, 2000. NAACL 2000. pp. 26–33. [Google Scholar]
  36. Malioutov, I.I.M. Minimum cut model for spoken lecture segmentation. Master’s Thesis, Massachusetts Institute of Technology, Cambridge, MA, USA, 2006. [Google Scholar]
  37. Bak, Y.I. Textlinguistic society edition: Conversation analysis of television political debate—Seoul mayor candidate debate as an example. J. Textlinguistic Soc. Korea 1997, 4, 139–166. [Google Scholar]
  38. Kim, J.M. Aspects interactifs dans le débat télévisé. Etudes Cult. Fr. Arts Fr. 2009, 29, 31–65. [Google Scholar]
  39. Kerbrat-Orecchioni, C. Les Interactions Verbales, Tome I; Armand Colin: Paris, France, 1990. [Google Scholar]
  40. Na, M. A Study on Television Debates as Public Spheres. Korean J. Broadcast. Telecommun. Res. 2003, 1, 107–145. [Google Scholar]
  41. Lee, E.H. The Modality of Facilitator and Panel Interaction on TV Current Affairs Debates. J. Textlinguistic Soc. Korea 2010, 29, 341–373. [Google Scholar]
  42. Baldwin, J.R.; Perry, S.D.; Moffitt, M.A. Communication Theories for Everyday Life, 1st ed.; Pearson College Division: London, UK, 2004. [Google Scholar]
  43. Littlejohn, S.W.; Foss, K.A. Theories of Human Communication, 10th ed.; Waveland Press: Long Grove, IL, USA, 2010. [Google Scholar]
  44. Fisher, W.R. Narration as a human communication paradigm: The case of public moral argument. Commun. Monogr. 1984, 51, 1–22. [Google Scholar] [CrossRef]
  45. Fisher, W.R. The narrative paradigm: An elaboration. Commun. Monogr. 1985, 52, 347–367. [Google Scholar] [CrossRef]
  46. Grice, H.P. Logic and conversation. In Syntax and Semantics; Academic: New York, NY, USA, 1975; Volume 3, pp. 41–58. [Google Scholar]
  47. Gouran, D.S.; Hirokawa, R.Y. The role of communication in decision-making groups: A functional perspective. Commun. Transit. 1983, 168–185. [Google Scholar]
  48. Hirokawa, R.Y. Discussion procedures and decision-making performance: A test of a functional perspective. Hum. Commun. Res. 1985, 12, 203–224. [Google Scholar] [CrossRef]
  49. Gouran, D.S.; Hirokawa, R.Y.; Julian, K.M.; Leatham, G.B. The evolution and current status of the functional perspective on communication in decision-making and problem-solving groups. Ann. Int. Commun. Assoc. 1993, 16, 573–600. [Google Scholar] [CrossRef]
  50. 100-Minutes Debate. Available online: http://www.imbc.com/broad/tv/culture/toron/index.html (accessed on 1 November 2020).
  51. Open AI API·DATA Service. Available online: https://aiopen.etri.re.kr/ (accessed on 5 January 2021).
  52. Google Natural Language. Available online: https://cloud.google.com/natural-language (accessed on 3 May 2021).
  53. Litman, D.J.; Passonneau, R.J. Combining multiple knowledge sources for discourse segmentation. In Proceedings of the 33rd Annual Meeting on Association for Computational Linguistics, Cambridge, MA, USA, 26–30 June 1995; Association for Computational Linguistics: Stroudsburg, PA, USA, 1995. ACL’95. pp. 108–115. [Google Scholar]
  54. Beeferman, D.; Berger, A.; Lafferty, J. Statistical models for text segmentation. Mach. Learn. 1999, 34, 177–210. [Google Scholar] [CrossRef] [Green Version]
  55. Pevzner, L.; Hearst, M.A. A critique and improvement of an evaluation metric for text segmentation. Comput. Linguist. 2002, 28, 19–36. [Google Scholar] [CrossRef]
  56. Morris, J.; Hirst, G. Lexical cohesion computed by thesaural relations as an indicator of the structure of text. Comput. Linguist. 1991, 17, 21–48. [Google Scholar]
Figure 1. Two research questions Q1 and Q2. Q1 is whether conceptual similarity affects topic segmentation. Q2 is whether debate consistency metrics affect conceptual similarity, and thus topic segmentation.
Applsci 12 02952 g001
Figure 2. The research framework of the proposed CSseg.
Applsci 12 02952 g002
Figure 3. Data structure organized by each speaker’s utterance unit.
Applsci 12 02952 g003
Figure 4. An example of morphological analysis result. Along with an example of a Korean sentence, there is an example translated into English. Ellipses indicate morphemes predicted as NNP and NNG. The green ellipses represent the terms finally selected for the term list, and the red ellipses represent terms included in NNP and NNG but treated as stopwords.
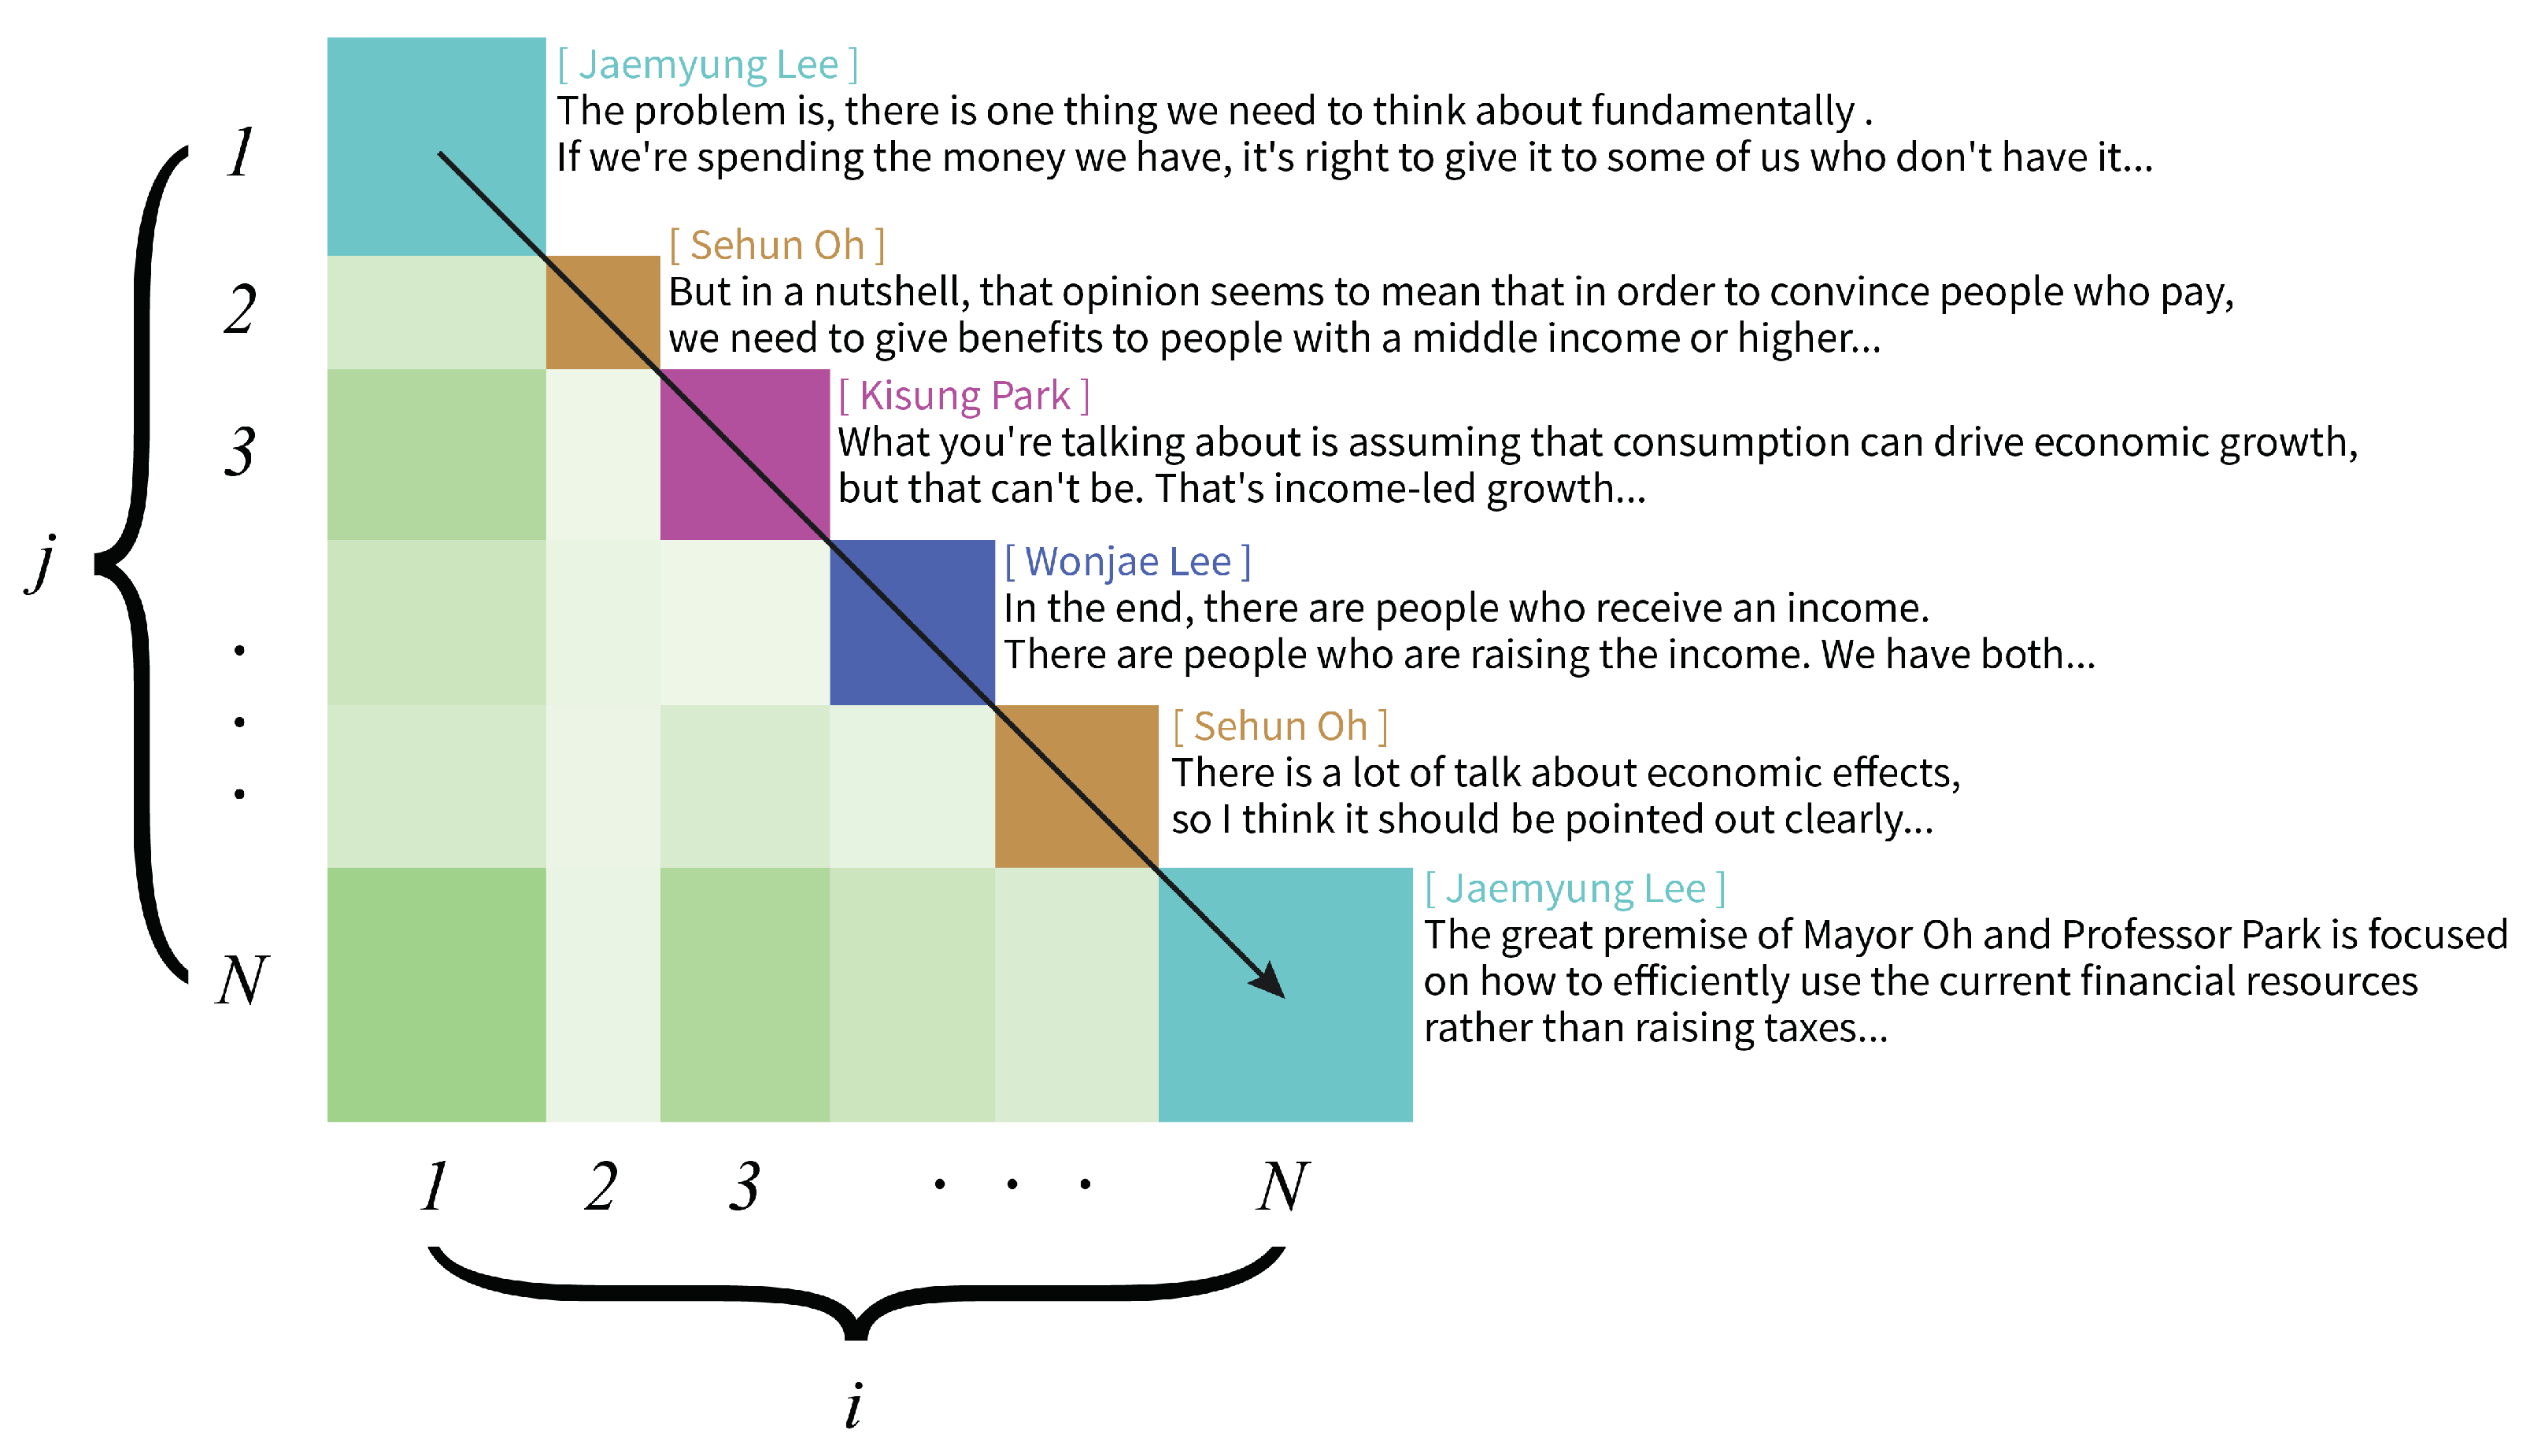
Applsci 12 02952 g004
Figure 5. Visualization of conceptual recurrence as a conceptual recurrence plot. The cyan, orange, purple, and blue squares at the top represent utterances. The larger the utterance, the larger the square. The utterances proceed diagonally from the upper left to the lower right. i denotes an index based on the horizontal axis, and j denotes an index based on the vertical axis. For example, these represent the i-th utterance based on the horizontal axis and the j-th utterance based on the vertical axis. A light green square represents conceptual similarity, which means a similarity between the upper utterance and the right utterance. The higher the light green saturation, the higher the conceptual similarity value.
Applsci 12 02952 g005
Figure 6. Four small sets of topic segments. Red squares indicate topic segments. Since the way CSseg divides the transcript is by dividing one topic segment into two topic segments, we intend to designate these two adjacent topic segments as a unit, which is called a small set of topic segments.
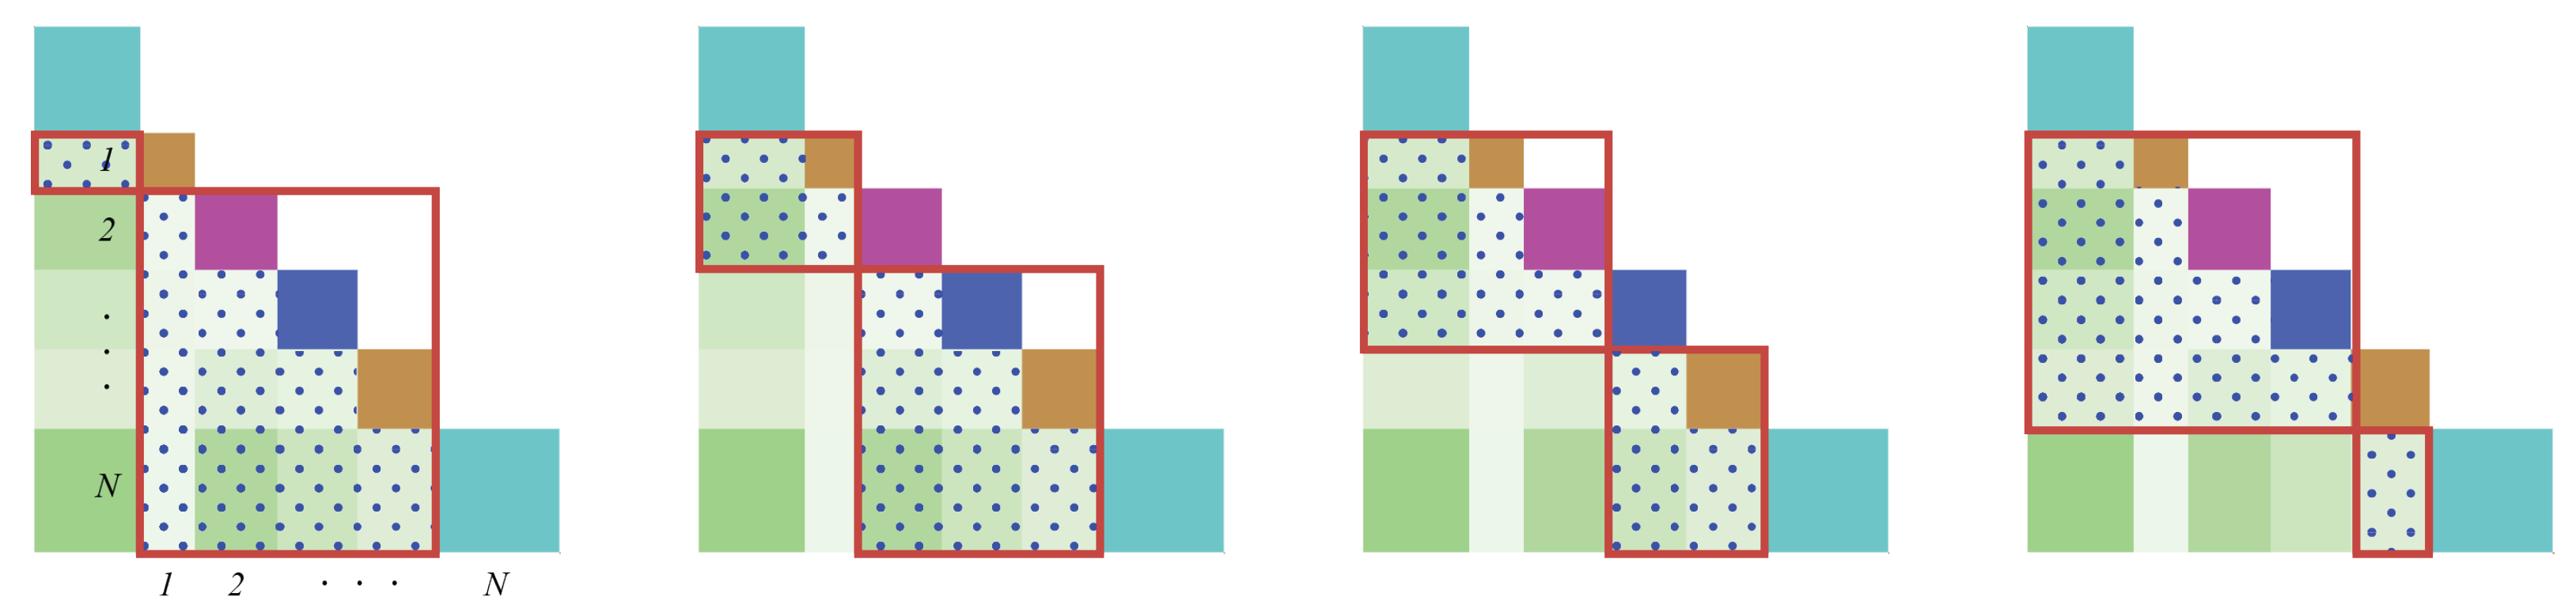
Applsci 12 02952 g006
Figure 7. Examples of conceptual similarities used in the Plane method. Each red square represents a topic segment. The light green squares with blue dots inside the red squares indicate the conceptual similarities used in the Plane method.
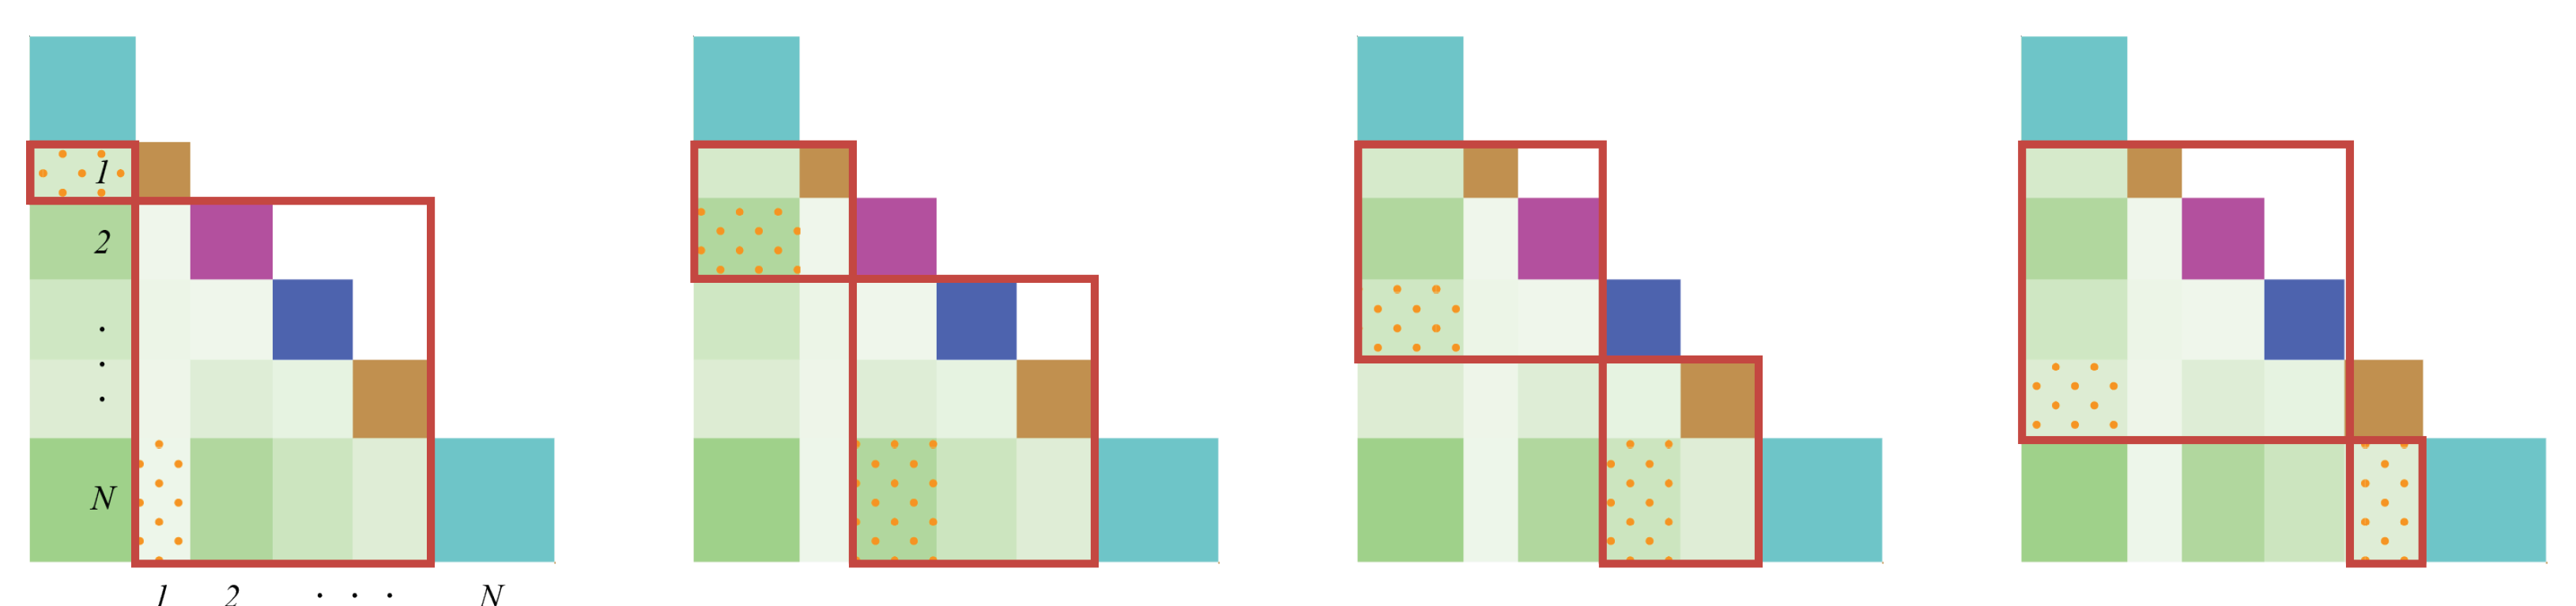
Applsci 12 02952 g007
Figure 8. Examples of conceptual similarities used in the Line method. Each red square represents a topic segment. The light green squares with red dots inside the red squares indicate the conceptual similarities used in the Line method.
Applsci 12 02952 g008
Figure 9. Examples of conceptual similarities used in the Point method. Each red square represents a topic segment. The light green squares with orange dots inside the red squares indicate the conceptual similarities used in the Point method.
Applsci 12 02952 g009
Figure 10. Examples of conceptual similarities used in the combined method (Plane + Line + Point). Each red square represents a topic segment. The light green squares with blue dots indicate the conceptual similarities used in the Plane method. The light green squares with red dots indicate the conceptual similarities used in the Line method. The light green squares with orange dots indicate the conceptual similarities used in the Point method.
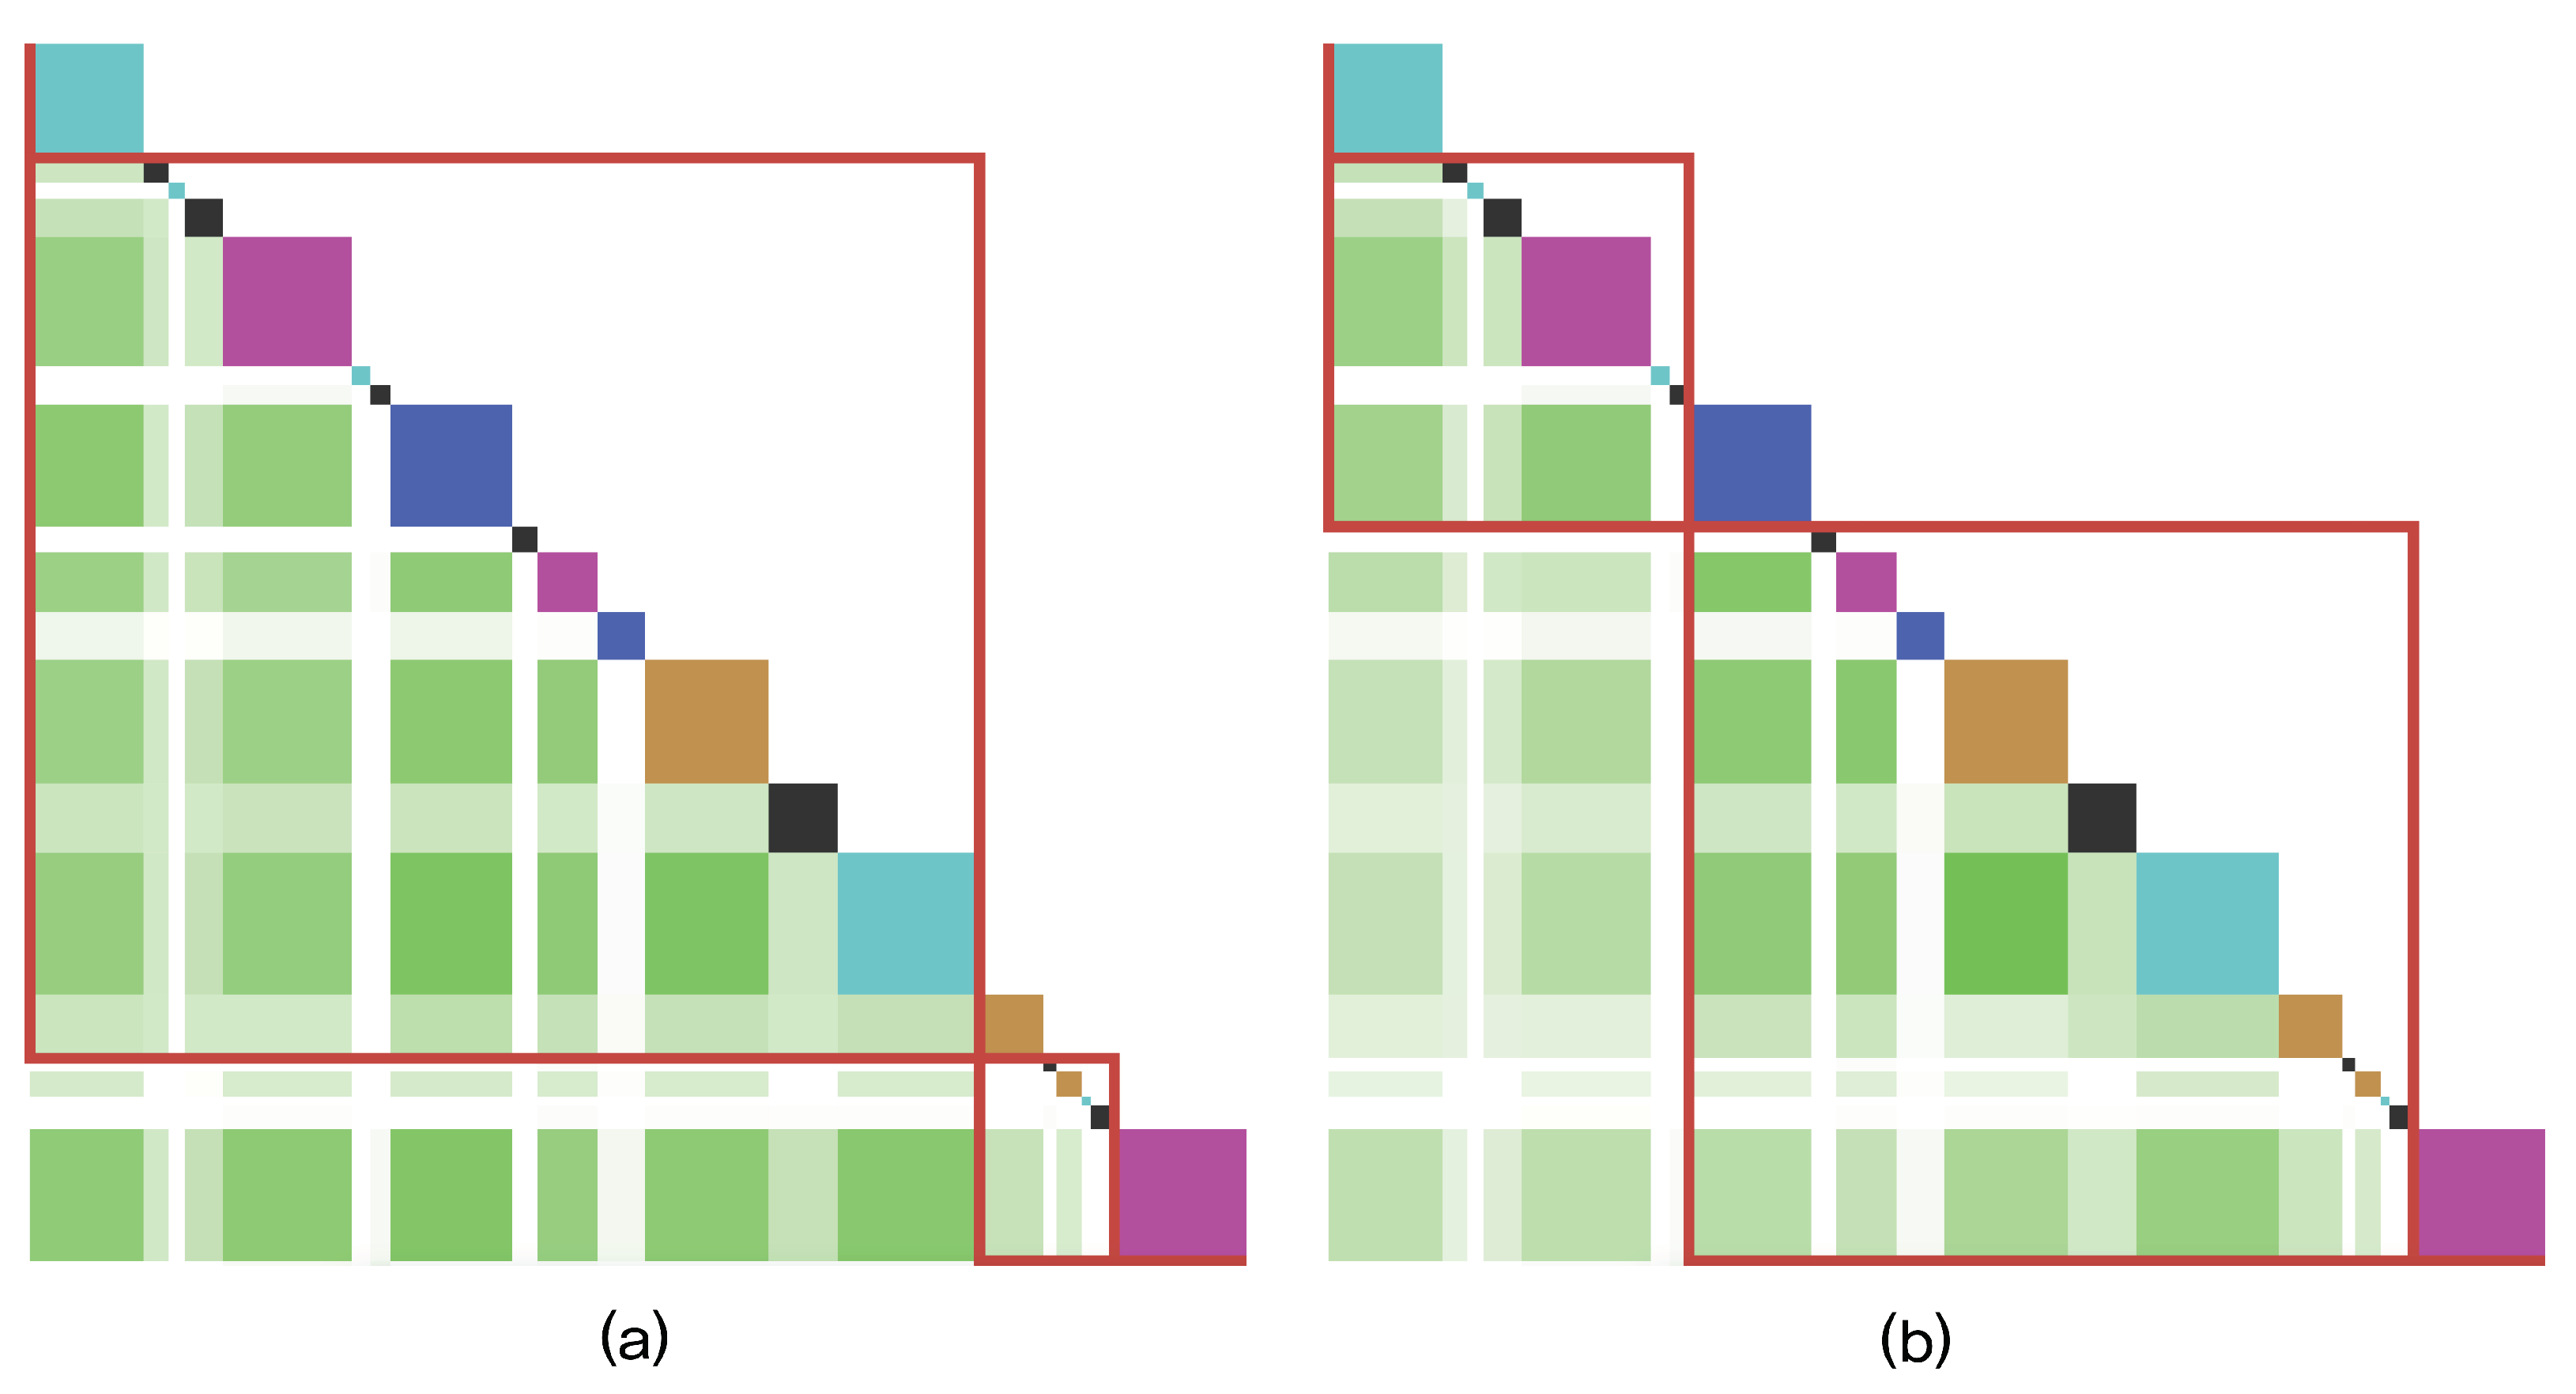
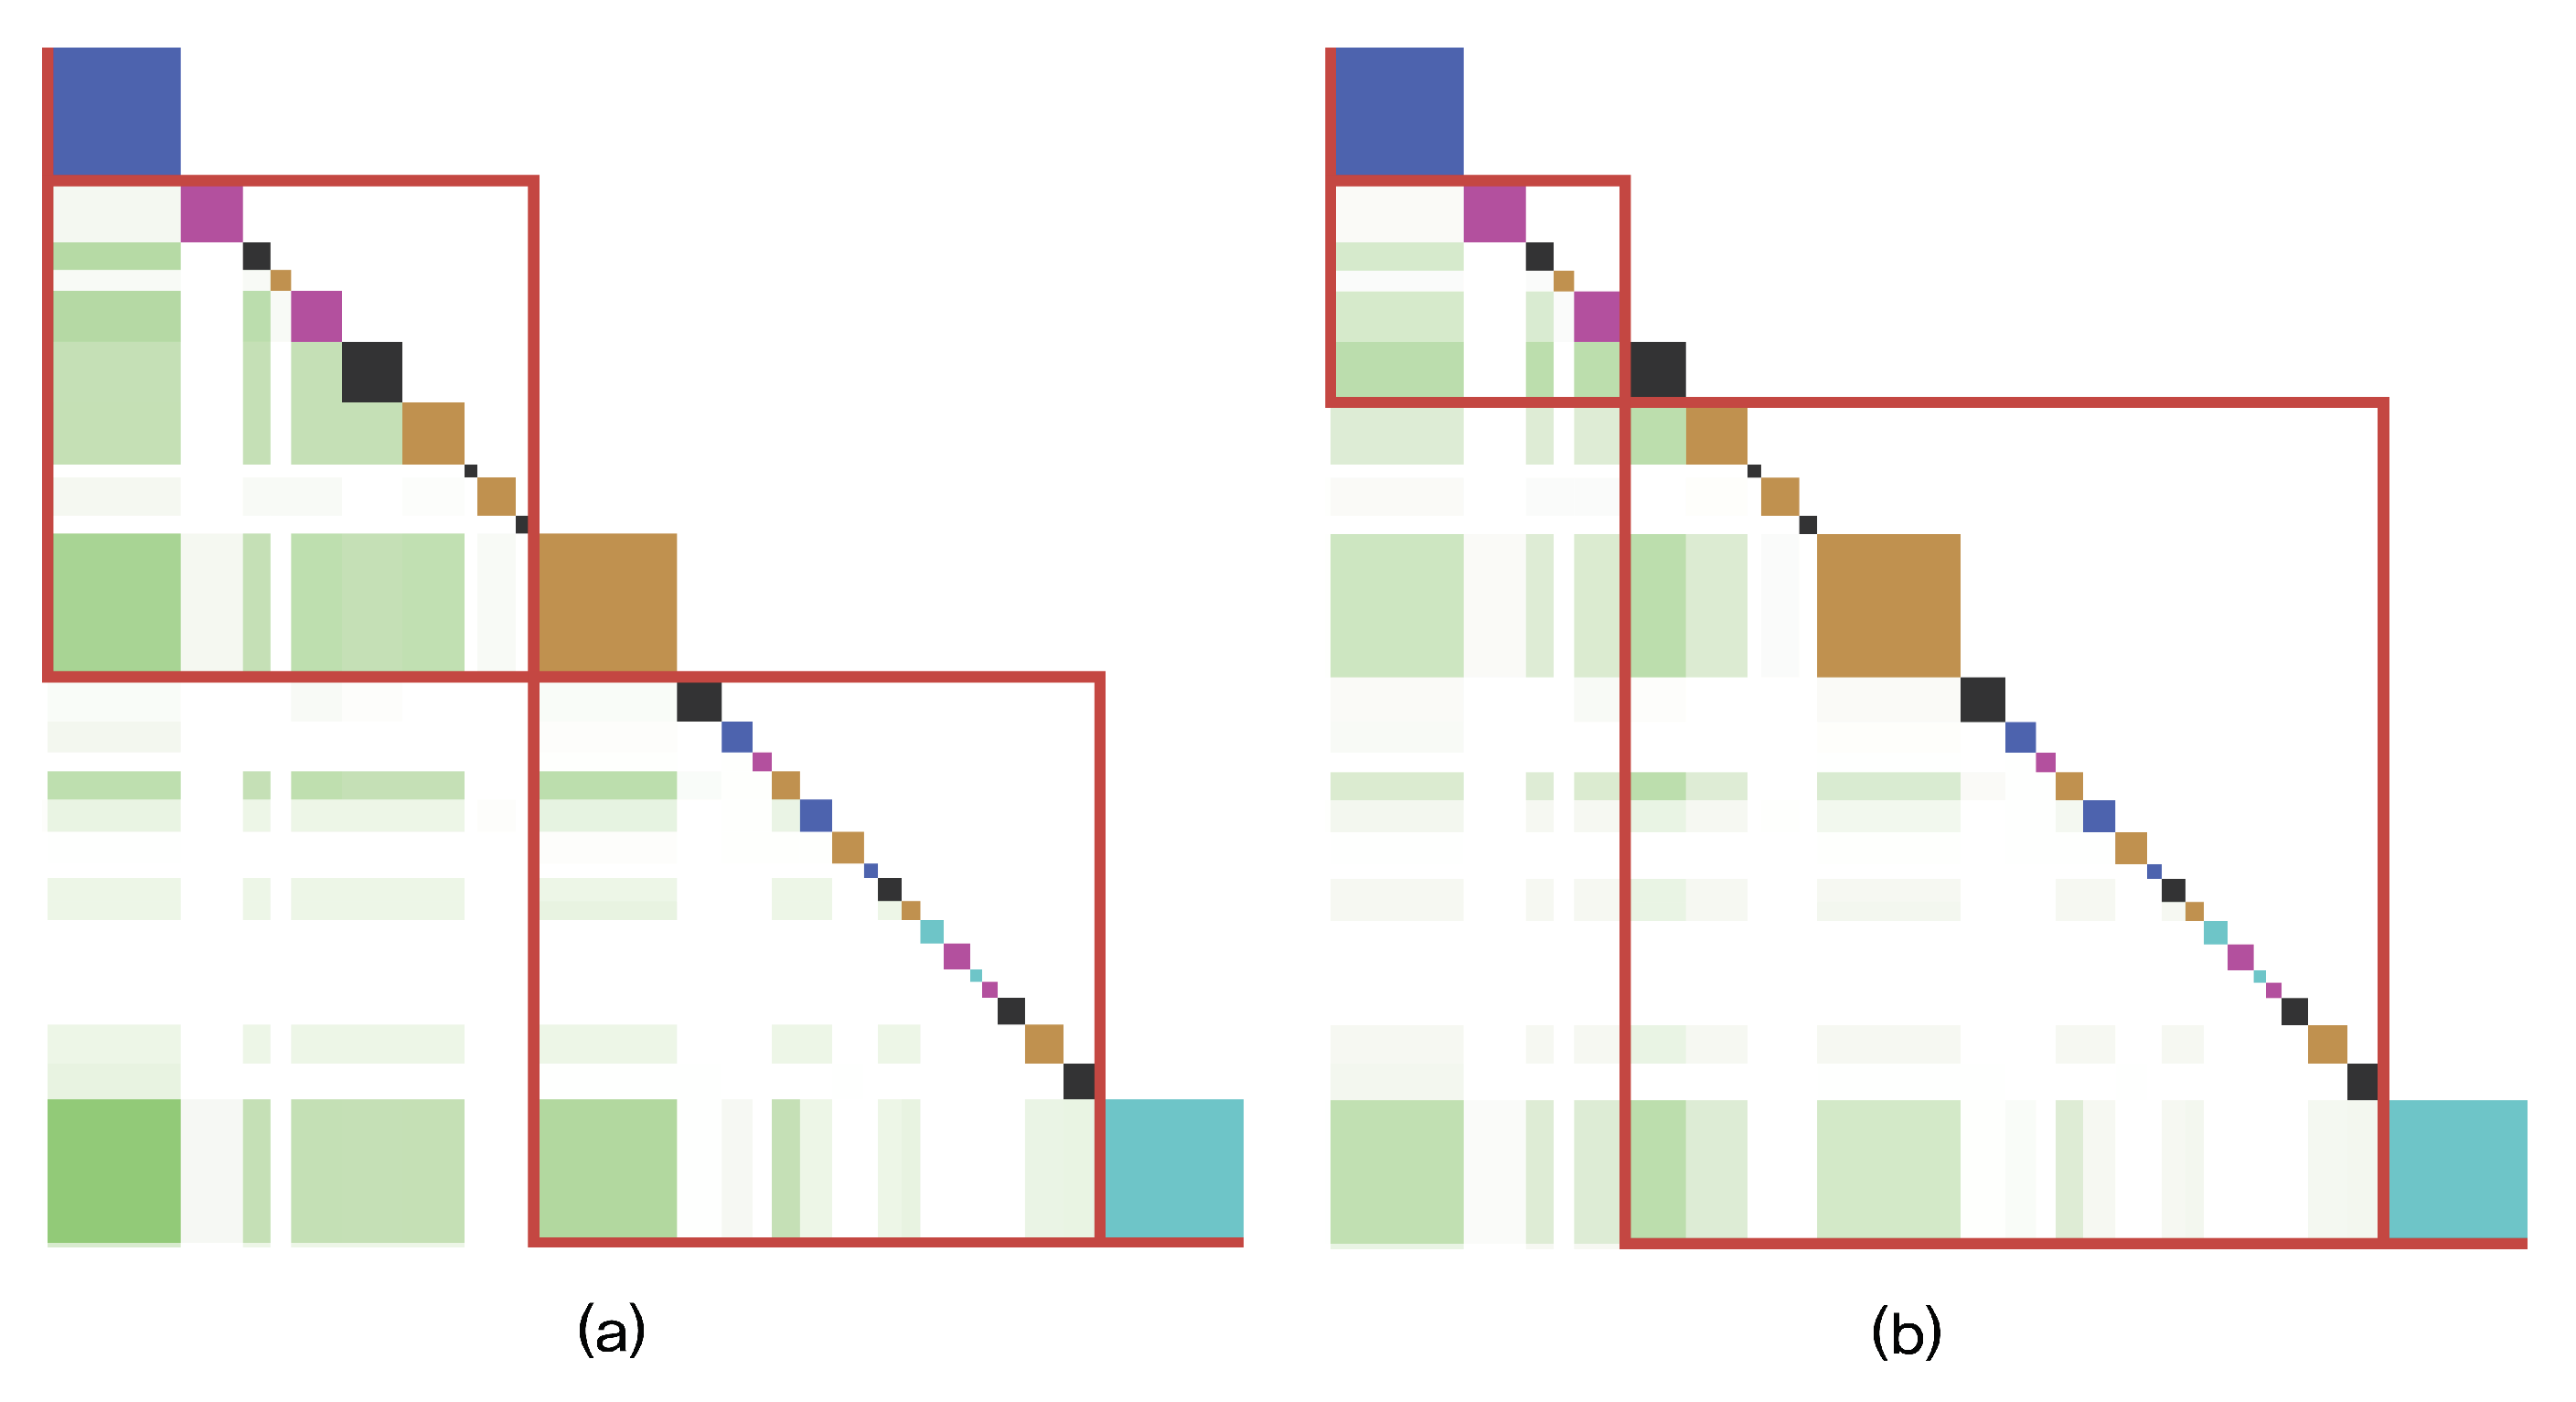
Applsci 12 02952 g010
Figure 11. Before (a) and after (b) other-continuity is applied to conceptual similarities. By applying the weight of the metric that quantifies the other-continuity, the transcript is segmented based on the corresponding conceptual similarities of other-continuity.
Applsci 12 02952 g011
Figure 12. Before (a) and after (b) self-continuity is applied to conceptual similarities. By applying the weight of the metric that quantifies the self-continuity, the transcript is segmented based on the corresponding conceptual similarities of self-continuity.
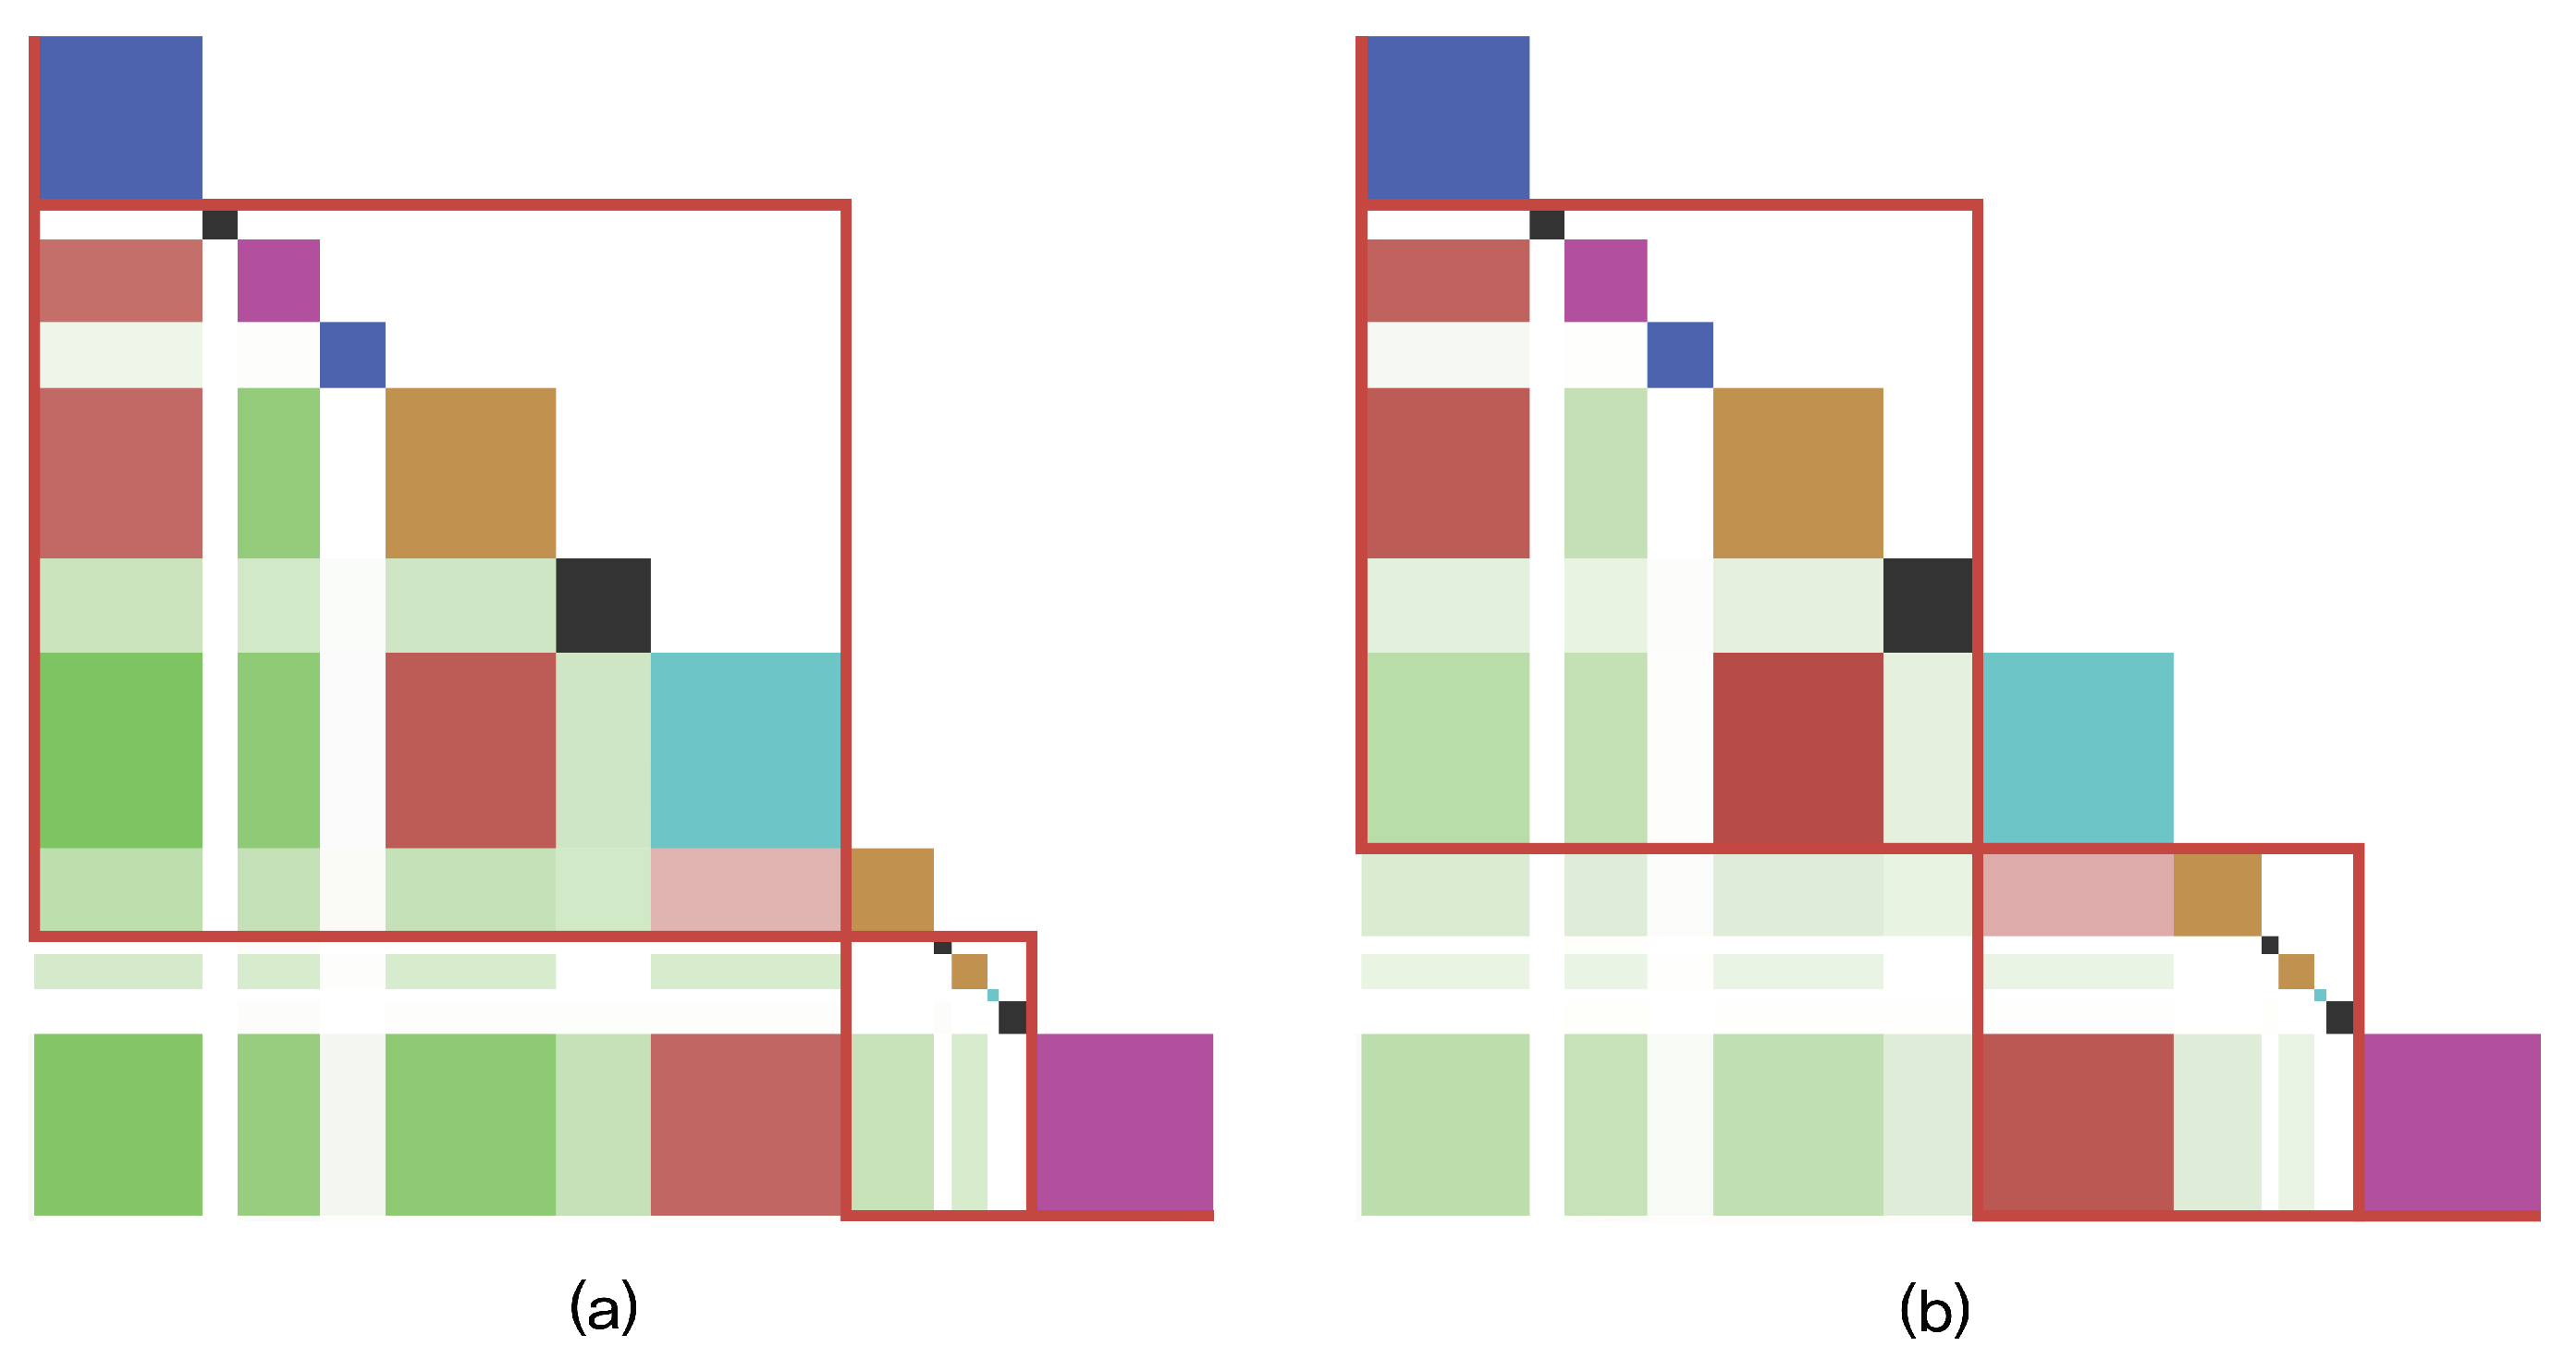
Applsci 12 02952 g012
Figure 13. Before (a) and after (b) chain of arguments and counterarguments is applied to conceptual similarities. By applying the weight of the metric that quantifies the chain of arguments and counterarguments, the transcript is segmented based on the corresponding conceptual similarities of arguments and counterarguments.
Applsci 12 02952 g013
Figure 14. Before (a) and after (b) topic guide of moderator is applied to conceptual similarities. By applying the weight of the metric that quantifies the topic guide of moderator, the transcript is segmented based on the corresponding conceptual similarities including moderator’s utterance.
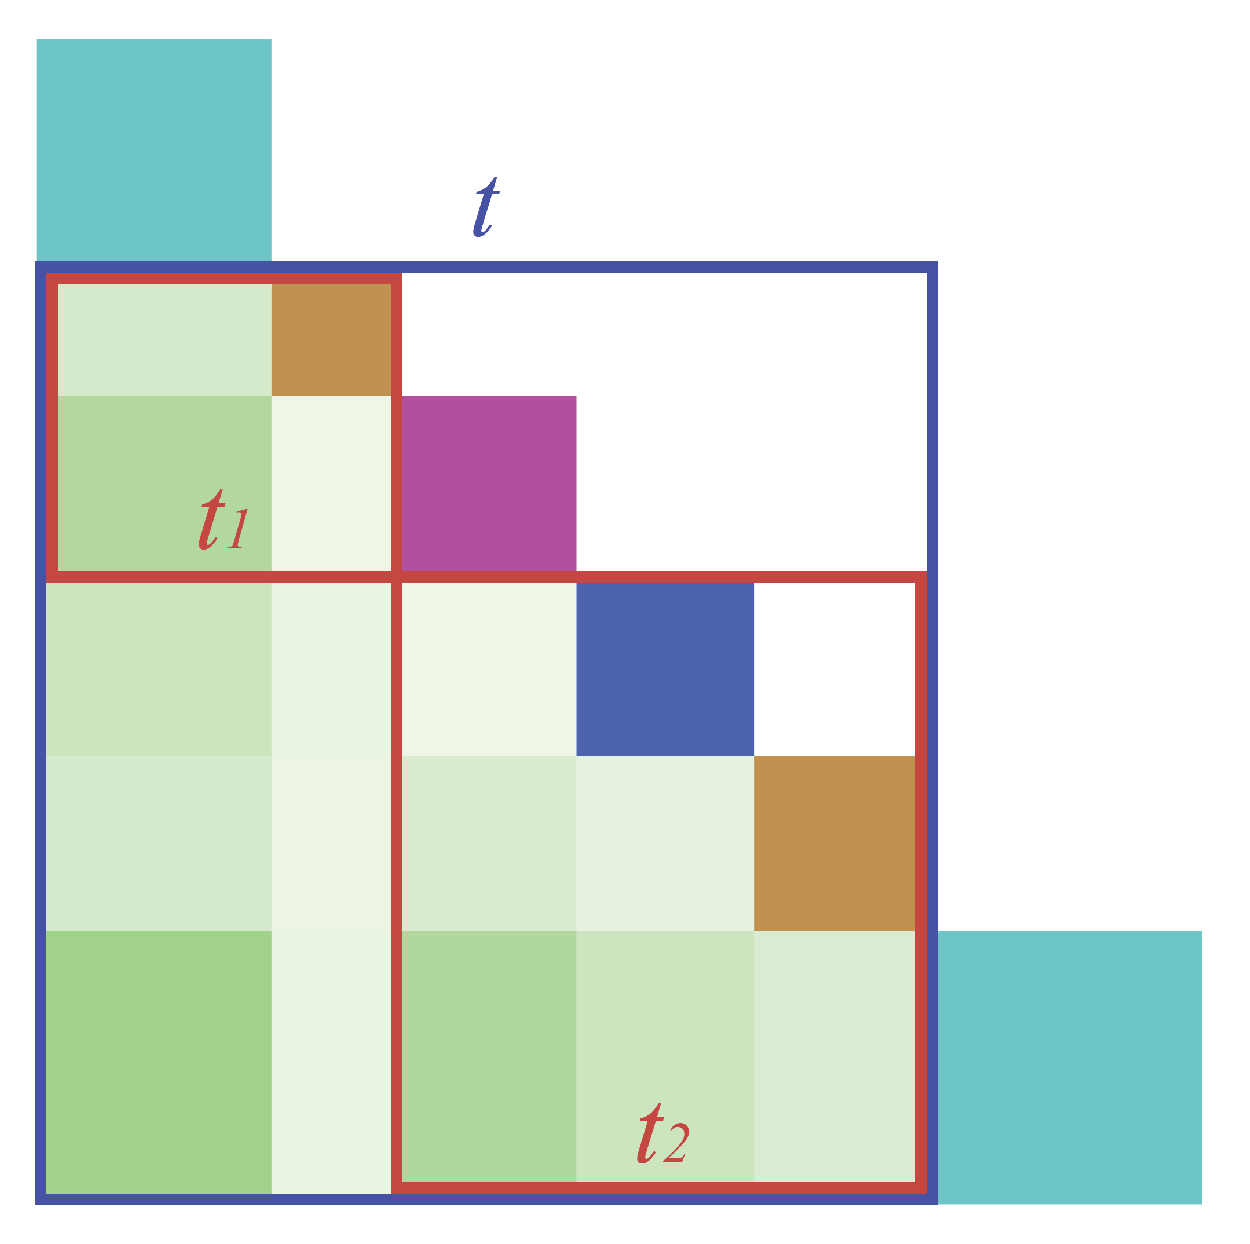
Applsci 12 02952 g014
Figure 15. Example showing two adjacent topic segments t 1 , t 2 , and a parent topic segment t in a small set of topic segments.
Applsci 12 02952 g015
Figure 16. Graphical model representation of CSseg.
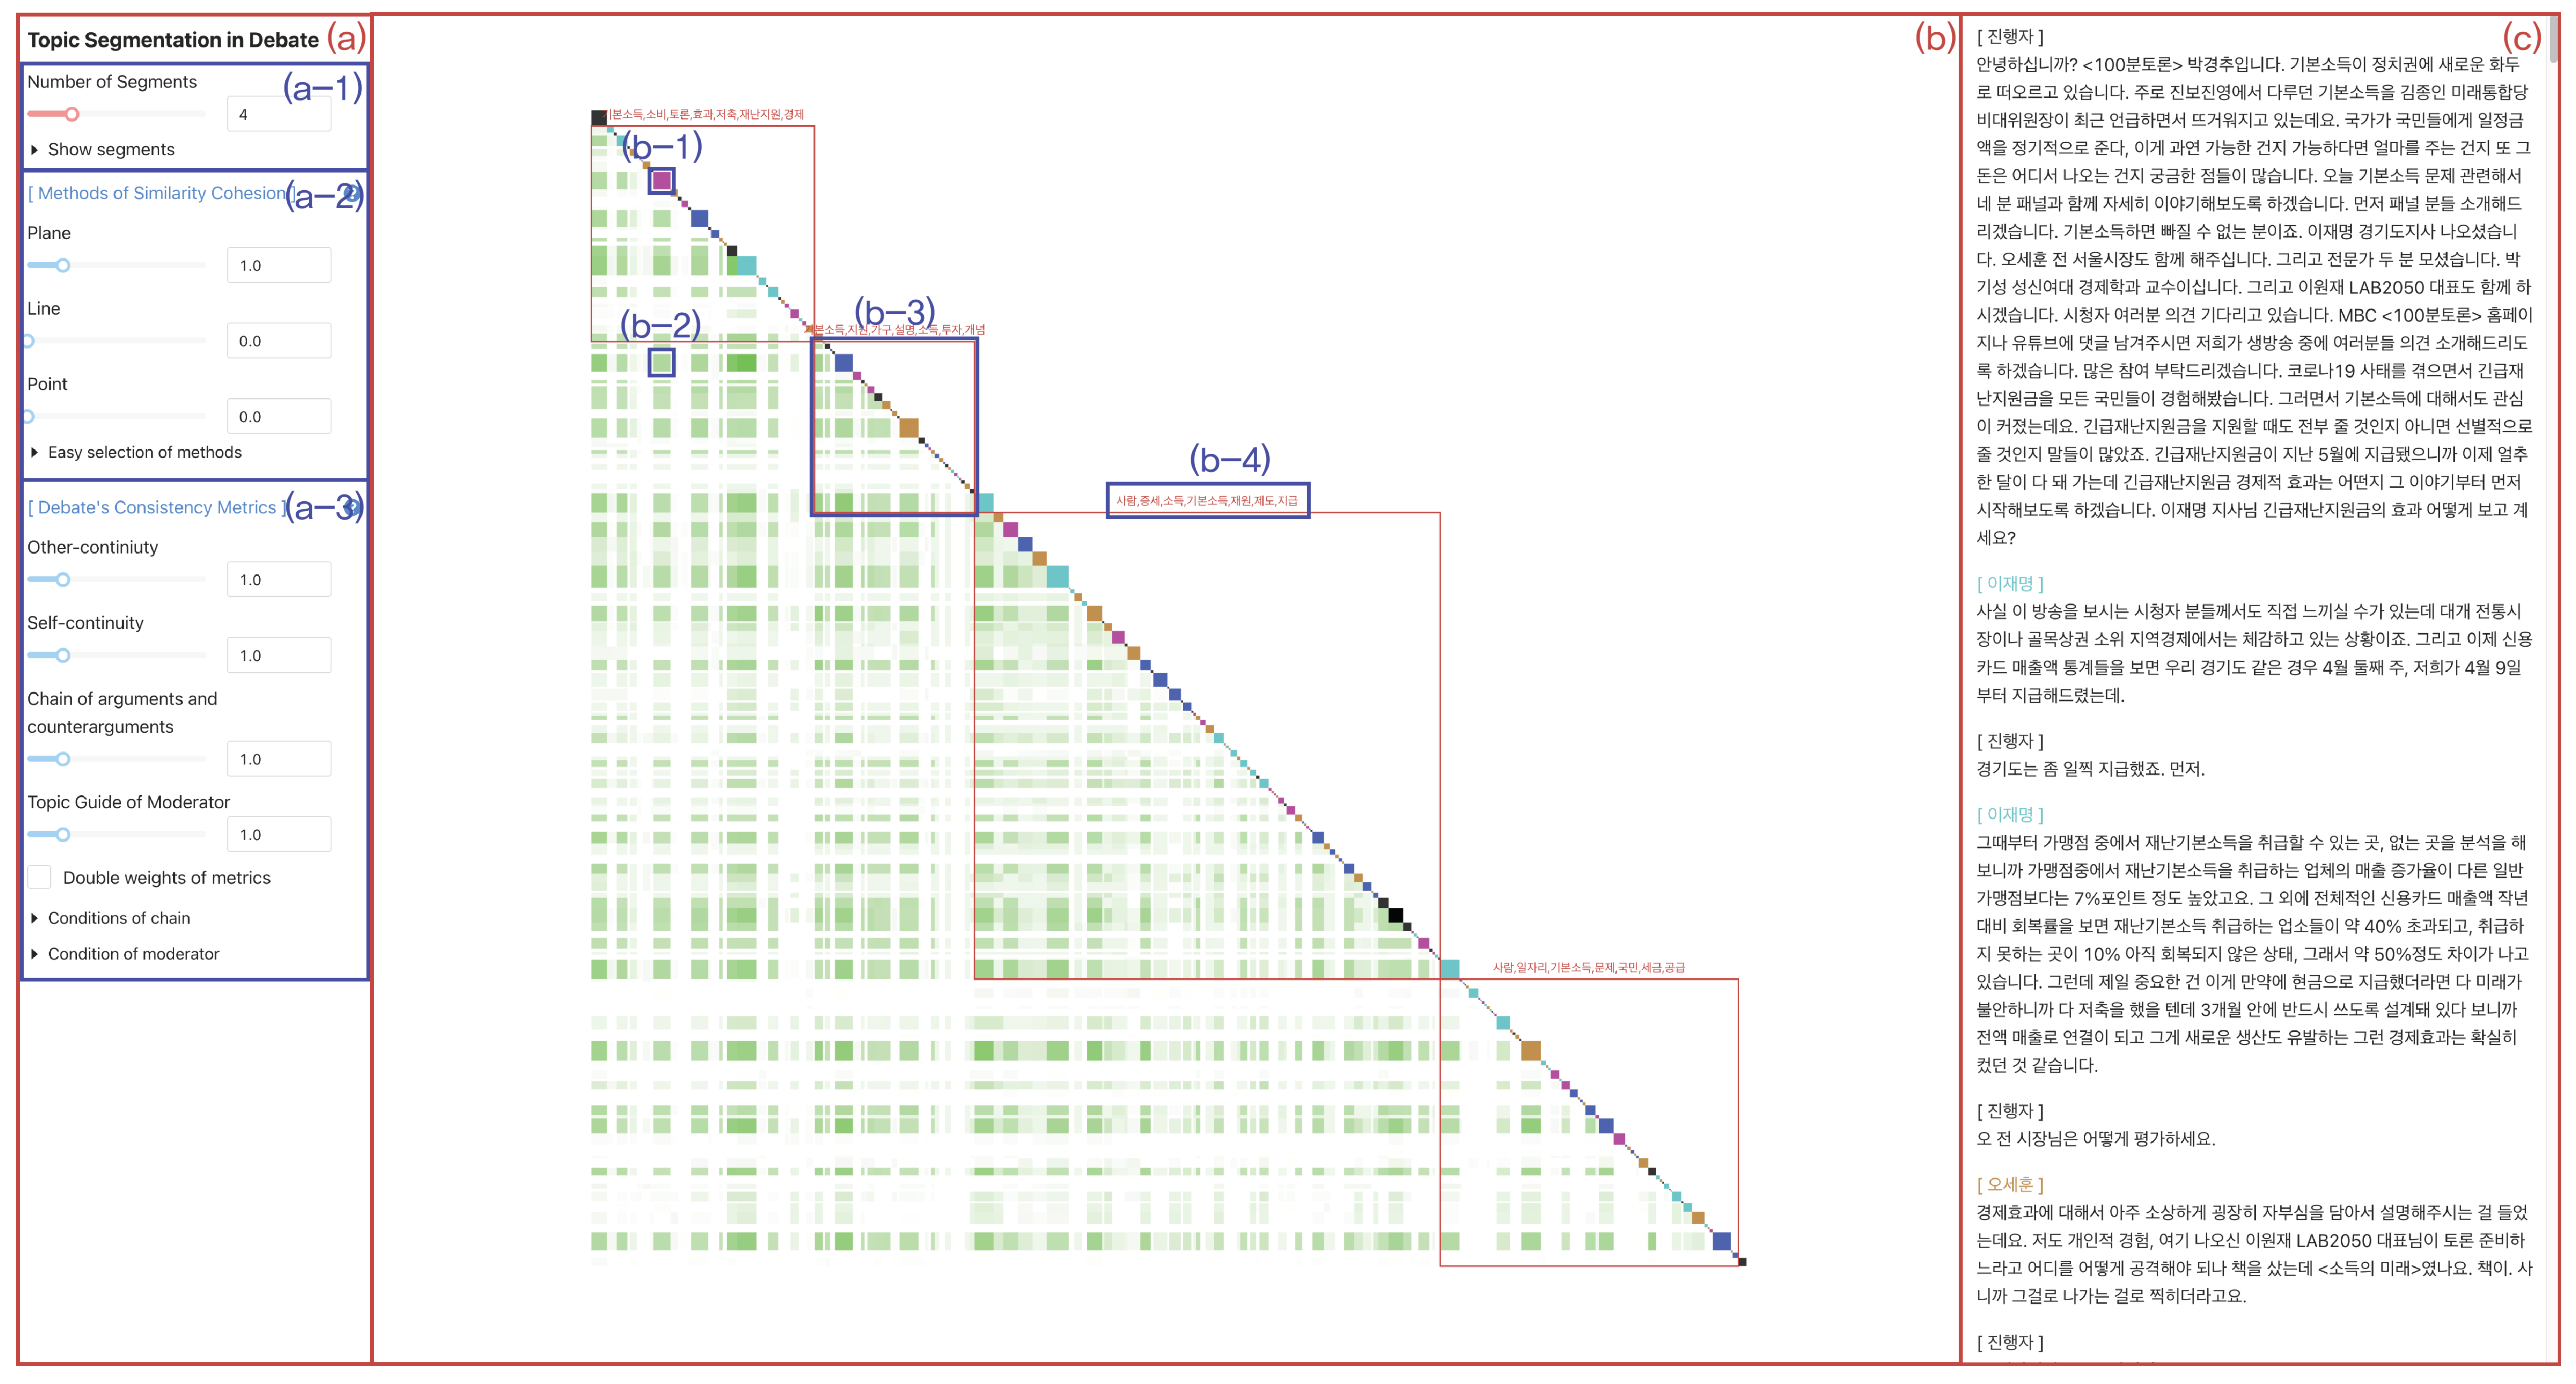
Applsci 12 02952 g016
Figure 17. User interface of CSseg: (a) is a controller with functions affecting topic segmentation; (b) is a visualization of conceptual recurrence showing all utterances, conceptual similarities, and topic segments; (c) is a transcript viewer that shows the content of the debate participants’ utterances.
Applsci 12 02952 g017
Figure 18. Conceptual similarities between Jaemyung Lee and Sehun Oh in the 100-Munite Debate “Is the era of basic income really coming?”
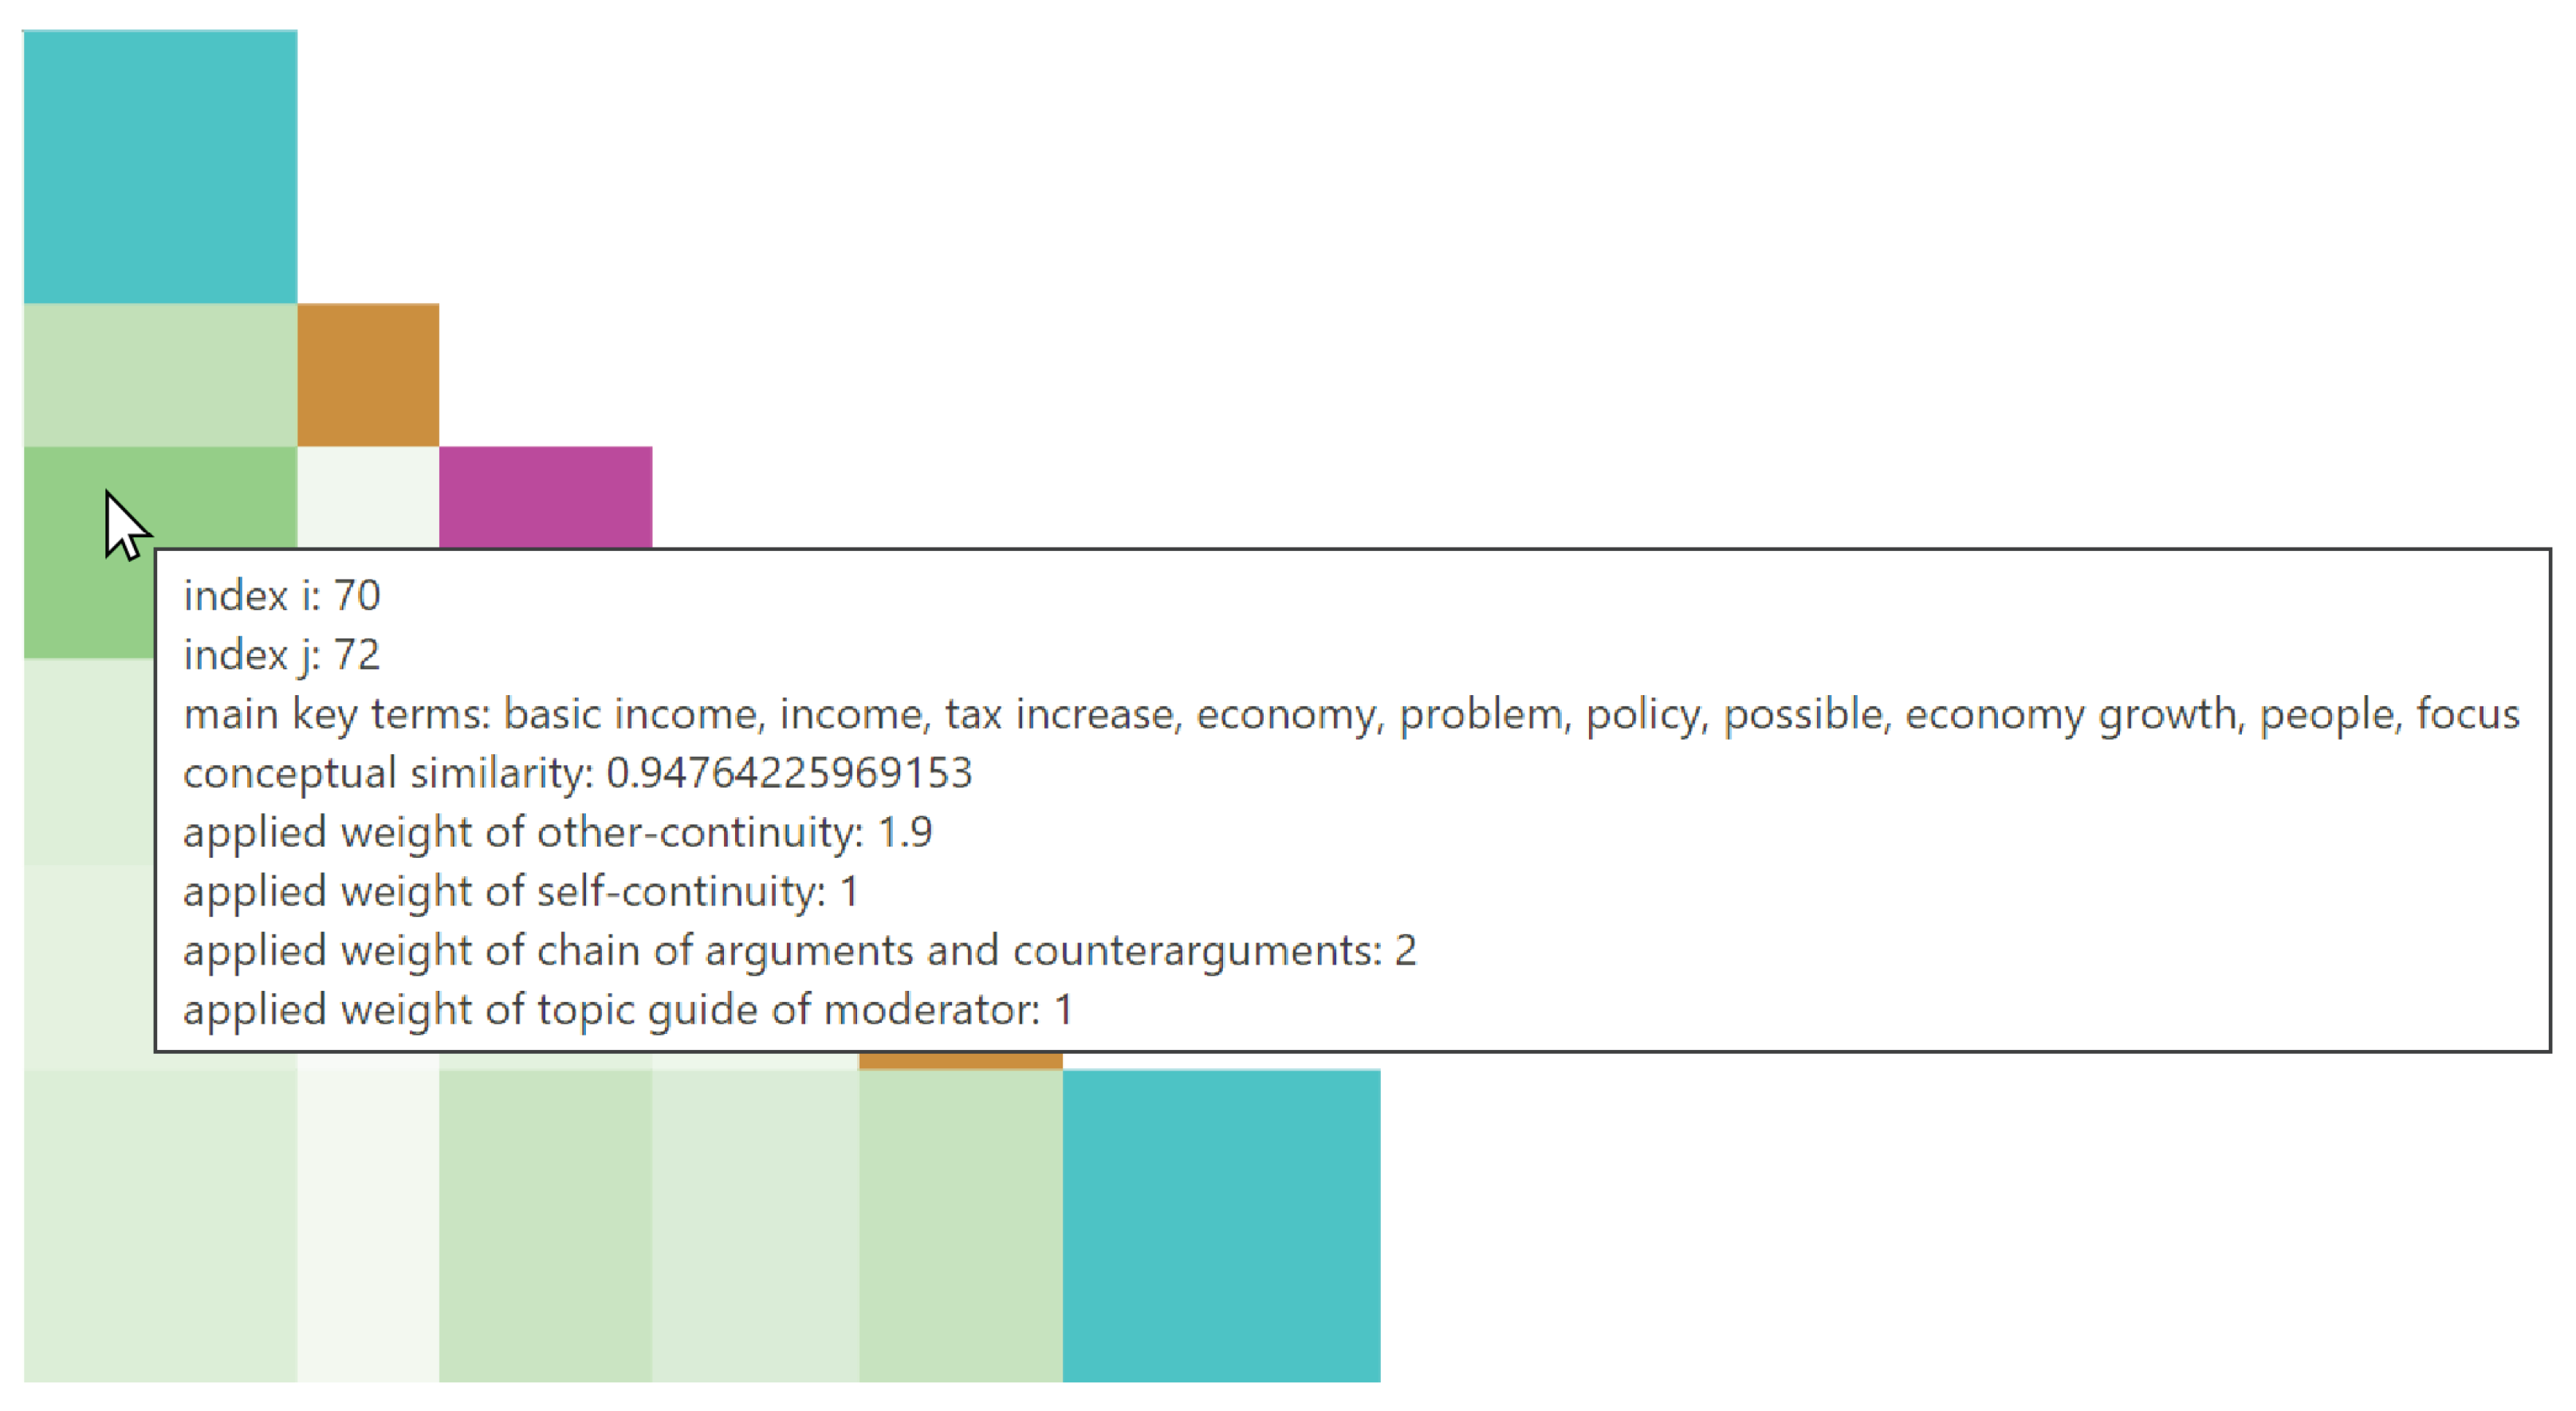
Applsci 12 02952 g018
Figure 19. Details of conceptual similarity when the user mouseovers the square.
Applsci 12 02952 g019
Figure 20. 
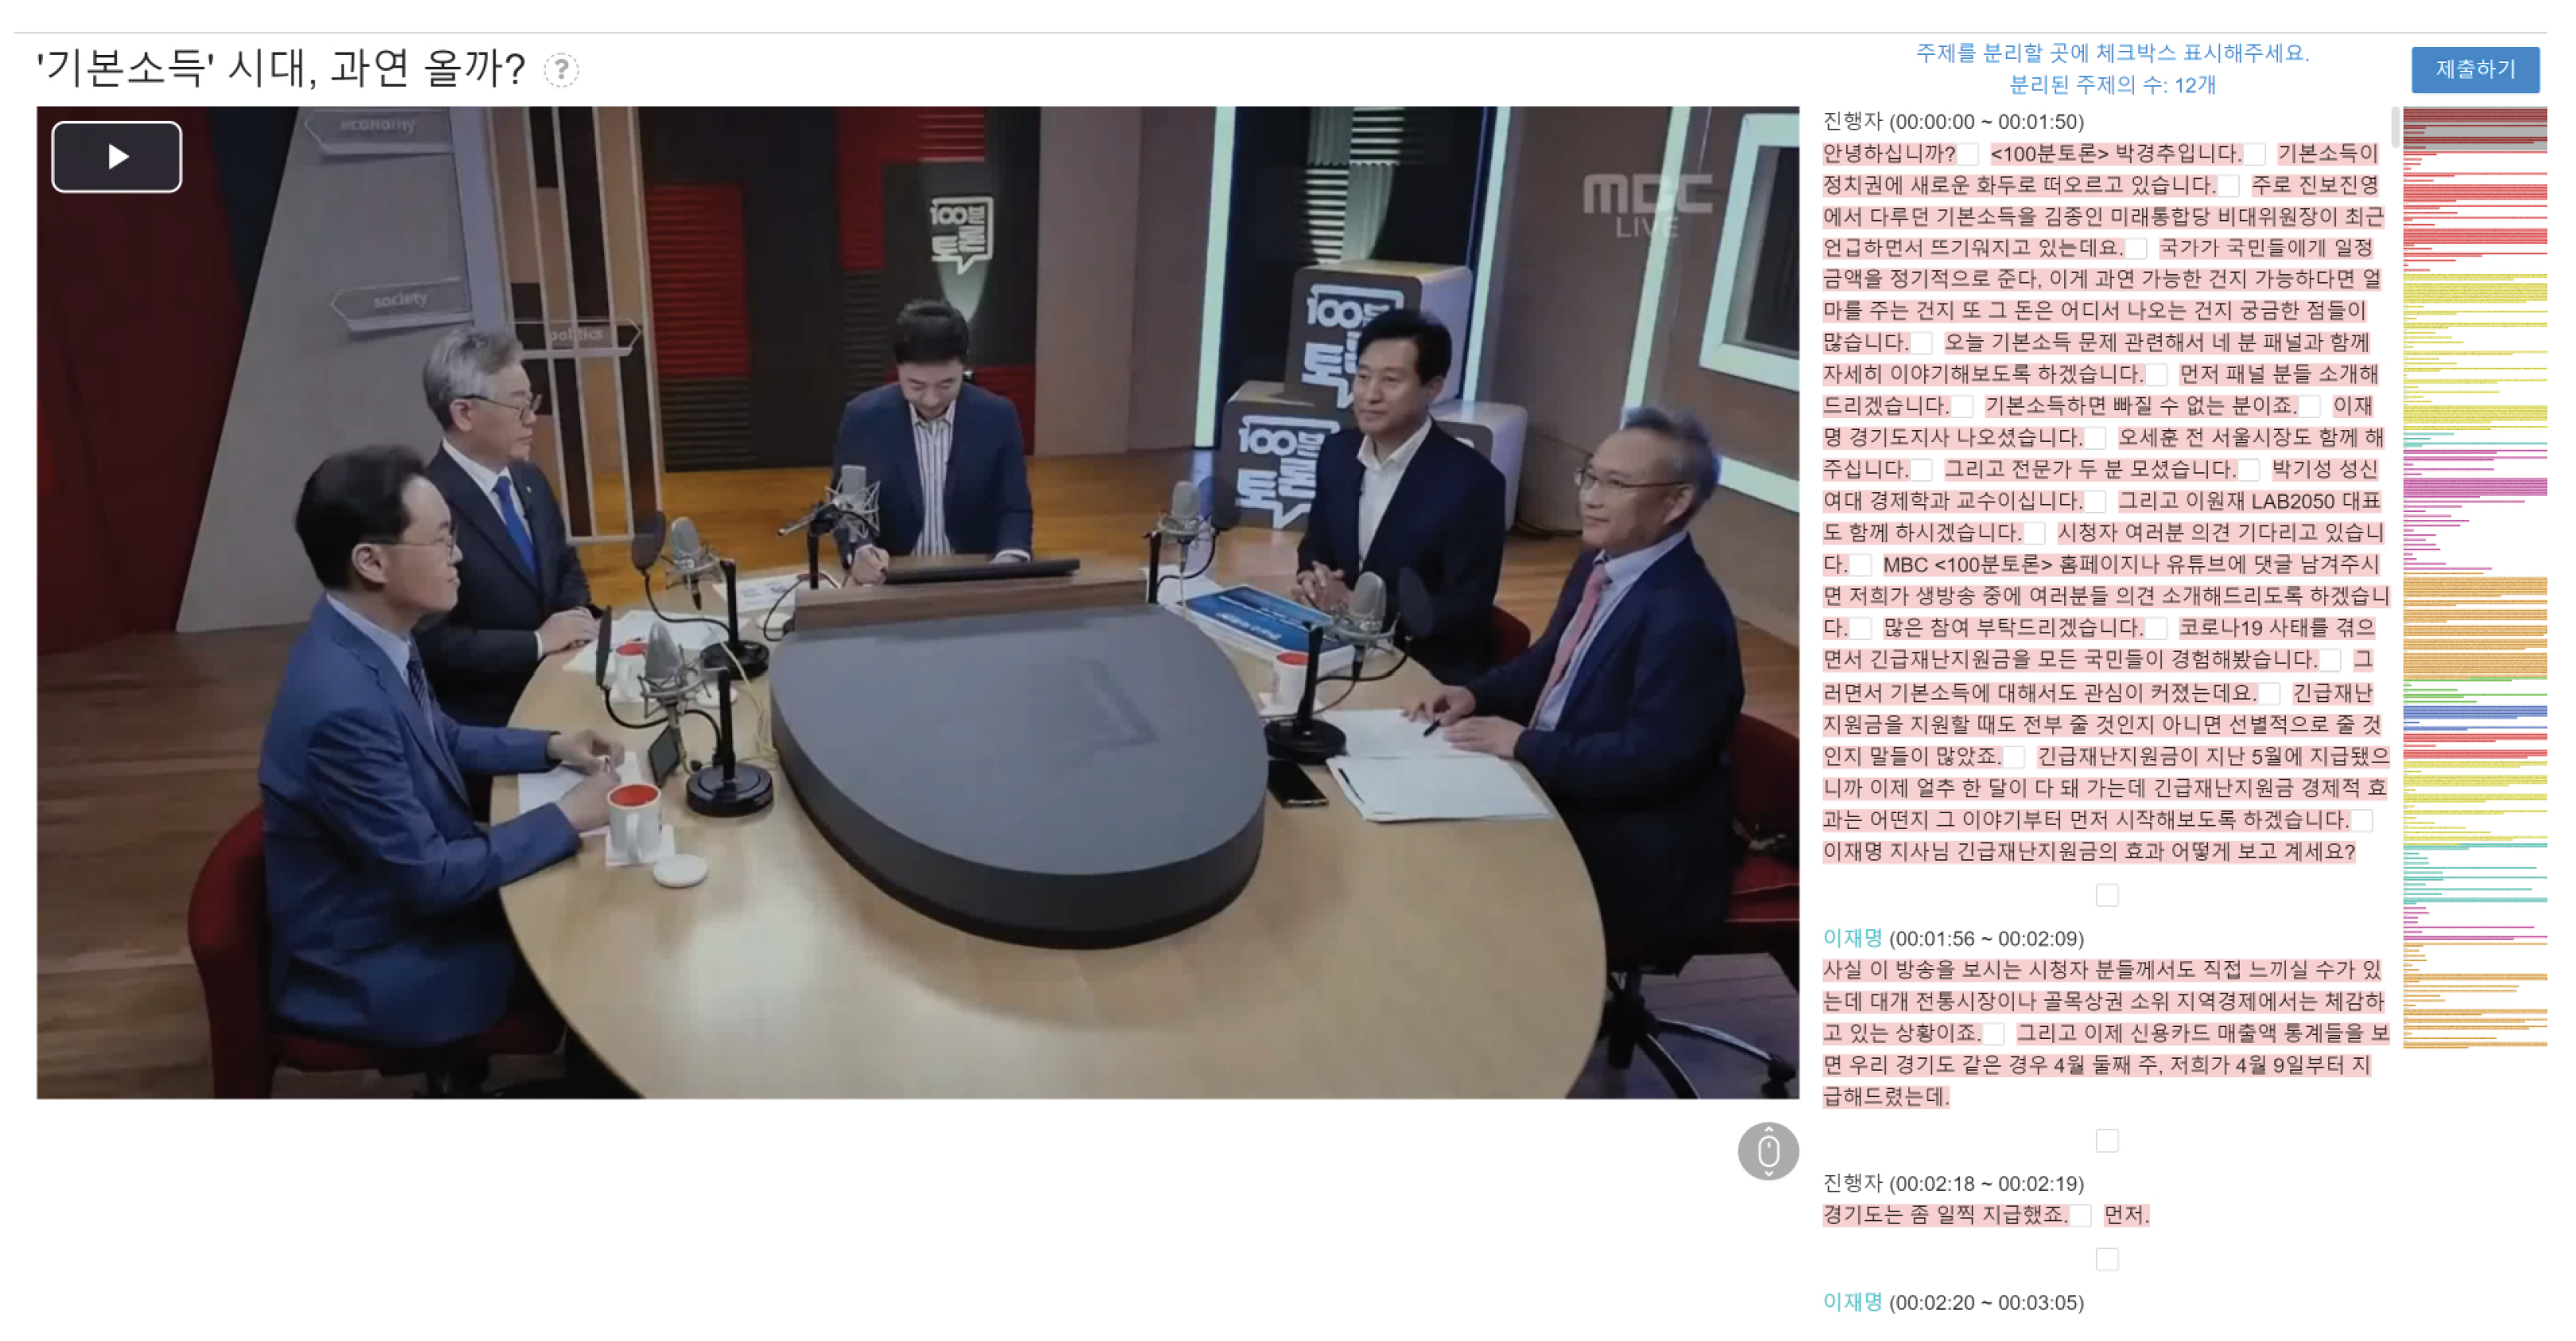
User interface configured to collect topic segmentation points from a subject.
Applsci 12 02952 g020
Figure 21. 
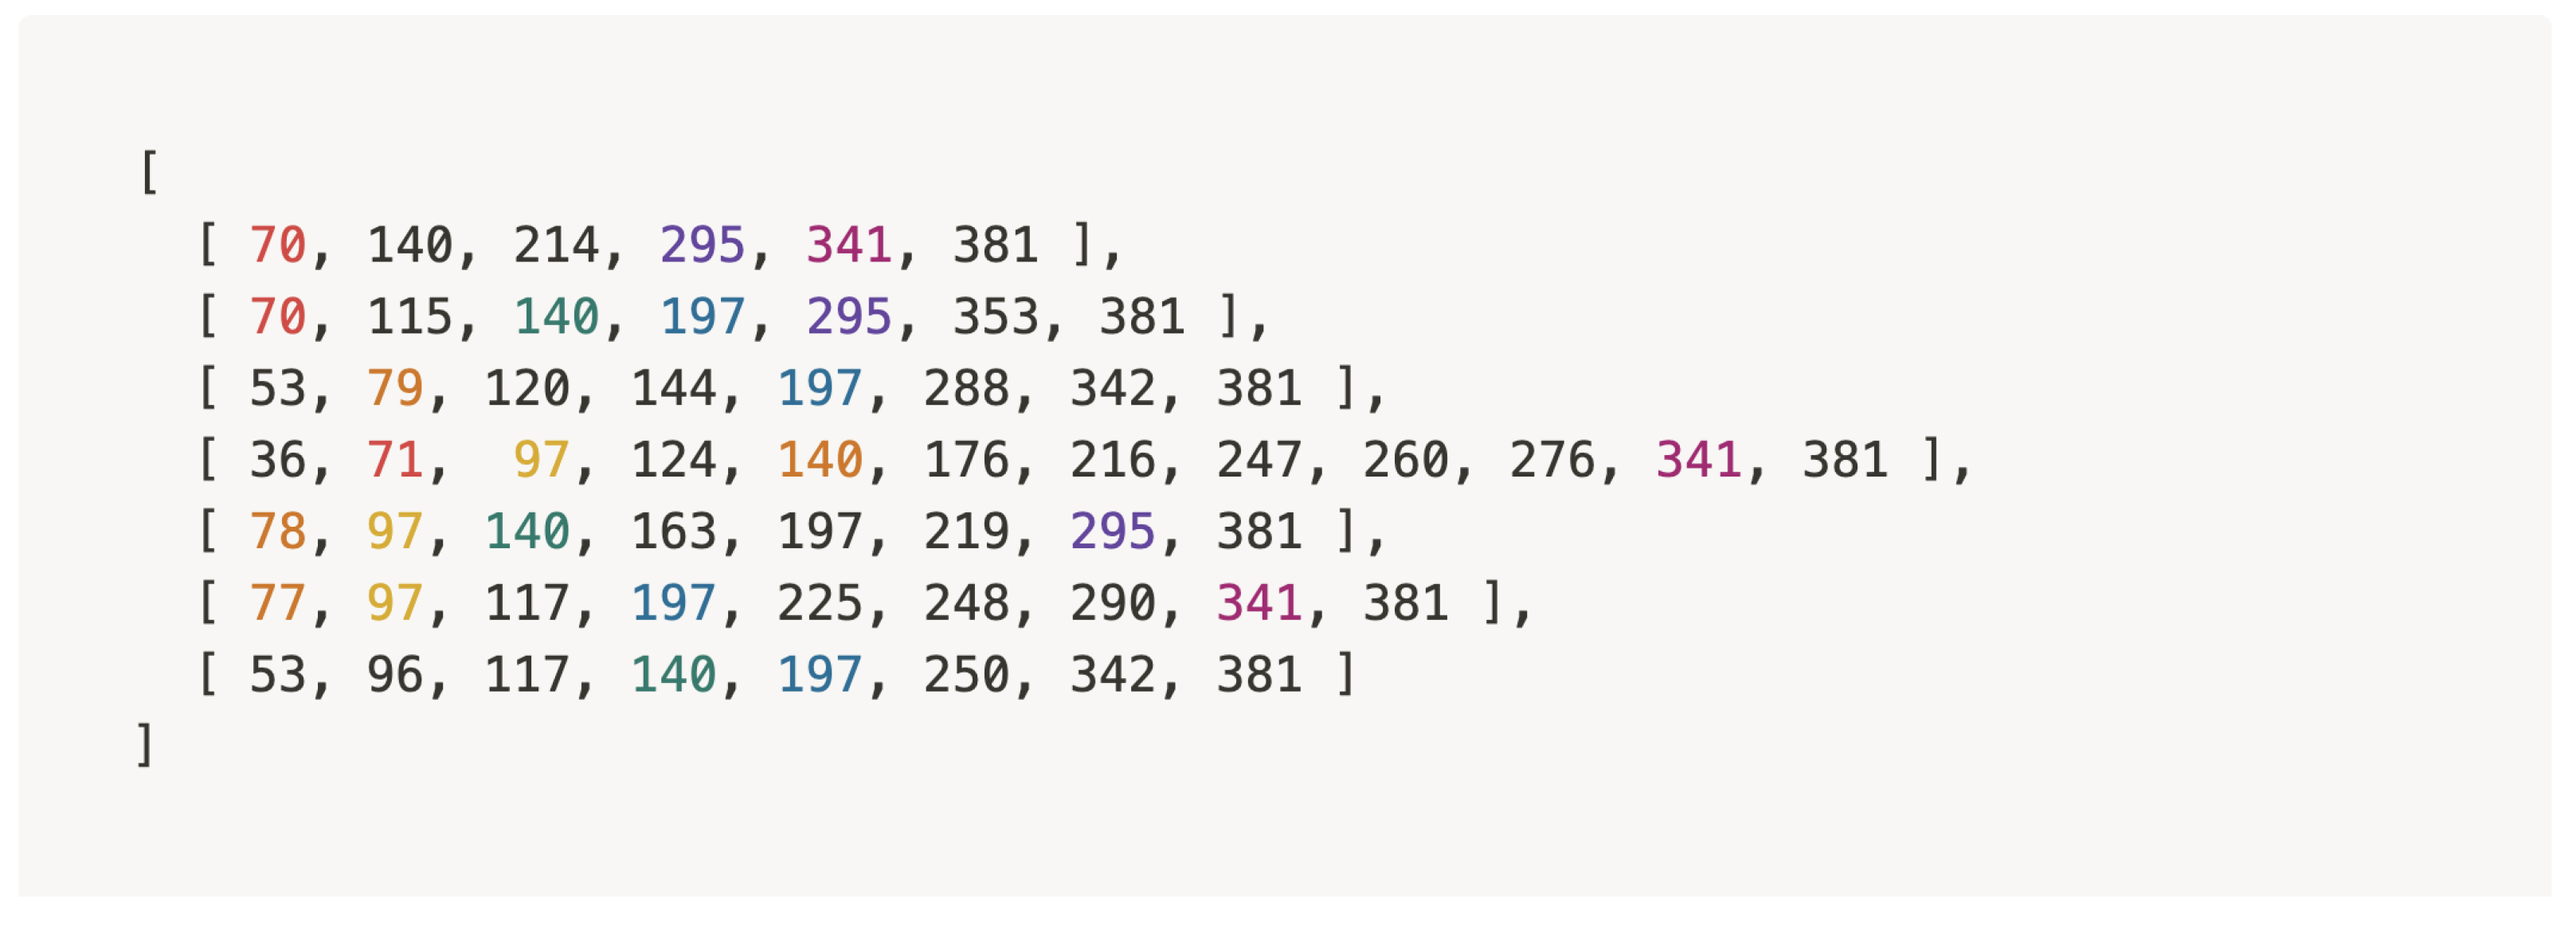
Topic segmentation points in ‘basic income’.
Applsci 12 02952 g021
Figure 22. Topic segmentation points in ‘volunteer military system’.
Applsci 12 02952 g022
Figure 23. Topic segmentation points in ‘SAT’.
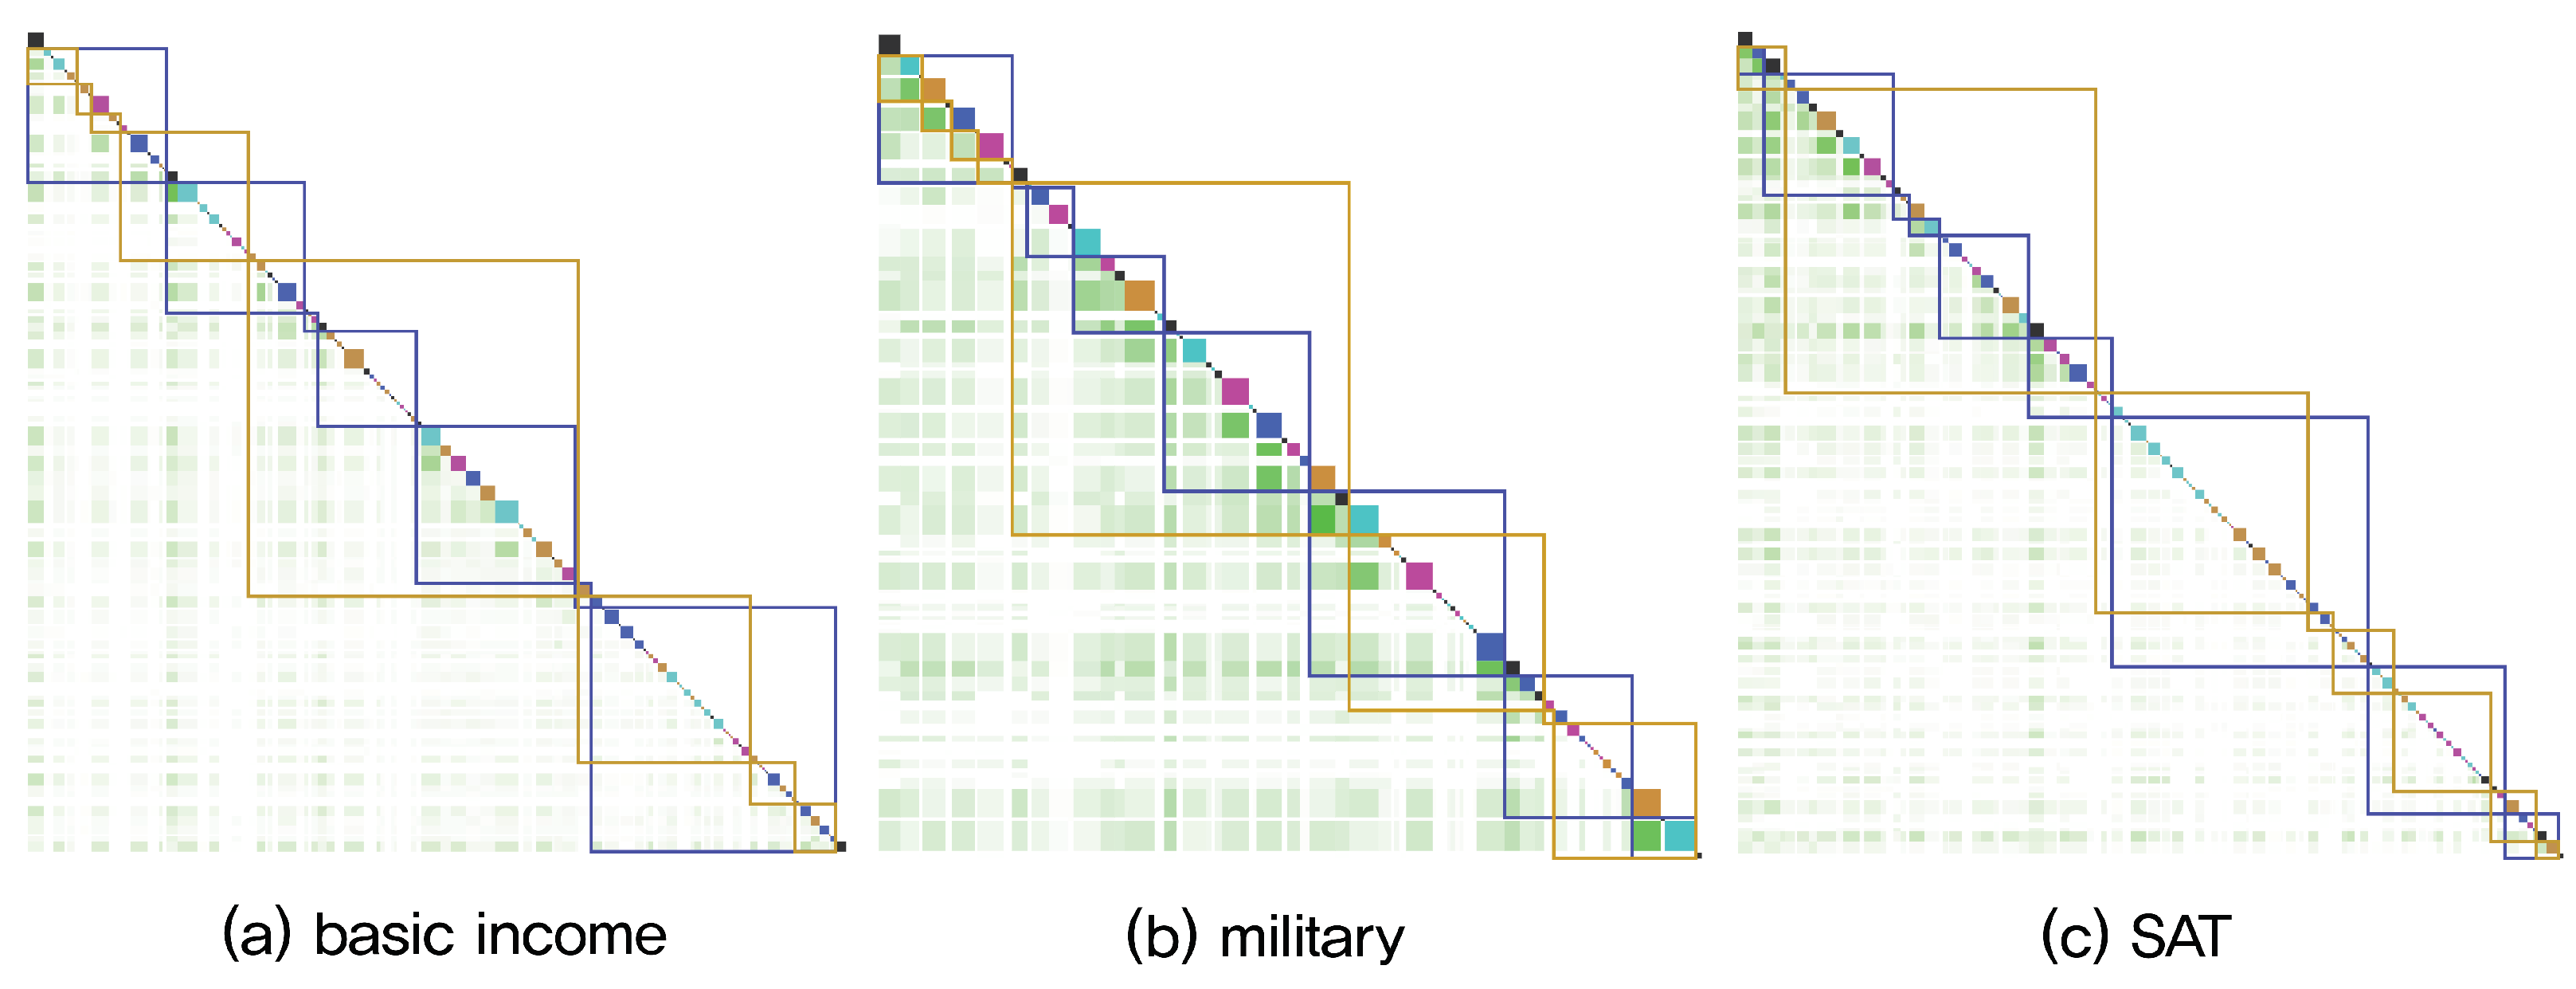
Applsci 12 02952 g023
Figure 24. 
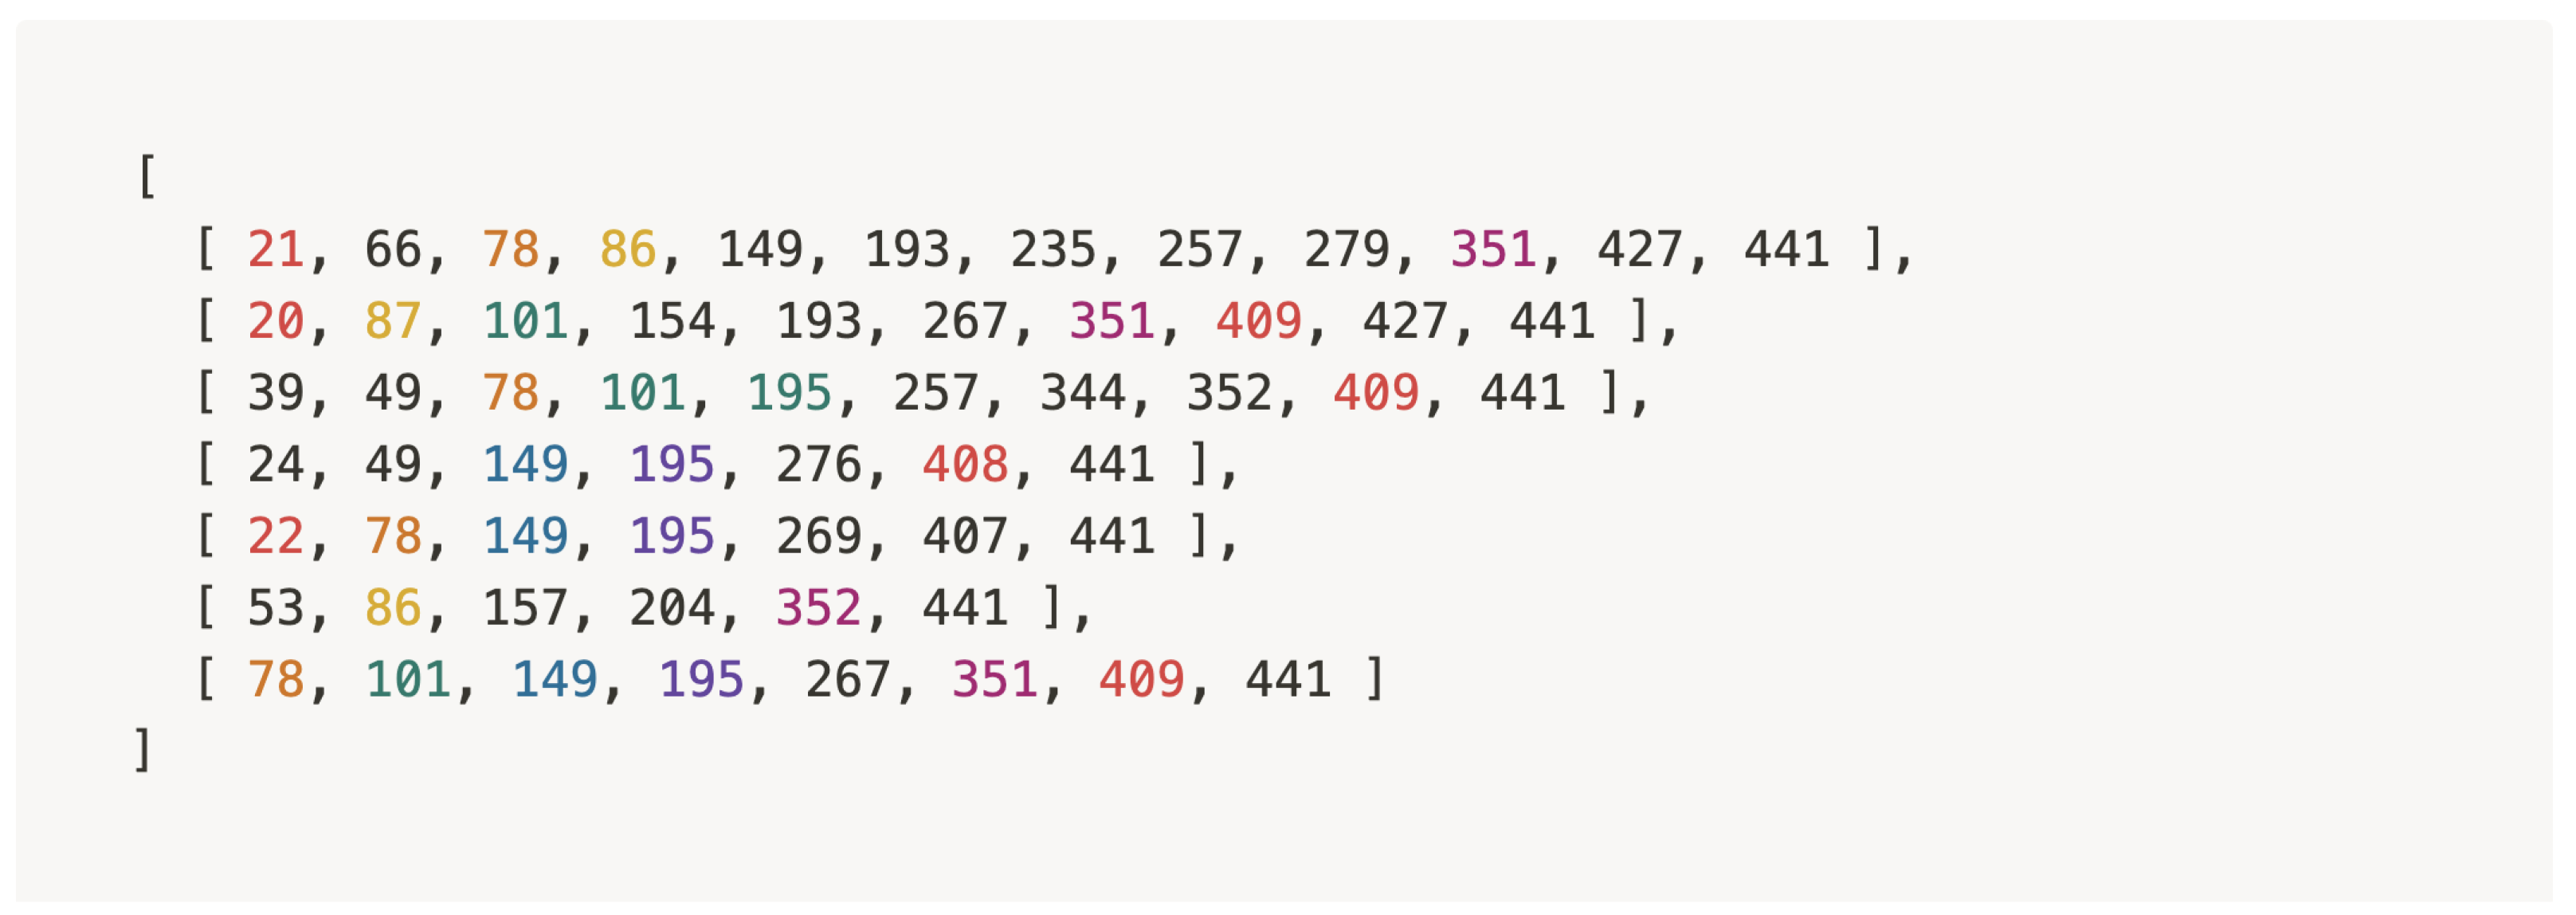
Results of segmenting transcripts based on topic segmentation points marked at the same location by more than three out of seven subjects.
Applsci 12 02952 g024
Figure 25. Exploration process of the probe of P k , W d . Colored squares represent each sentence. The leftmost square represents the first sentence of text, and the color of the square represents the topic. The U-shaped joined arrows represent the probe, which moves one sentence at a time from left to right, as shown by the dotted lines.
Applsci 12 02952 g025
Figure 26. 
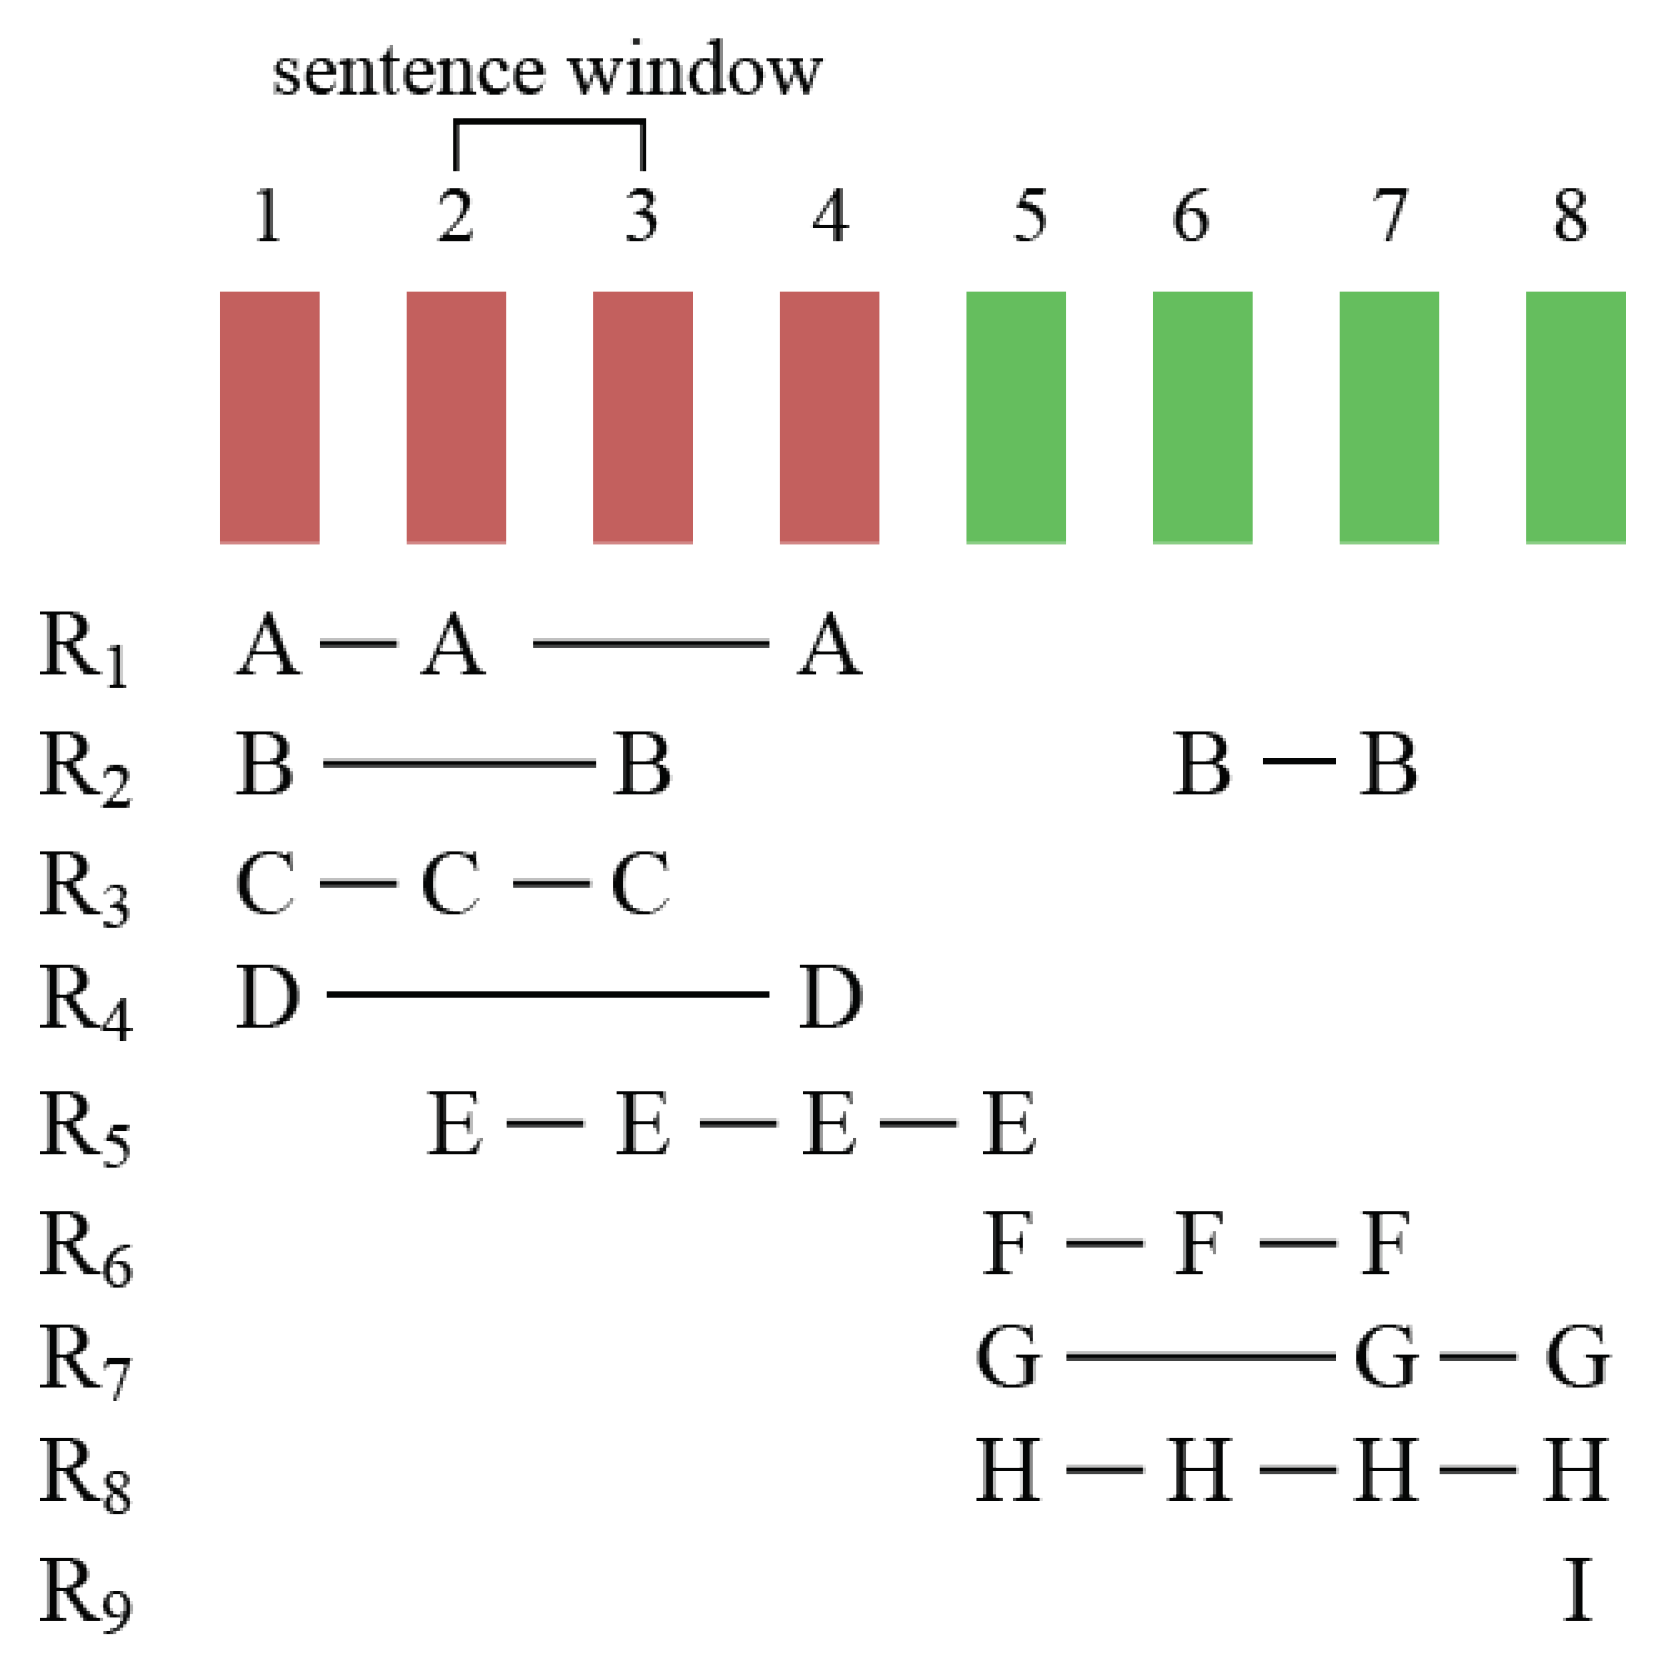
Simplified Lexical Chains. The squares at the top indicate sentences. R 1 R 9 represent the lexical chains for each word A to I.
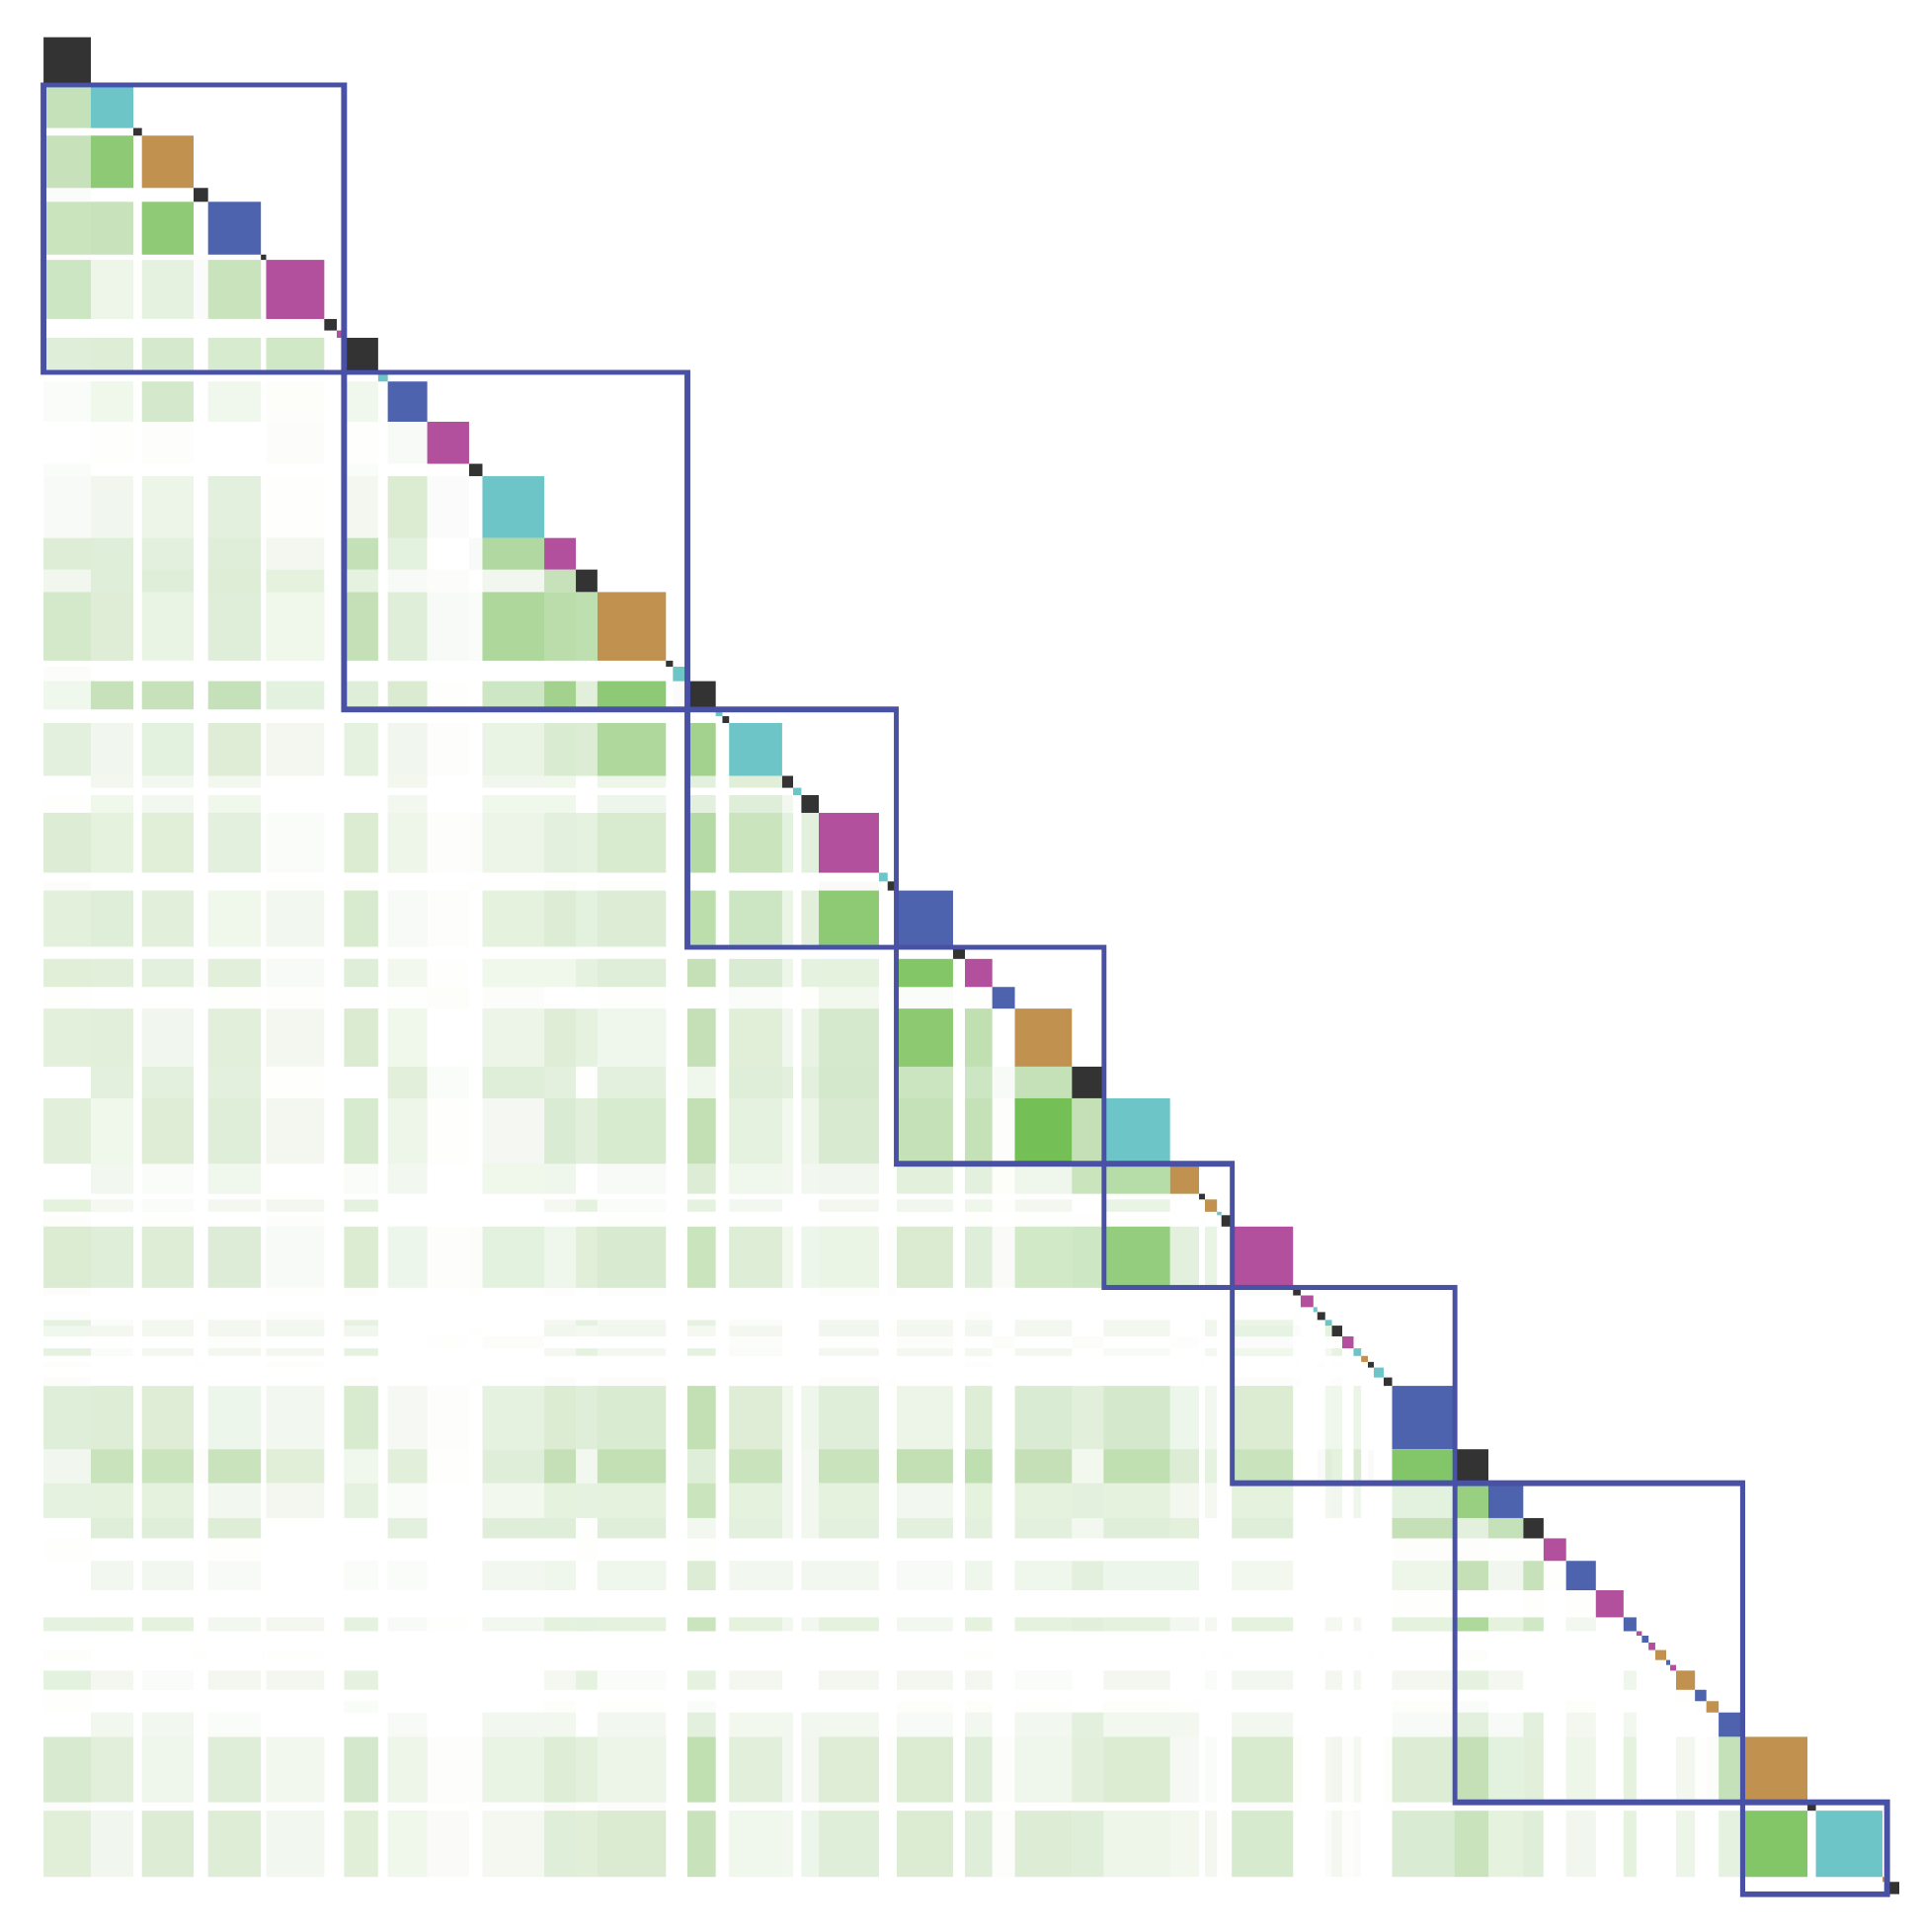
Applsci 12 02952 g026
Figure 27. Topic segments of CSseg where Plane, Line, and Point are combined and the debate consistency metrics are applied.
Applsci 12 02952 g027
Figure 28. Topic segments of LCseg.
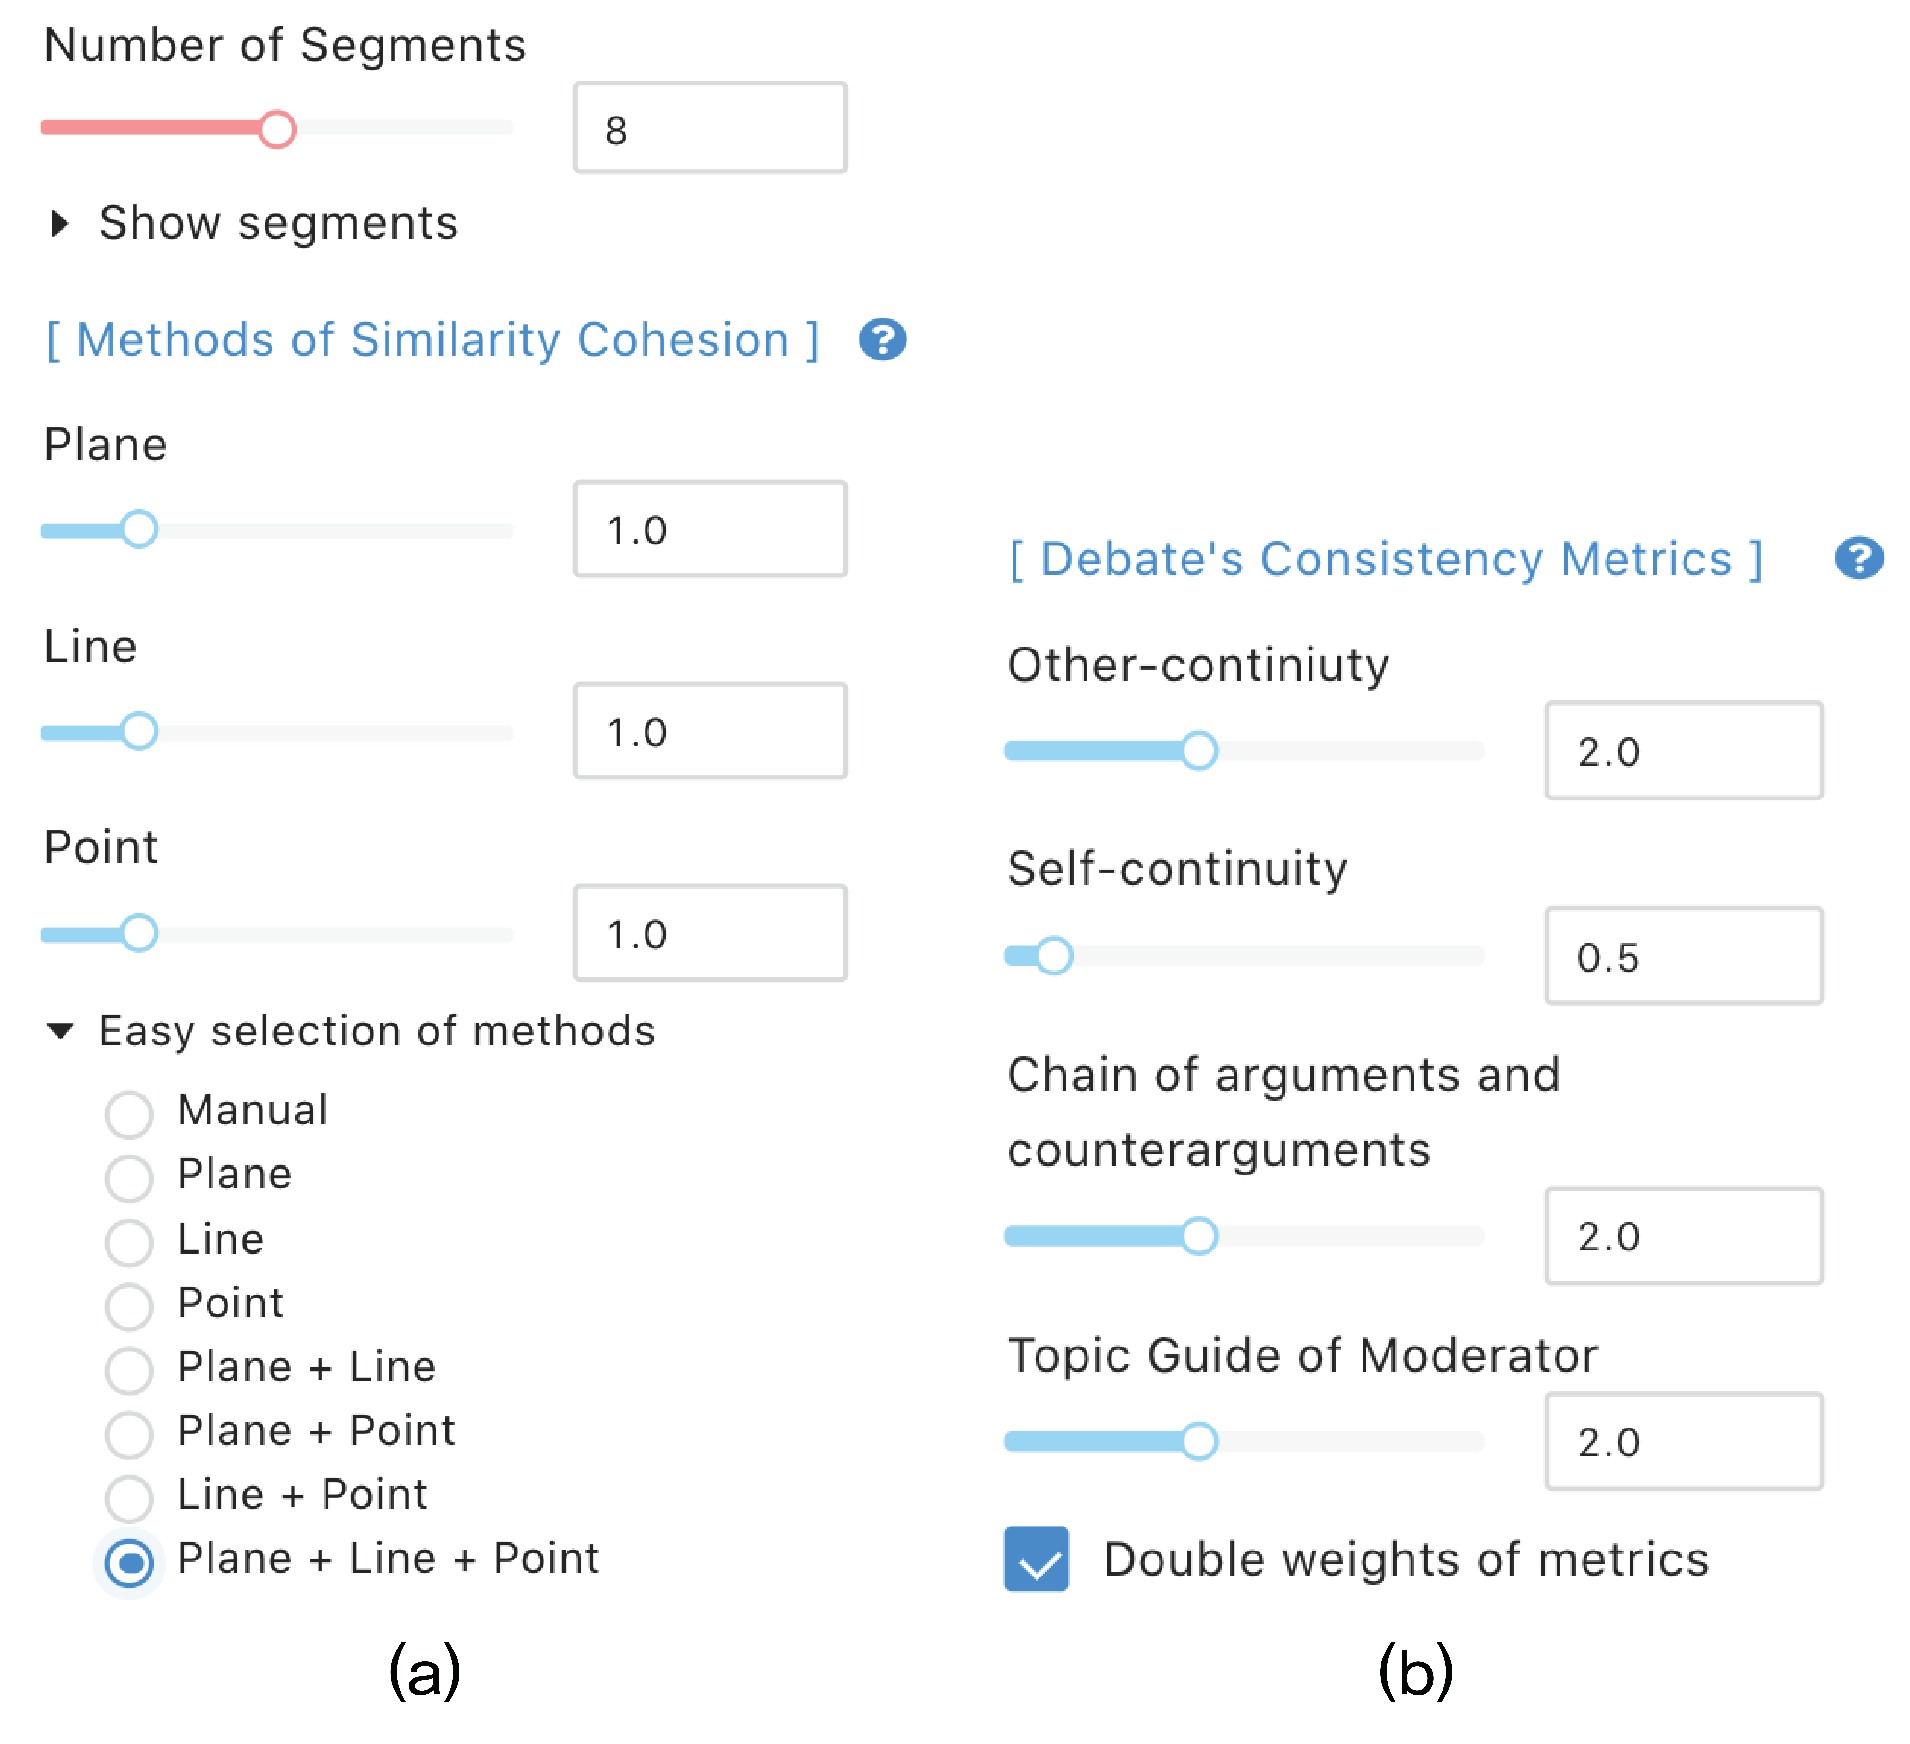
Applsci 12 02952 g028
Figure 29. A controller with all debate consistency metrics applied. (a) Control variables are shown. The number of topic segments was controlled to 8. Similarity cohesion calculation methods were controlled with the weights for Plane, Line, and Point in a 1:1:1 ratio. (b) Weights of all debate consistency metrics were doubled in the direction of improving internal consistency.
Applsci 12 02952 g029
Figure 30. Result of topic segmentation after doubling the weights of all debate consistency metrics in the direction of improved internal consistency.
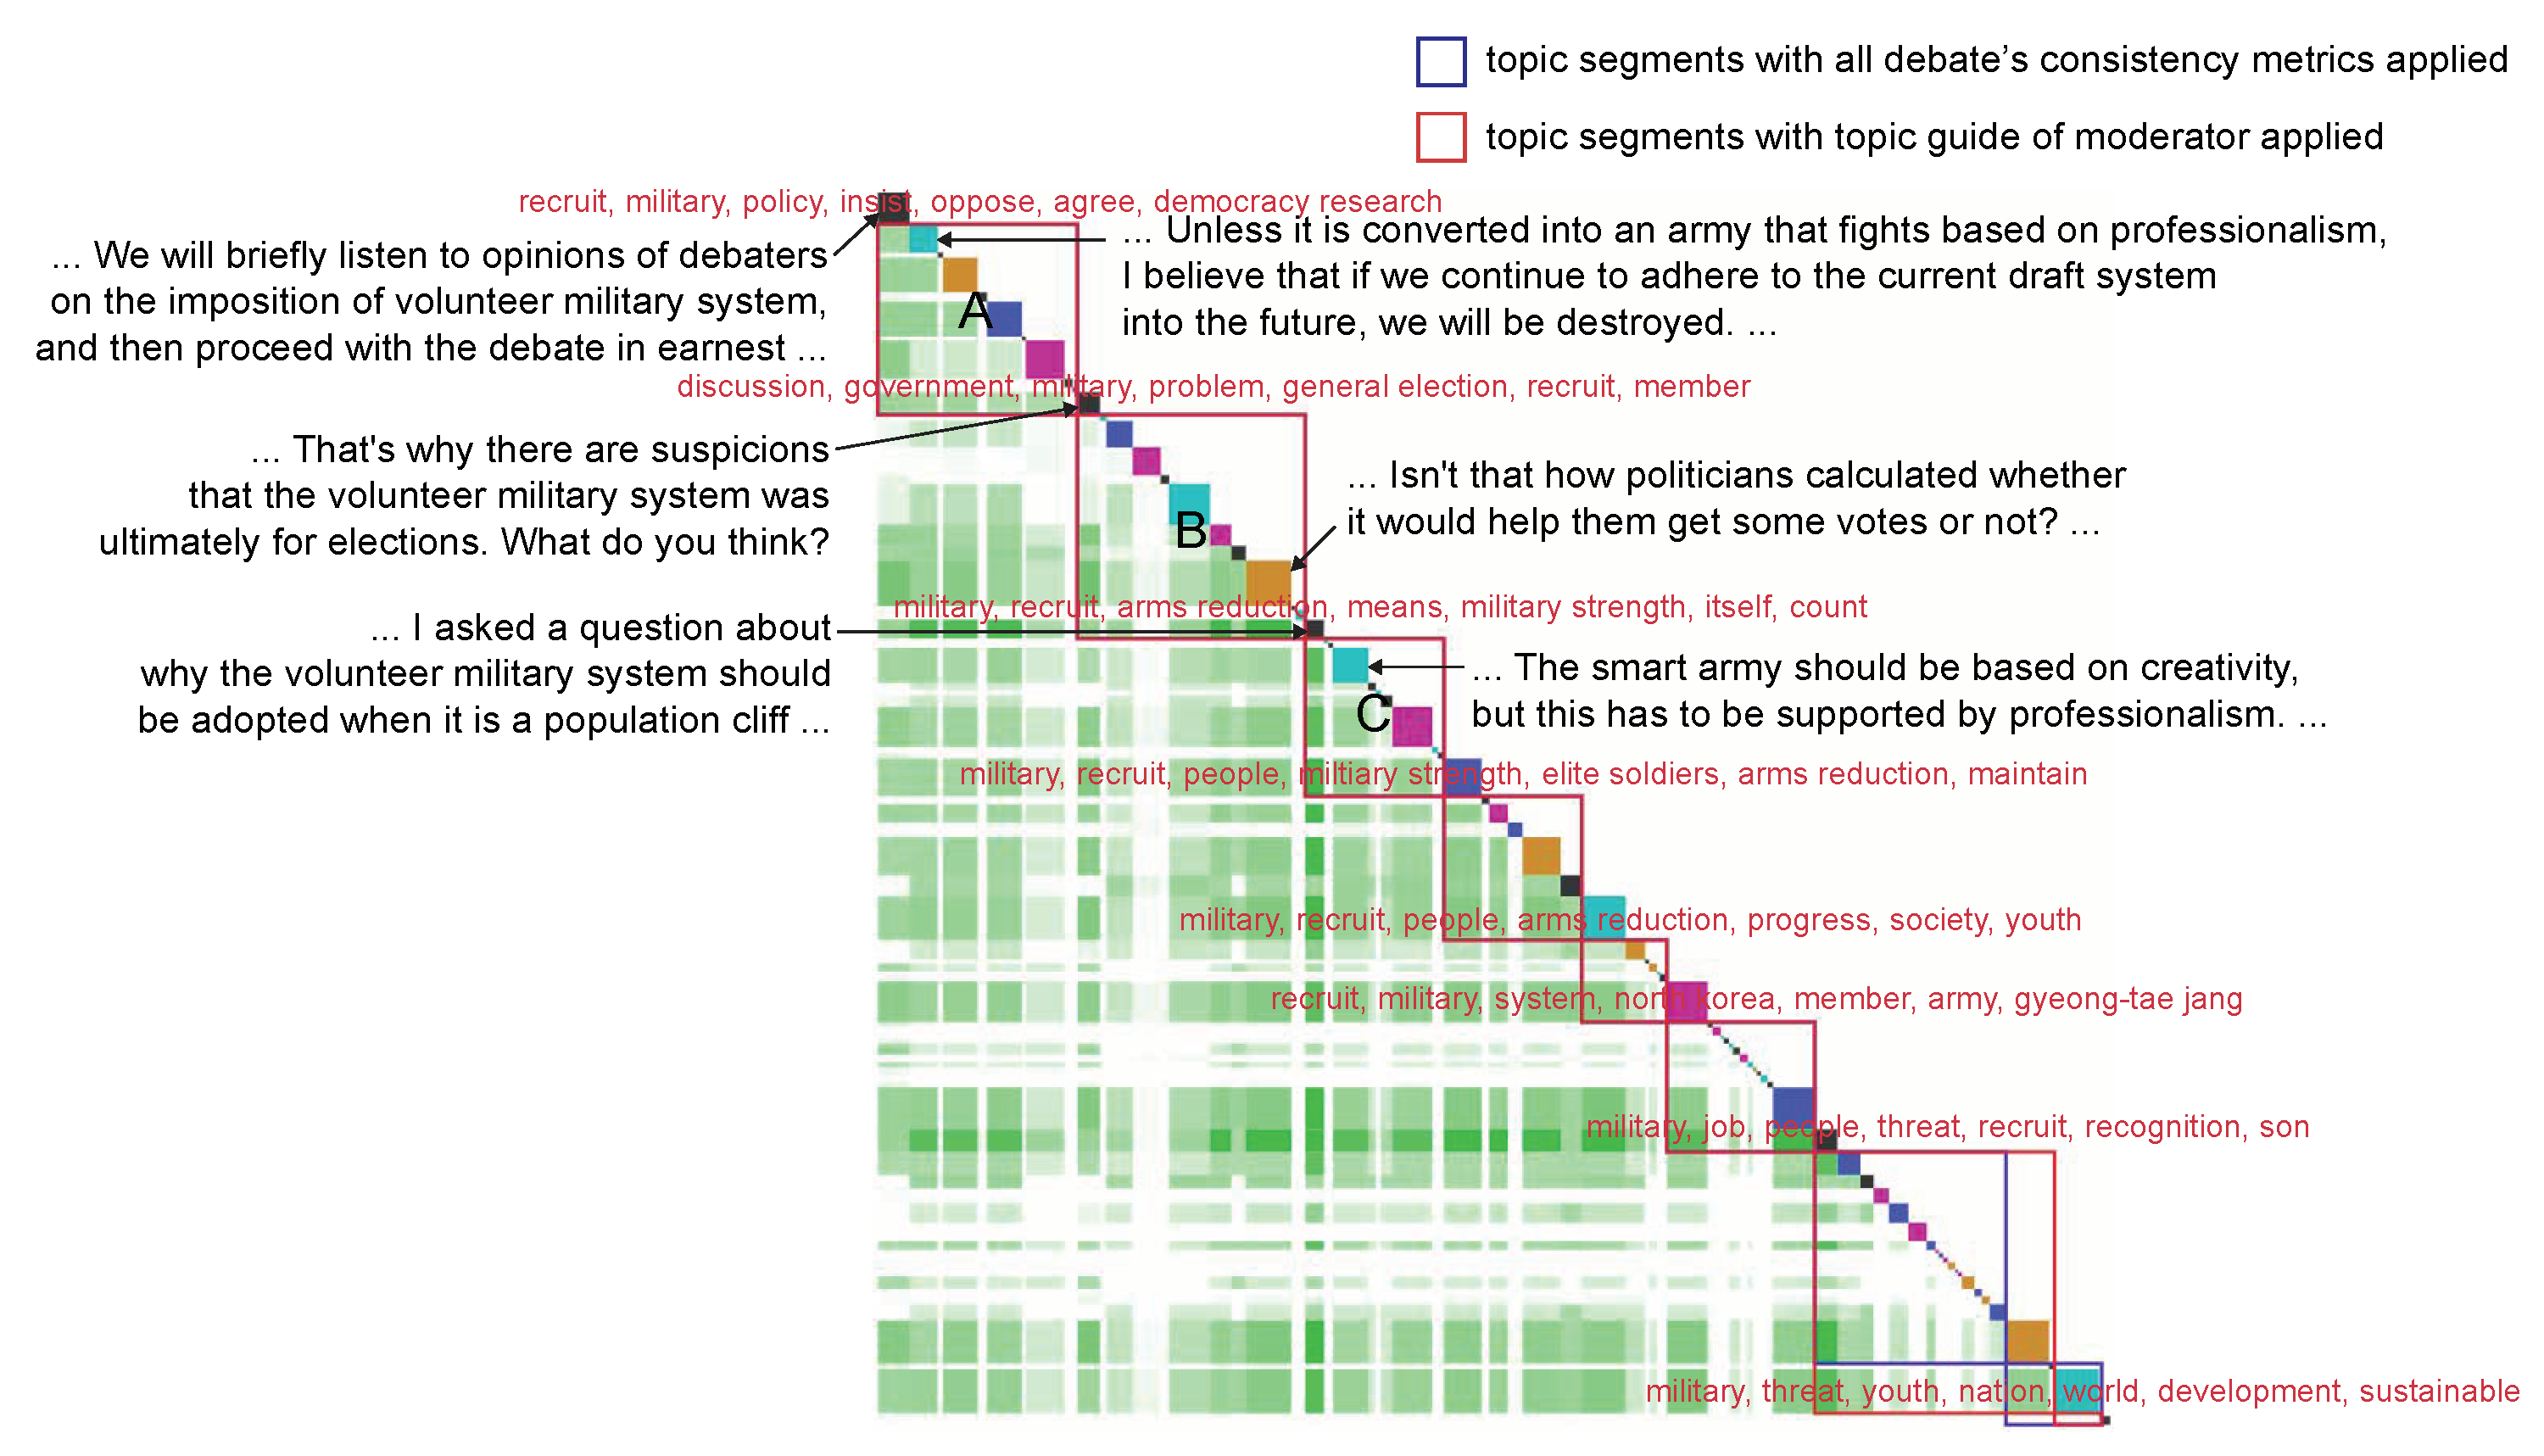
Applsci 12 02952 g030
Figure 31. Comparison of a case where weight of “topic guide of moderator” was applied and a case where all weights of debate consistency metrics were applied. Red squares are topic segments when weighted only by “topic guide of moderator”, and blue squares are topic segments of a result weighted by all debate consistency metrics.
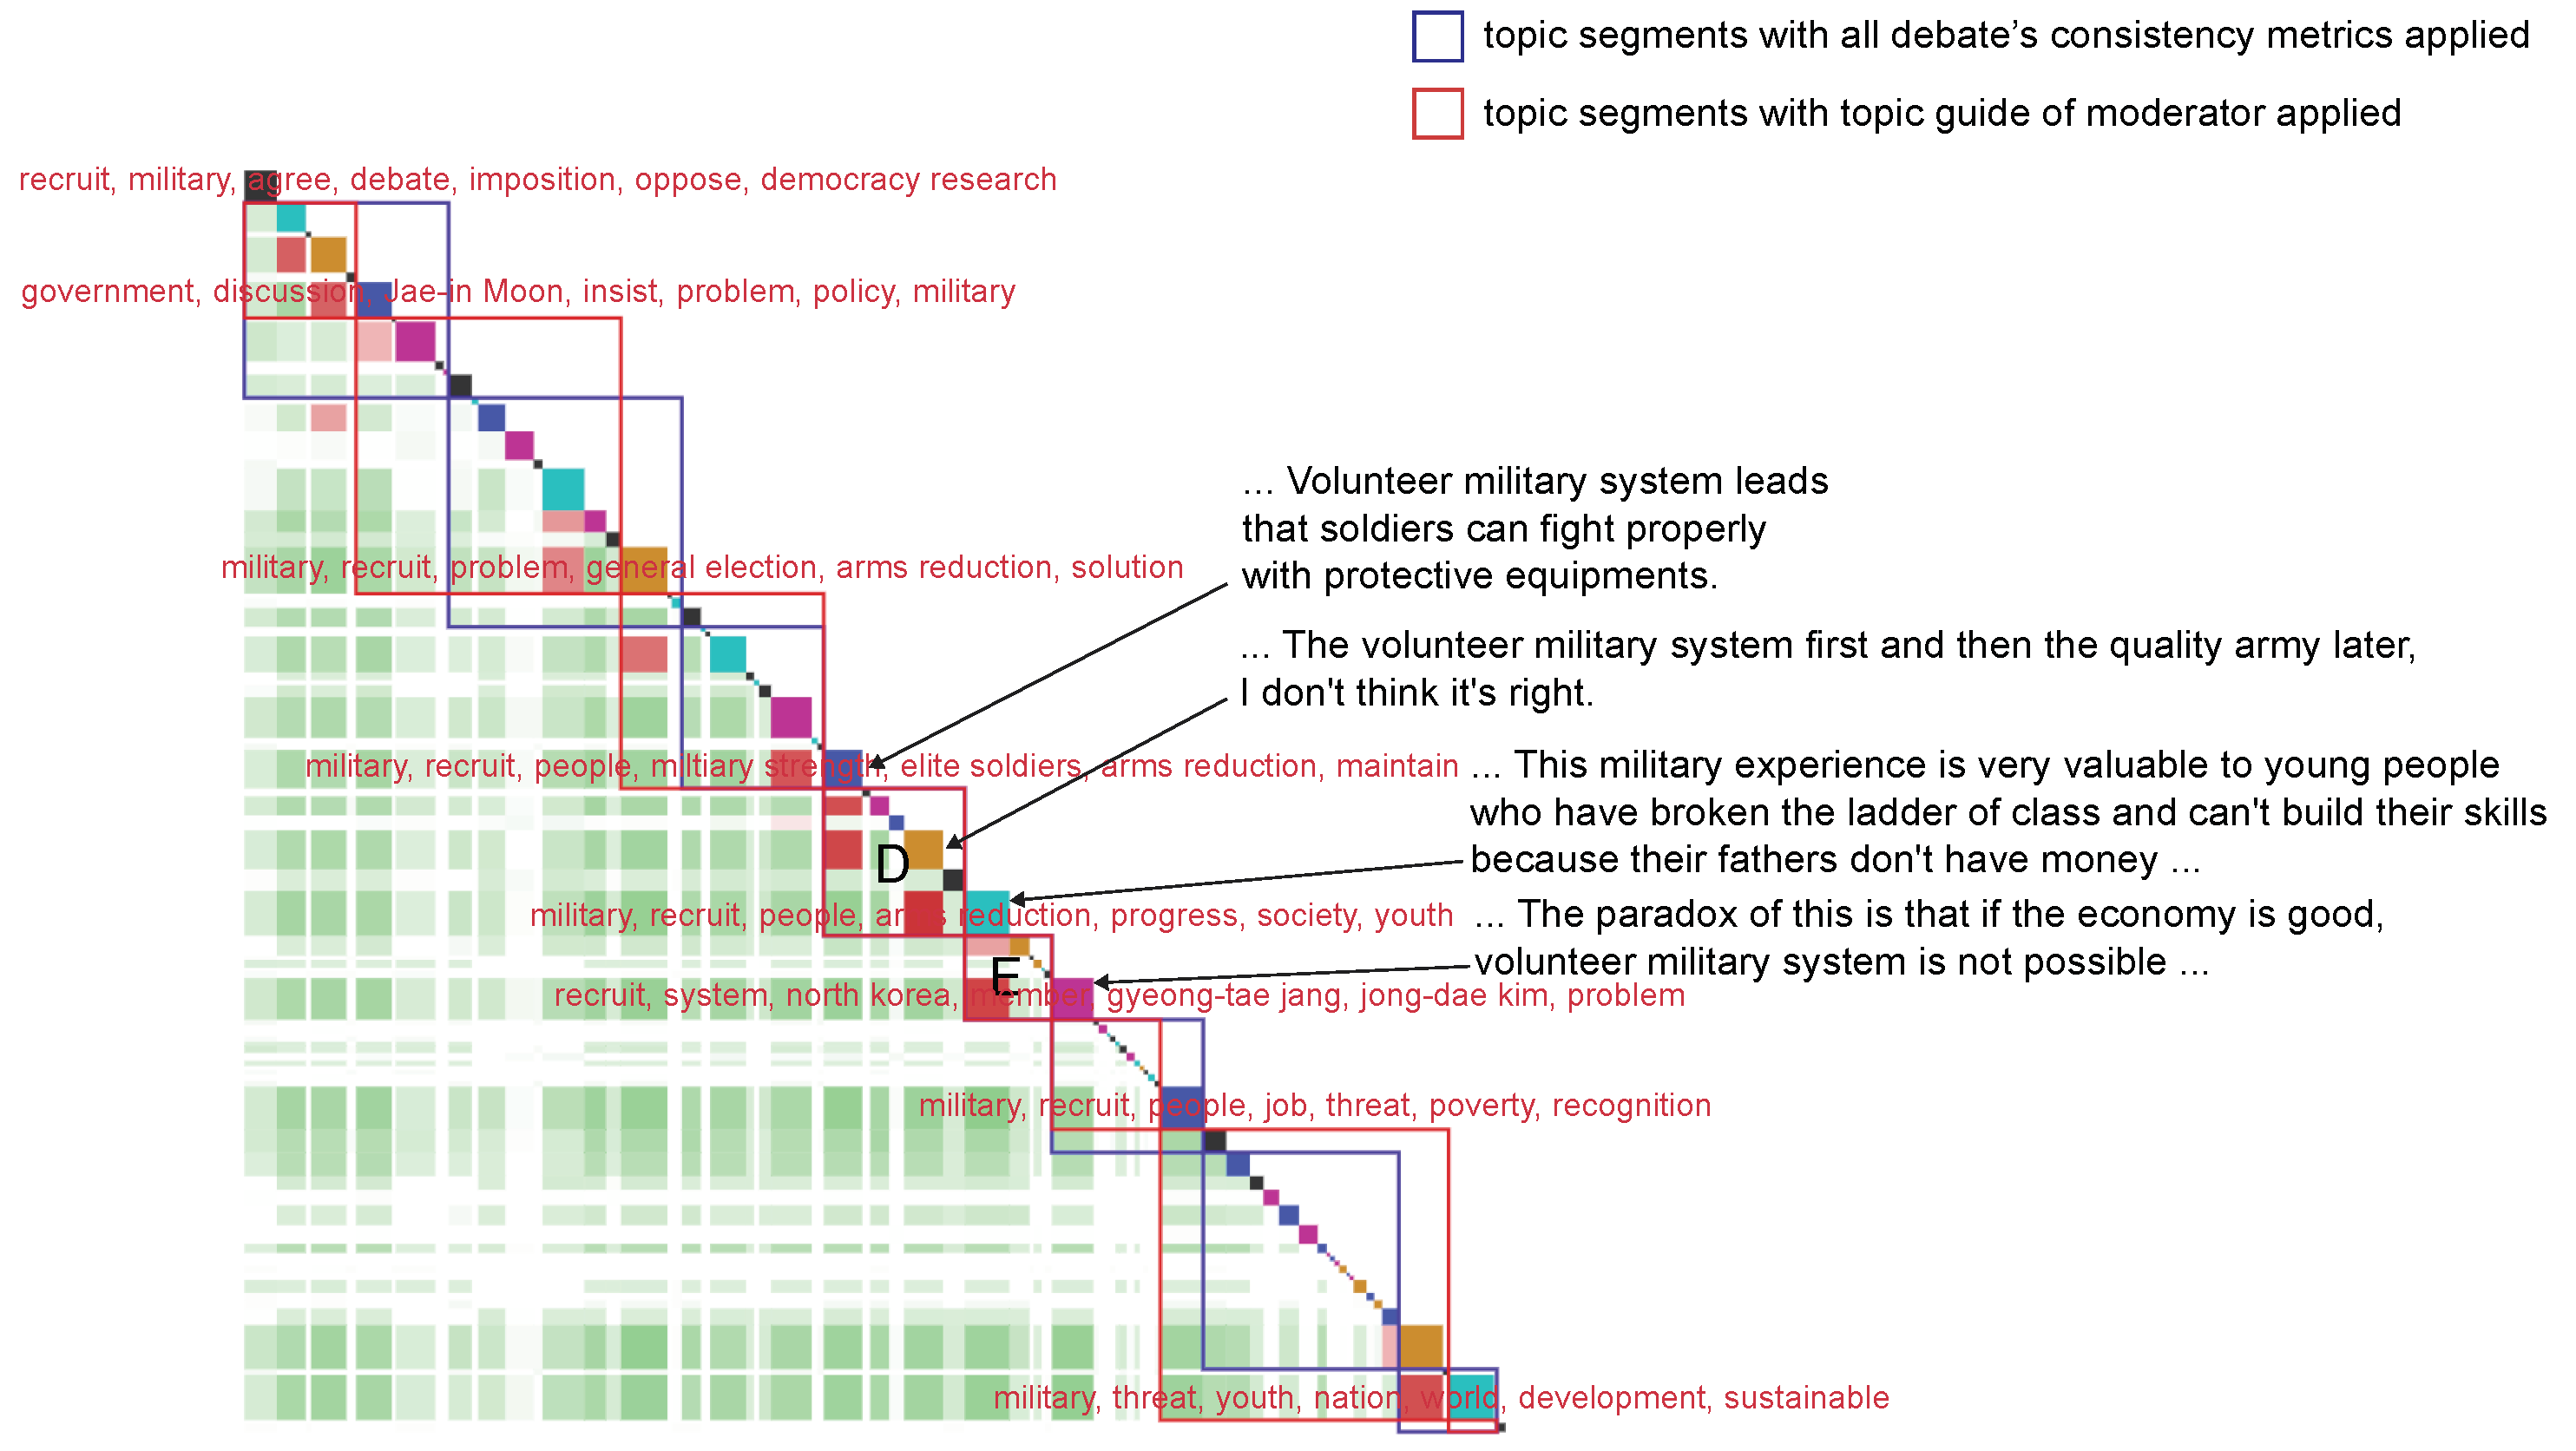
Applsci 12 02952 g031
Figure 32. Result of comparing a case where weight of “chain of arguments and counterarguments” was applied and a case where all weights of debate consistency metrics were applied. Red squares are topic segments of a result weighted only by “chain of arguments and counterarguments”, and blue squares are topic segments of a result weighted by all debate consistency metrics.
Applsci 12 02952 g032
Figure 33. Result of comparing a case where weight of “other-continuity”, “self-continuity” was applied and a case where all weights of debate consistency metrics were applied. Red squares are topic segments of a result weighted only by “other-continuity and self-continuity”, and blue squares are topic segments of a result weighted by all debate consistency metrics.
Applsci 12 02952 g033
Table 1. P k and W D values of CSseg combined with Plane, Line, and Point and applied with debate consistency metrics, and of the existing model LCseg for multi-party discourse.
P k
Basic IncomeMilitarySAT
CSseg0.04740.12170.1463
LCseg0.10570.16930.1714
WD
Basic IncomeMilitarySAT
CSseg0.04740.12170.1463
LCseg0.10940.17460.1783
Table 2. P k and W D values of each similarity cohesion calculation method without applying debate consistency metrics of CSseg.
P k
Basic IncomeMilitarySAT
Plane0.06930.16930.1371
Line0.08020.18520.1371
Point0.06930.18520.1371
Plane + Line0.06930.18520.1646
Plane + Point0.06930.16930.1554
Line + Point0.08020.18520.1371
Plane + Line + Point0.06930.18520.1646
LCseg0.10570.16930.1714
WD
Basic IncomeMilitarySAT
Plane0.06930.16930.1371
Line0.08020.18520.1371
Point0.06930.18520.1463
Plane + Line0.06930.18520.1646
Plane + Point0.06930.16930.1554
Line + Point0.08020.18520.1371
Plane + Line + Point0.06930.18520.1646
LCseg0.10940.17460.1783
Table 3. CSseg P k and W D values when applying the debate consistency metrics of other-continuity, self-continuity, chain of arguments and counterarguments, and topic guide of moderator.
P k
Basic IncomeMilitarySAT
Plane0.06560.14290.1554
Line0.04740.14290.1554
Point0.07290.14290.1577
Plane + Line0.04740.12170.1371
Plane + Point0.06560.14290.1371
Line + Point0.04740.12170.1371
Plane + Line + Point0.04740.12170.1463
LCseg0.10570.16930.1714
WD
Basic IncomeMilitarySAT
Plane0.06560.14290.1554
Line0.04740.14290.1554
Point0.07290.14290.1646
Plane + Line0.04740.12170.1371
Plane + Point0.06560.14290.1371
Line + Point0.04740.12170.1371
Plane + Line + Point0.04740.12170.1463
LCseg0.10940.17460.1783
Table 4. CSseg P k and W D values with the weight of other-continuity set to 2.
P k
Basic IncomeMilitarySAT
Plane0.06930.16930.1554
Line0.08020.16400.1371
Point0.08020.16400.1463
Plane + Line0.06930.18520.1646
Plane + Point0.06930.16400.1554
Line + Point0.06930.18520.1371
Plane + Line + Point0.06930.18520.1646
LCseg0.10570.16930.1714
WD
Basic IncomeMilitarySAT
Plane0.06930.16930.1554
Line0.08020.16400.1371
Point0.08020.16400.1463
Plane + Line0.06930.18520.1646
Plane + Point0.06930.16400.1554
Line + Point0.06930.18520.1371
Plane + Line + Point0.06930.18520.1646
LCseg0.10940.17460.1783
Table 5. CSseg P k and W D values with the weight of self-continuity set to 0.5.
P k
Basic IncomeMilitarySAT
Plane0.06930.16930.1371
Line0.06930.16400.1371
Point0.06930.18520.1463
Plane + Line0.06930.18520.1646
Plane + Point0.06930.16930.1554
Line + Point0.08020.18520.1371
Plane + Line + Point0.06930.18520.1646
LCseg0.10570.16930.1714
WD
Basic IncomeMilitarySAT
Plane0.06930.16930.1371
Line0.06930.16400.1371
Point0.06930.18520.1463
Plane + Line0.06930.18520.1646
Plane + Point0.06930.16930.1554
Line + Point0.08020.18520.1371
Plane + Line + Point0.06930.18520.1646
LCseg0.10940.17460.1783
Table 6. CSseg P k and W D values with the weight of chain of arguments and counterarguments set to 2.
P k
Basic IncomeMilitarySAT
Plane0.06930.16930.1554
Line0.08020.18520.1371
Point0.07290.16400.1463
Plane + Line0.06930.18520.1646
Plane + Point0.06930.16930.1554
Line + Point0.08020.18520.1463
Plane + Line + Point0.06930.18520.1646
LCseg0.10570.16930.1714
WD
Basic IncomeMilitarySAT
Plane0.06930.16930.1554
Line0.08020.18520.1371
Point0.07290.16400.1463
Plane + Line0.06930.18520.1646
Plane + Point0.06930.16930.1554
Line + Point0.08020.18520.1463
Plane + Line + Point0.06930.18520.1646
LCseg0.10940.17460.1783
Table 7. CSseg P k and W D values with the weight of topic guide of moderator set to 2.
P k
Basic IncomeMilitarySAT
Plane0.05830.14290.1371
Line0.04740.12170.1371
Point0.05470.14290.1371
Plane + Line0.04740.12170.1463
Plane + Point0.05830.14290.1554
Line + Point0.04740.12170.1371
Plane + Line + Point0.04740.12170.1463
LCseg0.10570.16930.1714
WD
Basic IncomeMilitarySAT
Plane0.05830.14290.1371
Line0.04740.12170.1371
Point0.05470.14290.1371
Plane + Line0.04740.12170.1463
Plane + Point0.05830.14290.1554
Line + Point0.04740.12170.1371
Plane + Line + Point0.04740.12170.1463
LCseg0.10940.17460.1783
Publisher’s Note: MDPI stays neutral with regard to jurisdictional claims in published maps and institutional affiliations.

