
Inline Optical Coherence Tomography for Multidirectional Process Monitoring in a Coaxial LMD-w Process

 , , ,
, , , 
Abstract
:1. Introduction
2. Materials and Methods
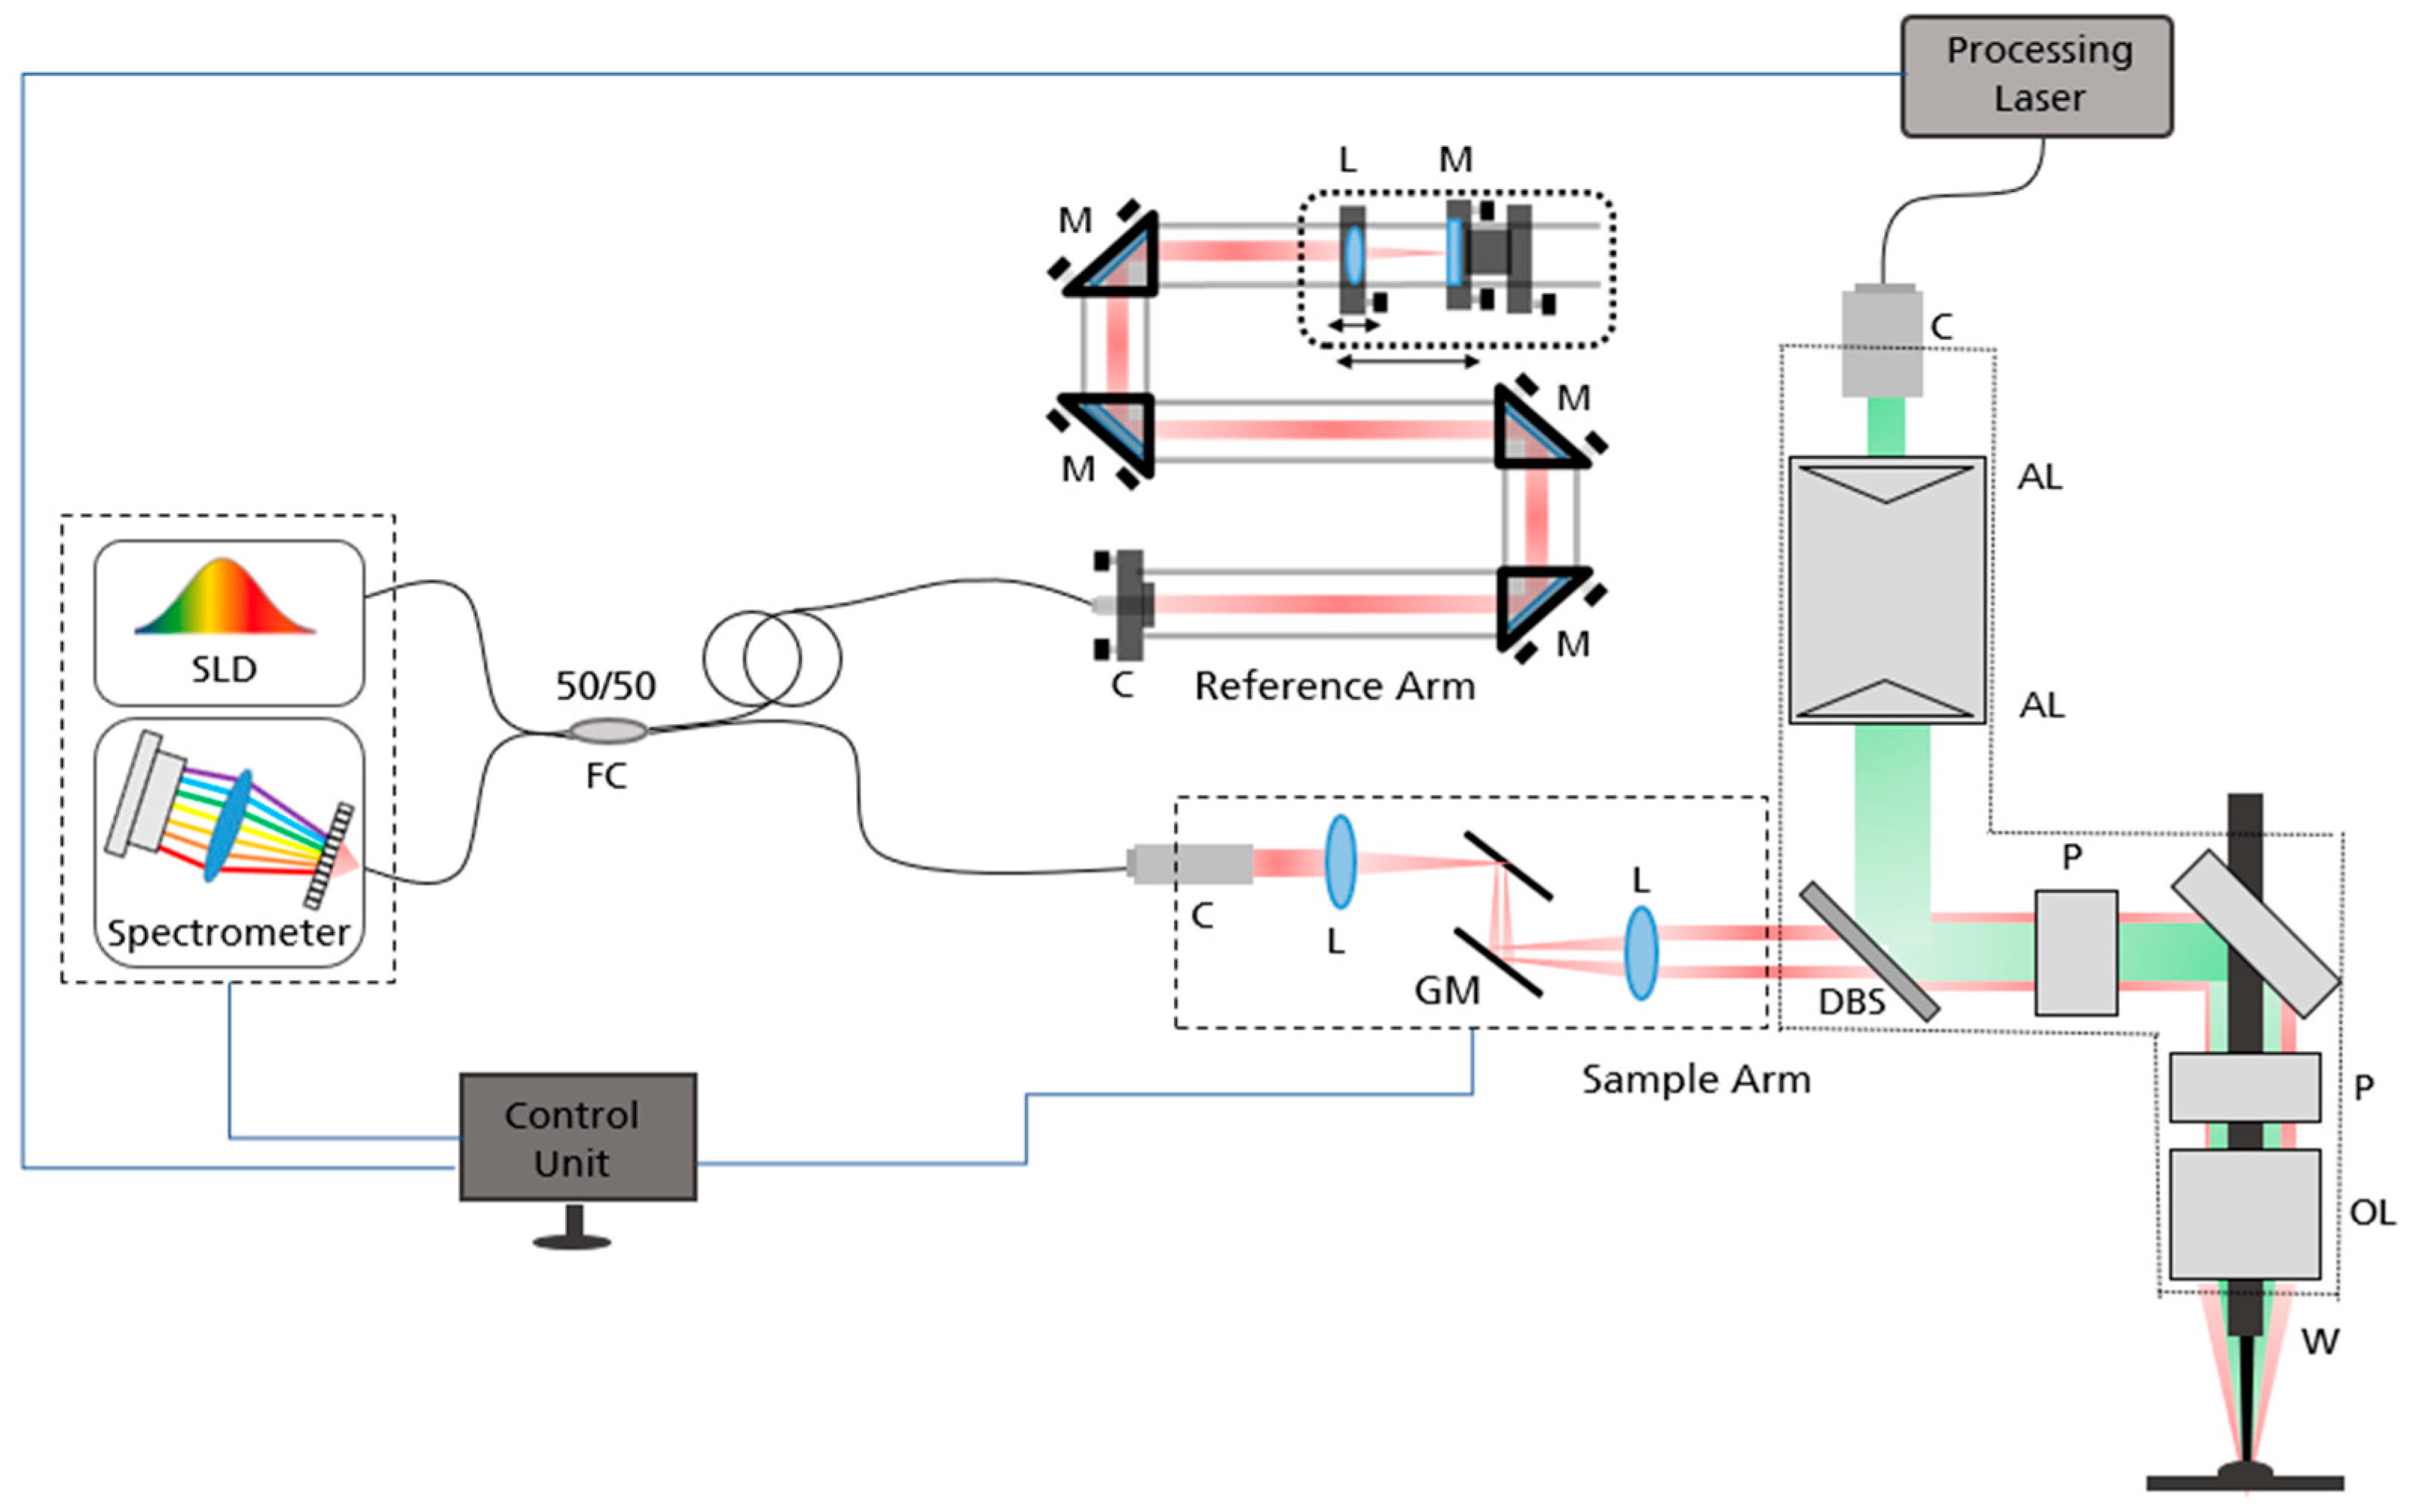
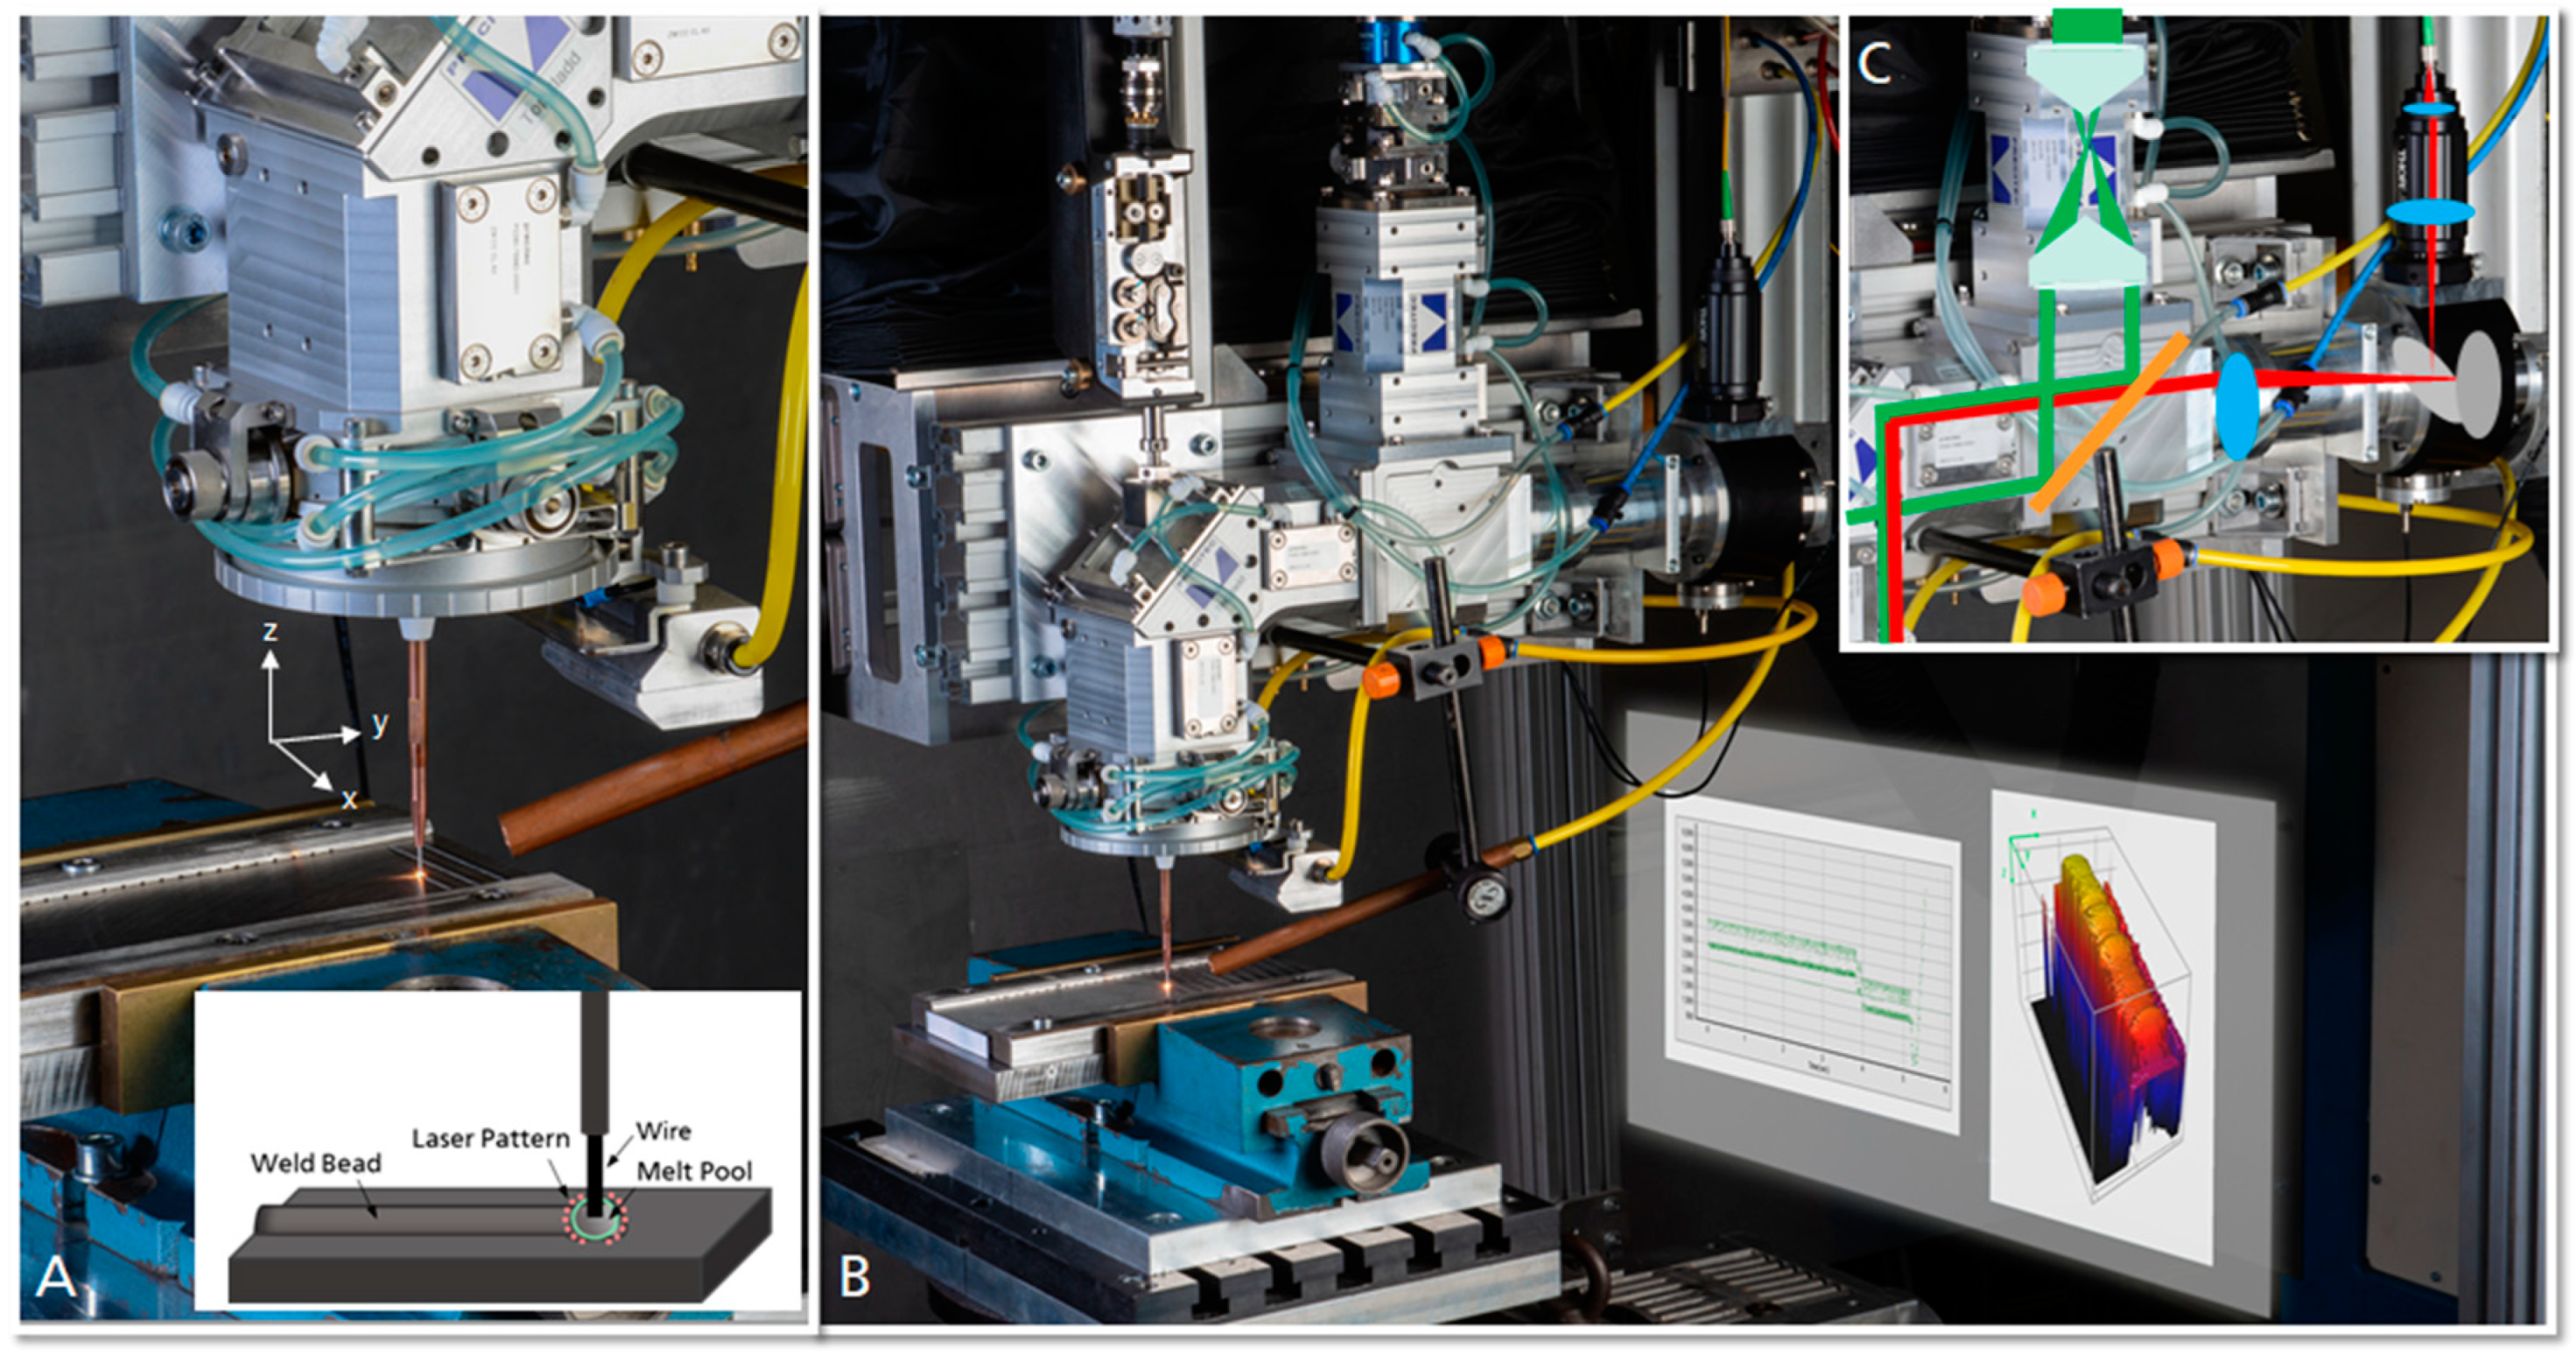
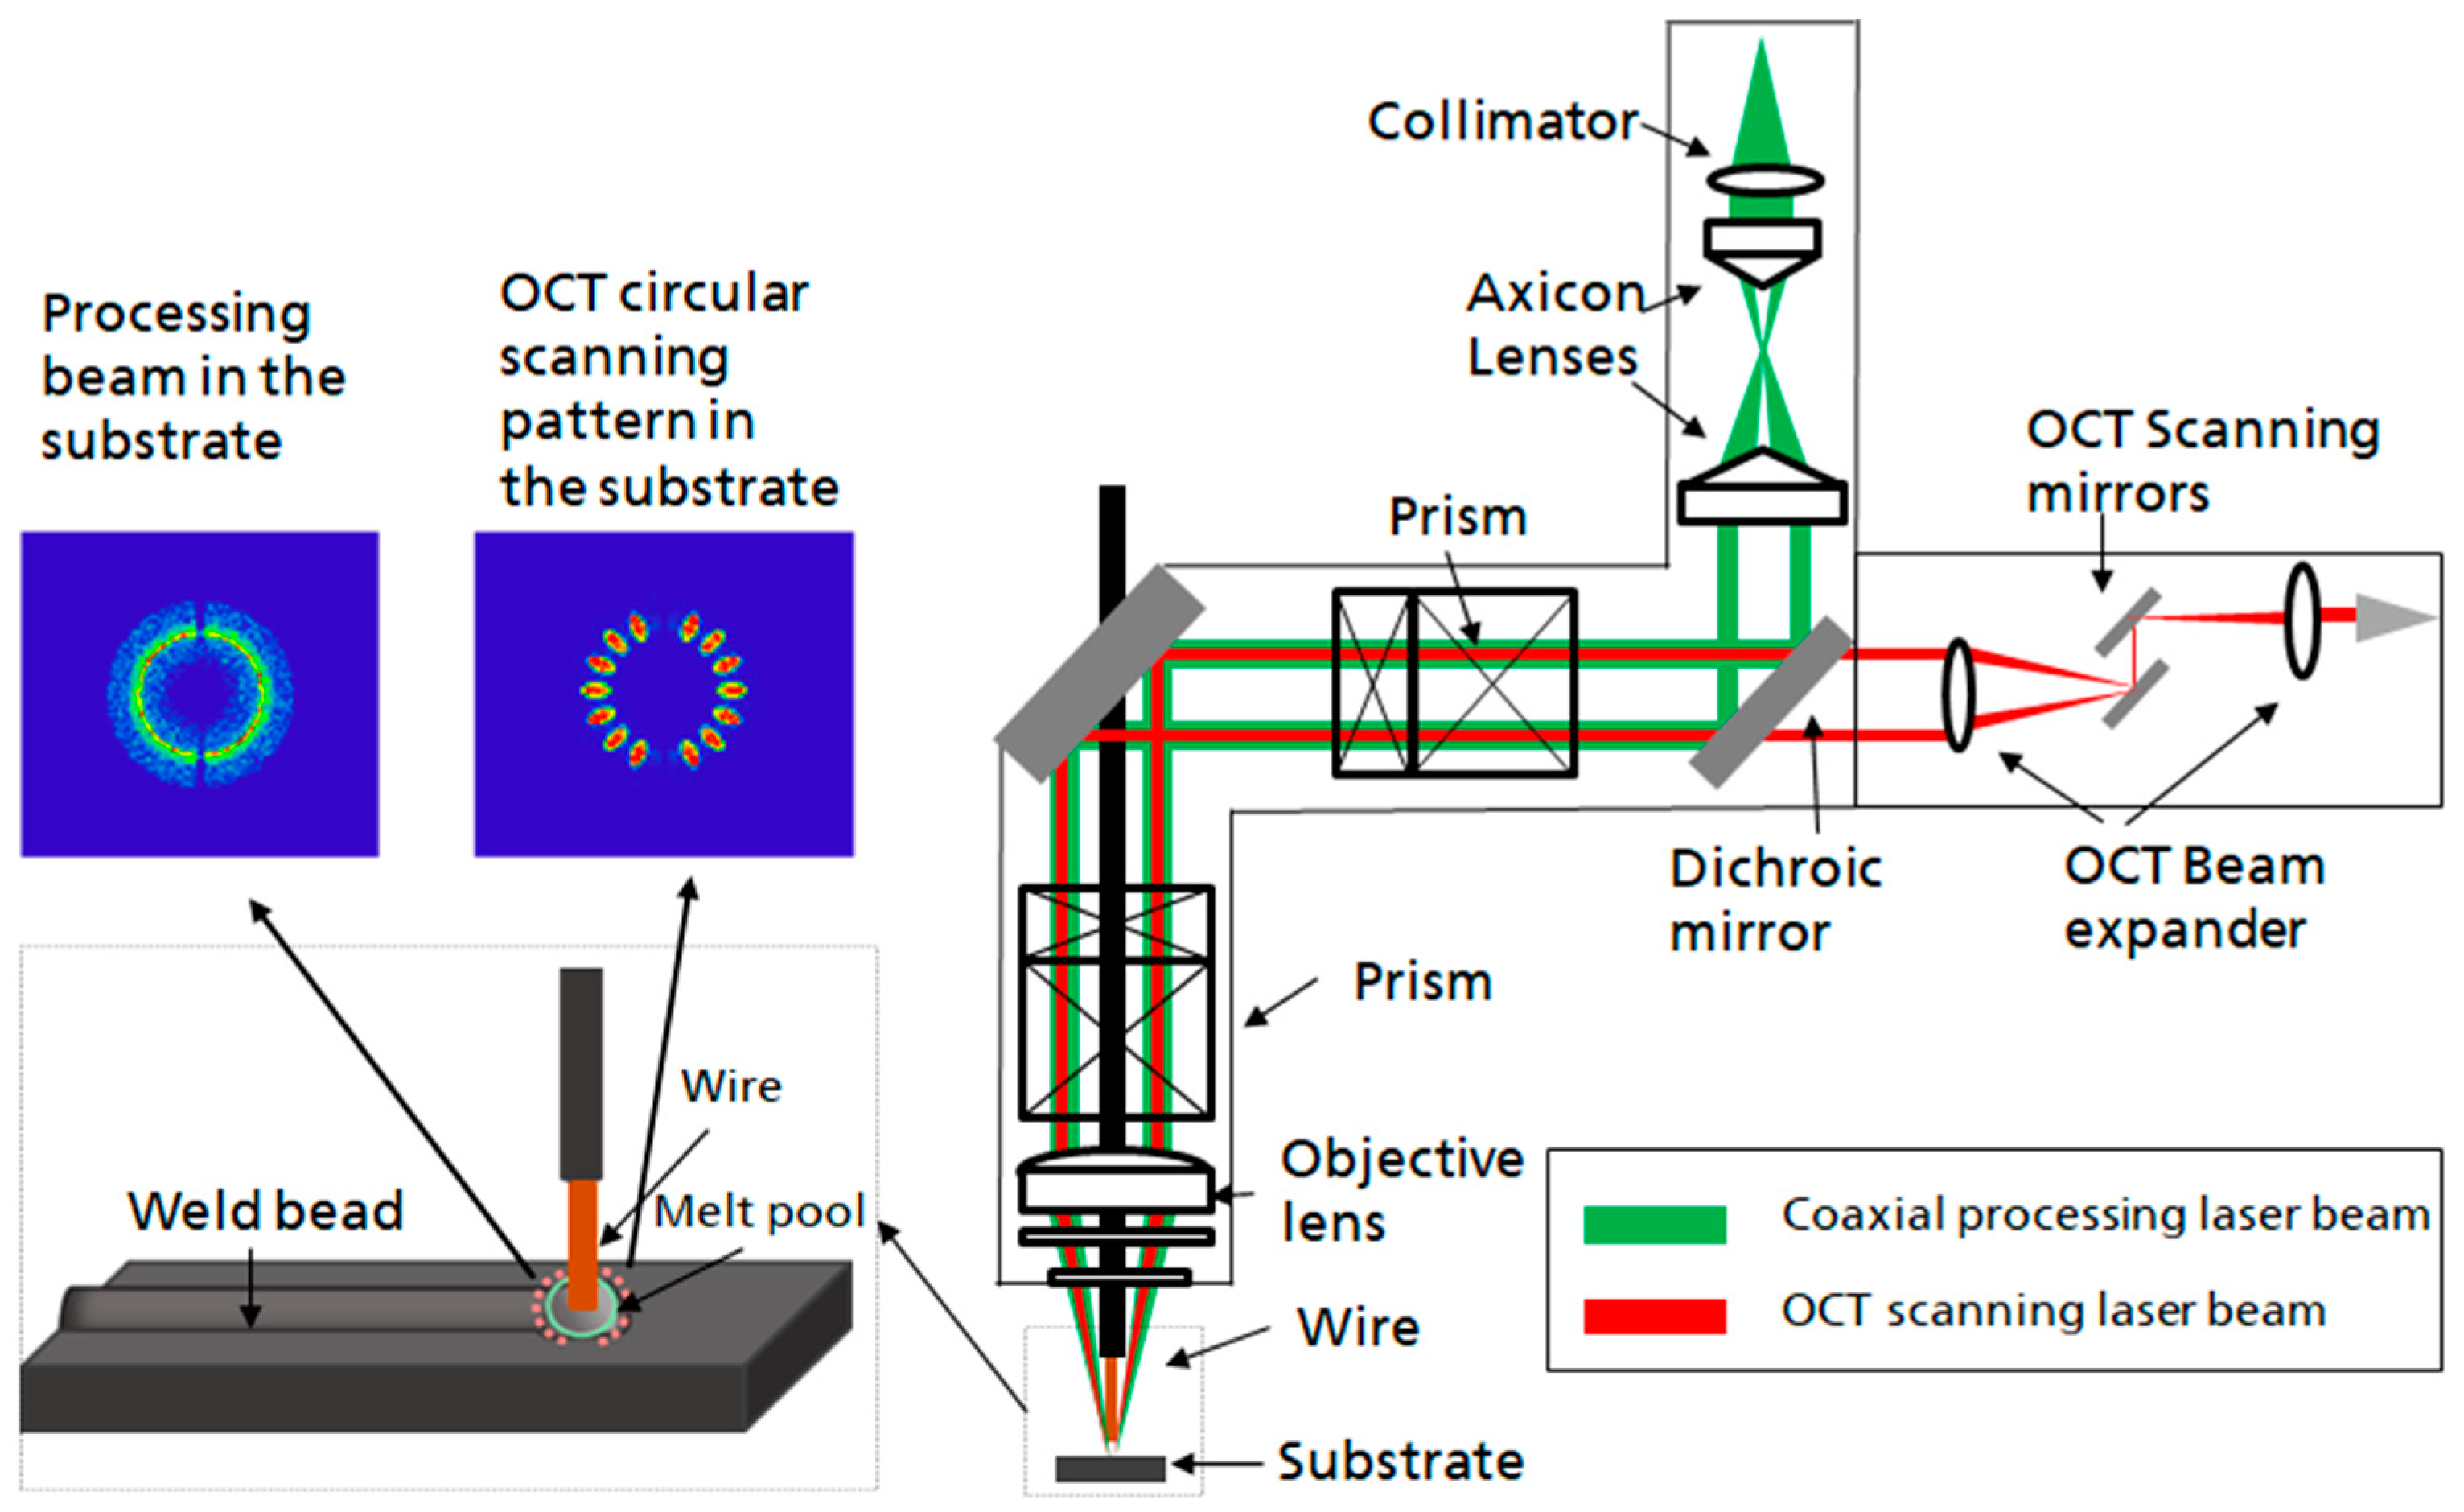
2.1. OCT Setup
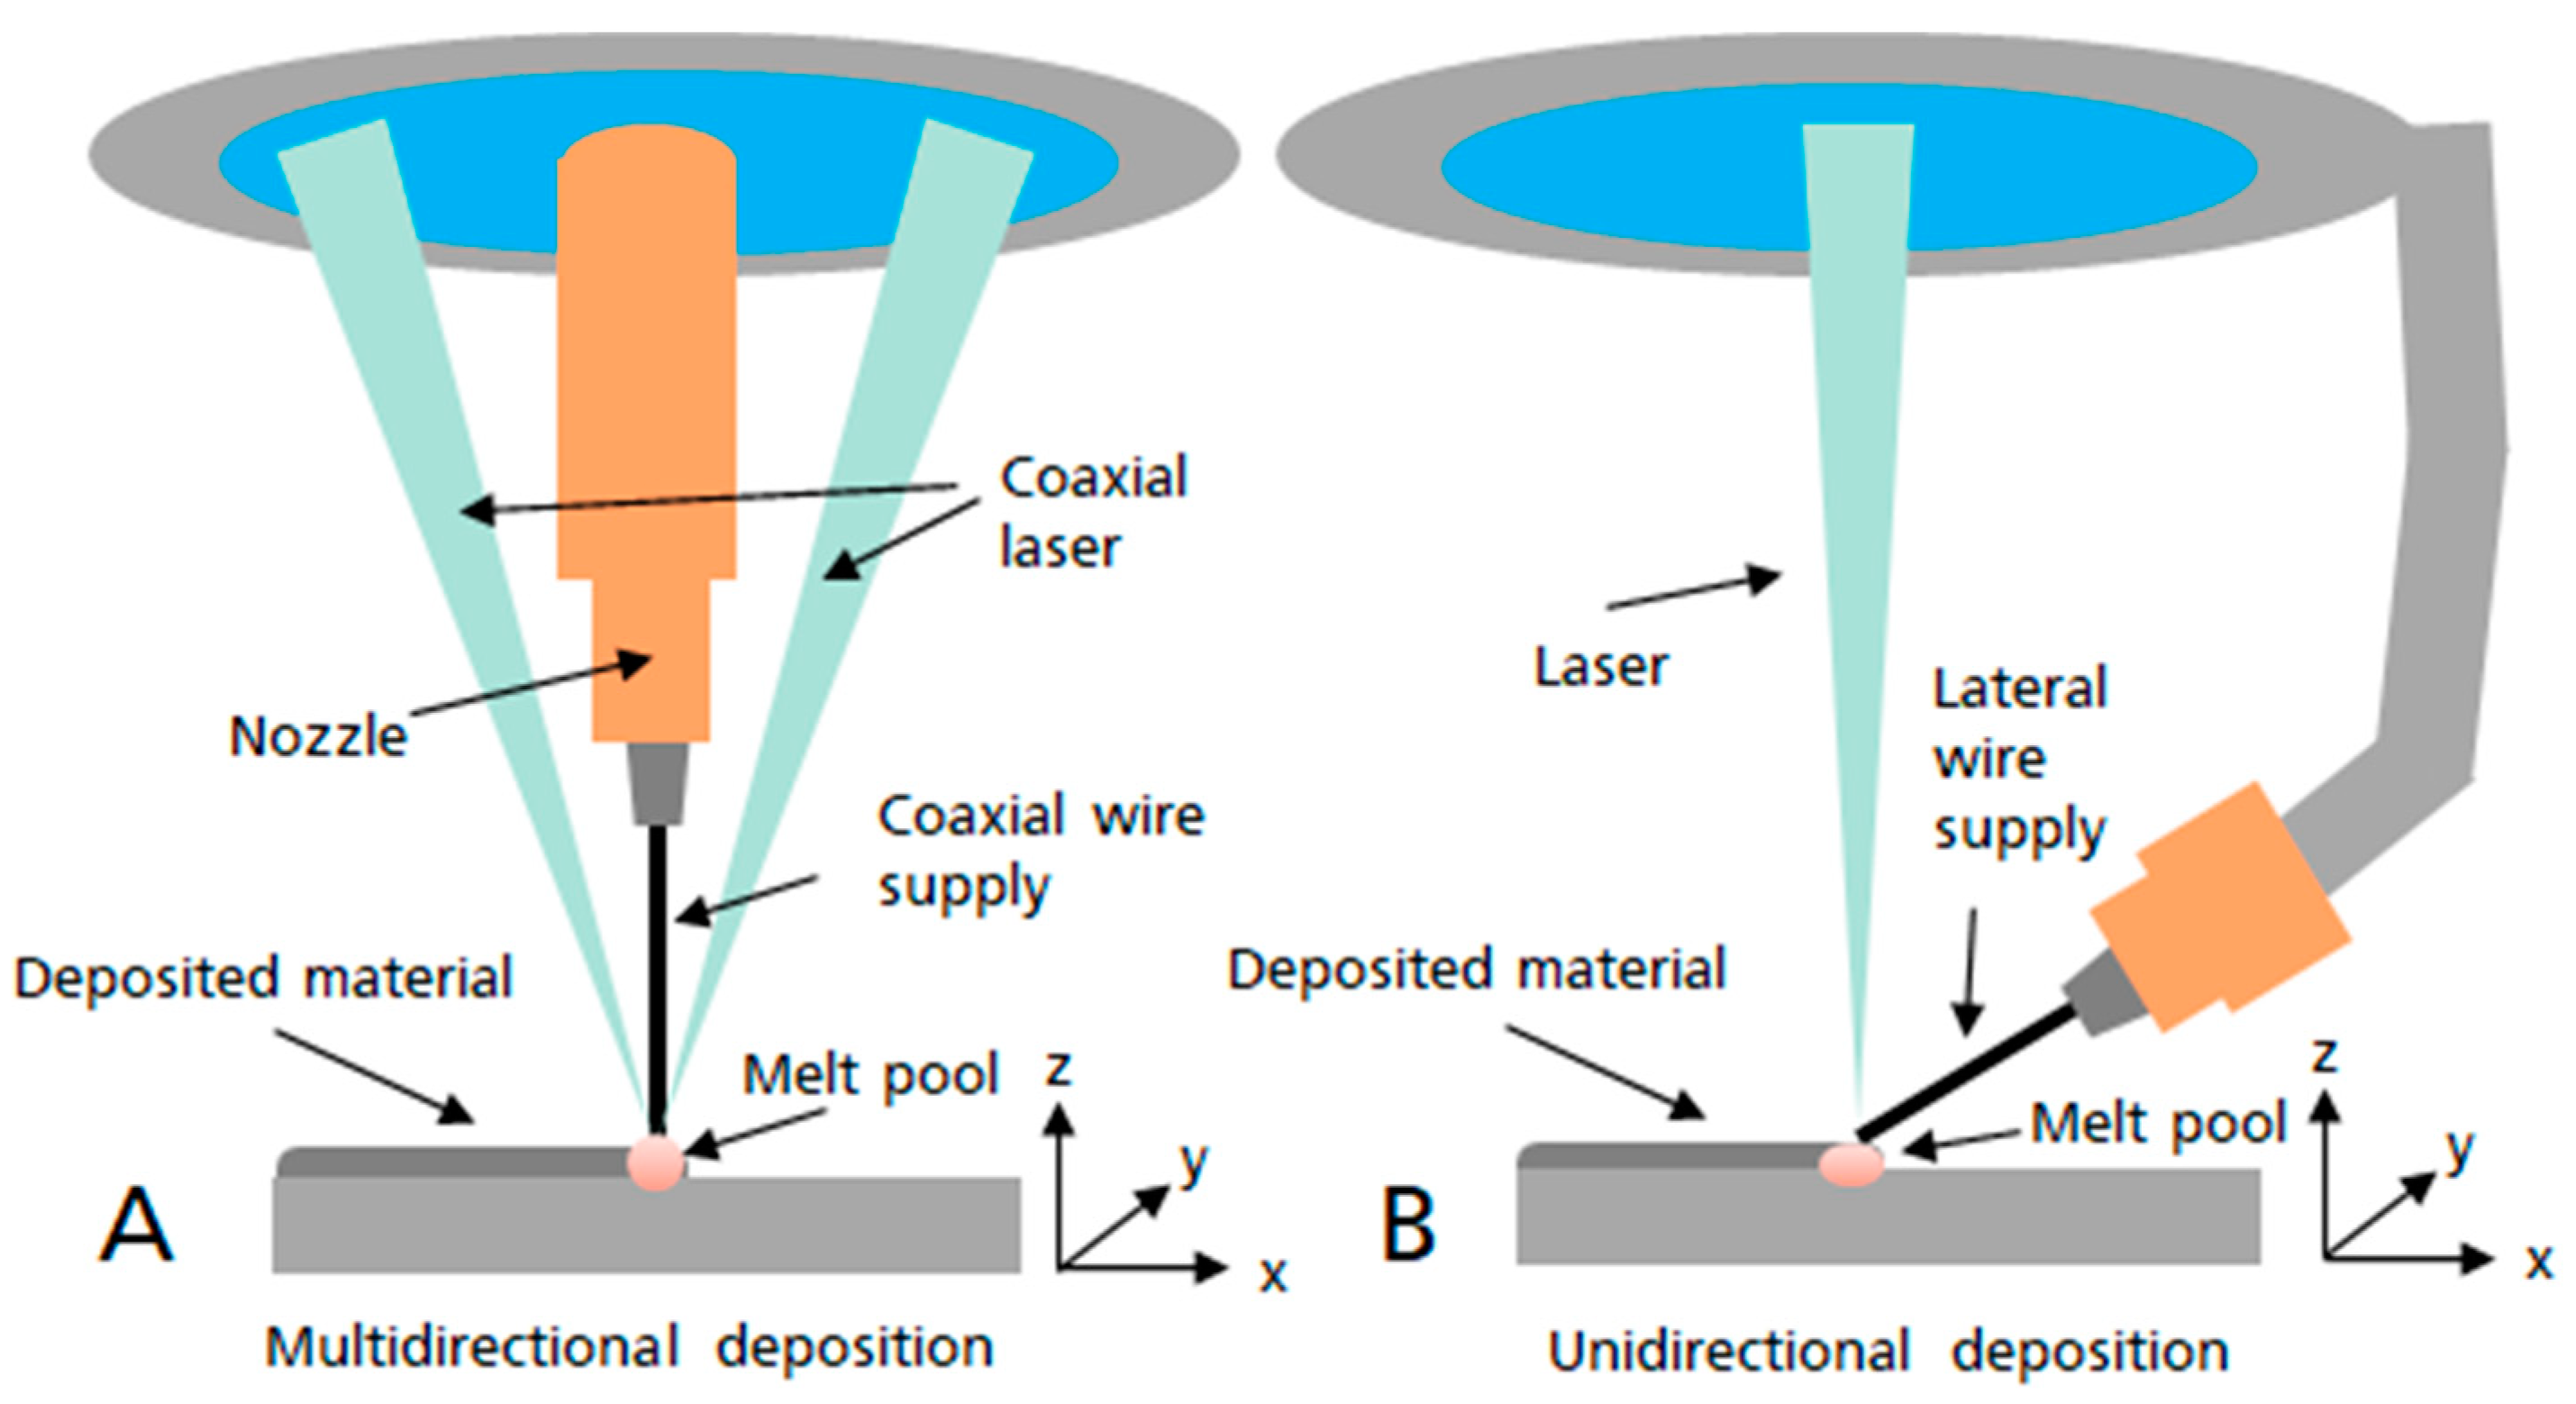
2.2. LMD-w Process
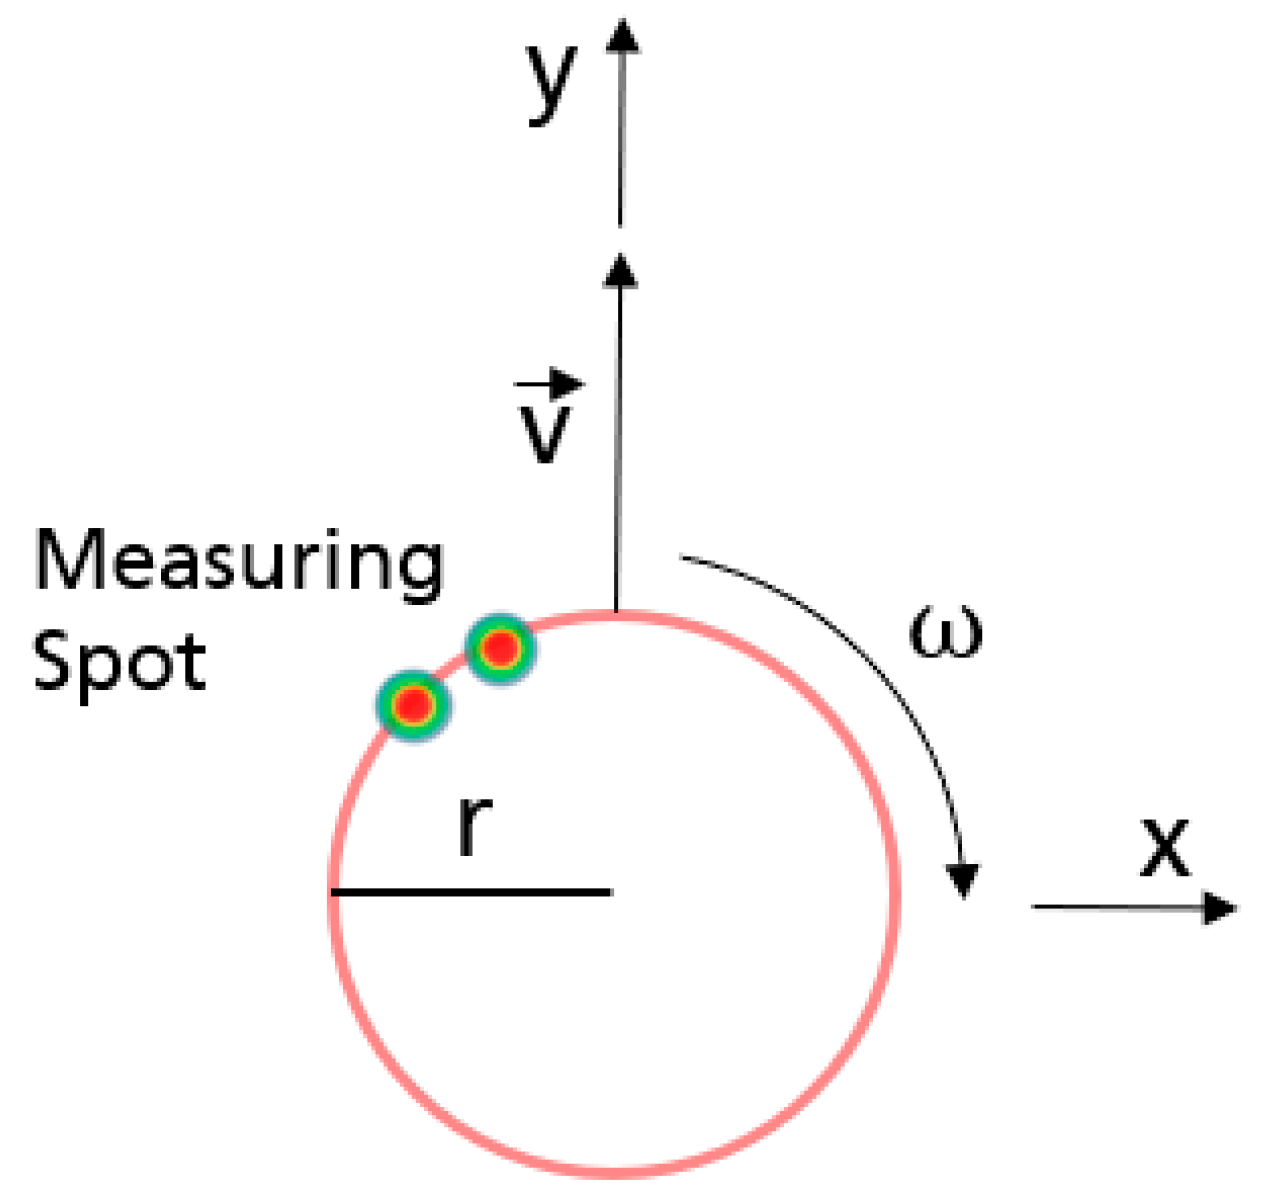
2.3. Beam Shaping Method
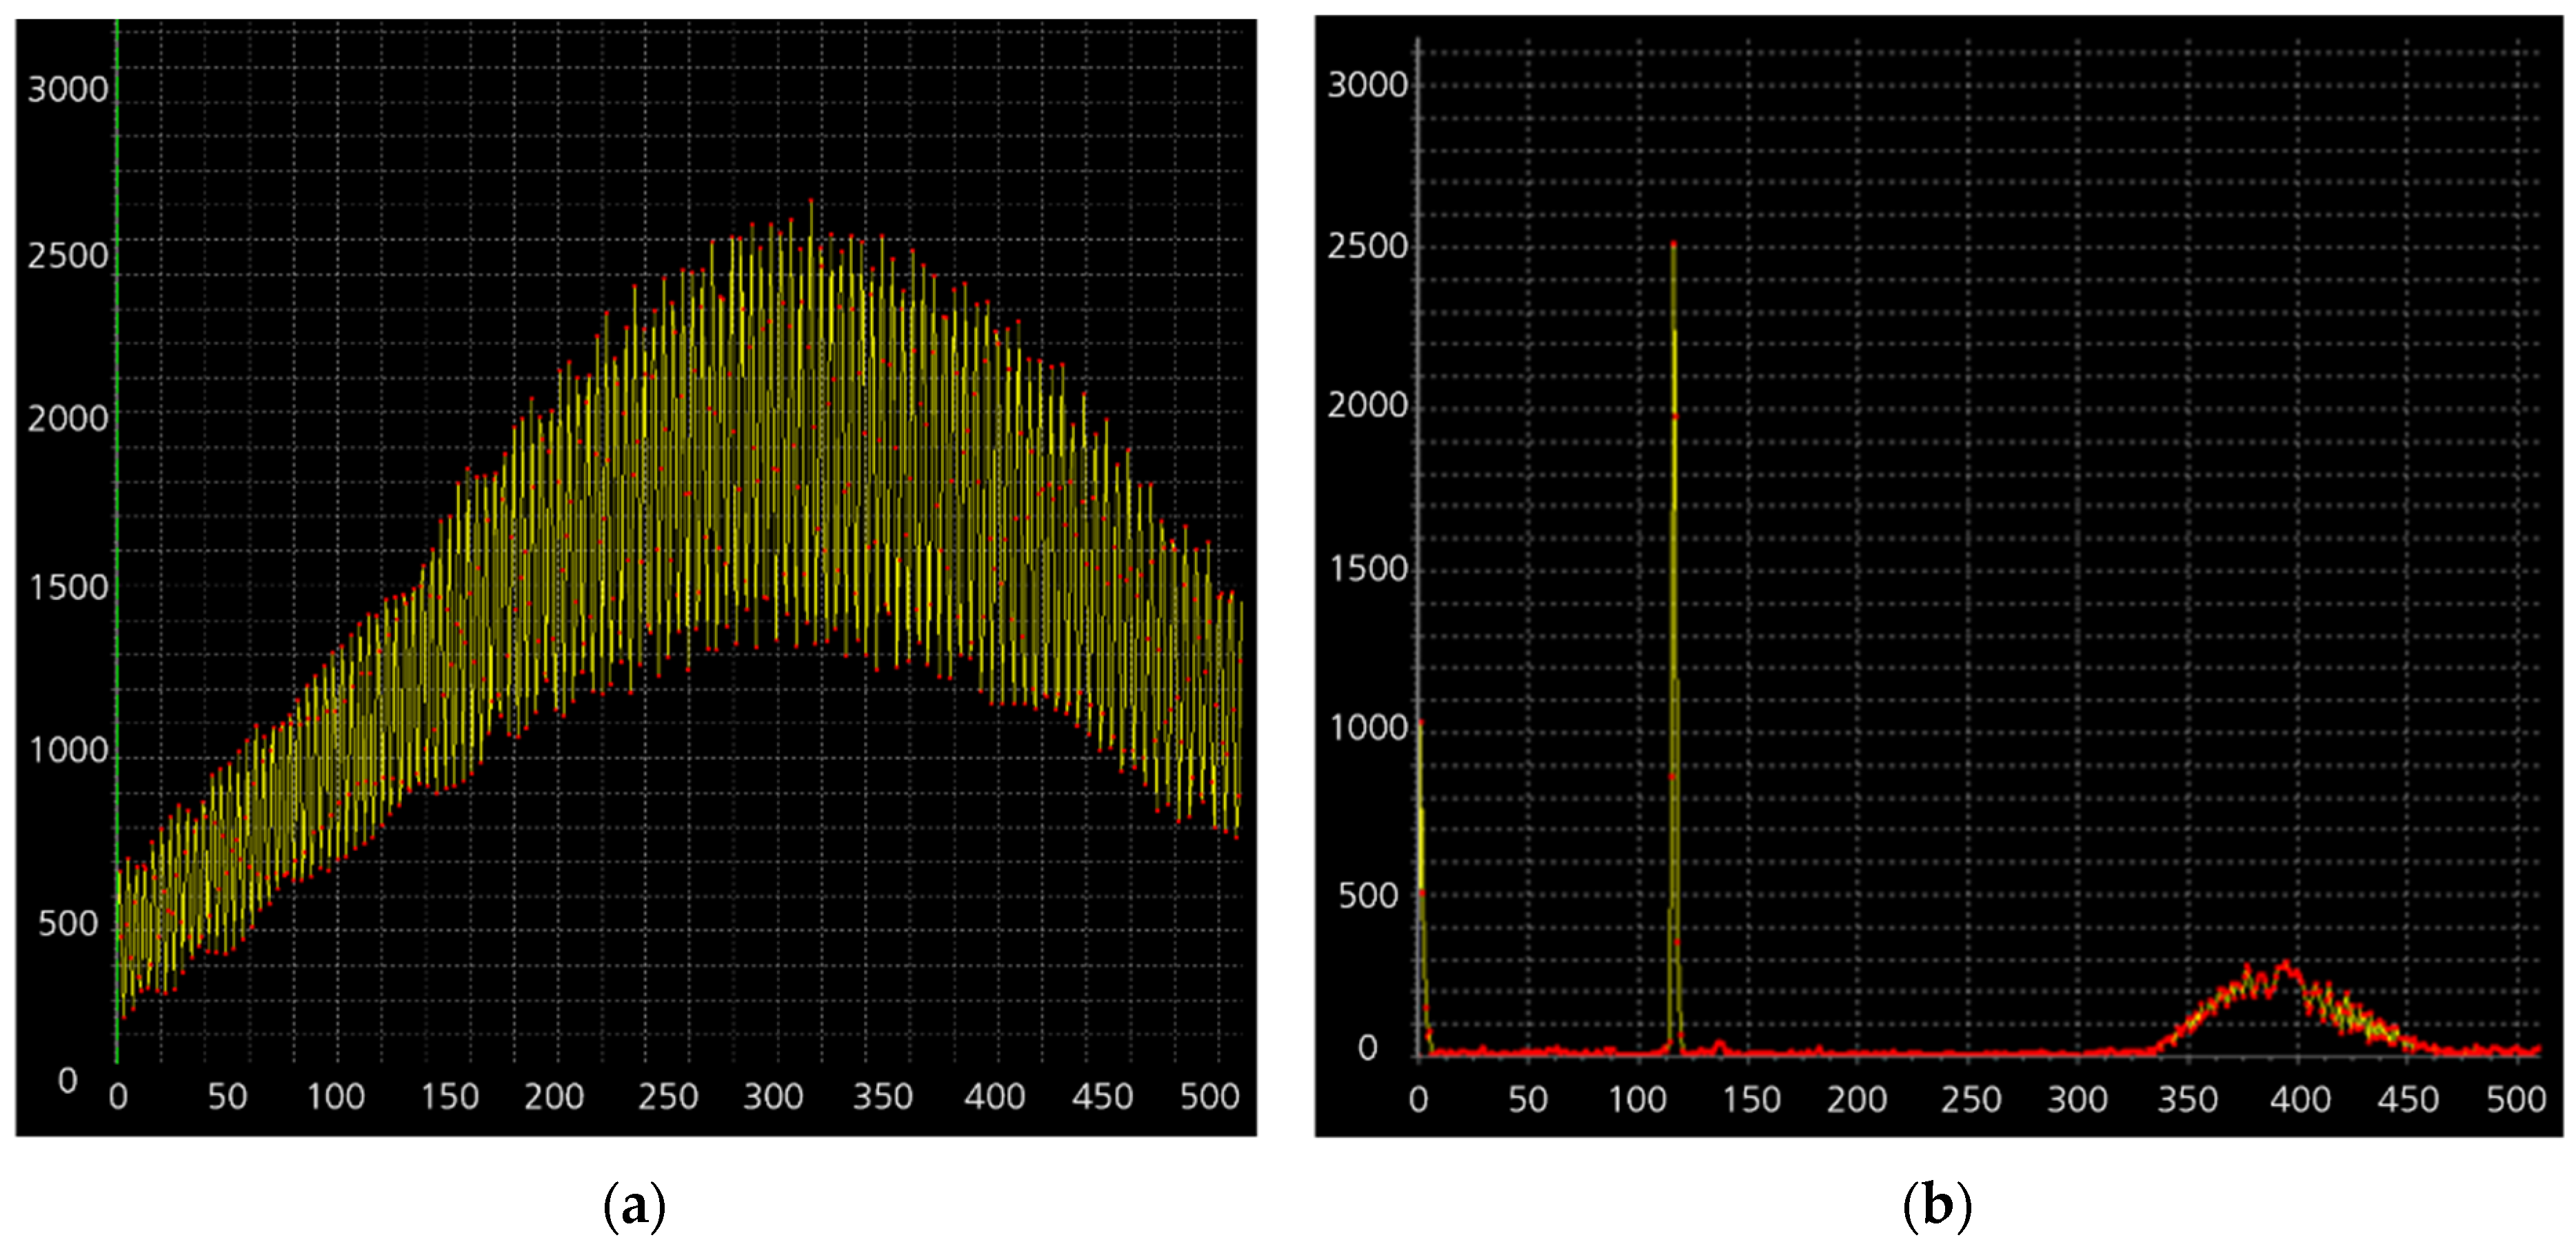
2.4. Signal Processing
3. Results
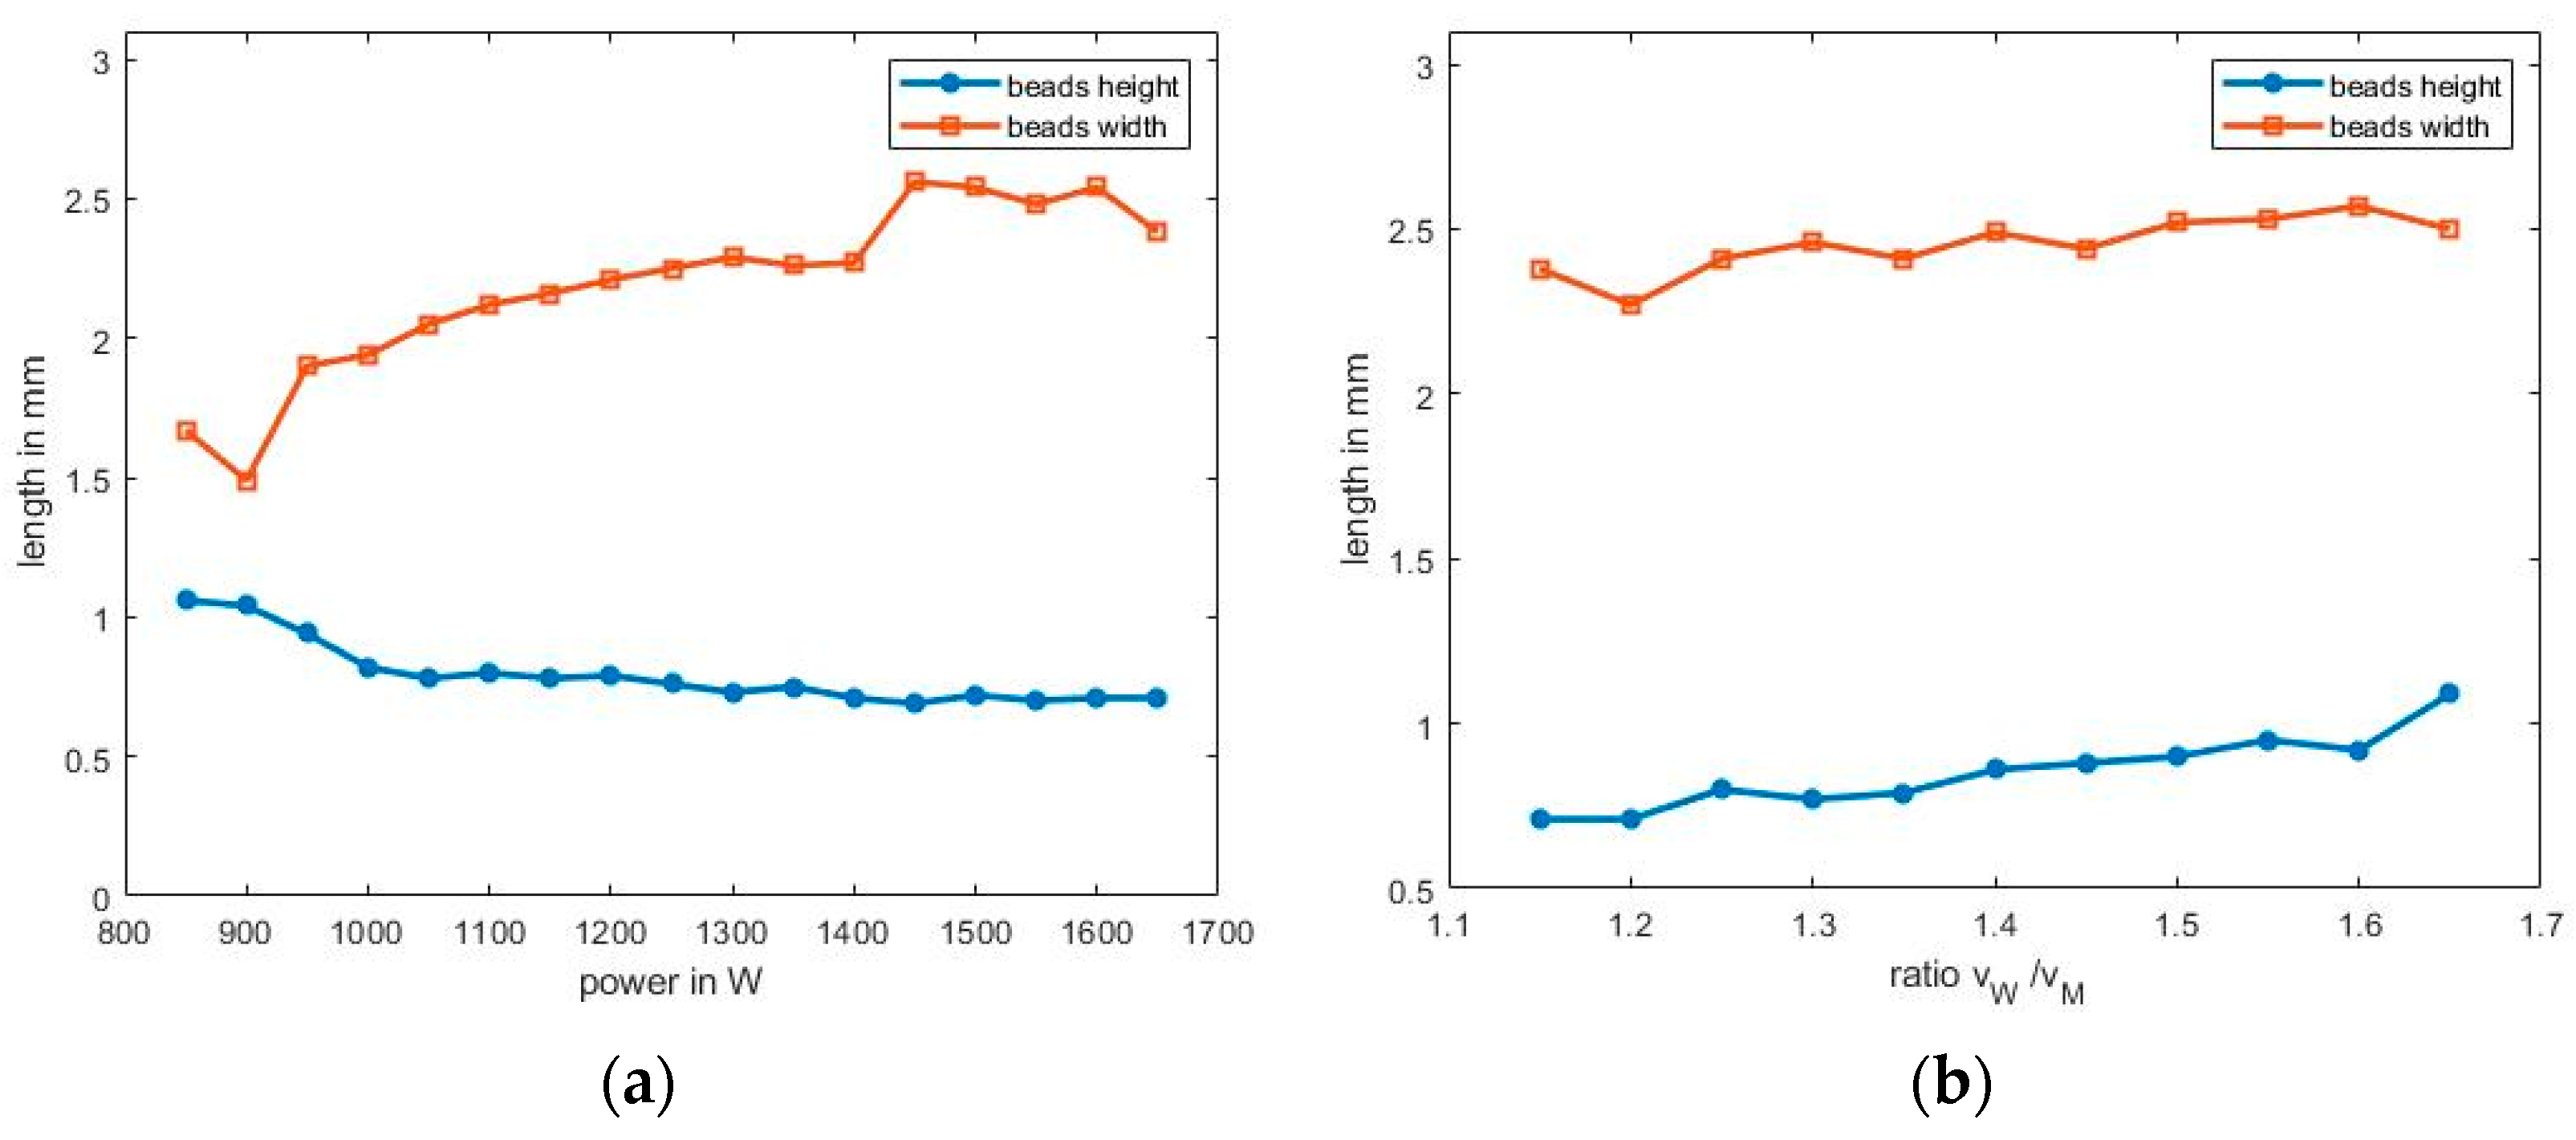
3.1. LMD-w Process Parameters
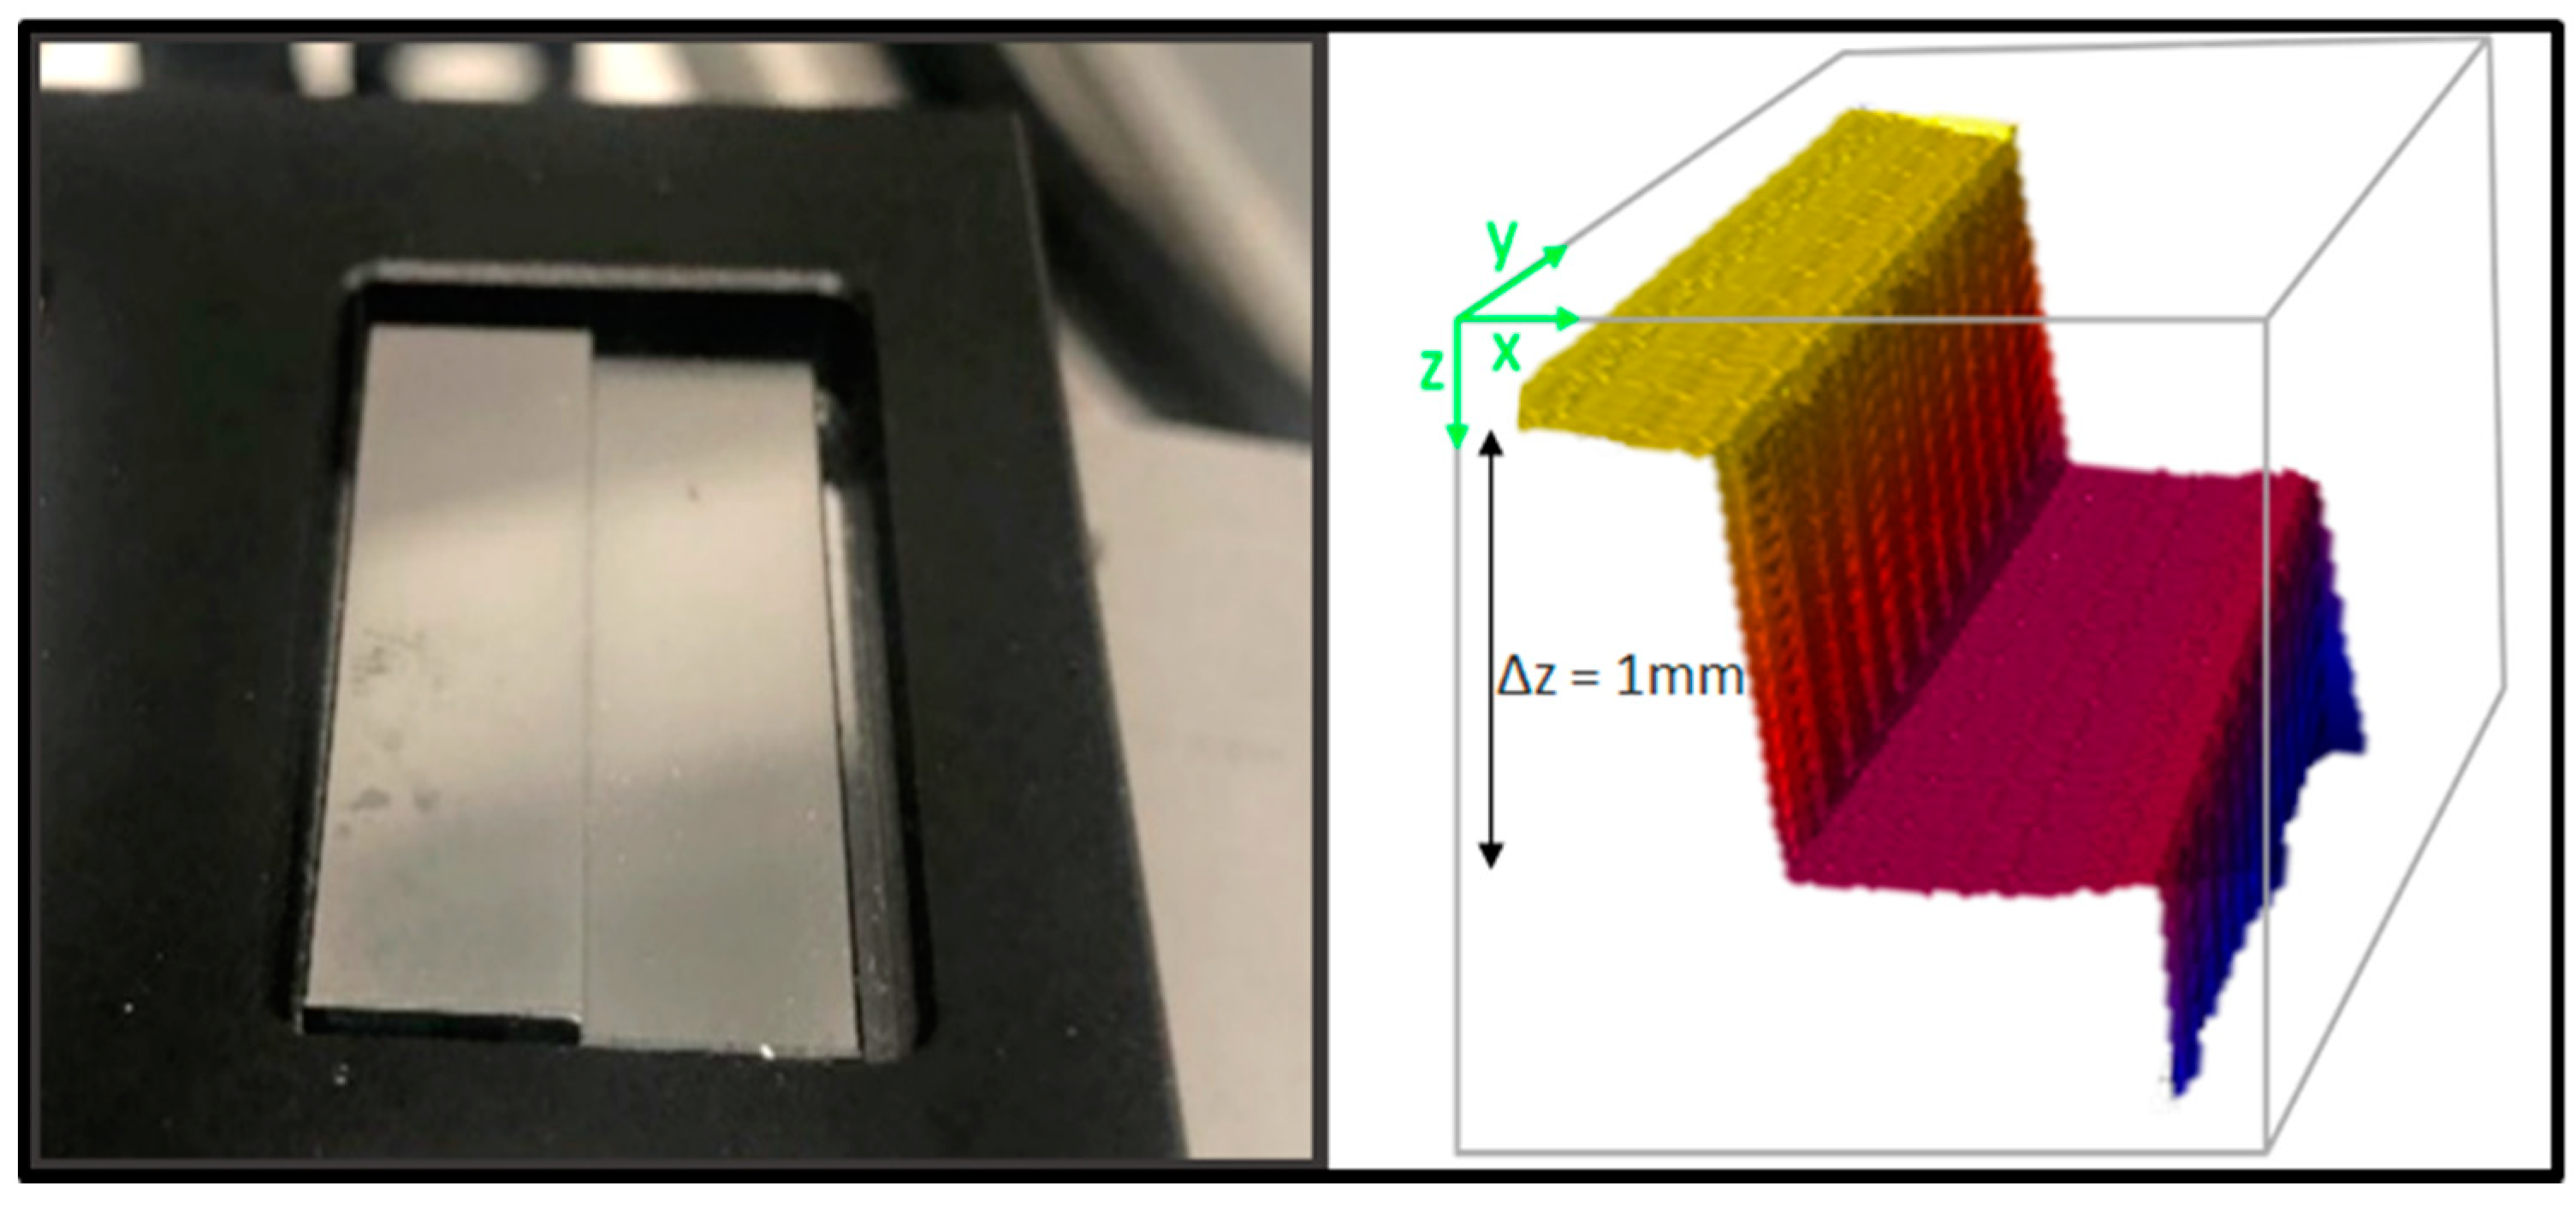
3.2. Offline Measurements
3.3. Inline Measurements
4. Conclusions and Discussion
Author Contributions
Funding
Institutional Review Board Statement
Informed Consent Statement
Acknowledgments
Conflicts of Interest
References
- Gipperich, M.; Peters, C.; Riepe, J.; Day, R.; Bergs, T. Reflectometry-based investigation of temperature fields during dual-beam Laser Metal Deposition. In Laser 3D Manufacturing VIII; International Society for Optics and Photonics: Bellingham, WA, USA, 2021; Volume 11677, p. 116770R. [Google Scholar] [CrossRef]
- Churruca, M.M.; Arrizabalaga, J.L.; Saez, I.G.; Reyes, C.S. Comparative study of laser metal deposition (LMD) of coaxial wire and powder in the manufacture of TI-6AL-4V structures. DYNA 2020, 95, 376–379. [Google Scholar] [CrossRef]
- Kaierle, S.; Barroi, A.; Noelke, C.; Hermsdorf, J.; Overmeyer, L.; Haferkamp, H. Review on Laser Deposition Welding: From Micro to Macro. Phys. Procedia 2012, 39, 336–345. [Google Scholar] [CrossRef] [Green Version]
- Stifter, D. Beyond biomedicine: A review of alternative applications and developments for optical coherence tomography. Appl. Phys. A 2007, 88, 337–357. [Google Scholar] [CrossRef]
- Drexler, W. (Ed.) Optical coherence tomography. In Technology and Applications; Springer: Berlin/Heidelberg, Germany, 2008. [Google Scholar]
- Podoleanu, A.G. Optical coherence tomography. J. Microsc. 2012, 247, 209–219. [Google Scholar] [CrossRef] [PubMed] [Green Version]
- Yaqoob, Z.; Wu, J.; Yang, C. Spectral domain optical coherence tomography: A better OCT imaging strategy. BioTechniques 2005, 39, S6–S13. [Google Scholar] [CrossRef] [Green Version]
- Riediger, M.; Schmitt, R. Verfahren zur kombinierten Form-und Zentrierprüfung mikrooptischer Asphären mit optischer Kohärenztomographie. Tech. Mess. 2019, 86, 208–215. [Google Scholar] [CrossRef]
- Dunkers, J.P.; Parnas, R.S.; Zimba, C.G.; Peterson, R.C.; Flynn, K.M.; Fujimoto, J.G.; Bouma, B.E. Optical coherence tomography of glass reinforced polymer composites. Compos. Part A Appl. Sci. Manuf. 1999, 30, 139–145. [Google Scholar] [CrossRef]
- Zechel, F.; Kunze, R.; König, N.; Schmitt, R.H. Optical coherence tomography for non-destructive testing. Tech. Mess. 2019, 87, 404–413. [Google Scholar] [CrossRef]
- Wiesner, M.; Ihlemann, J.; Müller, H.H.; Lankenau, E.; Hüttmann, G. Optical coherence tomography for process control of laser micromachining. Rev. Sci. Instrum. 2010, 81, 033705. [Google Scholar] [CrossRef] [Green Version]
- Zechel, F.; Jasovski, J.; Schmitt, R.H. Dynamic, Adaptive Inline Process Monitoring for Laser Material Processing by Means of Low Coherence Interferometry. Appl. Sci. 2021, 11, 7556. [Google Scholar] [CrossRef]
- DePond, P.J.; Guss, G.; Ly, S.; Calta, N.; Deane, D.; Khairallah, S.; Matthews, M.J. In situ measurements of layer roughness during laser powder bed fusion additive manufacturing using low coherence scanning interferometry. Mater. Des. 2018, 154, 347–359. [Google Scholar] [CrossRef]
- Kanko, J.A.; Sibley, A.P.; Fraser, J.M. In situ morphology-based defect detection of selective laser melting through inline coherent imaging. J. Mater. Process. Technol. 2016, 231, 488–500. [Google Scholar] [CrossRef]
- Ocylok, S.; Alexeev, E.; Mann, S.; Weisheit, A.; Wissenbach, K.; Kelbassa, I. Correlations of Melt Pool Geometry and Process Parameters During Laser Metal Deposition by Coaxial Process Monitoring. Phys. Procedia 2014, 56, 228–238. [Google Scholar] [CrossRef]
- Smurov, I.; Doubenskaia, M.; Zaitsev, A. Complex Analysis of Laser Cladding based on Comprehensive Optical Diagnostics and Numerical Simulation. Phys. Procedia 2012, 39, 743–752. [Google Scholar] [CrossRef] [Green Version]
- Webster, P.J.L.; Wright, L.G.; Mortimer, K.D.; Leung, B.Y.; Yu, J.X.Z.; Fraser, J.M. Automatic real-time guidance of laser machining with inline coherent imaging. J. Laser Appl. 2011, 23, 022001. [Google Scholar] [CrossRef] [Green Version]
- Fercher, A.F.; Drexler, W.; Hitzenberger, C.; Lasser, T. Optical coherence tomography-principles and applications. Rep. Prog. Phys. 2003, 66, 239–303. [Google Scholar] [CrossRef]
- Ibarra, M.H.D.L.T.; Ruiz, P.D.; Huntley, J.M. Double-shot depth-resolved displacement field measurement using phase-contrast spectral optical coherence tomography. Opt. Express 2006, 14, 9643–9656. [Google Scholar] [CrossRef]
- Pütsch, O.; Stollenwerk, J.; Kogel-Hollacher, M.; Traub, M. Annular beam shaping system for advanced 3D laser brazing. Adv. Opt. Technol. 2012, 1, 397–402. [Google Scholar] [CrossRef]
- Abioye, T.E.; Folkes, J.; Clare, A.T. A parametric study of Inconel 625 wire laser deposition. J. Mater. Process. Technol. 2013, 213, 2145–2151. [Google Scholar] [CrossRef] [Green Version]
- Motta, M.; Demir, A.G.; Previtali, B. High-speed imaging and process characterization of coaxial laser metal wire deposition. Addit. Manuf. 2018, 22, 497–507. [Google Scholar] [CrossRef]
- Errico, V.; Campanelli, S.; Angelastro, A.; Dassisti, M.; Mazzarisi, M.; Bonserio, C. Coaxial Monitoring of AISI 316L Thin Walls Fabricated by Direct Metal Laser Deposition. Materials 2021, 14, 673. [Google Scholar] [CrossRef] [PubMed]
- Donadello, S.; Motta, M.; Demir, A.G.; Previtali, B. Monitoring of laser metal deposition height by means of coaxial laser triangulation. Opt. Lasers Eng. 2018, 112, 136–144. [Google Scholar] [CrossRef] [Green Version]


Publisher’s Note: MDPI stays neutral with regard to jurisdictional claims in published maps and institutional affiliations. |
© 2022 by the authors. Licensee MDPI, Basel, Switzerland. This article is an open access article distributed under the terms and conditions of the Creative Commons Attribution (CC BY) license (https://creativecommons.org/licenses/by/4.0/).
Share and Cite
Stehmar, C.; Gipperich, M.; Kogel-Hollacher, M.; Velazquez Iturbide, A.; Schmitt, R.H. Inline Optical Coherence Tomography for Multidirectional Process Monitoring in a Coaxial LMD-w Process. Appl. Sci. 2022, 12, 2701. https://doi.org/10.3390/app12052701
Stehmar C, Gipperich M, Kogel-Hollacher M, Velazquez Iturbide A, Schmitt RH. Inline Optical Coherence Tomography for Multidirectional Process Monitoring in a Coaxial LMD-w Process. Applied Sciences. 2022; 12(5):2701. https://doi.org/10.3390/app12052701
Chicago/Turabian StyleStehmar, Charlotte, Marius Gipperich, Markus Kogel-Hollacher, Alfredo Velazquez Iturbide, and Robert H. Schmitt. 2022. "Inline Optical Coherence Tomography for Multidirectional Process Monitoring in a Coaxial LMD-w Process" Applied Sciences 12, no. 5: 2701. https://doi.org/10.3390/app12052701
APA StyleStehmar, C., Gipperich, M., Kogel-Hollacher, M., Velazquez Iturbide, A., & Schmitt, R. H. (2022). Inline Optical Coherence Tomography for Multidirectional Process Monitoring in a Coaxial LMD-w Process. Applied Sciences, 12(5), 2701. https://doi.org/10.3390/app12052701