Article

Quantifying the Occurrence of Multi-Hazards Due to Climate Change

Environmental Research Laboratory (EREL), INRASTES, NCSR “Demokritos”, Agia Paraskevi, 15341 Attiki, Greece
*
Author to whom correspondence should be addressed.
Appl. Sci. 2022, 12(3), 1218; https://doi.org/10.3390/app12031218
Submission received: 15 December 2021 / Revised: 20 January 2022 / Accepted: 21 January 2022 / Published: 24 January 2022
(This article belongs to the Special Issue Natural-Hazards Risk Assessment for Disaster Mitigation)

Abstract

:
This paper introduces a climatic multi-hazard risk assessment for Greece, as the first-ever attempt to enhance scientific knowledge for the identification and definition of hazards, a critical element of risk-informed decision making. Building on an extensively validated climate database with a very high spatial resolution (5 × 5 km2), a detailed assessment of key climatic hazards is performed that allows for: (a) the analysis of hazard dynamics and their evolution due to climate change and (b) direct comparisons and spatial prioritization across Greece. The high geographical complexity of Greece requires that a large number of diverse hazards (heatwaves—TX, cold spells—TN, torrential rainfall—RR, snowstorms, and windstorms), need to be considered in order to correctly capture the country’s susceptibility to climate extremes. The current key findings include the dominance of cold-temperature extremes in mountainous regions and warm extremes over the coasts and plains. Extreme rainfall has been observed in the eastern mainland coasts and windstorms over Crete and the Aegean and Ionian Seas. Projections of the near future reveal more warm extremes in northern areas becoming more dominant all over the country by the end of the century.

1. Introduction

A new era has unequivocally emerged that has brought climate change and its impacts to the foreground of scientific research. There is growing evidence that weather and climate extremes (i.e., hazards) are increasing in frequency, intensity, spatial coverage and duration, indicating the need for a more meticulous investigation and a better physical understanding of the processes governing the state of the climate and its future evolution [1,2,3]. The adverse impacts of extreme events, evidenced in the reported data of disaster implications, e.g., [4,5,6], are also an active subject of climate research of paramount importance [7,8,9,10,11]. Noteworthily, anthropogenic effects are emerging as the underlying cause of the weather and climate extremes [1,12,13,14,15,16,17,18].
Over recent years, research works have consistently reported that climate change aggravates climate hazards, amplifying the risks of various impacts (river and coastal floods, wildfires, droughts, landslides, etc.) [19,20,21,22,23]. Several studies on temperature and precipitation extremes have provided important findings on the regional variability of the impacts of climate change across Europe, e.g., [24,25,26,27,28,29]. Forzieri et al. [30] reported that the risks of wildfires, windstorms and inland flooding would increase in Europe, with varying degrees of change across regions, while the most dramatic rise is predicted to be in damages in southern Europe caused by heatwaves, droughts and coastal floods. The report of PESETA IV [31] consolidated those findings and indicated “a clear north–south divide, with the southern regions in Europe being much more impacted by the effects of extreme heat, water scarcity, drought, forest fires and agriculture losses”. The estimated patterns of climate-change developments urge for more efficient risk management of climate-related extremes and disasters in order to significantly advance climate-change adaptation, particularly in the most vulnerable regions. This consequently implies the need for a reliable quantification of the probability of extremes in the current and future climate. Identifying the climate vulnerabilities of key societal systems should be based on a detailed knowledge of projected climate-change hazards and the factors affecting the likelihood of each one for the selected assessment of the region of interest.
According to the report of the United Nations Office for Disaster Risk Reduction [32], the term “multi-hazard” is used to promote risk reduction and disaster management, and denotes hazardous events that may occur simultaneously or cumulatively over time. One of the most challenging research questions is the harmonization of risk metrics to allow the comparison of risks across hazards, regions, time, assets, or sectors [33]. Establishing a harmonized risk understanding would pave the way to a multi-hazard risk assessment, introducing interactions and cascading effects as well as providing some analytical interpretations of the compound and systemic risks. This would lead to more credible scenarios for describing future disaster events in terms of their magnitude and probability based on the validated scientific knowledge that can benefit from high-resolution climate projections.
The single-hazard risk assessment is a proven methodology, but shifting to multi-hazards is not a linear or easily understood process, as a multi-hazard risk analysis is not just the sum of single hazard risk examinations and thus, comparability of the single-hazard results is strongly needed [34]. Due to the diversity of the hazard characteristics’ complex relationships, triggering effects, climate-changing mechanisms, compounds and interactions could be potentially established [35,36,37].
In this work, the occurrence of hazards due to climate change was determined for Greece using data that were dynamically downscaled to a very high resolution by the Advanced Weather Research and Forecasting (WRF-ARW) model [38], initially produced by the EC–Earth Global Climate Model (GCM) [39]. The hindcast period covered the years from 1980 to 2004, while for the future projections, two different periods, i.e., 2025–2049 (near future) and 2075–2099 (far future), were studied using the Intergovernmental Panel on Climate Change (IPCC) Representative Concentration Pathways (RCPs), RCP4.5 and RCP8.5, following the recommendations of the EU National Risk Assessment [33] and similar studies in the US [40]. The RCP scenarios demonstrated a significant convergence in their emission pathways in the near future and considerable deviations towards the end of the century [41].
It has been established that high-resolution, dynamic-downscaling models applied to regional climate assessments can be implemented to assess the climate-change impacts on extremes, especially in areas with complex topography and local scale effects [42,43,44,45]. Here, we sought to provide the first step towards a comprehensive multi-hazard risk assessment for the country based on high-resolution model data to support training and preparatory activities for disaster risk reduction (DRR). The analysis focused on four critical climate hazards for Europe: heat and cold extremes, flash floods, and windstorms, each one described by a climate indicator (Section 2.2).
The scope of this work was to carry out a very detailed assessment of the most significant hazards that have occurred in Greece in the past and to predict their evolution in the future considering the impact of climate change. This is a highly valuable process as disaster management should also take into account the (non-)stationary characteristics of climate change. The current study examined these parameters for Greece using very-high-resolution climate simulations at 5 km. Furthermore, one of the goals was to identify a common categorization framework across different climate hazards, which allowed a direct and coherent prioritization of the hazards and their evolution due to climate change considering complex patterns due to local geographic conditions. The produced hazard data could readily be applied to the generation of multiple scenarios with various likelihoods of occurrence in order to obtain a more complete picture of risk [32], accounting for climate-change projections (IPCC). In addition, this work was based on the recommendations set by the UNDRR/ISC Sendai Hazard Definition and Classification Review Technical Report [46] and intended to introduce the climate dimensions and dynamic evolution of risk harmonization that was missing from such assessments [33].
Section 2 focuses on the details of the data used and the methodology that was developed to estimate the probability of the occurrence of extreme values of the variables. Section 3 presents the results and discussion of the analysis applied to the quantification of risks and the likelihood of hazard evolution due to climate change. Finally, the final section concludes the paper.

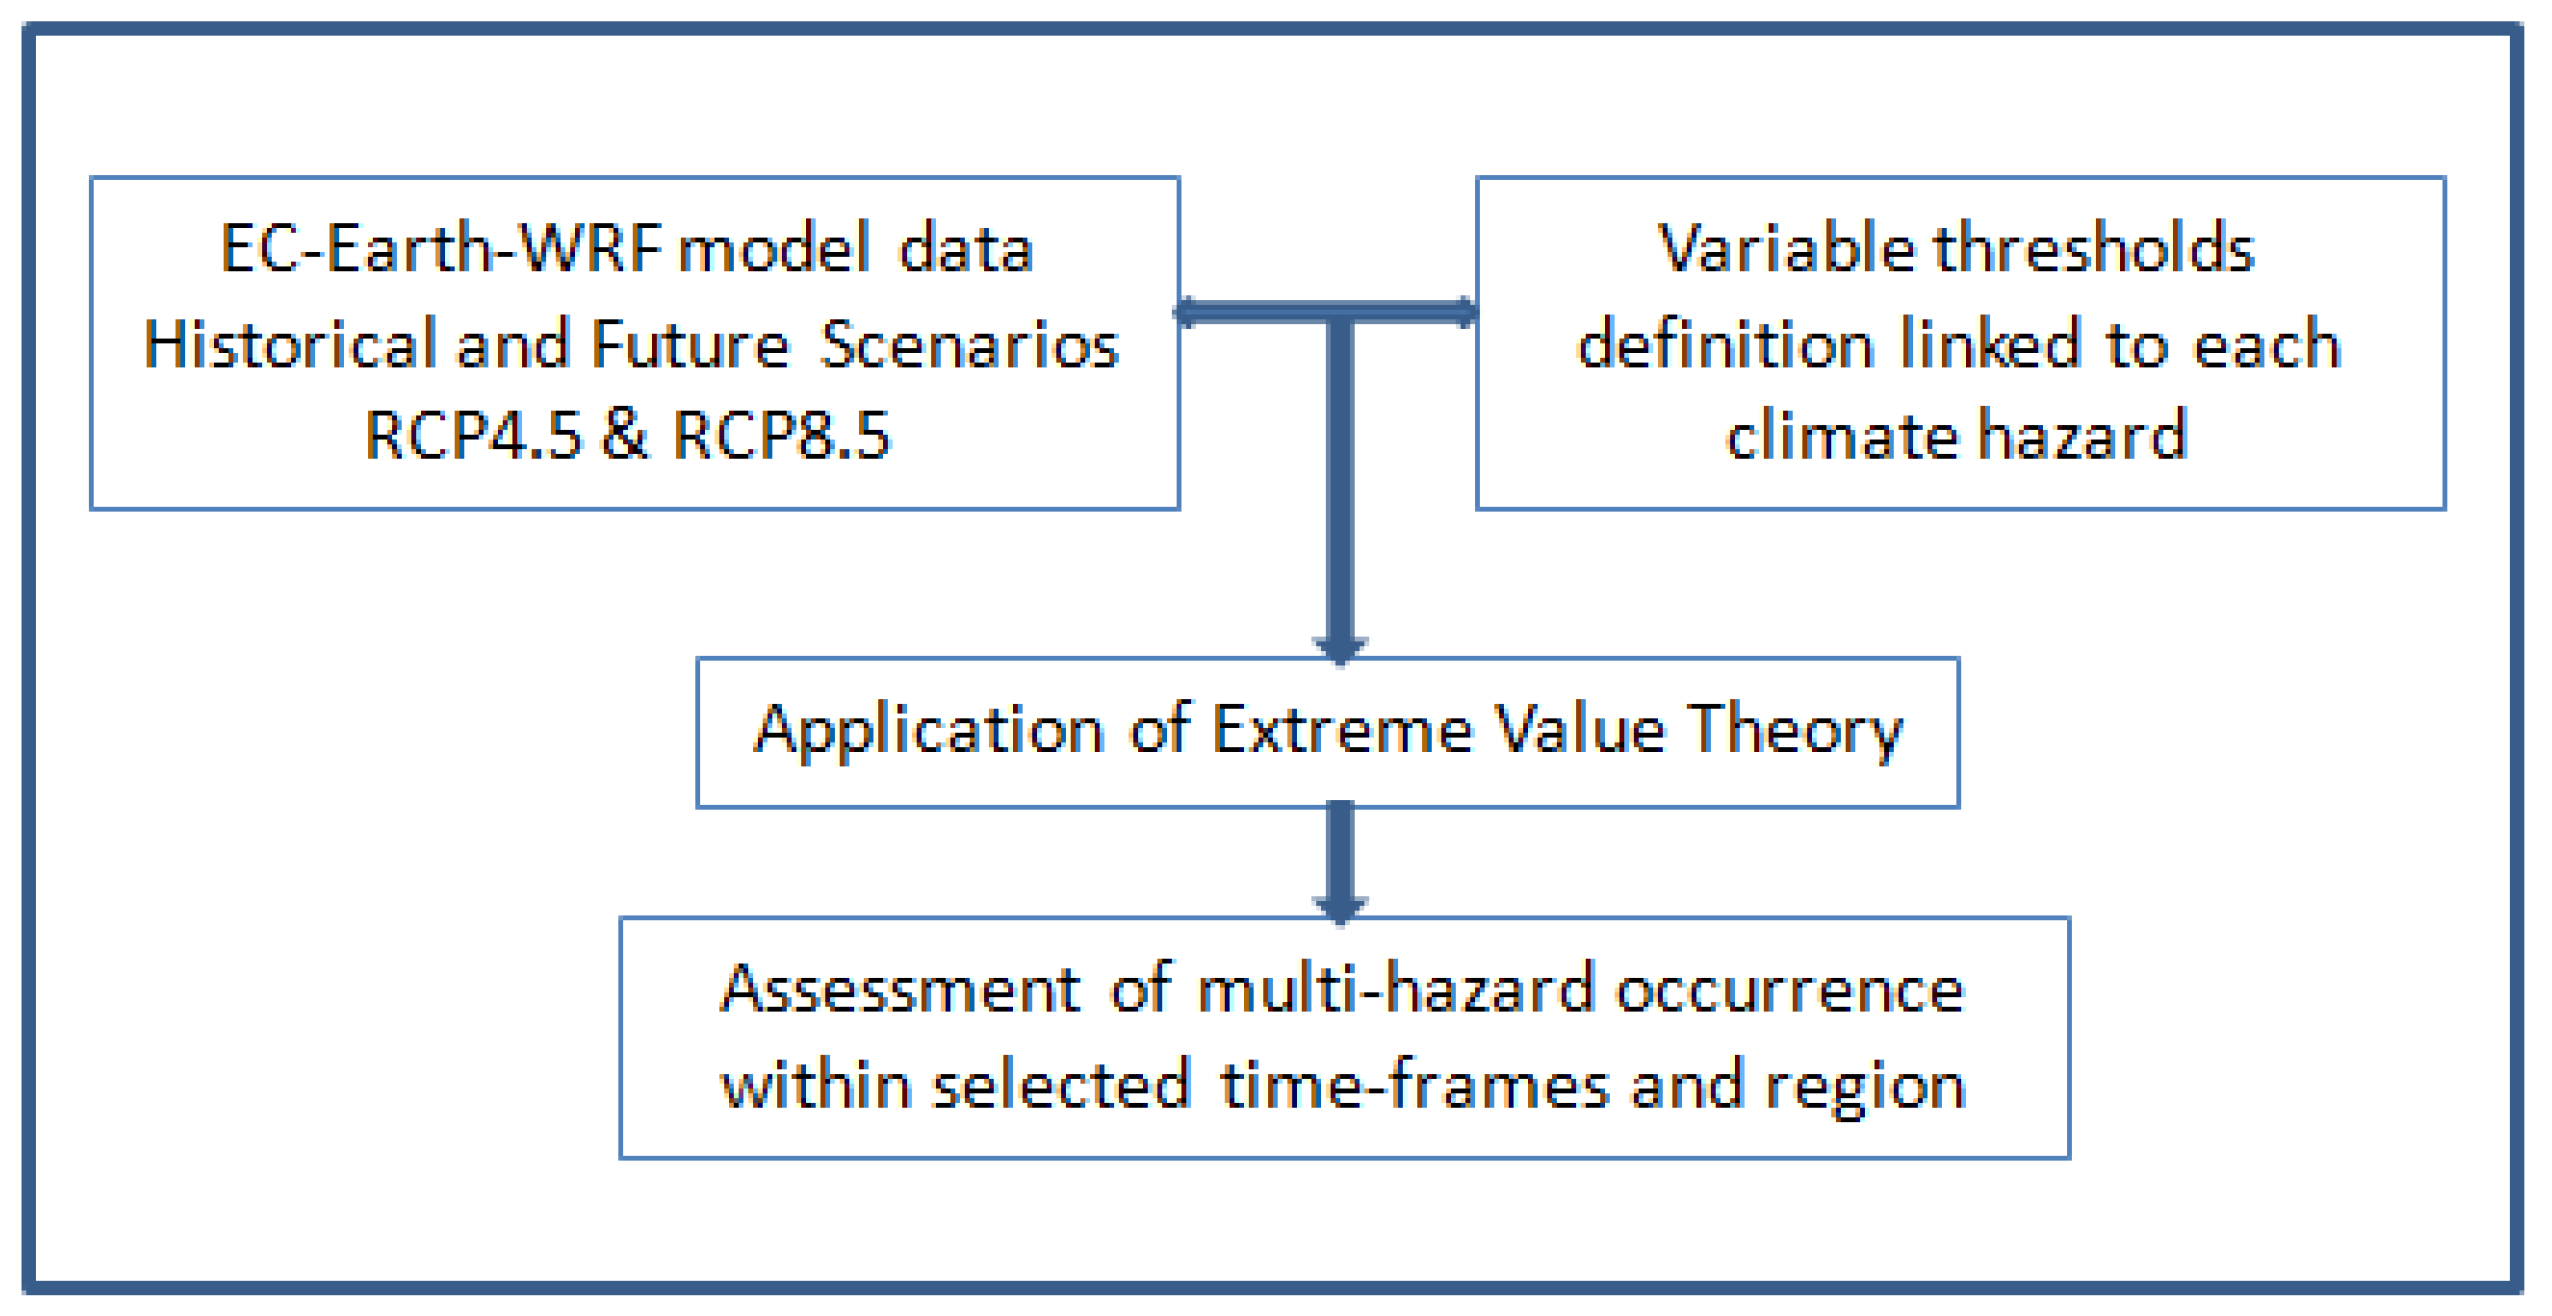
2. Materials and Methods

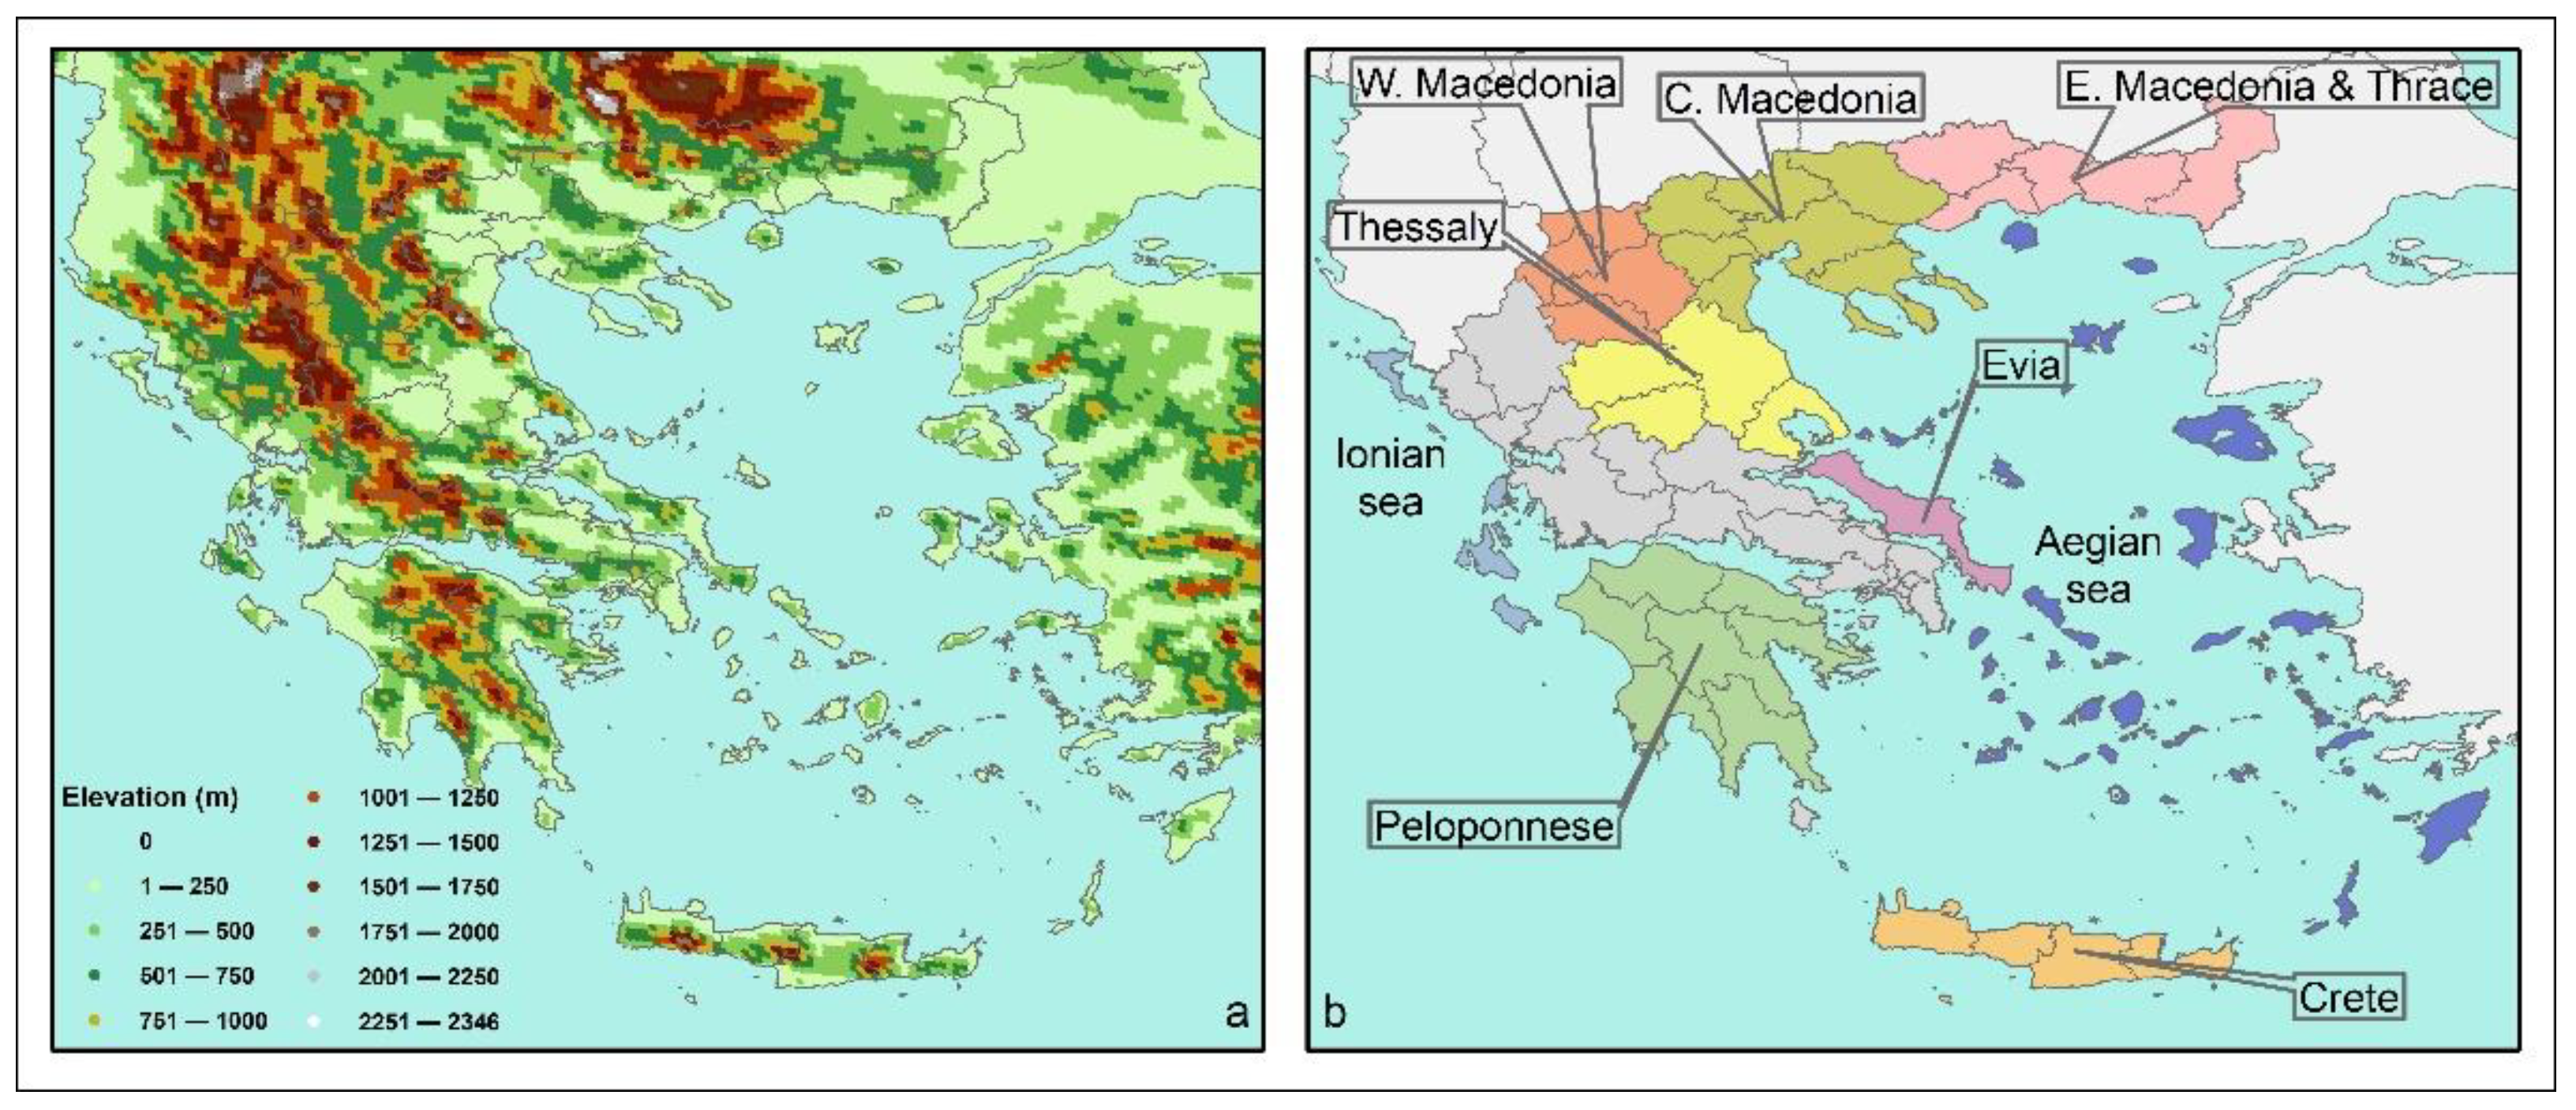
2.1. Area of the Study and Model Datasets

The study area included the country of Greece. The country presents several climatic variations, always in the Mediterranean climate frame, due to the influence of its vivid geomorphologic complexity (interplay of mountainous regions and plains, extended coastline, and numerous islands) on the different atmospheric-pressure dependencies from the Atlantic, central Mediterranean area, Eurasia and North Africa. This enhances the need for higher-resolution climate modeling to resolve the topography features more effectively.
In the present work, climate data of EC–Earth (1.125° horizontal resolution originally) downscaled by the WRF-ARW version 3.6.1 model to 5 × 5 km2 were employed at a temporal resolution of 6-h. The hindcast climate simulations have been extensively evaluated in our previous works, whereby exhaustive quantitative validation of the highly resolved fields of temperature, precipitation, wind speed and solar radiation were performed for our observations [45,47,48,49,50]. The WRF-ARW modeling domain covering Greece comprises a grid of 185 × 185 cells in the horizontal and 40 levels in the vertical that are arranged according to terrain, following the hydro-static-pressure vertical coordinates (up to ~50 mbars). A more detailed description of the WRF model setup and physical parameterization schemes can be found in [47].
For the simulations of future years under the influence of climate change, the two IPCC greenhouse-gas-emission scenarios, RCP4.5 and RCP8.5, were selected as they constitute the most commonly used scenarios by impact-assessment modelers. In particular, RCP4.5 represents an increase in the radiative forcing of the atmosphere of 4.5 W/m2 relative to the pre-industrial era with a profile of greenhouse-gas emissions increasing until the mid-century (~2050) and stabilizing thereafter until the end of the century (2100). On the other hand, RCP8.5 is considered to be the most extreme scenario with greenhouse-gas emissions increasing sharply until the end of the century, implying at its end a radiative forcing of 8.5 W/m2 relative to the pre-industrial era. The future time periods in the RCP4.5 and RCP8.5 simulations were selected in order to study the projected climate-change effects on hazard dynamics, both in the middle and near the end of the 21st century. For the present analysis, the model-downscaled data that were used and the corresponding 25-year-period slots are presented in Table 1.

2.2. Statistical Tools and Data Processing

All model-data processing and figure drawing were executed with R software and the ARC.GIS (MAP) 10.0 environment. Figure 1 depicts the basic steps of the process followed for the assessment of the extreme values of the variables, namely those of temperature (maximum and minimum), precipitation rate, snowfall and wind speed. Firstly, the maximum and minimum temperature values were retrieved for the summer and winter seasons, respectively, while data were extracted throughout the year from the gridded datasets to determine the extremes of the precipitation rate, snowfall and wind speed. In this manner, at each grid cell and for each period (see Table 1), the 25 maximum values of each variable were obtained. The process was applied to all three time periods of interest and both RCP scenarios (see Table 1).
Then, the modeled values of the variables of interest to this study were categorized in terms of likelihood, i.e., probability of occurrence, according to Table 2. The likelihood categories, six in total, and the threshold values of Table 2 were retrieved from the EU-CIRCLE project report [51] for the characterization of the hazard (maximum (summer) temperature, minimum (winter) temperature, precipitation rate, snow rate and wind speed). The probability of occurrence of each variable was calculated for all six categories. As the study was aimed at determining the likelihood of extremes, the focus was placed only on the specific categories characterizing the highest threshold values and hence, the probabilities of occurrence were calculated as totals of the three classes “High”, “Very High” and “Exceptional”.
In this work, the method for calculating the probability of exceeding a value was based on the Extreme Value Theory (EVT). The determination of the extreme values of the studied variables required the selection and definition of the underlying distribution functions. The estimations were made using the R package “Extremes” [52], fitting a Generalized Extreme Value distribution (GEV) to block maxima data (annual maxima) under the assumption of non-stationarity [53]. The GEV distribution has three parameters: the shape factor ξ, the scale or dispersion parameter σ and the location or mode parameter μ. The GEV-distribution function, G(y), is given by:
For   ξ     0 ,   G ( y ) = exp ( [ 1 + ξ ( y μ σ ) ] 1 ξ )
For   ξ   =   0 ,   G ( y ) = exp ( exp ( y μ σ ) )
The GEV has three types depending on shape parameter ξ, as follows:
  • When ξ = 0, GEV is known also as Type I Extreme Value Distribution (or Gumbel Distribution, light tail)
  • When ξ > 0, GEV is known also as Type II Extreme Value Distribution (or Frechet Distribution, heavy tail)
  • When ξ < 0, GEV is known also as Type III Extreme Value Distribution (or Weibull Distribution, upper finite end point).
The final step of the applied methodology included the calculation of the most frequently appearing hazard at each grid cell, time period and RCP scenario. In this manner, we performed the spatial assessment of the occurrence of multi-hazards in the historical period and in the two studied future periods according to the two RCP projections in order to illustrate the areas susceptible to hazards over long time scales.

3. Results and Discussion

In this part, we present the results of the previously described applied approach. For reasons of clarity, each subsection provides the results pertinent to each studied hazard. Figure 2a presents the highly resolved topography of the EC-Earth global model downscaled by WRF to the high horizontal resolution of 5 × 5 km2. Additionally, highlighted in Figure 2b are the regions of the country, where some important findings are more extensively discussed.

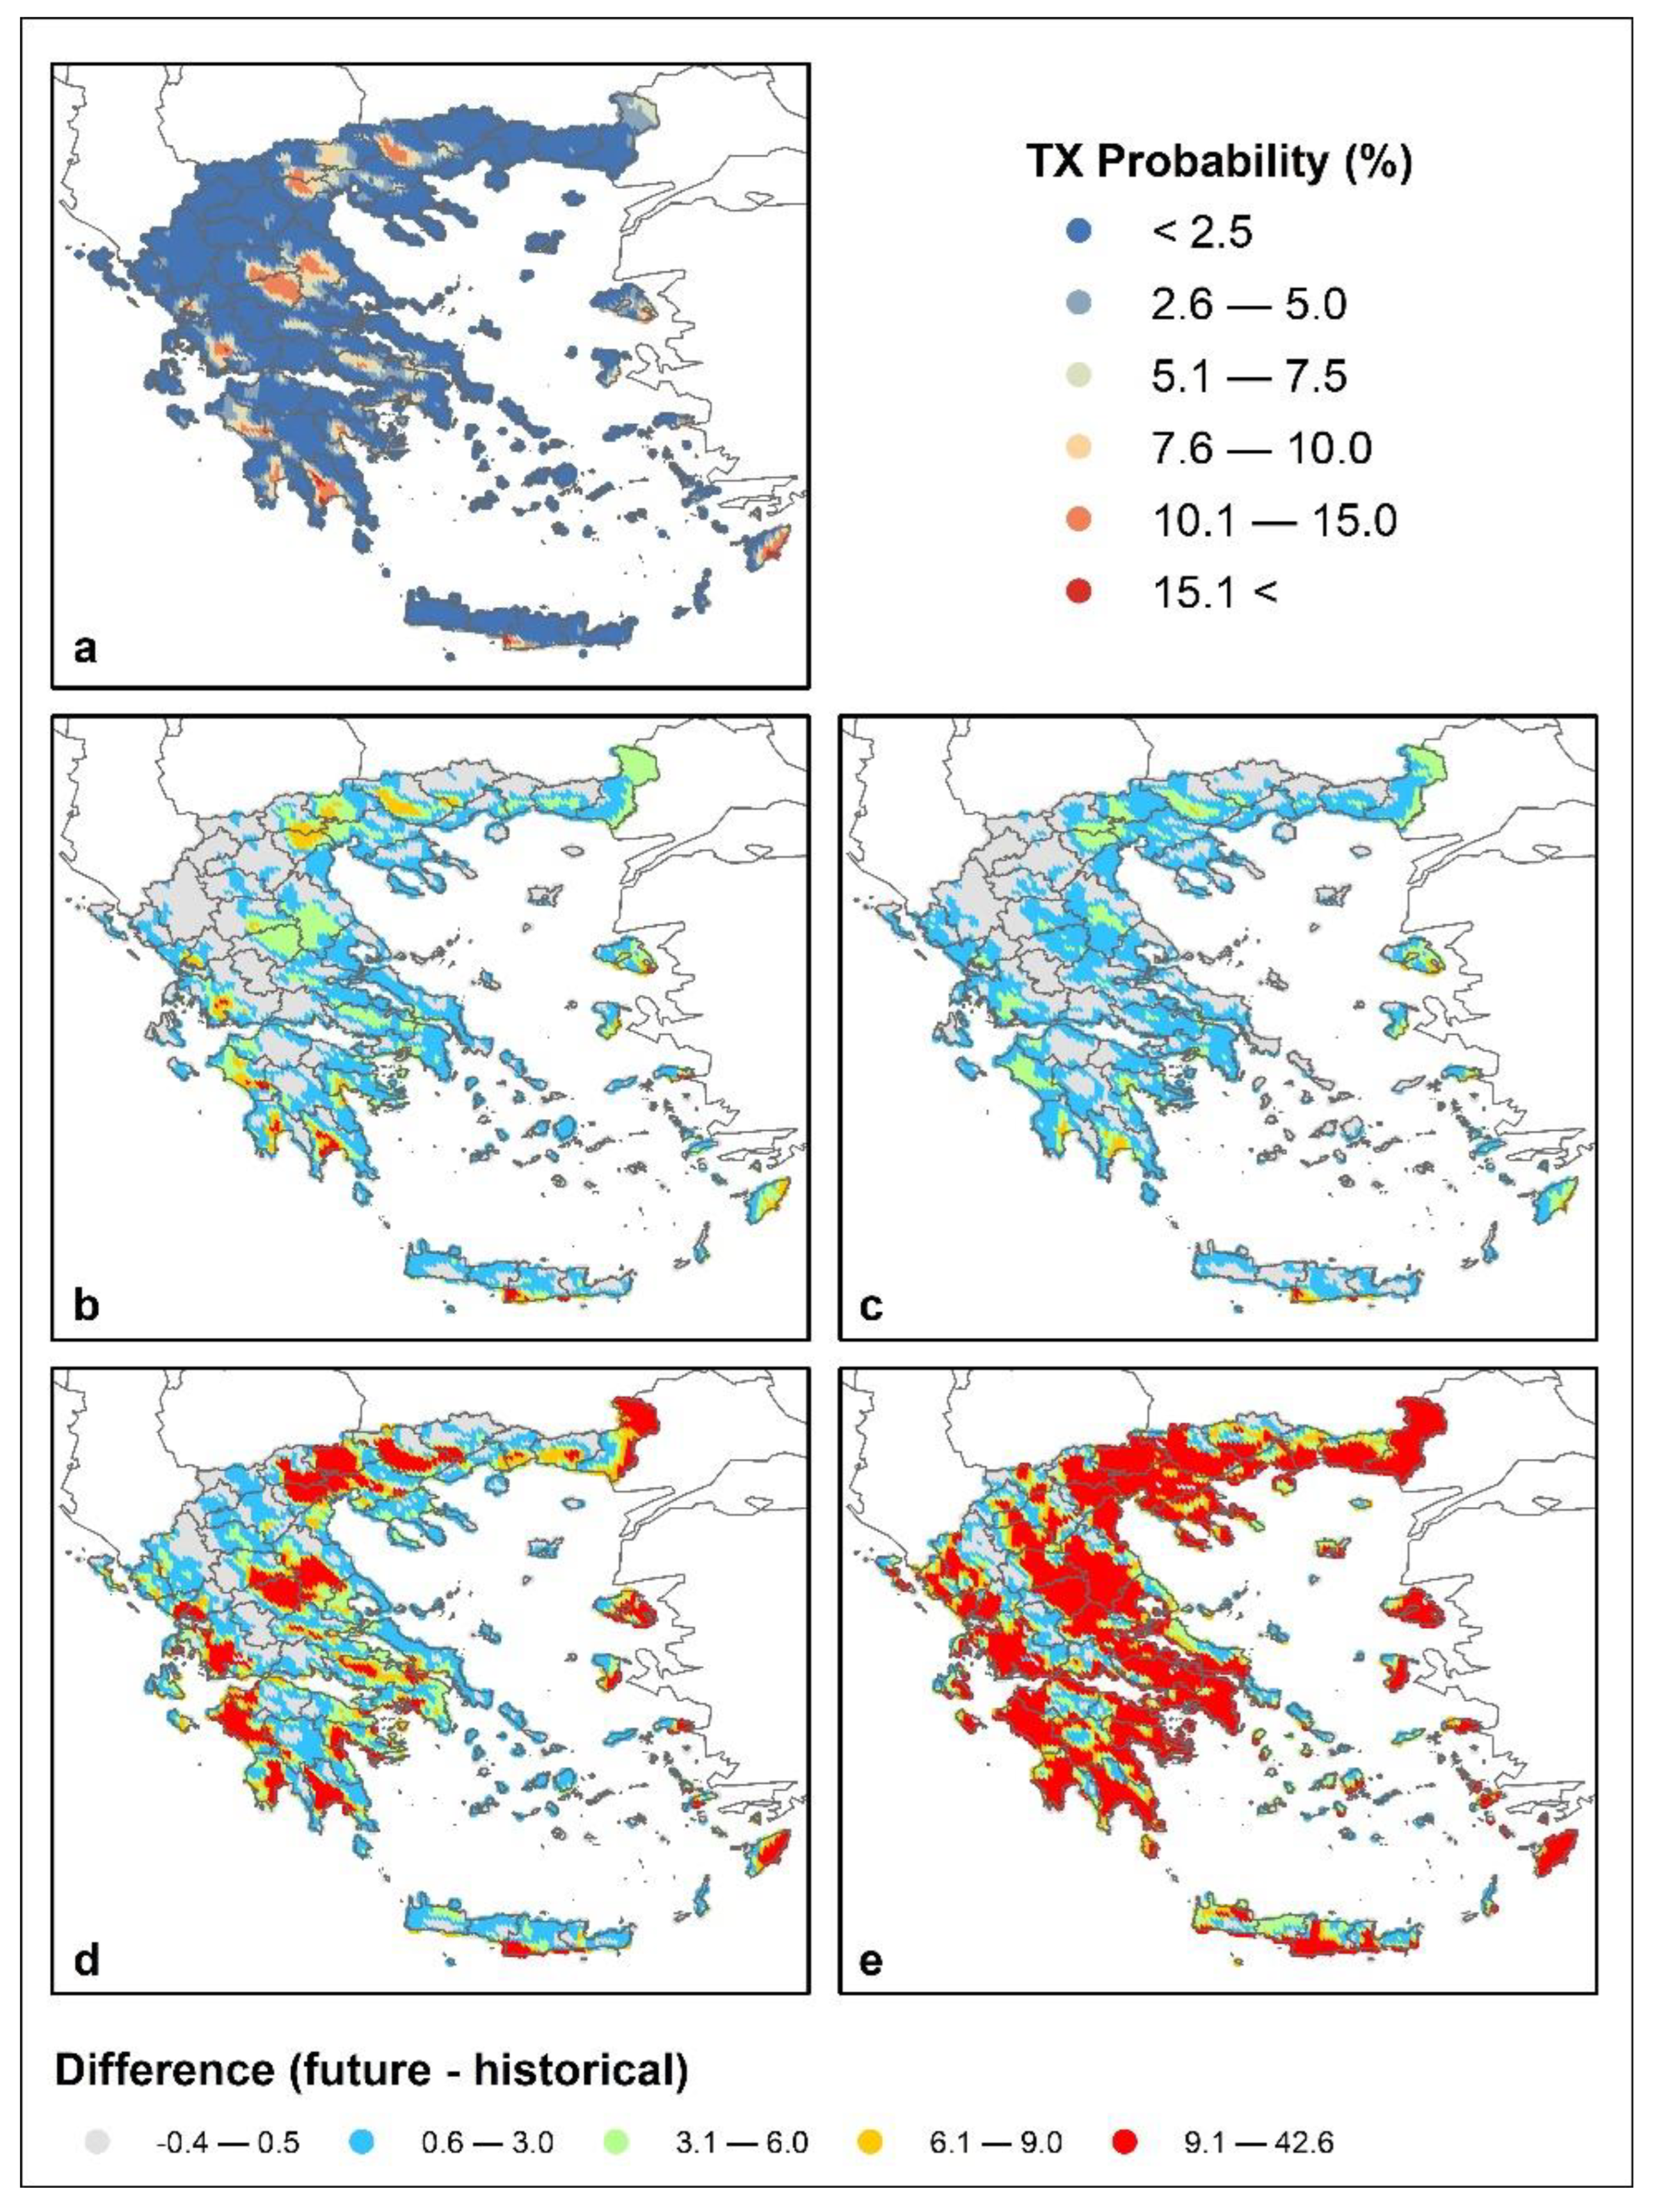
3.1. Maximum Temperature

Figure 3a shows the probability of the occurrence of TX exceeding the threshold value (i.e., the probability of exceedance) of 35 °C during the summer season of the historical period of 1980–2004. Figure 3b–e depict the differences in the probability of exceedance between the future projections and the historical values (i.e., future–historical) for both RCPs and the studied periods. During the historical period, we may deduce that the majority of areas show low probabilities of exceedance below 2.5% (Figure 3a). On the other hand, the highest occurrence of maximum temperature values with the probability of exceedance above 10% is seen in the plains of the regions of Thessaly, central Macedonia, Peloponnese, the western mainland, the eastern Aegean islands and southern Crete, which are well known as summer hot-spot areas [54].
Overall, in the near future, more areas compared to the historical period were found to be exposed to extreme TX values (Figure 3b,c). In addition, it appears that the probability increase in hot-spot areas is higher in RCP4.5, with these values exceeding 3%. The differences in the referenced areas become much larger, exceeding 10%, and even extend spatially into the far future and more profoundly in RCP8.5 (Figure 3d,e). In fact, the probability of exceedance according to RCP8.5 in the far future increases not only in the plains areas with low topographic heights but also in areas with heights in the range of 500 to 1000 m (Figure 3e).
This could be considered an important change predicted by the worst-case emissions scenario that would cause adverse conditions near the end of the century. Nevertheless, in the near future, insignificant changes are expected over the high mountainous regions according to both RCPs concerning the historical period (Figure 3b,c). In the far future, the insignificant changes are still found over the highest mountains with RCP4.5 (Figure 3d) but the RCP8.5 scenario diminishes these (around zero values), showcasing detectable differences in the probability of exceedances of 3–6% with respect to the historical period, even over the highest summits of the mainland (Figure 3e).

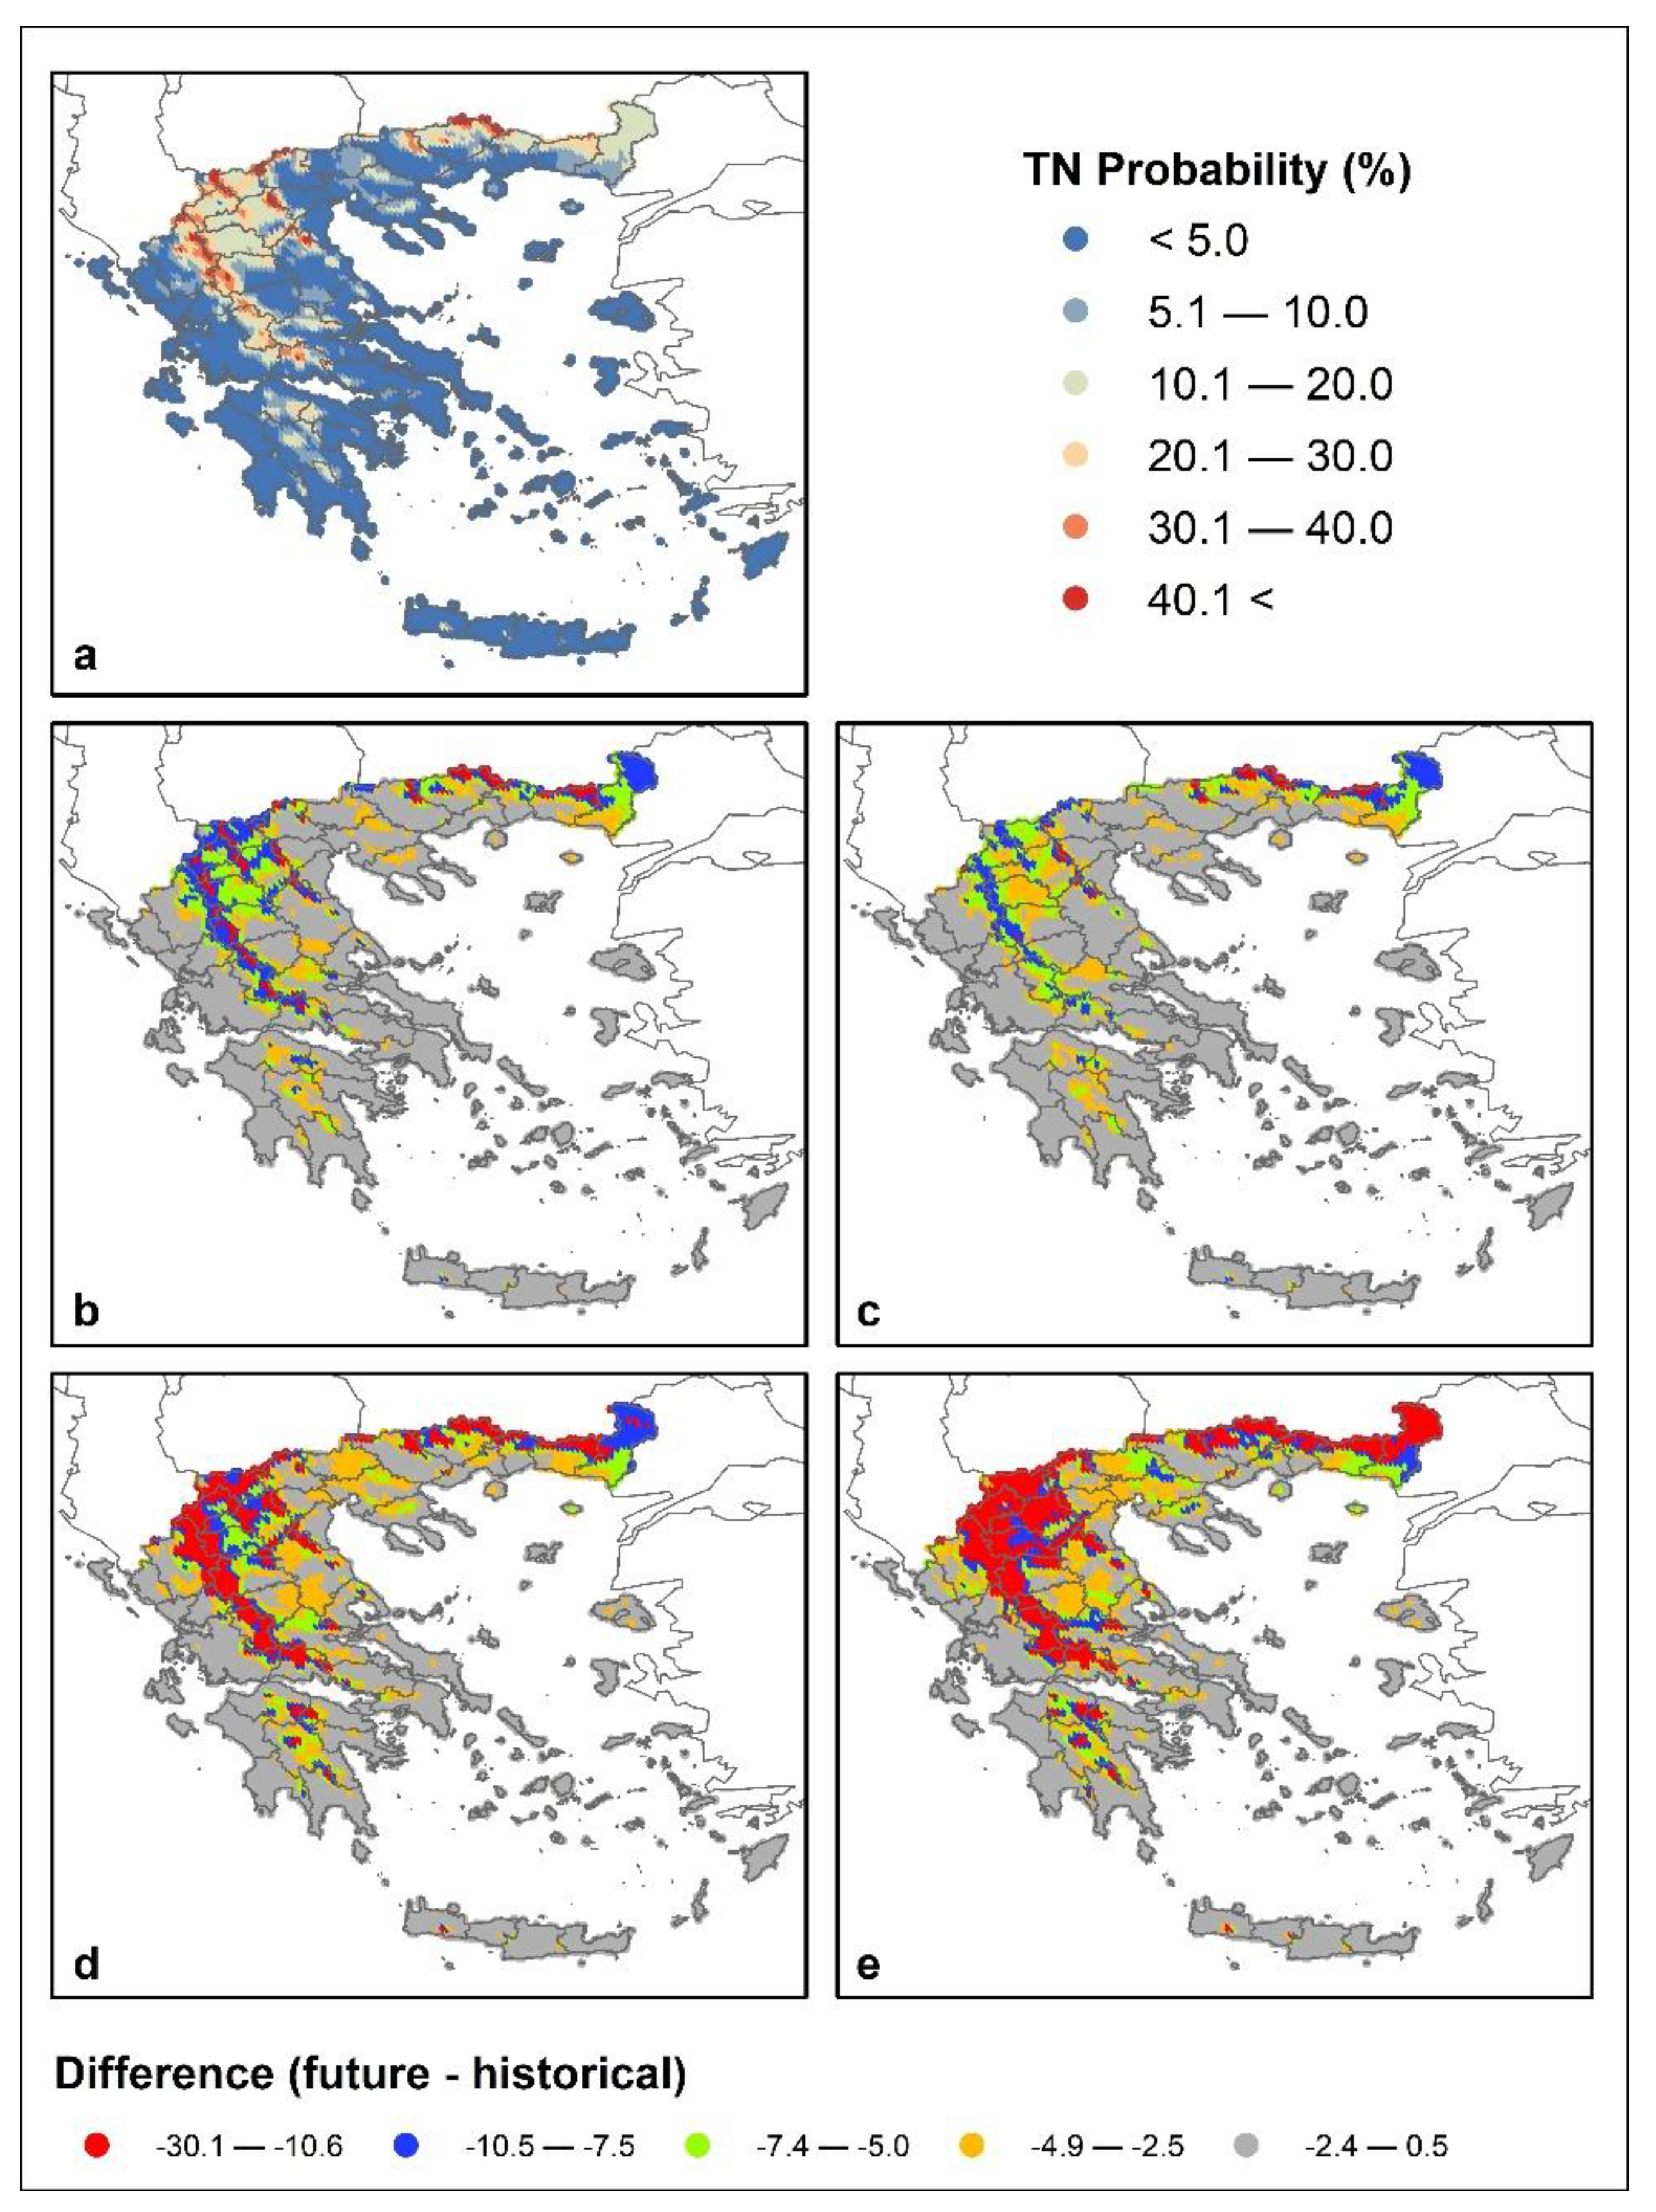
3.2. Minimum Temperature

Figure 4a presents the probability of TN exceeding −5 °C towards lower values during the winters of the historical period. Overall, the probability values remain below 5% in most areas of the mainland and the islands. Over the higher topographic heights of the central and northeastern mainland (see Figure 2a), the probability increases to noticeable levels in the range of 20 to 40% that are consistent with the occurrence of very low temperatures and the extreme winter climatology of the country [54]. The differences in the probabilities of exceedance of TN between the two future and historical periods (future–historical) are shown in Figure 4b–e for both RCPs. We may observe that under all scenarios and periods, areas that have historically had very low probability values of extremely cold temperatures preserve these characteristics in the future.
In general, we observe a strong decrease in the probabilities of exceedance of TN over the mountainous areas of the central and northeastern mainland in both future periods with respect to the historical period, which denotes a reduction in the future occurrence of extreme values of TN and thus, fewer winter extremes. In the near-future period, the highest decreases in the central mountainous areas are more intense in RCP4.5 (Figure 4b) than in RCP8.5 (Figure 4c) while in eastern Macedonia, Thrace and Peloponnese there are no noticeable differences between the two scenarios. Stronger decreases in the occurrence of winter extremes are estimated for both scenarios in the far future (Figure 4d,e). The impacted areas according to RCP4.5 remain the same during both periods (Figure 4b,d) but they extend more spatially in the far future with RCP8.5 (Figure 4c,e).

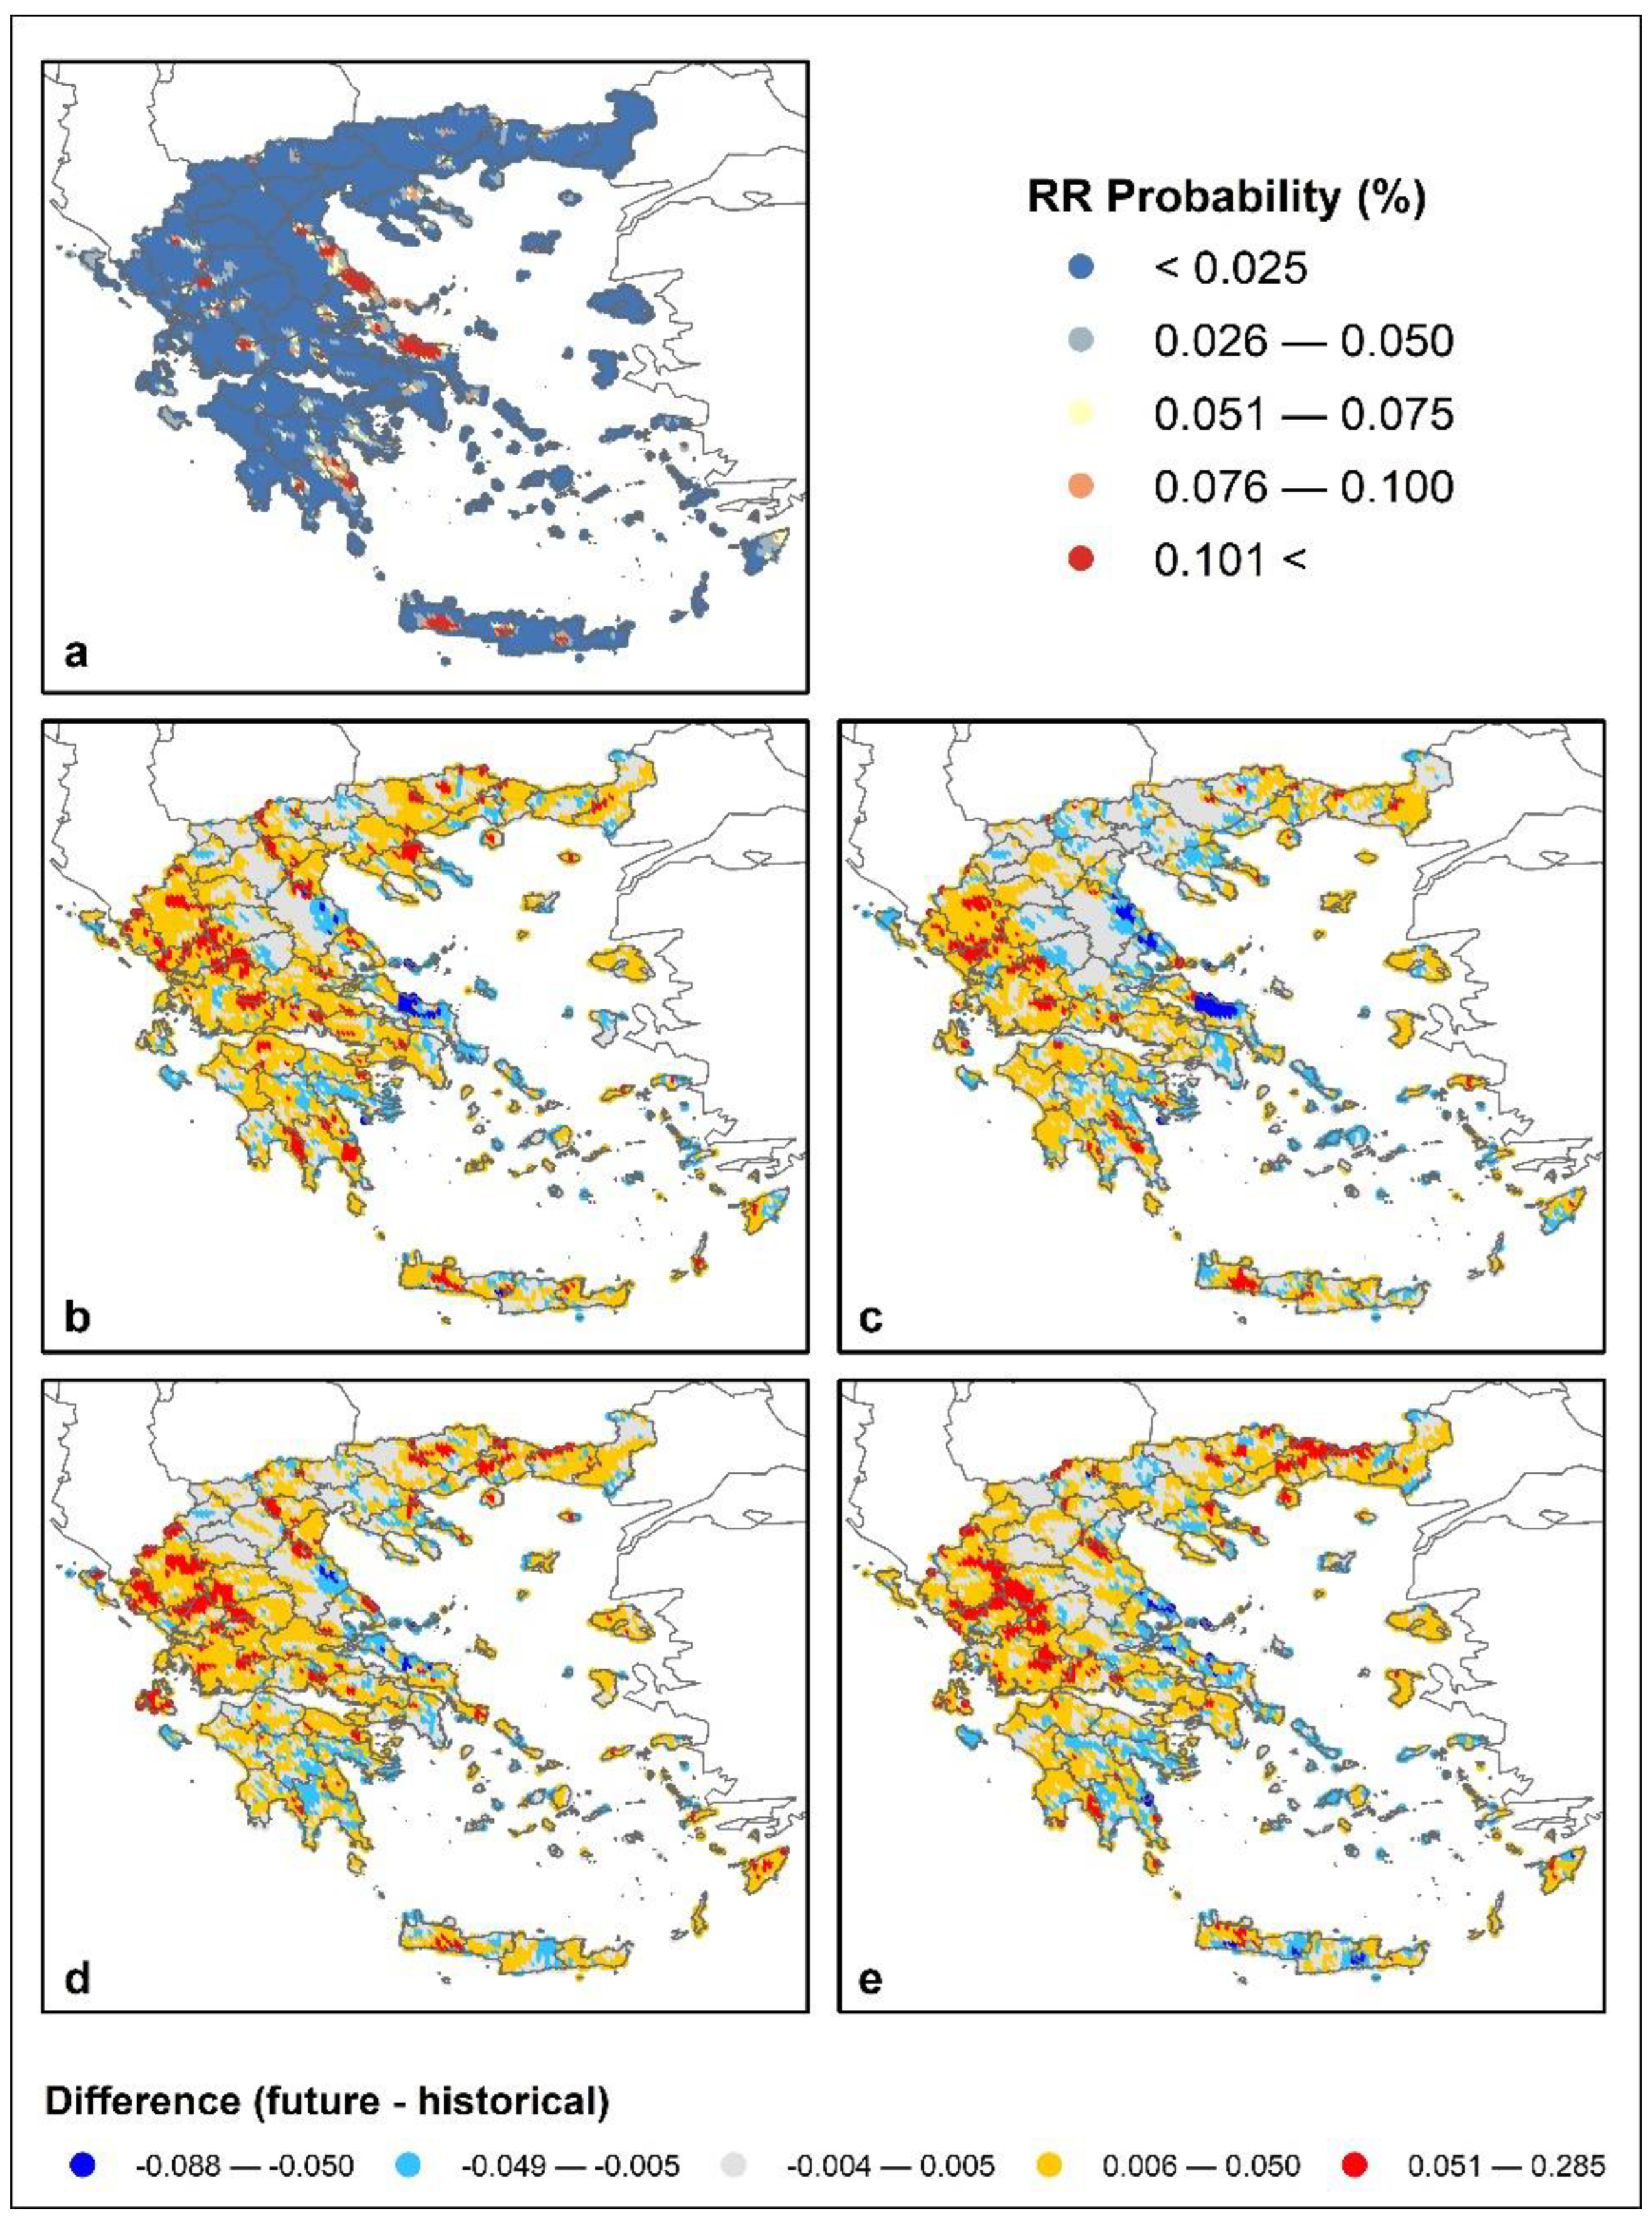
3.3. Precipitation Rate
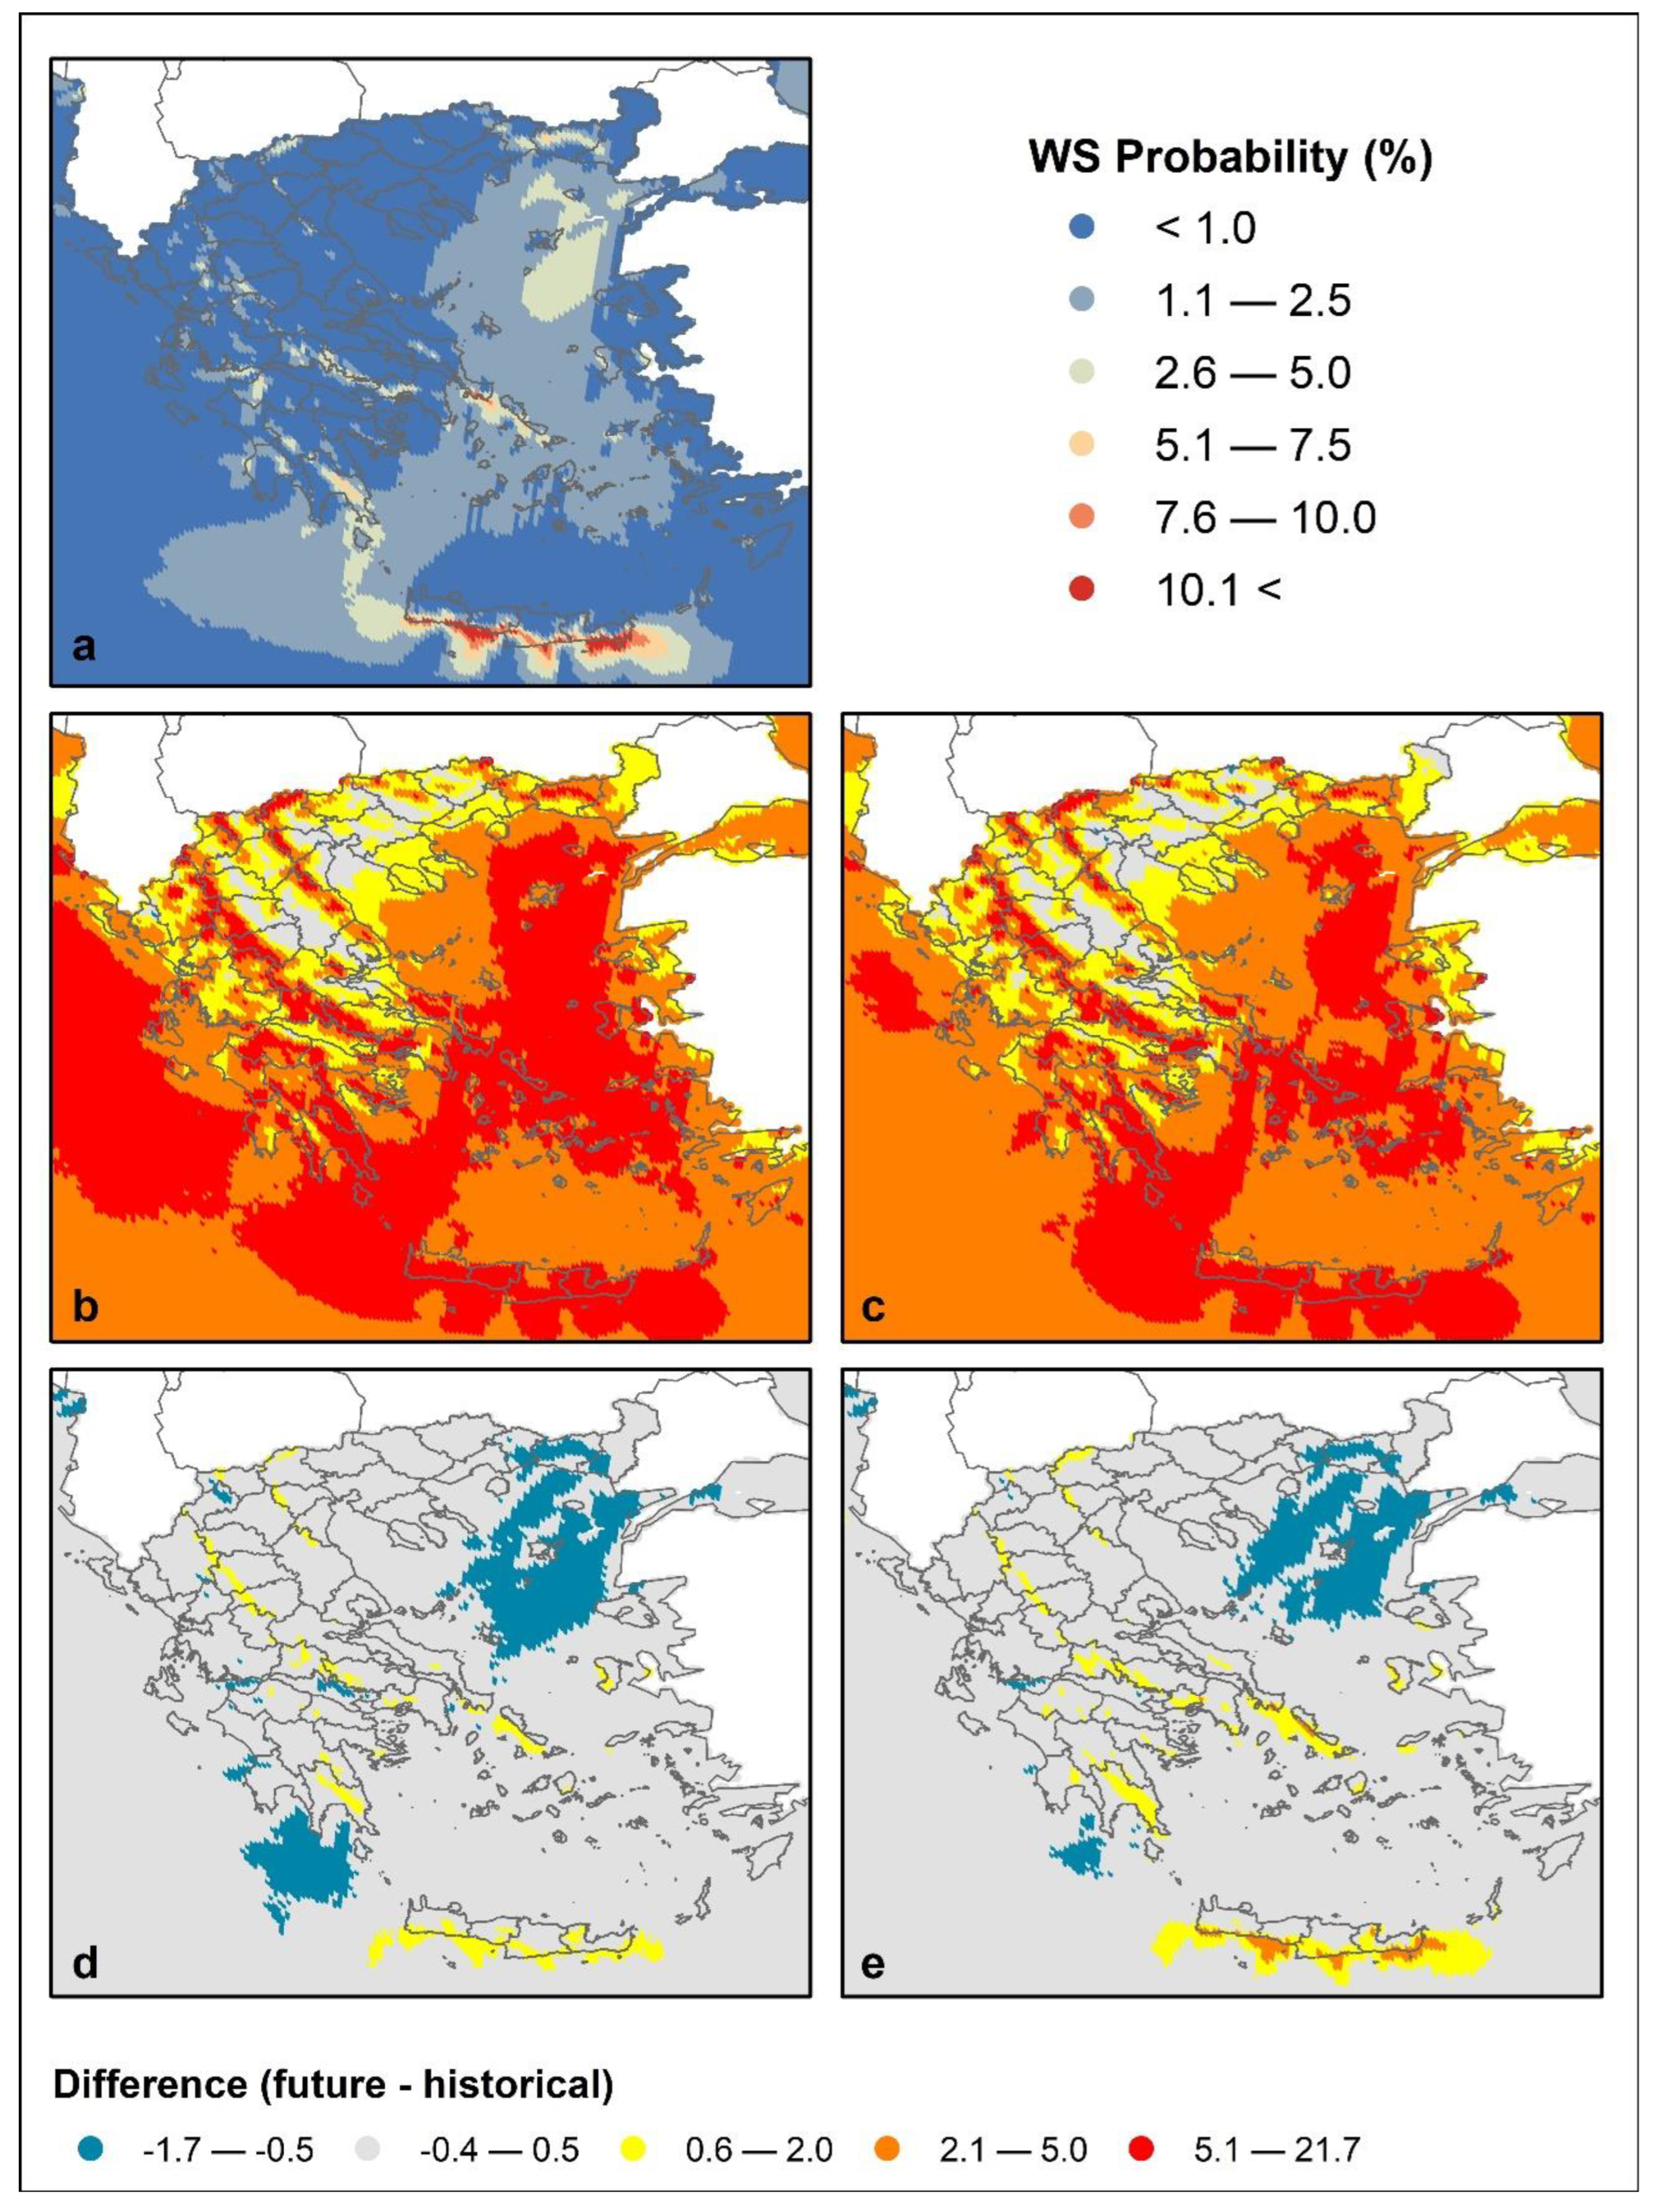
Figure 5a presents, for the historical period, the probability of precipitation extremes calculated as the probability of precipitation rates exceeding 10 mm/h. The pattern with persisting probabilities over the majority of the domain of less than 0.025% does not yield noticeable spatial variability. Yet, increased probabilities of extreme precipitation with values greater than 0.075% are observable in the very high mountainous areas of the central and eastern mainland and over the summits of Crete and Peloponnese. In addition, some areas known for high-precipitation rates such as the Ionian islands and parts of central and eastern Macedonia and Rhodes reasonably exhibit distinguishable contours of the probability of exceeding 10 mm/h up to 0.075%.
The differences between the future projections and historical simulations indicate a reduction in future extreme precipitation mostly in the eastern parts of the mainland, central Aegean islands and mountainous areas of Crete (Figure 5b–e). The maximum decrease is obtained in the near future (Figure 5b,c). Additionally, with reference to the historical period and both RCPs, we may observe minute and insignificant changes in extreme precipitation rates, more extensively in the regions of Thessaly and central Macedonia and predominantly in the near future (Figure 5b,c). However, interesting patterns of increased probabilities of extreme precipitation can be seen in highly mountainous areas primarily in the western and northeastern mainland (in the range of 0.051–0.285%) and more vividly for RCP8.5 (Figure 5d,e). The RCP4.5 projections do not show a noticeable change between the two future periods. On the contrary, according to RCP8.5, the far-future period shows on average an increase in the probability of rainfall extremes compared with the near future, both in magnitude and spatial extent. Overall, the patterns of differences showcase increased probabilities of extreme precipitation rates in the studied future periods even at low topographic heights, which may highlight a bothersome climate-change effect for the agricultural economy.

3.4. Wind

During the historical period, the areas of high wind-speed (exceeding 15 m/s) probability are found to be consistent with other studies in the literature [45,55,56] (Figure 6a) and in accordance with the known synoptic atmospheric systems associated with the prevailing wind patterns. More particularly, the areas of the northeastern Aegean Sea are impacted by north-easterlies and the central Aegean by the Etesians, whereas the topography of Crete significantly amplifies the patterns of the extreme winds.
In the near future and under both scenarios, the probability of the occurrence of windstorms is amplified almost all over the domain and mostly over the sea areas and mountain ridges (Figure 6b,c). The Ionian and central Aegean Seas are projected to exhibit the highest changes in the probabilities in the RCP4.5 scenario.
In the far future, both scenarios show a decrease in the probability of extreme winds over the northeastern Aegean and south Ionian Seas (Figure 6d,e). On the other hand, the mountainous areas, the central Aegean Sea and Crete present an increase in the probability of extreme winds. The increases in extreme winds associated with the Etesians over the Aegean Sea projected by both RCPs are in agreement with the findings of [57].

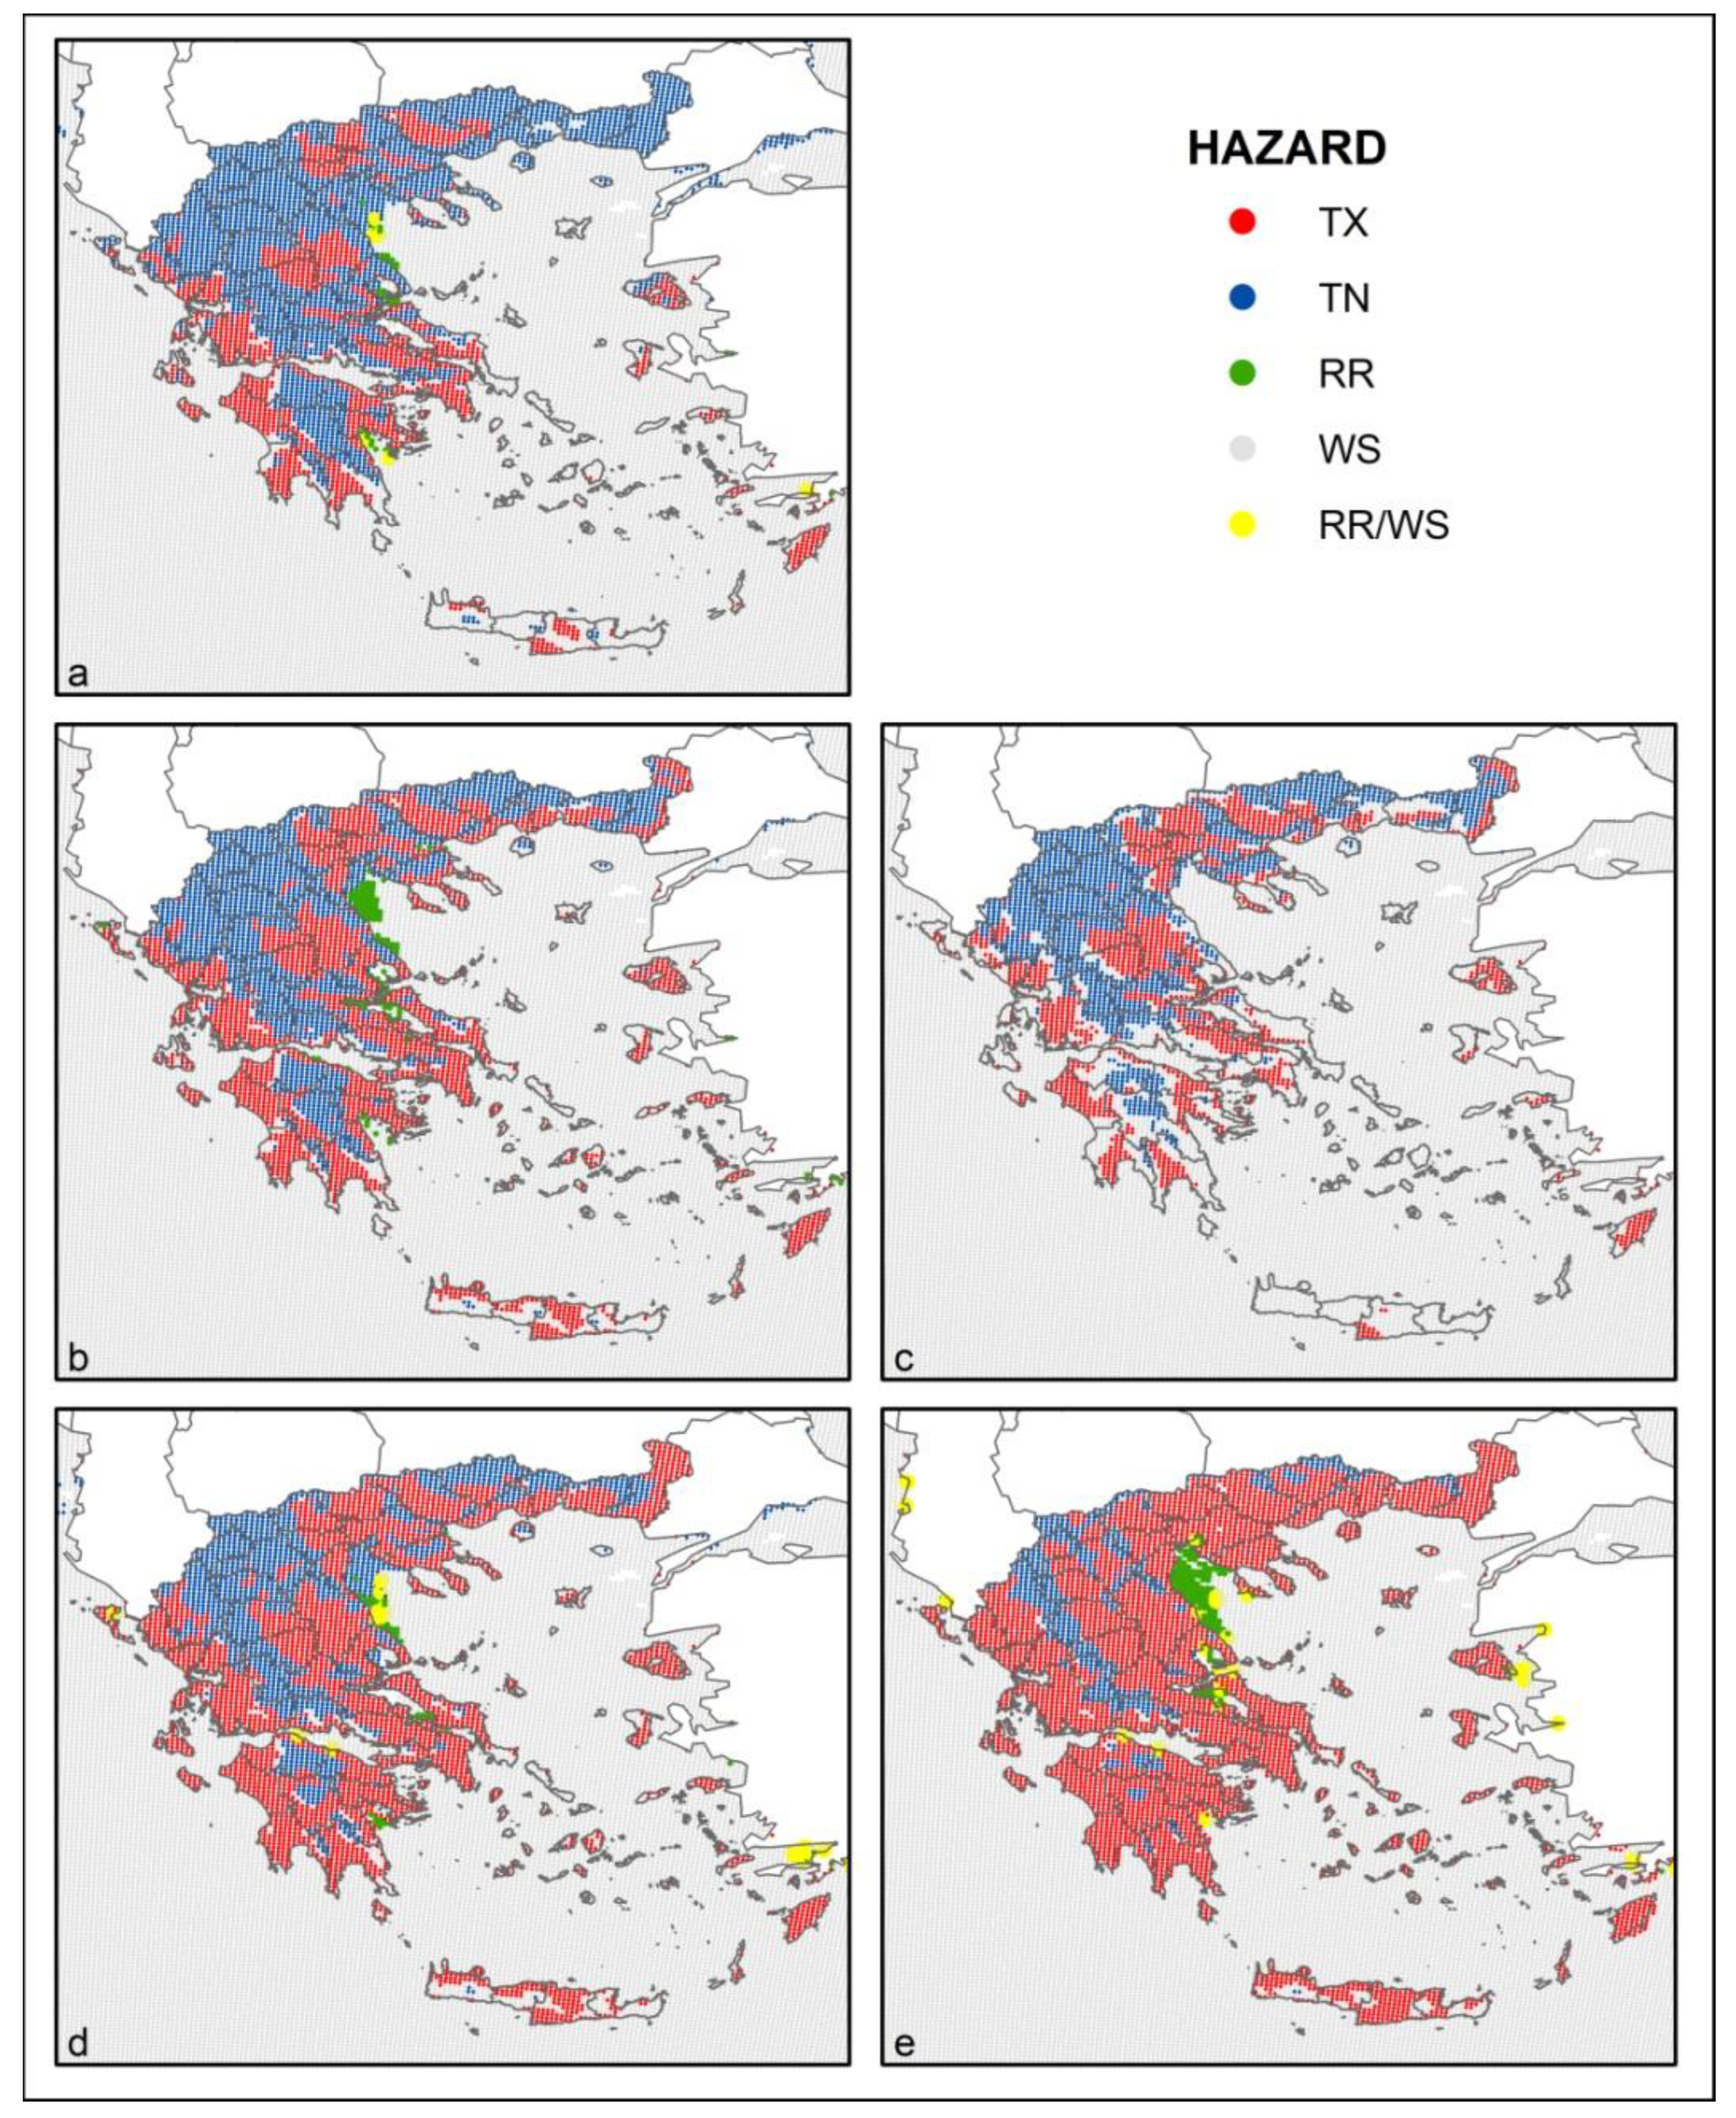
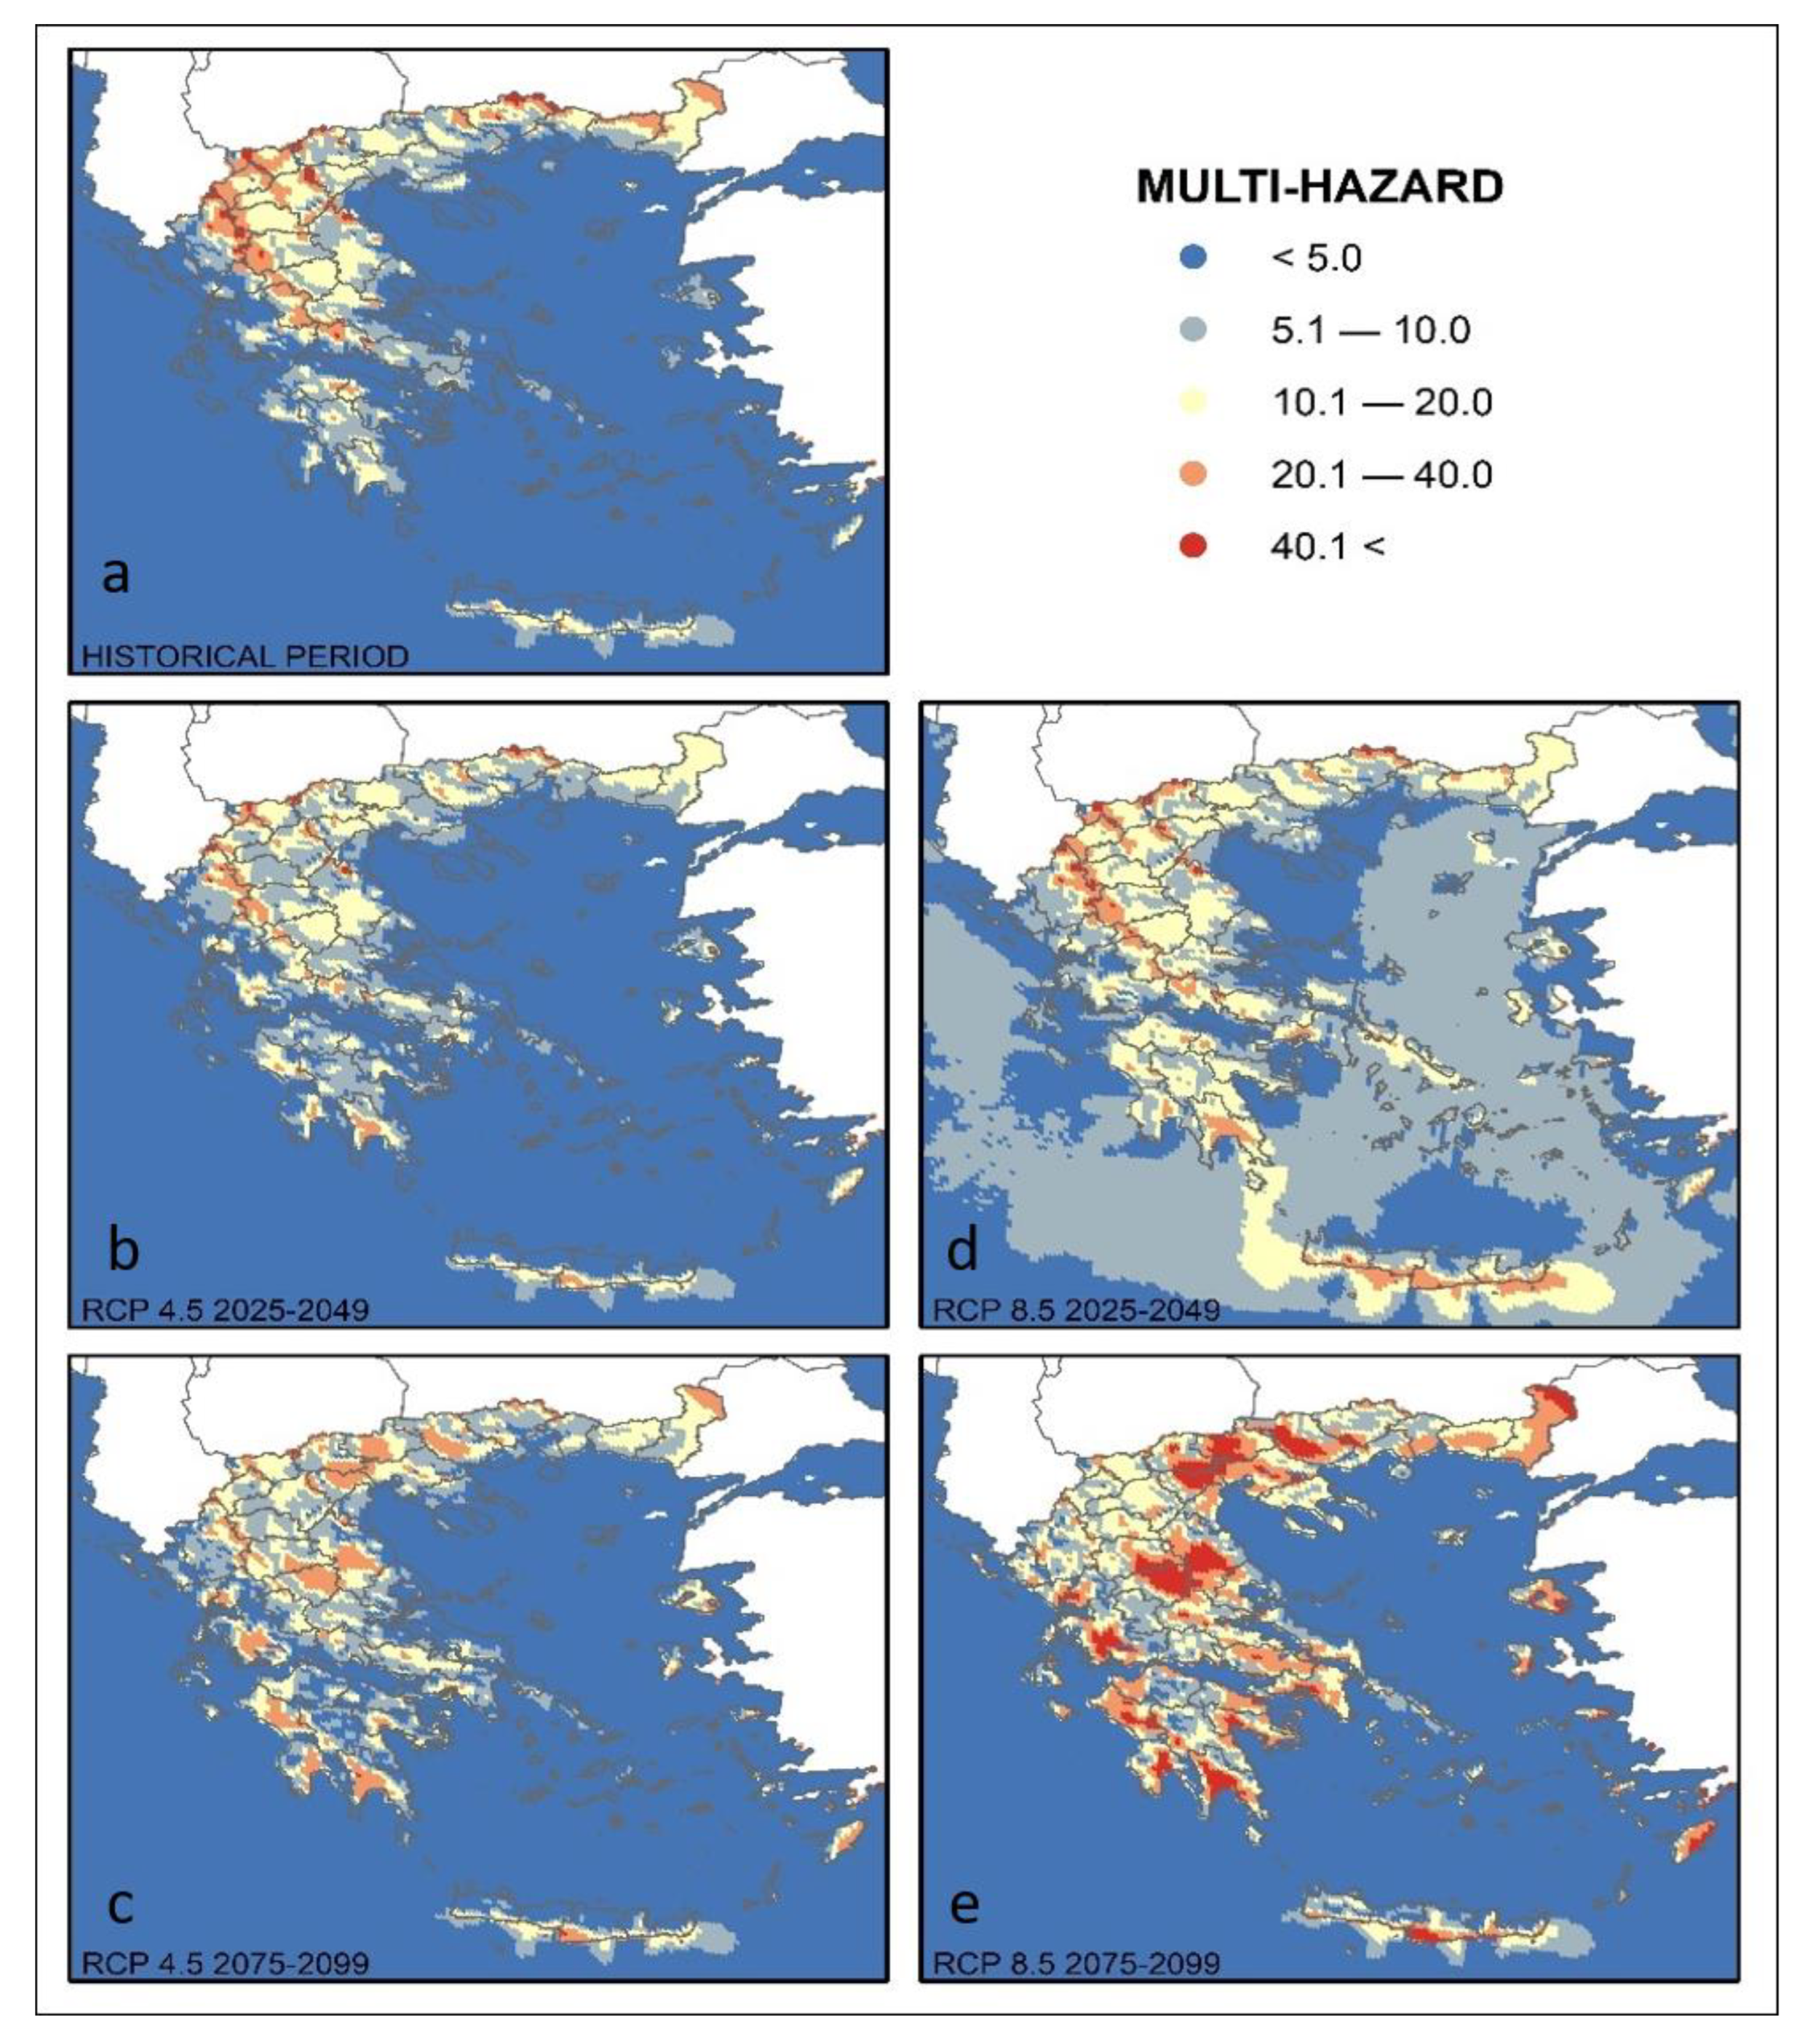
3.5. Multi-Hazard Probability Maps

Figure 7 depicts the spatial distribution of the probability of occurrence of the most dominant hazard calculated for the historical period and both future periods and scenarios. The dominant-hazard map for the historic period indicates the dominance of extreme TX over plains and coastal areas and the dominance of extreme TN at topographic heights higher than ~500 m a.m.s.l (Figure 7a). Over the seas, the islands of the central Aegean and the southeastern corners of Evia and Peloponnese, the extreme winds become dominant. However, extreme temperatures preside in the islands of the Ionian and eastern Aegean Seas, while in the northern parts of some of them, the extremely low temperatures or extreme winds dominate. In the case of Crete in particular, we observe the dominance of the three hazards with extreme TX and TN over the plains and high mountainous regions, respectively, and windstorms over the remaining areas of the island. Moreover, the dominance of extreme rainfall is observed in parts of the eastern coasts of the central mainland and Peloponnese.
The projected changes according to RCP4.5 in the near future yield a more extended dominance of extreme TX, particularly in the areas of Peloponnese, the central-eastern mainland and in the north of the country over the plains of central and eastern Macedonia and Thrace (Figure 7b). The same effect is observed in the central Aegean islands and northern parts of Crete. In addition, the extreme rainfall is seen to prevail more extensively in eastern coastal areas of the mainland. On the other hand, according to RCP8.5, the dominance of extreme TX becomes more profound in Thessaly and the plains areas of northern Greece (Figure 7c). Moreover, an interesting pattern of prevailing extreme winds is revealed in parts of the mainland and mostly in the Peloponnese where in the historical period the dominance of extreme temperatures was evident. Furthermore, RCP8.5 presents extremely windier conditions for the Ionian islands and Crete. This result agrees with the findings of Karozis et al. [56] that highlighted the reduction in the persisting anticyclonic activities over Greece and the Balkans in the near future, a change that denotes less frequent stagnant atmospheric conditions. The same study indicated a possible reduction in the passage of cyclones over Greece originating from the cyclogenesis region of the Central Mediterranean and the Adriatic Sea that could explain the reduced extreme-rainfall findings.
In the far future, the projected changes due to RCP4.5 show the dominance of extreme TX in areas of low altitude and more vividly in western Greece, Peloponnese, Thessaly and the northern mainland (Figure 7d). Additionally, in Crete and the central Aegean islands the extreme winds become less dominant and extreme TX predominates. In addition, the extreme rainfall is noted to persist in the far future over coastal parts of the eastern mainland. All the same, the extreme TN dominates in the mountainous areas. The high occurrence of extreme-winter-cold events under high-emission scenarios agrees with other climate-model projections that estimated increases in mid-latitude westerlies and northerly cold-air flow due to the influence of the upper-tropospheric equator-to-pole temperature difference in the storm-track response to climate change [58].
Furthermore, the RCP8.5 projections of the far future showcase the extended dominance of extreme TX in the islands and mainland except for the highest altitudes (circa 1500 m a.m.s.l.) (Figure 7e). The future intensification of extreme-temperature events is in agreement with other studies due to non-linear interactions, which are presently not quantified, between Arctic teleconnections and other remote and regional feedback processes [59,60]. Furthermore, the extreme winds remain the dominant hazard over the seas while the eastern coasts of the mainland would mostly experience extreme rainfall events that only persist locally in the far future. This outcome is associated with the Arctic amplification and possible connection to the weakening of mid-latitude storm tracks [61].
Figure 8 presents the multi-hazard occurrence in Greece for the examined periods. The value indicates the cumulative annual probability that at least one of the studied extreme hazards will occur. It demonstrates that patterns of highly exposed areas in Greece over the historic period will be spatially shifted in the far future as the increase in hotter climate regimes will be dominating the risk landscape.
In the historic period (Figure 8a), mountainous areas in the northern parts appear to be the most exposed regions in Greece, with TN and RR being the most significant risks (Figure 7a). The plains areas in the mainland and Crete exhibit lower risk levels through a combination of TX and extreme winds. The coastal zones and the Aegean islands appear to lie at the lower risk level.
In the near future, the RCP4.5 scenario (Figure 8b) appears to demonstrate the smallest variability in the risk levels when compared to RCP8.5 (Figure 8c). The mountainous areas will be exposed to lower risk levels by a factor between 5 and 14% compared to present times, contrasting a similar increase due to TX in the lowlands and western Greece. These relative changes were determined to be statistically significant at the 95% confidence level using the student t-test. The southern parts of the Eastern Aegean islands and Crete will also experience increased level of hazards. For the RCP8.5 scenario, in the near future, a greater number of regions are projected to be exposed to higher levels of risk due to both higher TX values and stronger winds (Figure 8c). These appear to be located in the southern and the western parts of the mainland and the Aegean Sea. For the far future (Figure 8d,e), both scenarios will exhibit similar patterns of risk changes compared to the present period, although RCP8.5 will be associated with higher hazard risk, often exceeding a 5% increase. Plains, agricultural lands and islands will be especially exposed to increased risk.

4. Conclusions

The study presented here aimed to elucidate the highly dynamic changing patterns of climate risk in Greece, a European climate hot spot [62]. The findings highlighted the areas that are exposed to multiple climate hazards in the country, considering the influence of the highly complex topography. In addition, the generated multi-hazard risk maps could be used to support disaster-risk-prevention activities such as avoiding future human, natural and material losses and generating economic benefits by reducing climate-related risks. The introduced method could be easily transferred to other geographical regions provided that the climate simulations are available. In addition, based on the perceived risk values or values identified in national risk assessments, the likelihood categories of the hazards (Table 2) could be adjusted accordingly. It should be mentioned that a limitation in the approach emanates from the complex topography of a domain or parts of it. In such a case, it may be required to downscale the climate data to even higher than a 5 km resolution over the complex topography areas, where there is the need to study the occurrence of (multi-)hazard(s) in more detail and accuracy.
Overall, the analysis demonstrated that climate change is a highly non-stationary process and the exposed areas, risk level and dominant risk will be significantly changed in the future under both RCP4.5 and RCP8.5 scenarios. More particularly, the impact of global warming on the country will become more evident in the far future (end of the century) when the extreme maximum temperature will dominate all other hazards.
According to the RCP4.5 scenario, a gradual expansion of the extreme maximum temperature can be anticipated from the coastal regions to the higher altitude areas, and this trend will become more persistent towards the end of the century. Under the RCP8.5 scenario, the extreme wind speed was found to be the dominant hazard in the near future, while afterwards, near the end of the century, the extreme maximum temperature becomes the most significant hazard.

Author Contributions

Conceptualization, D.V. and A.S.; methodology, D.V. and A.S.; software, I.M., S.K. and N.P.; validation, A.S. and N.P.; formal analysis, D.V. and N.G.; investigation, D.V.; resources, D.V.; writing—original draft preparation, D.V.; writing—review and editing, A.S.; supervision, D.V. All authors have read and agreed to the published version of the manuscript.

Funding

This research received no external funding.

Institutional Review Board Statement

Not applicable.

Informed Consent Statement

Not applicable.

Data Availability Statement

Data used in this study can be obtained by request to the authors.

Acknowledgments

This work was supported by computational time granted from the Greek Research & Technology Network (GRNET) in the National HPC facility—ARIS—under project ID HRCOG (pr004020 and pr006028).

Conflicts of Interest

The authors declare no conflict of interest.

References

  1. IPCC; Masson-Delmotte, V.; Zhai, P.; Pirani, A.; Connors, S.L.; Péan, C.; Berger, S.; Caud, N.; Chen, Y.; Goldfarb, L.; et al. Climate Change 2021: The Physical Science Basis. Contribution of Working Group I to the Sixth Assessment Report of the Intergovernmental Panel on Climate Change; Cambridge University Press: Geneva, Switzerland, 2021; Available online: https://www.ipcc.ch/report/ar6/wg1/ (accessed on 1 December 2021).
  2. Fischer, E.M.; Sippel, S.; Knutti, R. Increasing probability of record-shattering climate extremes. Nat. Clim. Chang. 2021, 11, 689–695. [Google Scholar] [CrossRef]
  3. Guerreiro, S.B.; Fowler, H.J.; Barbero, R.; Westra, S.; Lenderink, G.; Blenkinsop, S.; Lewis, E.; Li, X.F. Detection of continental-scale intensification of hourly rainfall extremes. Nat. Clim. Chang. 2018, 8, 803–807. [Google Scholar] [CrossRef]
  4. WMO Climate and Weather Related Disasters Surge Five-Fold over 50 Years, but Early Warnings Save Lives. Available online: https://news.un.org/en/story/2021/09/1098662 (accessed on 30 September 2021).
  5. NOAA National Centers for Environmental Information (NCEI) Billion-Dollar Weather and Climate Disasters: FAQ|National Centers for Environmental Information (NCEI). Available online: https://www.ncdc.noaa.gov/billions/ (accessed on 30 September 2021).
  6. European Environment Agency Economic Losses from Climate-Related Extremes in Europe. Available online: https://www.eea.europa.eu/data-and-maps/indicators/direct-losses-from-weather-disasters-4/assessment (accessed on 30 September 2021).
  7. Gampe, D.; Zscheischler, J.; Reichstein, M.; O’Sullivan, M.; Smith, W.K.; Sitch, S.; Buermann, W. Increasing impact of warm droughts on northern ecosystem productivity over recent decades. Nat. Clim. Chang. 2021, 11, 772–779. [Google Scholar] [CrossRef]
  8. van Vliet, M.T.H.; van Beek, L.P.H.; Eisner, S.; Flörke, M.; Wada, Y.; Bierkens, M.F.P. Multi-model assessment of global hydropower and cooling water discharge potential under climate change. Glob. Environ. Chang. 2016, 40, 156–170. [Google Scholar] [CrossRef]
  9. Schewe, J.; Gosling, S.N.; Reyer, C.; Zhao, F.; Ciais, P.; Elliott, J.; Francois, L.; Huber, V.; Lotze, H.K.; Seneviratne, S.I.; et al. State-of-the-art global models underestimate impacts from climate extremes. Nat. Commun. 2019, 10, 1005. [Google Scholar] [CrossRef] [Green Version]
  10. Monier, E.; Paltsev, S.; Sokolov, A.; Chen, Y.-H.H.; Gao, X.; Ejaz, Q.; Couzo, E.; Schlosser, C.A.; Dutkiewicz, S.; Fant, C.; et al. Toward a consistent modeling framework to assess multi-sectoral climate impacts. Nat. Commun. 2018, 9, 660. [Google Scholar] [CrossRef]
  11. Sillmann, J.; Sippel, S.; Russo, S. Climate Extremes and Their Implications for Impact and Risk Assessment; Elsevier: Amsterdam, The Netherlands, 2019; pp. 1–9. [Google Scholar] [CrossRef]
  12. Otto, F.E.L.; Van Oldenborgh, G.J.; Eden, J.; Stott, P.A.; Karoly, D.J.; Allen, M.R. The attribution question. Nat. Clim. Chang. 2016, 6, 813–816. [Google Scholar] [CrossRef]
  13. Hoegh-Guldberg, O.; Jacob, D.; Taylor, M.; Bindi, M.; Abdul Halim, S.; Achlatis Australia, M.; Alexander, L.V.; Allen, M.R.; Berry, P.; Boyer, C.; et al. Impacts of 1.5 °C global warming on natural and human systems. In Global Warming of 1.5 °C. An IPCC Special Report on the Impacts of Global Warming of 1.5 °C above Pre-Industrial Levels and Related Global Greenhouse Gas Emission Pathways, in the Context of Strengthening the Global Response to the Threat of Climate Change, Sustainable Development, and Efforts to Eradicate; IPCC Secretariat: Geneva, Switzerland, 2018; pp. 175–311. [Google Scholar]
  14. Lehmann, J.; Coumou, D.; Frieler, K. Increased record-breaking precipitation events under global warming. Clim. Change 2015, 132, 501–515. [Google Scholar] [CrossRef]
  15. Ribes, A.; Zwiers, F.W.; Azaïs, J.M.; Naveau, P. A new statistical approach to climate change detection and attribution. Clim. Dyn. 2017, 48, 367–386. [Google Scholar] [CrossRef]
  16. King, A.D. Attributing Changing Rates of Temperature Record Breaking to Anthropogenic Influences. Earth’s Futur. 2017, 5, 1156–1168. [Google Scholar] [CrossRef]
  17. Van Der Wiel, K.; Kapnick, S.B.; Jan Van Oldenborgh, G.; Whan, K.; Philip, S.; Vecchi, G.A.; Singh, R.K.; Arrighi, J.; Cullen, H. Rapid attribution of the August 2016 flood-inducing extreme precipitation in south Louisiana to climate change. Hydrol. Earth Syst. Sci. 2017, 21, 897–921. [Google Scholar] [CrossRef] [Green Version]
  18. Diffenbaugh, N.S.; Singh, D.; Mankin, J.S.; Horton, D.E.; Swain, D.L.; Touma, D.; Charland, A.; Liu, Y.; Haugen, M.; Tsiang, M.; et al. Quantifying the influence of global warming on unprecedented extreme climate events. Proc. Natl. Acad. Sci. USA 2017, 114, 4881–4886. [Google Scholar] [CrossRef] [PubMed] [Green Version]
  19. Marsooli, R.; Lin, N.; Emanuel, K.; Feng, K. Climate change exacerbates hurricane flood hazards along US Atlantic and Gulf Coasts in spatially varying patterns. Nat. Commun. 2019, 10, 3785. [Google Scholar] [CrossRef] [PubMed] [Green Version]
  20. Ali, H.; Modi, P.; Mishra, V. Increased flood risk in Indian sub-continent under the warming climate. Weather Clim. Extrem. 2019, 25, 100212. [Google Scholar] [CrossRef]
  21. Coogan, S.C.P.; Robinne, F.N.; Jain, P.; Flannigan, M.D. Scientists’ warning on wildfire—A canadian perspective. Can. J. For. Res. 2019, 49, 1015–1023. [Google Scholar] [CrossRef] [Green Version]
  22. Mezősi, G.; Bata, T.; Meyer, B.C.; Blanka, V.; Ladányi, Z. Climate Change Impacts on Environmental Hazards on the Great Hungarian Plain, Carpathian Basin. Int. J. Disaster Risk Sci. 2014, 5, 136–146. [Google Scholar] [CrossRef] [Green Version]
  23. Cook, B.I.; Mankin, J.S.; Anchukaitis, K.J. Climate Change and Drought: From Past to Future. Curr. Clim. Chang. Rep. 2018, 4, 164–179. [Google Scholar] [CrossRef]
  24. Pereira, S.C.; Carvalho, D.; Rocha, A. Temperature and Precipitation Extremes over the Iberian Peninsula under Climate Change Scenarios: A Review. Climate 2021, 9, 139. [Google Scholar] [CrossRef]
  25. Savi, S.; Comiti, F.; Strecker, M.R. Pronounced increase in slope instability linked to global warming: A case study from the eastern European Alps. Earth Surf. Processes Landf. 2021, 46. [Google Scholar] [CrossRef]
  26. Tijdeman, E.; Hannaford, J.; Stahl, K. Human influences on streamflow drought characteristics in England and Wales. Hydrol. Earth Syst. Sci. 2018, 22, 1051–1064. [Google Scholar] [CrossRef] [Green Version]
  27. Cammalleri, C.; Naumann, G.; Mentaschi, L.; Bisselink, B.; Gelati, E.; De Roo, A.; Feyen, L. Diverging hydrological drought traits over Europe with global warming. Hydrol. Earth Syst. Sci. 2020, 24, 5919–5935. [Google Scholar] [CrossRef]
  28. Sieck, K.; Nam, C.; Bouwer, L.M.; Rechid, D.; Jacob, D. Weather extremes over Europe under 1.5 and 2.0 °C global warming from HAPPI regional climate ensemble simulations. Earth Syst. Dyn. 2021, 12, 457–468. [Google Scholar] [CrossRef]
  29. Suarez-Gutierrez, L.; Li, C.; Müller, W.A.; Marotzke, J. Internal variability in European summer temperatures at 1.5 °C and 2 °C of global warming. Environ. Res. Lett. 2018, 13, 064026. [Google Scholar] [CrossRef] [Green Version]
  30. Forzieri, G.; Bianchi, A.; Silva, F.B.; Marin Herrera, M.A.; Leblois, A.; Lavalle, C.; Aerts, J.C.J.H.; Feyen, L. Escalating impacts of climate extremes on critical infrastructures in Europe. Glob. Environ. Chang. 2018, 48, 97–107. [Google Scholar] [CrossRef]
  31. Feyen, L.; Ciascar, J.; Gosling, S.; Ibarreta, D.; Soria, A.; Dosio, A.; Naumann, G.; Russo, S.; Formetta, G.; Forzieri, G.; et al. JRC Science for Policy Report; Joint Research Centre: Petten, The Netherlands, 2020. [Google Scholar]
  32. The United Nations Office for Disaster Risk Reduction Proposed Updated Terminology on Disaster Risk Reduction: A Technical Review. Available online: http://www.unisdr.org/we/inform/terminology (accessed on 8 October 2021).
  33. EUR 30596 EN. JRC Recommendations for National Risk Assessment for Disaster Risk Management in EU: Where Science and Policy Meet; Publications Office of the European Union: Luxembourg, 2021; Version 1; p. 273. Available online: https://data.europa.eu/doi/10.2760/43449 (accessed on 1 December 2021).
  34. Kappes, M.S.; Keiler, M.; von Elverfeldt, K.; Glade, T. Challenges of analyzing multi-hazard risk: A review. Nat. Hazards 2012, 64, 1925–1958. [Google Scholar] [CrossRef] [Green Version]
  35. Tilloy, A.; Malamud, B.D.; Winter, H.; Joly-Laugel, A. A review of quantification methodologies for multi-hazard interrelationships. Earth-Science Rev. 2019, 196, 102881. [Google Scholar] [CrossRef]
  36. Gallina, V.; Torresan, S.; Critto, A.; Sperotto, A.; Glade, T.; Marcomini, A. A review of multi-risk methodologies for natural hazards: Consequences and challenges for a climate change impact assessment. J. Environ. Manag. 2016, 168, 123–132. [Google Scholar] [CrossRef]
  37. Sperotto, A.; Molina, J.L.; Torresan, S.; Critto, A.; Marcomini, A. Reviewing Bayesian Networks potentials for climate change impacts assessment and management: A multi-risk perspective. J. Environ. Manag. 2017, 202, 320–331. [Google Scholar] [CrossRef]
  38. Skamarock, W.C.; Skamarock, W.C.; Klemp, J.B.; Dudhia, J.; Gill, D.O.; Barker, D.M.; Wang, W.; Powers, J.G. A Description of the Advanced Research WRF Version 3. NCAR Technical Note -475+STR; University Corporation for Atmospheric Research: Boulder, CO, USA, 2008. [Google Scholar]
  39. Doblas Reyes, F.; Acosta Navarro, J.C.; Acosta Cobos, M.C.; Bellprat, O.; Bilbao, R.; Castrillo Melguizo, M.; Fuckar, N.; Guemas, V.; Lledó Ponsati, L.; Menegoz, M. Using EC-Earth for Climate Prediction Research; European Centre for Medium-Range Weather Forecasts (ECMWF): Reading, UK, 2018; Volume 154, pp. 35–40. [Google Scholar]
  40. Kc, B.; Shepherd, J.M.; King, A.W.; Johnson Gaither, C. Multi-hazard climate risk projections for the United States. Nat. Hazards 2021, 105, 1963–1976. [Google Scholar] [CrossRef]
  41. Jay, A.D.R.; Reidmiller, C.W.; Avery, D.; Barrie, B.J.; DeAngelo, A.; Dave, M.; Dzaugis, M.; Kolian, K.L.M.; Lewis, K.; Reeves, D. Winner, Overview. In Impacts, Risks, and Adaptation in the United States: Fourth National Climate Assessment, Volume II; Reidmiller, D.R., Avery, C.W., Easterling, D.R., Kunkel, K.E., Lewis, K.L.M., Maycock, T.K., Stewart, B.C., Eds.; U.S. Global Change Research Program: Washington, DC, USA, 2018; pp. 33–71. [Google Scholar] [CrossRef]
  42. Lhotka, O.; Kyselý, J.; Plavcová, E. Evaluation of major heat waves’ mechanisms in EURO-CORDEX RCMs over Central Europe. Clim. Dyn. 2018, 50, 4149–4262. [Google Scholar] [CrossRef]
  43. Cardoso, R.M.; Soares, P.M.M.; Lima, D.C.A.; Miranda, P.M.A. Mean and extreme temperatures in a warming climate: EURO CORDEX and WRF regional climate high-resolution projections for Portugal. Clim. Dyn. 2019, 52, 129–157. [Google Scholar] [CrossRef]
  44. Tian, L.; Jin, J.; Wu, P.; Niu, G.Y.; Zhao, C. High-resolution simulations of mean and extreme precipitation with WRF for the soil-erosive Loess Plateau. Clim. Dyn. 2020, 54, 3489–3506. [Google Scholar] [CrossRef]
  45. Katopodis, T.; Markantonis, I.; Vlachogiannis, D.; Politi, N.; Sfetsos, A. Assessing climate change impacts on wind characteristics in Greece through high-resolution regional climate modelling. Renew. Energy 2021, 179, 427–444. [Google Scholar] [CrossRef]
  46. UNDRR International Science Council Sendai. Hazard Definition & Classification Review: Technical Report; UNDRR: Panama City, Panama, 2020. [Google Scholar]
  47. Politi, N.; Vlachogiannis, D.; Sfetsos, A.; Nastos, P.T. High-resolution dynamical downscaling of ERA-Interim temperature and precipitation using WRF model for Greece. Clim. Dyn. 2021, 57, 1–27. [Google Scholar] [CrossRef]
  48. Politi, N.; Sfetsos, A.; Vlachogiannis, D.; Nastos, P.T.; Karozis, S. A sensitivity study of high-resolution climate simulations for Greece. Climate 2020, 8, 44. [Google Scholar] [CrossRef] [Green Version]
  49. Politi, N.; Nastos, P.T.; Sfetsos, A.; Vlachogiannis, D.; Dalezios, N.R. Evaluation of the AWR-WRF model configuration at high-resolution over the domain of Greece. Atmos. Res. 2018, 208, 229–245. [Google Scholar] [CrossRef]
  50. Katopodis, T.; Markantonis, I.; Politi, N.; Vlachogiannis, D.; Sfetsos, A. High-resolution solar climate atlas for greece under climate change using the weather research and forecasting (WRF) model. Atmosphere 2020, 11, 761. [Google Scholar] [CrossRef]
  51. Habermann Nadine; Thanasis Sfetsos; Ralh Hedel; Albert Chen EU-CIRCLE, Report on Climate Related Critical Event Parameters: Deliverable 3.2. Available online: https://www.eu-circle.eu/wp-content/uploads/2018/10/D3.2.pdf (accessed on 8 November 2021).
  52. Gilleland, E.; Katz, R.W. New software to analyze how extremes change over time. Eos Trans. Am. Geophys. Union 2011, 92, 13–14. [Google Scholar] [CrossRef]
  53. Cooley, D. Return periods and return levels under climate change. In Extremes in a Changing Climate; Springer: Berlin/Heidelberg, Germany, 2013; pp. 97–114. [Google Scholar]
  54. Hellenic Meteorological Service Climate Atlas of Greece, 1971–2000. Available online: http://climatlas.hnms.gr/sdi/ (accessed on 18 November 2021).
  55. Katopodis, T.; Vlachogiannis, D.; Politi, N.; Gounaris, N.; Karozis, S.; Sfetsos, A. Assessment of climate change impacts on wind resource characteristics and the wind energy potential in Greece. J. Renew. Sustain. Energy 2019, 11, 066502. [Google Scholar] [CrossRef]
  56. Karozis, S.; Sfetsos, A.; Gounaris, N.; Vlachogiannis, D. An assessment of climate change impact on air masses arriving in Athens, Greece. Theor. Appl. Climatol. 2021, 145, 501–517. [Google Scholar] [CrossRef]
  57. Dafka, S.; Toreti, A.; Zanis, P.; Xoplaki, E.; Luterbacher, J. Twenty-First-Century Changes in the Eastern Mediterranean Etesians and Associated Midlatitude Atmospheric Circulation. J. Geophys. Res. Atmos. 2019, 124, 12741–12754. [Google Scholar] [CrossRef] [Green Version]
  58. Harvey, B.J.; Shaffrey, L.C.; Woollings, T.J. Deconstructing the climate change response of the Northern Hemisphere wintertime storm tracks. Clim. Dyn. 2015, 45, 2847–2860. [Google Scholar] [CrossRef]
  59. Russo, S.; Dosio, A.; Graversen, R.G.; Sillmann, J.; Carrao, H.; Dunbar, M.B.; Singleton, A.; Montagna, P.; Barbola, P.; Vogt, J.V.; et al. Magnitude of extreme heat waves in present climate and their projection in a warming world. J. Geophys. Res. Atmos. 2014, 119, 12500–12512. [Google Scholar] [CrossRef] [Green Version]
  60. Coumou, D.; Di Capua, G.; Vavrus, S.; Wang, L.; Wang, S. The influence of Arctic amplification on mid-latitude summer circulation. Nat. Commun. 2018, 9, 2959. [Google Scholar] [CrossRef] [Green Version]
  61. Chang, E.K.M.; Ma, C.G.; Zheng, C.; Yau, A.M.W. Observed and projected decrease in Northern Hemisphere extratropical cyclone activity in summer and its impacts on maximum temperature. Geophys. Res. Lett. 2016, 43, 2200–2208. [Google Scholar] [CrossRef] [Green Version]
  62. Cos, J.; Doblas-Reyes, F.; Jury, M.; Marcos, R.; Bretonnière, P.-A.; Samsó, M. The Mediterranean climate change hotspot in the CMIP5 and CMIP6 projections. Earth Syst. Dyn. Discuss. 2021, 1–26. [Google Scholar] [CrossRef]
Figure 1. Schematic representation of the main methodological steps for determining a quantified climatic multi-hazard assessment.
Applsci 12 01218 g001
Figure 2. (a) EC–Earth–WRF topography of the simulated domain of Greece with horizontal resolution (5 × 5 km2). (b) Highlighted regions of the country of particular interest for discussion.
Applsci 12 01218 g002
Figure 3. (a) Spatial distribution of probability of TX exceedance above 35 °C calculated using EC–Earth–WRF downscaled data for the historical summer period 1980–2004. Differences (future–historical) in the probability of TX exceedance for: (b) RCP4.5 in near future (2025–2049), (c) RCP8.5 in near future (2025–2049), (d) RCP4.5 in far future (2075–2099) and (e) RCP8.5 in far future (2075–2099).
Applsci 12 01218 g003
Figure 4. (a) Spatial distribution of probability of TN exceedance below −5 °C calculated using EC–Earth–WRF downscaled data for the historical winter period 1980–2004. Differences (future–historical) in the probability of TN exceedance for: (b) RCP4.5 in near future (2025–2049), (c) RCP8.5 in near future (2025–2049), (d) RCP4.5 in far future (2075–2099) and (e) RCP8.5 in far future (2075–2099).
Applsci 12 01218 g004
Figure 5. (a) Spatial distribution of probability of RR exceedance above 10 mm/h calculated using EC–Earth–WRF downscaled data for the historical period 1980–2004. Differences (future–historical) in the probability of RR exceedance for: (b) RCP4.5 in near future (2025–2049), (c) RCP8.5 in near future (2025–2049), (d) RCP4.5 in far future (2075–2099) and (e) RCP8.5 in far future (2075–2099).
Applsci 12 01218 g005
Figure 6. (a) Spatial distribution of probability of wind speed exceedance over the threshold (15 m/s) calculated using EC–Earth–WRF downscaled data for the historical period 1980–2004. Differences (future–historical) in the probability of wind speed exceedance for: (b) RCP4.5 in near future (2025–2049), (c) RCP8.5 in near future (2025–2049), (d) RCP4.5 in far future (2075–2099) and (e) RCP8.5 in far future (2075–2099).
Applsci 12 01218 g006
Figure 7. Dominant-hazard maps using EC–Earth–WRF downscaled data for: (a) the historical period 1980–2004, (b) RCP4.5 in near future (2025–2049), (c) RCP8.5 in near future (2025–2049), (d) RCP4.5 in far future (2075–2099) and (e) RCP8.5 in far future (2075–2099).
Applsci 12 01218 g007
Figure 8. Annual percentage of multi-hazard using EC–Earth–WRF downscaled data for: (a) the historical period 1980–2004, (b) RCP4.5 in near future (2025–2049), (c) RCP8.5 in near future (2025–2049), (d) RCP4.5 in far future (2075–2099) and (e) RCP8.5 in far future (2075–2099).
Applsci 12 01218 g008
Table 1. The global (EC–Earth) model datasets downscaled by WRF model used in the study and corresponding periods.
DatasetPeriod
EC–EARTH–WRF1980–2004 (historical)
EC–EARTH–WRF RCP4.52025–2049 (near future)
EC–EARTH–WRF RCP8.52025–2049 (near future)
EC–EARTH–WRF RCP4.52075–2099 (far future)
EC–EARTH–WRF RCP8.52075–2099 (far future)
Table 2. Likelihood categories and threshold values for maximum and minimum temperature, maximum precipitation rate, maximum snow rate and maximum wind speed. In bold, the threshold values to which the probability of occurrence was applied in the current study.
VariablesLikelihood Categories
Very Low LowMediumHighVery HighExceptional
Daily Minimum Temperature [°C]0<0–(−2)(−2)–(−5)(−5)–(−10)(−10)–(−15)<(−15)
Daily Maximum Temperature [°C]<3030–3333–3535–3939–42>42
Daily Maximum Precipitation rate [mm/h]<2.52.5–7.67.6–10.010–5050–100>100
Daily Maximum Snowfall [mm/h]<2.52.5–12.712.7–25.425.4–76.276.2–127>127
Daily Maximum wind speed value [m/s]0–33–1212–1515–2020–30>30
Publisher’s Note: MDPI stays neutral with regard to jurisdictional claims in published maps and institutional affiliations.

