Abstract
The 2021 Mw 7.3 Maduo earthquake is one of the largest seismic events that has occurred in and around the Bayan Har block of Tibet. D-InSAR results and field surveys indicate that this earthquake resulted in more than 160 km of coseismic surface rupture along pre-existing fault traces. Based on the branching of the surface rupture, the fault of the Maduo earthquake can be roughly divided into four sections. Through detailed drone mapping, the fracture pattern and offset of the fault were counted and measured. The development of the peaty meadow layer on the ground determines the different combination modes of the fractures. The horizontal offset observed on the surface of this earthquake is generally less than 2 m and the vertical offset is less than 1 m, and the fault shows a primarily left-lateral strike-slip movement. In the desert-covered areas, there are long gaps between continuous rupture.
1. Introduction
The largest Chinese earthquake, the Mw 7.3 Maduo earthquake, occurred in Qinghai province on 21 May 2021 since the 2008 Mw 7.9 Wenchuan earthquake (https://earthquake.usgs.gov/earthquakes/eventpage/us7000e54r/executive, accessed on 13 December 2022). Due to the high altitude and sparse population of the earthquake epicenter location, only nineteen people were injured in the earthquake (https://baijiahao.baidu.com/s?id=1700968751236066246&wfr=spider&for=pc, accessed on 13 December 2022). However, the earthquake resulted in serious damage to local buildings and infrastructure. Due to significant ground shaking, both the Yematan Bridge on the Yugong Expressway and the Changmahe Bridge on the Huajiu Expressway collapsed entirely (https://baijiahao.baidu.com/s?id=1700904896415512958&wfr=spider&for=pc, accessed on 13 December 2022; Figure S1).
Some studies have gained insight into the nature of this earthquake by performing geophysical inversions using the data recorded on seismometers and on GPS (global positioning system) instruments located near the earthquake epicenter, and satellite images collected both before and after the earthquake through differential interferometric synthetic aperture radar (D-InSAR) [1,2,3]. In particular, the results of D-InSAR can reflect the extension length and bifurcation of the fault on the surface, allowing for us to quickly and directly determine the impact range of the earthquake. However, due to the limited resolutions and the inconsistency between geophysical model parameters and actual geological conditions, the geophysical methods cannot completely and accurately define the distribution and offset of the coseismic surface rupture—direct observations immediately after the earthquake provide useful constraints of the rupture pattern and offset that complement the existing geophysical results.
In the past, the field investigation of surface rupture mainly relied on the eye field of the investigator. Due to the limited height, it is difficult to grasp comprehensively the rupture pattern and landform characteristics of earthquakes. With the rapid development of drone technology, it provides high-resolution and low-cost means for field observation. Through three-dimensional (3D) software, the digital elevation model (DEM), orthophoto image and 3D model of the ground surface can be obtained by processing the data collected by the drone on the site. This provides a rich database for the study of surface fracture, from which the surface fracture pattern and the displacement can be measured.
In this study, D-InSAR was conducted to obtain the whole distribution of coseismic surface rupture. After knowing the specific location of possible rupture derived from D-InSAR, the field survey was carried out with a high-precision mapping drone, and the surface rupture data were gathered at the main rupture sites. Using the high-precision and high-resolution landform and orthophoto images obtained after data processing, the fracture combination and offset of the fault were measured. A combination of the two methods provided a scientific basis for a comprehensive understanding of the surface rupture.
2. Tectonic Setting
The Tibetan Plateau, which was created by the collision between the Eurasian plate and the Indian plate, can be divided into smaller tectonic blocks that are bound by several major strike-slip faults. The Maduo earthquake occurred in the Bayan Har Block (Figure 1), which is the most active block in Tibet. In this century, some major earthquakes have happened on the faults surrounding the Bayan Har Block [4,5,6,7,8,9,10]. Historical seismic records show that strong (magnitude M ≥ 6.0) earthquakes have mostly occurred at the edge of the block and that very few large earthquakes have occurred inside the block since 1900 (Figure 1).
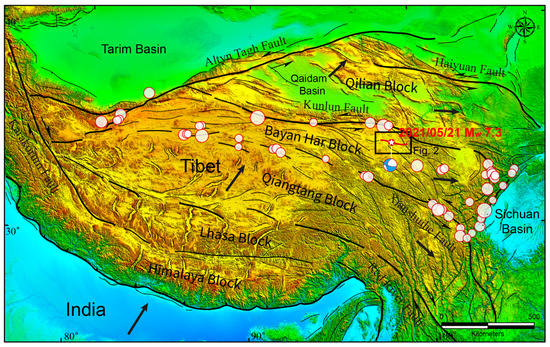
Figure 1.
Active faults map of Tibet. Large fault zones (thick black lines) divide Tibet into several blocks. The red line represents the surface rupture, and the white star is the earthquake epicenter of the 2021 Maduo earthquake. The red circles represent the locations of historical (from 1900 to the present) earthquakes in the Bayan Har block with magnitudes greater than or equal to M 6.0. Larger circles correspond to higher earthquake magnitudes. The black arrows show the relative movement of blocks.
The Bayan Har block is surrounded by the Xianshuihe fault in the south, the Kunlun fault in the north, NE-striking faults to the west, and SE-striking faults to the east. Animaqing Mountain is located on the eastern part of the Kunlun fault; the elongated geometry and anomalously high topography of the mountain are the result of tectonic compression and uplift along the restraining bends of the Kunlun fault. The primary seismogenic fault of the Maduo earthquake, which extends out from the western segment of the Kunlun fault and is located on the western side of Animaqing Mountain, has a strike of about 105° [11,12]. This fault is oriented roughly parallel to the strike of the central segment of the Kunlun fault and obliquely intersects the faults surrounding Animaqing Mountain (Figure 1).
3. Materials and Methods
3.1. D-InSAR
In this survey, the ascending SAR data from Sentinel-1 satellite were collected in relation to differential interference to show the trace of surface rupture caused by the Maduo earthquake. The pre-seismic data were acquired on 20 May 2021, and post-seismic data were taken on 26 May 2021. The resolution of SAR is 3 × 22 m.
The two-pass differential interferometry method was used to deal with the SAR data. The free single look complex (SLC) and precision orbit data were downloaded from the website of the European Space Agency (ESA, https://scihub.copernicus.eu/dhus/#/home, accessed on 13 December 2022) and the space shuttle radar terrain mission (SRTM) data from the National Aeronautics and Space Administration (NASA, https://search.earthdata.nasa.gov/, accessed on 13 December 2022). The master and slave images were co-registered by the same points on the surface. Then, the interferogram was formed using inputting data, and the coherence graph was generated after Goldstein phase filtering. After the topographic phase removal, the next step was to use the minimum cost flow (MCF) algorithm for phase unwrapping, then orbit refinement and re-flattening. Finally, a displacement map along LOS was generated by the phase to displacement conversion and geocoding (Figure 2) [13,14,15,16].
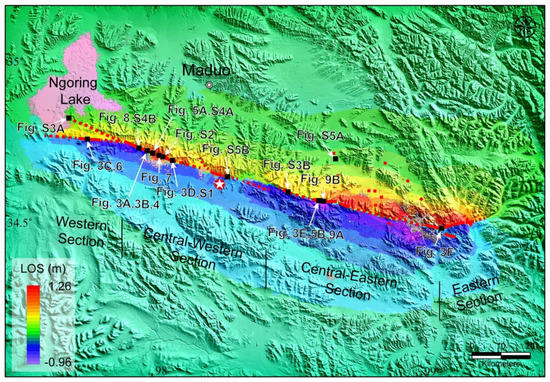
Figure 2.
A map of D-InSAR LOS coseismic deformation and sites investigated during the field survey with the locations of the corresponding figures of the paper. The dotted red lines indicate discontinuous rupturing of fault traces, and the solid red lines indicate continuous surface rupture. The color shading represents the amount of LOS coseismic deformation, and its values were obtained by analyzing D-InSAR data collected from the ascending orbit of the Sentinel-1 satellite.
3.2. Drone Mapping
Two field surveys were conducted in the first and third month after the Maduo earthquake, when the surface rupture was still fresh. A DJI Phantom 4 RTK (real time kinematic) drone was used to map the rupture. The RTK horizontal positioning accuracy of the drone was 1 cm + 1 ppm, and the vertical positioning accuracy was 1.5 cm + 1 ppm. The sensor was a 1 inch 20 megapixel CMOS, and the ground resolution of the drone can reach 2.74 cm at a 100 m flight altitude (https://3dinsider.com/dji-phantom-4-rtk-review/; https://www.dji.com/cn/phantom-4-rtk, accessed on 13 December 2022).
With the GS RTK app, entering the coordinates of the four points of the rectangle, a route that followed the rupture was pre-programmed. At the main surface rupture site, the drone was flown in sections along the fault strike. The height of each flight was 25–100 m, the length was 200–500 m, and the width was 100–200 m. The front overlap and side overlap were set to 80%. The ground resolution of the drone was 1–3 cm.
Once the drone captured the digital images, the data were imported into a workstation with a DJI processing system. By automatically recognizing the relative position and direction of each photo, aerial triangulation was calculated. 2D and 3D reconstructions were performed using the generated point cloud data. Finally, DEMs, orthophotos, and 3D models were generated (Figure 3, Figure 4, Figure 5, Figure 6, Figure 7, Figure 8, Figure 9 and Figure S1A).
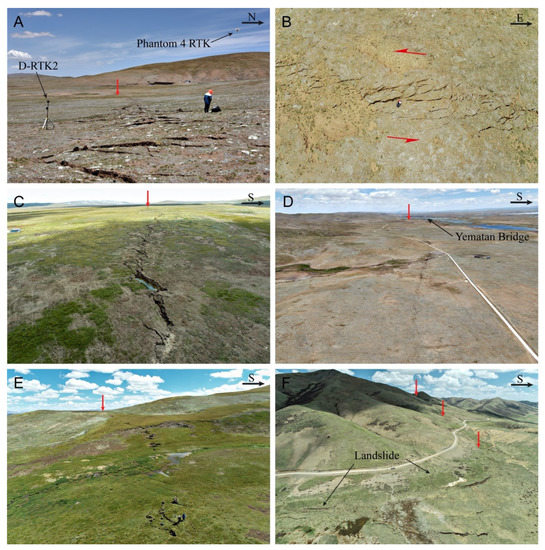
Figure 3.
(A) Field operation of drone. (B–F) Coseismic surface rupture observed from the air. The red arrows point to the extension direction of the rupture. In (D), the collapsed Yematan Bridge is visible in the distance. In (F), landslides were caused on the slopes where the fault passed.
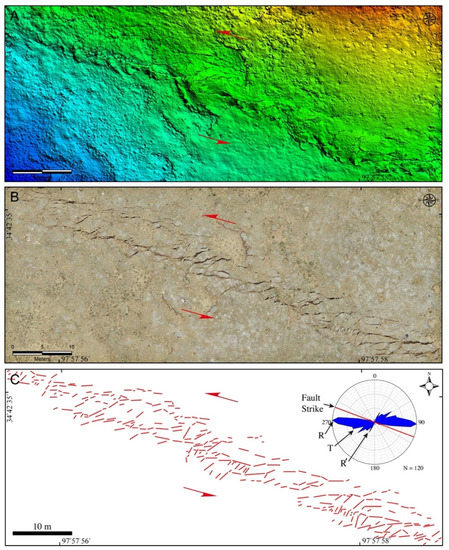
Figure 4.
Drone data processing results and fracture distribution statistics. (A) DEM of the surface rupture. (B) Orthophoto of the area shown in panel (A). (C) Fracture distribution and rose diagram, R shears, R′ shears, and T fractures are major fractures.
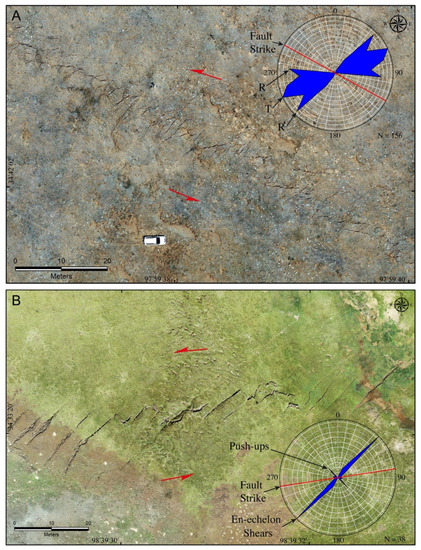
Figure 5.
Orthophotos of the surface rupture and fracture distribution statistics. (A) R shears, R′ shears, and T fractures are major fractures. (B) En-echelon shears and push-ups are major structures.
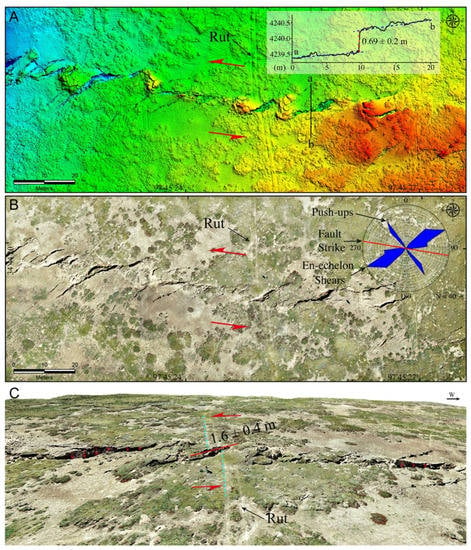
Figure 6.
Offsets and fracture distribution statistics. (A) DEM of the surface rupture. South side of the fault was uplifted, and the vertical offset is 0.69 m. (B) Orthophoto of the area shown in panel (A). En-echelon shears and push-ups are major structures. (C) 3D visualization of the surface rupture. The offset along the shear strike is 1.6 m, the included angle θ between shear strike and fault strike is 37°, then the offset along the fault strike equals to 1.6/cos (37°), which is about 2 ± 0.4 m.
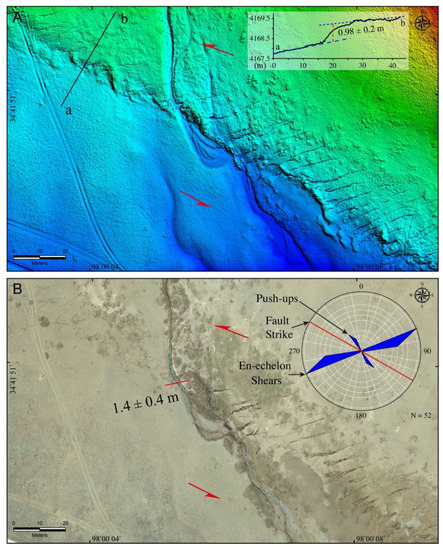
Figure 7.
(A) DEM and (B) orthophoto of a fault scarp that ruptured during the earthquake. The height of the scarp is about 1 m in (A). En-echelon shears and push-ups are major structures. A gully is visibly displaced. The offset along the shear strike is 1.4 m, the included angle θ between shear strike and fault strike is 40°, then the offset along the fault strike equals to 1.4/cos(40°), which is about 1.8 ± 0.4 m.
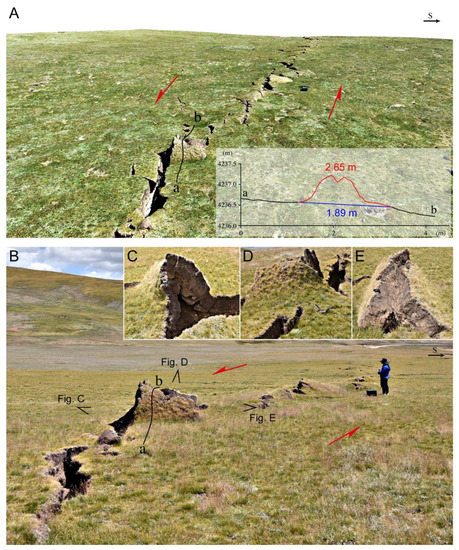
Figure 8.
Push-up structures in the surface rupture. (A) 3D visualization image and measured profile of one push-up structure with a shortening of 0.76 m. θ is 30°, and the offset along the fault strike is 0.88 ± 0.2 m. (B) Field photo of the push-up. Panels (C–E) all represent different views on the uplifted feature shown in the middle of panel (B).
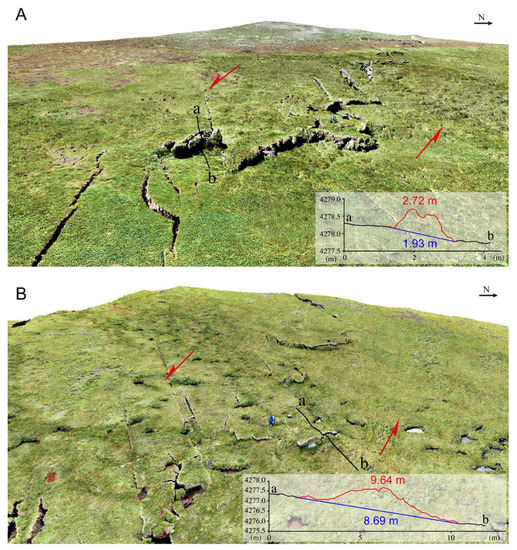
Figure 9.
3D visualization and measured profiles of push-up structures in the central-eastern section of the rupture with shortening values of (A) 0.79 m. θ is 52°, and the offset along the fault strike is 1.28 ± 0.2 m. and (B) 0.95 m. θ is 44°, and the offset along the fault strike is 1.32 ± 0.2 m.
4. Results
4.1. Coseismic Surface Rupture
The surface deformation map shows that the main area impacted by the Maduo earthquake is about 60 × 180 km. The rupture zone presents a linear distribution in the SEE direction, and the fault strike becomes smaller at the west and east ends. The rupture is consistent with the preexisting tectonic landform, and mainly passes through the mountain front, indicating that there is a fault with repeated activities. The largest deformation is mainly concentrated on the east of the fault. The maximum displacement is about -1.0 m in the south side and 1.3 m in the north side of the fault (Figure 2).
In the field survey, continuous rupture traces with lengths that range from several hundreds of meters to several kilometers were observed. Meanwhile, only a few cracks were found in some areas.
Based on the branching of the fault strike, the surface rupture of the Maduo earthquake can be roughly divided into four sections.
The western section is composed of two faults. The north branch, which has a strike of 109°, consists of intermittent small fractures, which are several meters long and cannot measure the offset (Figure 2 and Figure S2A). The south branch, which has a strike of 96°, consists of a fault section that is 28 km long and exhibits a more significant surface rupture.
The western central fault section strikes 109° and has a length of ~50 km. This section includes the most continuous fault rupture.
The eastern central fault section strikes 105° and has a length of ~57 km. The rupture of this section is highly discontinuous and intermittent (Figure 2 and Figure S2B); only ~2 km rupture in this section is uninterrupted (Figure 2).
The eastern section of the fault splits into two branches of rupture. One rupture has a strike of 77° and a length of ~26 km, and another rupture strikes southeast (Figure 2).
4.2. Simple Shear Fractures
The strike-slip fault is mainly characterized by simple shear on the surface, which produces various fractures arranged in en-echelon in a narrow area. Five groups of simple shear fractures and a push-up structure were found in laboratory and field observations of surface rupture [17,18,19].
On the orthophoto, the fracture strike was measured one by one and projected onto the rose diagram (Figure 4, Figure 5, Figure 6 and Figure 7). Through comparison, two different distribution types can be obtained.
One type is that R shears, R′ shears, and T fractures are major fractures (Figure 4 and Figure 5A). On the image, the fracture distribution is disordered, and there are few or no push-ups. There is an angular difference of 20–30° between the orientations of the R shears and the principal displacement zone, an angular difference of 40–60° between the principal displacement zone and the orientations of the T fractures, and an angular difference of 70–80° between the orientations of the R′ shears and the principal displacement zone.
Another type is that en-echelon shears and push-ups are major structures (Figure 5B, Figure 6 and Figure 7). On the image, the fractures are evenly distributed. Individual fractures are several meters to several tens of meters long and exhibit a right-stepping en-echelon shear configuration (Figure 5 and Figure 6). There is an angular difference of 30–50° between the orientations of the en-echelon shears and the principal displacement zone, and en-echelon shears and push-ups intersect vertically.
4.3. Fault Offset
From the data results of the drone, it can be found that some ruts, gullies, and other geographical features were displaced by fault (i.e., horizontal or vertical displacement) along the rupture zone (Figure 6 and Figure 7). These natural and artificial markers indicate that the Maduo earthquake resulted in a primarily left-lateral strike-slip motion (Figure S3). On orthophotos, the distance between the two ends of the broken mark along the shear fracture direction was measured with the measuring tool in GIS software, and the fault offset ranges from tens of centimeters to more than one meter (Figure 6 and Figure 7; Table S1).
Because only a few faulted markers were directly observed in the orthophoto, some indirect markers were measured to accurately quantify the offset of the entire rupture zone. When the en-echelon shears and push-up structures were well developed within the meadow layer, by treating the push-ups as shortening structures, the compression and the amount of lateral displacement that occurred along the fault can be inferenced (Figure 8 and Figure 9). The shortening was used as a proxy for the strike-slip fault offset; the shortening is calculated by subtracting the width of the push-up envelope from its length [20]. In practice, DEM and 3D models generated from drone data were used as baseline data. Profile data that are oriented parallel to the rupture were produced when push-ups were found in the image. After rendering the profile data with computer-aided design (CAD) software, both the length and width of the push-up were measured and the fault shortening in that particular area was calculated. Results show that the displacement shortening along the fault is on the order of tens of centimeters to about a meter (Figure 8 and Figure 9).
Since the above-measured offsets are all along the shear strike or perpendicular to the compression direction, the offset along the strike of the fault is equal to the measured offset divided by the cosine value of the included angle θ between the shear strike and fault strike, or between the perpendicular direction of the push-up and fault strike [21]. The final result shows that the maximum horizontal displacement is about 2 m, which appears in the middle of the western section (Figure 10, Table S1).
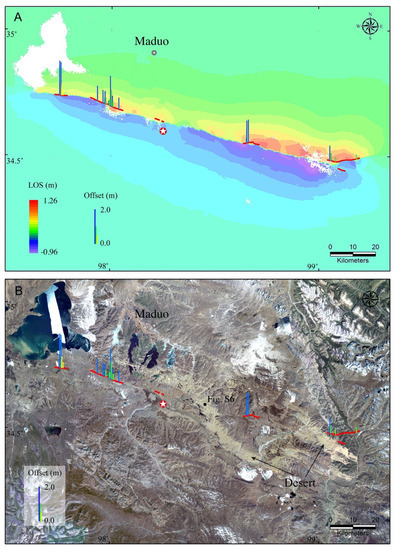
Figure 10.
Offsets and main continuous surface fracture projected onto the (A) D-InSAR result and (B) satellite image. The blue bar represents the horizontal displacement. Green and yellow bars represent the vertical displacement, yellow represents the uplift of the south wall, and green represents the uplift of the north wall. The red lines indicate continuous surface fracture and deserts are distributed in the large surface rupture discontinuities.
The vertical offset was measured directly by cutting the section in the direction perpendicular to the fault strike on the DEM data (Figure 6A and Figure 7A). In general, only on the south branch of the western section, the south wall of the fault was uplifted, and in other sections, the north wall was basically uplifted (Figure 10). The maximum vertical offset is about 1 m. However, at this position, the fault scarp did not extend far to both sides, and no large vertical displacement was seen in the gully. Therefore, the scarp here may have a certain amount of superposition of previous seismic activity, so the vertical offset of the Maduo earthquake should be less than 1 m (Figure 7A).
5. Discussion and Conclusions
It can be seen from the comparison of D-InSAR and drone survey results that D-InSAR shows the range of surface rupture well on the whole, which can provide guidance for field surveys. The field survey also showed that D-InSAR could not fully reflect the details. For example, it is difficult for D-InSAR to identify the branch fractures at the east and west ends, and some small fractures around the main rupture. Although the surface rupture on D-InSAR is continuous, the actual investigation showed that the surface fractures are intermittent. In some areas, the ruptures are continuous, but in some places, they are difficult to find. This shows that the investigation of an earthquake surface rupture needs to combine different investigation methods, from the whole to the part. Only in this way can we have a further understanding of the surface rupture.
The development of the peaty meadow layer on the surface may be the main reason for the formation of two different fracture types in the same earthquake. Alpine meadows are commonly found throughout the Qinghai-Tibet Plateau. Especially at the foot of the mountain, the dense surficial peaty meadow layer, which has a thickness of 20–50 cm, resides on top of a layer of loose sand and gravel (Figure 8C–E and Figure S4B), whereas on the hillside, these meadow layers are not thick, only a few centimeters (Figure S4A).
Where the meadow is thin, the R shears, R′ shears, and T fractures are distributed in disorder (Figure 4 and Figure 5A). Where the peaty meadow layer is thick, en-echelon shears and push-ups are the main structures, and they show a more orderly distribution pattern (Figure 5B, Figure 6 and Figure 7). These indicate that different material compositions and mechanical properties are responsible for different fracture patterns of the surface.
The sand liquefaction and sand dune distribution widely developed along the fault show that there are a large number of loose materials both underground and on the surface (Figures S5 and S6). Although the surface rupture of this earthquake is as long as 160 km, there are long gaps between successive rupture (Figure 10). Especially in the area covered by two deserts, these two areas are the longest surface rupture discontinuities, which have only a few sporadic small fractures along the fault trace. When the D-InSAR result shows that there is deformation on both sides of the discontinuities (Figure 10A), this indicates that after the fault rupture reached the surface, the loose and unbound sand weakened and absorbed the on-fault slip.
The geophysical inversions of the Maduo earthquake have showed that there is 5–10 m of sub-surface coseismic slip [1,3]; these results differ from the field observations that indicate that the maximum surface rupture slip does not exceed 2 m. This phenomenon is generally considered to be caused by inelastic deformation near the surface [22,23]. According to the field investigation, the loose sand layer on the surface affects the exposure of rupture and the offset of the fault.
Convergence of the India–Eurasia plates leads to the continued uplift of the Tibetan Plateau [24] and the eastward extrusion of Tibet along the large strike-slip faults. There are currently two end-member deformation models for the Tibetan Plateau that are the rigid block motion model [25,26,27] and the continuous deformation model [28,29,30,31,32]. Other proposed models are typically a combination of these two end-member models [33].
Based on the historical seismicity in this area (Figure 1), it is generally concluded that the large boundary faults accommodated most of the deformation of the plateau. However, there is still some stress that accumulates within the block. Because the Maduo earthquake is one of the rare earthquakes that occurred inside the Bayan Har Block, studying this earthquake provides valuable insight into the internal deformation mechanisms of Tibet.
Supplementary Materials
The following supporting information can be downloaded at: https://www.mdpi.com/article/10.3390/app122413005/s1, Figure S1: (A) Aerial and (B) ground shot of the Yematan Bridge damaged by Maduo earthquake. This is the largest economic loss caused by the earthquake; Figure S2: Scattered small fractures distributed between continuous rupture along the fault; Figure S3: Striations produced by the earthquake. It shows that the fault movement is mainly in the horizontal direction with a certain vertical component; Figure S4: The different thickness of peaty meadow layer results in different fracture combination forms. (A) Random fractures are formed in the thin peaty meadow cover. (B) In the thick dense peaty meadow cover, it is easy to form push-ups and en-echelon shears; Figure S5: Sand liquefaction in the rupture zone; Figure S6: Sand dunes covered around the fault zone; Table S1: The positive number of vertical offset indicates the uplift of the north wall, and the negative number indicates the uplift of the south wall.
Funding
This research was funded by the National Natural Science Foundation of China (Grant No. 41872226).
Informed Consent Statement
Not applicable.
Data Availability Statement
Data available within the article or its supplementary materials.
Acknowledgments
I am grateful to the ESA for releasing Sentinel-1 radar data, and the NASA for releasing SRTM data. I thank Y. Shu for the assistance in the field, and Z. Ren for the revision of the manuscript.
Conflicts of Interest
The author declares no conflict of interest.
References
- Guo, R.; Yang, H.; Li, Y.; Zheng, Y.; Zhang, L. Complex Slip Distribution of the 2021 Mw 7.4 Maduo, China, Earthquake: An Event Occurring on the Slowly Slipping Fault. Seismol. Res. Lett. 2021, 93, 653–665. [Google Scholar] [CrossRef]
- Chen, H.; Qu, C.; Zhao, D.; Ma, C.; Shan, X. Rupture Kinematics and Coseismic Slip Model of the 2021 Mw 7.3 Maduo (China) Earthquake: Implications for the Seismic Hazard of the Kunlun Fault. Remote Sens. 2021, 13, 3327. [Google Scholar] [CrossRef]
- Jin, Z.; Fialko, Y. Coseismic and Early Postseismic Deformation Due to the 2021 M7.4 Maduo (China) Earthquake. Geophys. Res. Lett. 2021, 48, e2021GL095213. [Google Scholar] [CrossRef]
- Peltzer, G.; Crampé, F.; King, G. Evidence of Nonlinear Elasticity of the Crust from the Mw7.6 Manyi (Tibet) Earthquake. Science 1999, 286, 272–276. [Google Scholar] [CrossRef] [PubMed]
- Xu, X.; Chen, W.; Ma, W.; Yu, G.; Chen, G. Surface Rupture of the Kunlunshan Earthquake (Ms 8.1), Northern Tibetan Plateau, China. Seismol. Res. Lett. 2002, 73, 884–892. [Google Scholar] [CrossRef]
- Liu-Zeng, J.; Zhang, Z.; Wen, L.; Tapponnier, P.; Sun, J.; Xing, X.; Hu, G.; Xu, Q.; Zeng, L.; Ding, L.; et al. Co-seismic ruptures of the 12 May 2008, Ms 8.0 Wenchuan earthquake, Sichuan: East–west crustal shortening on oblique, parallel thrusts along the eastern edge of Tibet. Earth Planet. Sci. Lett. 2009, 286, 355–370. [Google Scholar] [CrossRef]
- Guo, J.M.; Zheng, J.J.; Guan, B.B.; Fu, B.H.; Shi, P.L.; Du, J.G.; Xie, C.; Liu, L. Coseismic Surface Rupture Structures Associated with 2010 Ms 7.1 Yushu Earthquake, China. Seismol. Res. Lett. 2012, 83, 109–118. [Google Scholar] [CrossRef]
- Li, H.; Pan, J.; Lin, A.; Sun, Z.; Liu, D.; Zhang, J.; Li, C.; Liu, K.; Chevalier, M.; Yun, K. Coseismic Surface Ruptures Associated with the 2014 Mw6.9 Yutian Earthquake on the Altyn Tagh Fault, Tibetan Plateau. Bull. Seismol. Soc. Am. 2016, 106, 595–608. [Google Scholar] [CrossRef]
- Fu, B.; Shi, P.; Guo, H.; Okuyama, S.; Ninomiya, Y.; Wright, S. Surface deformation related to the 2008 Wenchuan earthquake, and mountain building of the Longmen Shan, eastern Tibetan Plateau. J. Asian Earth Sci. 2011, 40, 805–824. [Google Scholar] [CrossRef]
- Ren, Z.; Zhang, Z. Structural analysis of the 1997 Mw 7.5 Manyi earthquake and the kinematics of the Manyi fault, central Tibetan Plateau. J. Asian Earth Sci. 2019, 179, 149–164. [Google Scholar] [CrossRef]
- Yuan, Z.; Li, T.; Su, P.; Sun, H.; Ha, G.; Guo, P.; Chen, G.; Thompson Jobe, J. Large Surface-Rupture Gaps and Low Surface Fault Slip of the 2021 Mw 7.4 Maduo Earthquake Along a Low-Activity Strike-Slip Fault, Tibetan Plateau. Geophys. Res. Lett. 2022, 49, e2021GL096874. [Google Scholar]
- Pan, J.; Li, H.; Chevalier, M.-L.; Tapponnier, P.; Bai, M.; Li, C.; Liu, F.; Liu, D.; Wu, K.; Wang, P.; et al. Co-seismic rupture of the 2021, M 7.4 Maduo earthquake (northern Tibet): Short-cutting of the Kunlun fault big bend. Earth Planet. Sci. Lett. 2022, 594, 117703. [Google Scholar] [CrossRef]
- Massonnet, D.; Briole, P.; Arnaud, A. Deflation of Mount Etna monitored by spaceborne radar interferometry. Nature 1995, 375, 567–570. [Google Scholar] [CrossRef]
- Delouis, B.; Giardini, D.; Lundgren, P.; Salichon, J. Joint Inversion of InSAR, GPS, Teleseismic, and Strong-Motion Data for the Spatial and Temporal Distribution of Earthquake Slip: Application to the 1999 Izmit Mainshock. Bull. Seismol. Soc. Am. 2002, 92, 278–299. [Google Scholar] [CrossRef]
- Zhang, G.; Shan, X.; Delouis, B.; Qu, C.; Balestra, J.; Li, Z.; Liu, Y.; Zhang, G. Rupture history of the 2010 Ms 7.1 Yushu earthquake by joint inversion of teleseismic data and InSAR measurements. Tectonophysics 2013, 584, 129–137. [Google Scholar] [CrossRef]
- Fielding, E.J.; Sladen, A.; Li, Z.; Avouac, J.-P.; Bürgmann, R.; Ryder, I. Kinematic fault slip evolution source models of the 2008 M7.9 Wenchuan earthquake in China from SAR interferometry, GPS and teleseismic analysis and implications for Longmen Shan tectonics. Geophys. J. Int. 2013, 194, 1138–1166. [Google Scholar] [CrossRef]
- Ahlgren, S.G. The nucleation and evolution of Riedel shear zones as deformation bands in porous sandstone. J. Struct. Geol. 2001, 23, 1203–1214. [Google Scholar] [CrossRef]
- Sylvester, A.G. Strike-slip faults. GSA Bull. 1988, 100, 1666–1703. [Google Scholar] [CrossRef]
- Ren, J.; Zhang, Z.; Gai, H.; Kang, W. Typical Riedel shear structures of the coseismic surface rupture zone produced by the 2021 Mw 7.3 Maduo earthquake, Qinghai, China, and the implications for seismic hazards in the block interior. Nat. Hazard. Res. 2021, 1, 145–152. [Google Scholar] [CrossRef]
- Bergerat, F.; Angelier, J. Mechanical behaviour of the Árnes and Hestfjall Faults of the June 2000 earthquakes in Southern Iceland: Inferences from surface traces and tectonic model. J. Struct. Geol. 2003, 25, 1507–1523. [Google Scholar] [CrossRef]
- Angelier, J.; Bergerat, F.; Bellou, M.; Homberg, C. Co-seismic strike–slip fault displacement determined from push-up structures: The Selsund Fault case, South Iceland. J. Struct. Geol. 2004, 26, 709–724. [Google Scholar] [CrossRef]
- Kaneko, Y.; Fialko, Y. Shallow slip deficit due to large strike-slip earthquakes in dynamic rupture simulations with elasto-plastic off-fault response. Geophys. J. Int. 2011, 186, 1389–1403. [Google Scholar] [CrossRef]
- Roten, D.; Olsen, K.B.; Day, S.M. Off-fault deformations and shallow slip deficit from dynamic rupture simulations with fault zone plasticity. Geophys. Res. Lett. 2017, 44, 7733–7742. [Google Scholar] [CrossRef]
- Molnar, P.; Tapponnier, P. Cenozoic Tectonics of Asia: Effects of a Continental Collision. Science 1975, 189, 419–426. [Google Scholar] [CrossRef]
- Peltzer, G.; Tapponnier, P. Formation and evolution of strike-slip faults, rifts, and basins during the India-Asia Collision: An experimental approach. J. Geophy. Res. Solid Earth 1988, 93, 15085–15117. [Google Scholar] [CrossRef]
- Avouac, J.-P.; Tapponnier, P. Kinematic model of active deformation in central Asia. Geophys. Res. Lett. 1993, 20, 895–898. [Google Scholar] [CrossRef]
- Tapponnier, P.; Zhiqin, X.; Roger, F.; Meyer, B.; Arnaud, N.; Wittlinger, G.; Jingsui, Y. Oblique stepwise rise and growth of the Tibet plateau. Science 2001, 294, 1671–1677. [Google Scholar] [CrossRef] [PubMed]
- England, P.; Molnar, P. Active Deformation of Asia: From Kinematicsto Dynamics. Science 1997, 278, 647–650. [Google Scholar] [CrossRef]
- Flesch, L.M.; Haines, A.J.; Holt, W.E. Dynamics of the India-Eurasia collision zone. J. Geophys. Res. Solid Earth 2001, 106, 16435–16460. [Google Scholar] [CrossRef]
- Wang, Q.; Zhang, P.Z.; Freymueller, J.T.; Bilham, R.; Larson, K.M.; Lai, X.; You, X.; Niu, Z.; Wu, J.; Li, Y.; et al. Present-day crustal deformation in China constrained by global positioning system measurements. Science 2001, 294, 574–577. [Google Scholar] [CrossRef]
- Zhang, P.Z.; Shen, Z.; Min, W.; Gan, W.; Bürgmann, R.; Molnar, P.; Qi, W.; Niu, Z.; Sun, J.; Wu, J. Continuous deformation of the Tibetan Plateau from global positioning system data. Geology 2004, 32, 809–812. [Google Scholar] [CrossRef]
- Vilotte, J.P.; Daignières, M.; Madariaga, R. Numerical modeling of intraplate deformation: Simple mechanical models of continental collision. J. Geophys. Res. Solid Earth 1982, 87, 10709–10728. [Google Scholar] [CrossRef]
- Wang, Y.; Wang, M.; Shen, Z.-K. Block-like versus distributed crustal deformation around the northeastern Tibetan plateau. J. Asian Earth Sci. 2017, 140, 31–47. [Google Scholar] [CrossRef]
Publisher’s Note: MDPI stays neutral with regard to jurisdictional claims in published maps and institutional affiliations. |
© 2022 by the author. Licensee MDPI, Basel, Switzerland. This article is an open access article distributed under the terms and conditions of the Creative Commons Attribution (CC BY) license (https://creativecommons.org/licenses/by/4.0/).