Abstract
(1) Background: Because of the unique advantages of asphalt pavements, they occupy a large part of the road system in China and worldwide. The construction of asphalt pavements has provided the necessary conditions for the efficient and rapid development of our economy. At present, the asphalt pavement is damaged prematurely before reaching the designed service life. This paper analyzes the influence of different factors on the construction quality of asphalt pavement in the process of construction control, so as to ensure that the service performance of asphalt pavement is improved and the service life is prolonged. (2) Methods: In this paper, based on the data of two-by-two relative importance comparisons between the indexes by experts, a topologizable interval judgment matrix is constructed and the weights of each index are calculated by single ranking; the model is validated by constructing a comprehensive assessment model of the topologizable set of asphalt pavement construction controls and through a case study. (3) Results: Using the model proposed in this paper, the overall construction control level for the case was calculated to be II, with a variable eigenvalue of 2.4784, which is biased towards level III. It is verified that the model can evaluate the construction control of asphalt pavement more reasonably and scientifically than previous methods. (4) Conclusions: This study can provide a reference for the evaluation of asphalt pavement construction control.
1. Introduction
The purpose of asphalt pavement construction control is to ensure that the road has good quality. In the domestic context (China), control is currently achieved mainly in accordance with the Technical Specification for Highway Asphalt Pavement Construction (JTG F40-2004) [1] (hereinafter referred to as the construction specification) to guide and control the quality of asphalt pavement construction. The specification gives the degree of influence of each inspection item on the quality of the pavement, and the constructors are not aware of the influence of each inspection item on the control index, making the construction somewhat blind [2]. Wang et al. showed through indoor tests and field investigations that non-uniformity (gradation segregation, temperature segregation and compaction segregation) has a large impact on the road performance of asphalt mixtures [3], while non-uniformity in asphalt pavements is mainly caused during the construction process. Therefore, to ensure the performance of asphalt pavements, the occurrence of non-uniformity in the asphalt mixture needs to be controlled during construction [4].
Abroad, in the 1950s, AASHTO recorded a large amount of asphalt pavement test data, which laid the foundation for later control techniques, as well as developing quality control specifications for raw materials and introducing the concept of statistics into quality control [5]. In the 1970s, the US applied statistical methods to pavement construction, used statistical methods to analyze variability in indicators, first proposed a QC/QA (quality control/quality assurance) system and established a complete quality control system for asphalt pavements in the 1980s. Since the 1990s, with the promotion of SHRP results, QC/QA systems have been widely used and have achieved better results in practical applications. In addition, there are more studies abroad on the influencing factors of pavement performance. The Mechanistic Empirical Pavement Design Guideline (MEPDG) method [6] in the USA predicts a rutting model for asphalt pavements that considers the mechanical response of the pavement structure and the performance of the asphalt mixture. The US NCHRP 9-22 report [7] analyzed the effects of factors including construction-related factors on fatigue cracking, rutting and low temperature cracking. More research has been carried out on prediction models such as cracking and rutting [8,9], e.g., rutting prediction models can be categorized as empirical, theoretical and mechanistic-empirical models [10,11]. Mirzahosseini et al. [12] predicted the Flow Number of asphalt mixes based on machine learning methods using parameters such as asphalt dosage, coarse aggregate ratio, filler ratio, mineral gap ratio and void ratio.
The construction of asphalt pavements is a complex process in which materials, processes, personnel and equipment all have an impact on the quality of the asphalt pavement, and when coupled with adverse conditions such as environmental conditions, traffic load and tire tension, it will cause irreversible deformation of asphalt pavement, which will affect the service life of asphalt pavement [13,14,15]. There are many discussions on the control of asphalt pavement construction process, but most of them can be summarized into the following categories: first, analyze the construction control indicators, select or improve the construction indicators in the specification, and control the construction process of asphalt pavement through statistical control charts; secondly, analyze the variability of construction control indicators, get the variation range of indicators through experiment or simulation verification, and then dynamically control the pavement construction process through statistical control principle; thirdly, through the analysis of statistical control, select or recommend more convenient or appropriate quality control chart, and then carry out dynamic control of asphalt pavement construction process. However, other influencing factors in the construction are often not considered comprehensively, the control of the construction process is not comprehensive enough, and there are some phenomena such as insufficient attention to the control of the overall performance of asphalt pavement. Numerous factors need to be considered when evaluating asphalt pavement construction control, and as these indicators are either quantitative or qualitative, new evaluation models need to be applied to objectively describe and address construction control issues.
Around asphalt pavement, many scholars have carried out relevant research. Ahmed et al. [16] investigated the effect of using four local industrial waste/by-product materials (marble, granite, steel slag and hydrated lime powder) as mineral fillers on asphalt mixture characteristics, and the testing results show that the asphalt mixture containing marble as a filler yields the highest stability. Tarbay et al. [17] present the use of waste materials (marble and granite) and by-product material (steel slag) as alternative to the conventional mineral filler, and show that mixtures containing waste marble yielded the highest stability. Moreover, marble is able to improve the moisture damage resistance in terms of tensile strength ratio and loss of stability.
As for the evaluation method, commonly used evaluation methods include the fuzzy comprehensive evaluation method [18], the analytic hierarchy process (AHP), and the superiority assessment method based on the toposable set theory. For example, Zhang et al. [19] proposed a decision framework based on fuzzy comprehensive evaluation (FCE) and analytic hierarchy process (AHP) for selecting the best mineral filler from four mineral fillers for pavement structures in selected areas. The proposed methodology combines qualitative and quantitative factors, thus increasing the credibility of the material suitability assessment. Han et al. [20] proposed a new construction quality evaluation framework, which was a combination of the building information model (BIM) and geographic information system (GIS). The framework performed the real-time and full-process quality evaluation of asphalt pavement construction. Taking the Phnom Penh-West Halluk highway construction project as a case study, the results show that the framework provides a good information environment for construction quality evaluation. Xiong et al. [21] proved through experiments that gap-graded mix performed better in rutting resistance than dense-graded specimens. Modification with high viscosity agents could significantly inhibit rutting propagation, offering an important improvement the construction quality of asphalt pavement.
The indicator system of the fuzzy evaluation method is a static attribute. The indicator values are selected as a set of real numbers, and the measured data are interval point values of fuzziness [19,22]. Toposable sets [23] are an extension of classical and fuzzy sets and are able to describe the degree of variability, quantitative processes and qualitative processes of things. Literature research shows that the evaluation index system of fuzzy comprehensive evaluation is a static attribute, the judgment matrix lacks elasticity, the weight determination is subjective, and the selection of index values is a real number set. Practice shows [24] that the conventional indexes of asphalt might meet the specification requirements without necessarily ensuring the asphalt is in a good state. Based on this, on the premise of meeting the requirements of the specification, this paper uses each index to classify each respective requirement. For the convenience of data analysis, each index is normalized and dimensionless [25]. Combined with expert survey data, the extension interval number judgment matrix [26] is constructed, and the extension interval values are used instead of specific point values to construct the extension judgment matrix. This not only considers the subjectivity of expert judgment, but also combines the weight solution with the consistency test of judgment matrix, which simplifies the calculation and overcomes the shortcomings of rough calculation process and strong subjectivity of traditional analysis methods. Finally, the weight of each index is calculated by extension set theory analysis. By constructing an extension set for a comprehensive evaluation model of asphalt pavement construction control, the evaluation grade of construction control is calculated by the extension method, enabling to evaluate the asphalt pavement construction control. Combined with specific examples, the model calculation and verification are carried out, and the verification results are more scientific and reasonable. Various factors in the construction are comprehensively considered, which provides reference for the control process of asphalt pavement construction and ensures the construction quality of asphalt pavement.
2. Methods
Topology, founded by Caiwen in 1983, is an original discipline. It can be used to describe the variability of things, develop the qualitative description of right and wrong into a quantitative description, and provide a new way to evaluate processes by building a multi-indicator evaluation model [25,27]. Topologic analysis theory is a powerful tool for resolving the contradiction between right and wrong and has been successfully applied to evaluate problems in many fields [28,29]. The specific process of this method is as follows:
2.1. Identifying Evaluation of Matter-Elements, Classical Domains and Section Domains
Let matter-element [25] be:
where: is the -th symbiotic matter element; is the -th evaluation level division; is the -th evaluation index; is the range of magnitudes specified by about the index , that is, the data range taken by each level for the corresponding evaluation index is the classical domain; .
Moreover:
where: is the asphalt pavement to be evaluated for construction control; is the range of values obtained by with respect to , i.e., the nodal domain of ; and .
For the asphalt pavement to be evaluated, the data collected or the results of the analysis are expressed as a substance element . Now is the substance element to be evaluated.
where: is a specific asphalt pavement; and is the value of about the index , i.e., the specific index data of the asphalt pavement construction control to be evaluated.
2.2. Correlation of Function Values for Asphalt Pavement Element Classes
Considering the actual situation of asphalt pavement construction control, the value of the midpoint of the interval is used as the optimum point, and the correlation function [30] is used as Equation (4).
where:
2.3. Construction Control Assessment of Asphalt Pavements
Based on the calculated weights of the indicators and their corresponding correlations, the following can be topologically evaluated for the construction control of asphalt pavements.
This leads to the correlation of the asphalt pavement construction control level to be evaluated is as follows.
If , then is assessed as belonging to rank .
Given:
Thus, is the eigenvalue of the level variable of . For example, and means that belongs to level 1 biased towards level 2 (which should strictly be 1.6), and the degree of bias towards another level can be seen according to .
3. Evaluation Procedure
The process of topologically assessing construction control is shown in Figure 1.
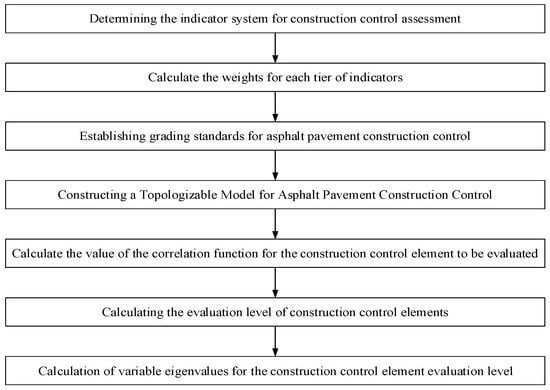
Figure 1.
Assessment process for construction control of asphalt pavements.
There are two main evaluation sections:
3.1. Establishing an Evaluation Index System
The construction of asphalt pavement is an extremely complex process with many influencing factors, including external environment, materials, technology, equipment and other factors. It is clearly not possible to reflect all the evaluation indicators of the various influencing factors in the evaluation of asphalt pavement construction control; there must be a trade-off between aiming for comprehensive assessment of all indicators and ignoring some of the evaluation indicators that have a small impact. For the construction process of asphalt pavement, combined with the characteristics of the pavement structure and the influence of factors such as traffic load and environment, through the review of relevant specifications and information, this paper establishes an assessment index system from four aspects: material, mixing, transportation and rolling factors.
In particular, the evaluation indicators for materials and mixing factors were selected, and the evaluation indicators were initially selected by reviewing relevant specifications and information as shown in Table 1. Thereafter, by developing a questionnaire and inviting 35 relevant experts to judge, a total of 29 valid survey results were returned [31], and the statistical results of the number of choices of each indicator are shown in Table 1.

Table 1.
Results of the collation of the survey of pending indexes [31].
On the basis of the statistical results of expert opinions, combined with the research results at home and abroad and the actual situation of China’s construction, the evaluation indexes of material and mixing factors are determined, and the material factors affecting the construction control of asphalt pavements are divided into softening point, low-temperature ductility, crushing value, needle flake content and mud content. Of these, the first two are the influencing factors of asphalt materials and the last three are the influencing factors of aggregate material factors. Mixing temperature, oil to stone ratio and gradation were used as influencing factors for the mixing factor. The evaluation indicators for determining the paving and rolling factors are considered together, with paving temperature, thickness, paving speed and transfer equipment as influencing factors for the paving factor. The rolling temperature, number of rolling passes, rolling speed, rolling equipment, number of equipment and combination were used as the influencing factors of the rolling factors, to obtain the asphalt pavement construction control index system as shown in Table 2.
Table 2.
Asphalt pavement construction control assessment index system.
3.2. Calculating Weights
Each control indicator of asphalt pavement construction has a different degree of influence on the quality of the project. In the assessment of the control of asphalt pavement construction, the degree of influence of each indicator needs to be estimated, i.e., the determination of the indicator weights. The key to construction control assessment is the reasonableness of the weighting factors. The traditional expert scoring method and direct empowerment method are highly subjective, and different people get different weighting coefficients. The AHP is more scientific and objective than the traditional expert scoring method and direct assignment, and has the advantages of simplicity, systematicity and practicality [31], but it is also somewhat subjective. To overcome these drawbacks, this paper uses toposable set theory [26] to determine the weights.
3.2.1. The Establishment of the Judgment Matrix
Based on the indicator system in Table 2, road engineering experts were invited to make a two-by-two comparison of the relative importance of each layer of indicators based on the 1–9 degree scale method [32] on the basis of the relevant specifications, using a topologizable interval instead of a specific point value. A topologizable interval judgment matrix is built on the basis of expert comparison data, i.e., (where ). The element in the matrix is a broadenable interval number; the middle value of the broadenable interval number is used as an integer for the comparative judgment used in the hierarchical analysis method [33], and the matrix is expressed in the form .
3.2.2. The Calculation of Weights
- (1)
- Calculate the maximum eigenvalues and and the corresponding normalized eigenvectors and of the matrices and with interval number eigenvalues .
- (2)
- Calculate the values of and according to Equations (12) and (13). If and satisfy , the matrix satisfies the consistency test requirement; if not, the judgment matrix needs to be reconstructed until it satisfies the requirement.
- (3)
- Calculation of weights. Calculate the eigenvectors of matrix with respect to the interval number eigenvalues :
Setting and , then the degree of probability that is calculated according to Equation (4). Moreover:
where should satisfy , , all with , then taking and , is the single ranking of the -th factor of the -th layer to the -th factor of the upper layer in the asphalt pavement construction control assessment system, and is normalized to obtain . This denotes the single ranking weight vector of the factors in the -th layer to the -th factor in the -th layer.
With the combined weight vector of factors of layer to the target layer is and the single ranked weight vector of layer to each factor of layer , make a matrix of order .
Then the combined weight of each indicator on the -th tier for the target tier is
4. Case Study
4.1. Calculation of Weights
According to the indicator system constructed in the previous section and the principle of comparison by the 1–9 scale method, experts were invited to make a two-by-two comparison of the relative importance between elements, and the judgment matrix A of each attribute of the criterion layer to the target layer was established as shown in Table 3.
Table 3.
Judgment matrix of each attribute of the criterion layer for the target layer.
Then the matrices and are:
The eigenvectors and are calculated as
The coefficients and are calculated from Equations (1) and (2). Clearly , which meets the requirements.
Calculated from Equation (3): , , , and . In turn, the weights were calculated.
The judgment matrix of the evaluation index layer to the criterion layer is shown in Table 4, Table 5, Table 6 and Table 7:
Table 4.
Judgment matrix for each attribute of the material factor of the index layer for the criterion layer.
Table 5.
Judgment matrix for each attribute of the mixing factor of the index layer for the criterion layer.
Table 6.
Judgment matrix for each attribute of the paving factor of the index layer for the criterion layer.
Table 7.
Judgment matrix for each attribute of the lapping factor of the index layer for the criterion layer.
Following the calculation of the weights above, the matrices and are constructed in turn, and and are calculated to obtain: , and the weights are then calculated. The calculation results are shown in Table 8.
Table 8.
Weighting of evaluation indexes.
From the above analysis, it can be seen that there are many factors affecting the construction of asphalt pavement, and the weights of each factor are different. According to the analysis results of each evaluation index in Table 8, paving factors have the greatest influence on the construction and quality of asphalt pavement, among which paving temperature and paving speed play a vital role. Therefore, in order to ensure the construction quality of asphalt pavement meets the requirements, the first thing is to strengthen the control of paving factors in the construction process of asphalt pavement, and strictly grasp the temperature and speed in the paving process of asphalt pavement according to the corresponding specifications and the actual construction environment on site.
4.2. Determination of Assessment Levels
According to the construction characteristics of the pavement and relevant information, the construction control evaluation of asphalt pavement is divided into five grades: excellent (I), good (II), medium (III), lower (IV) and poor (V), as shown in Table 9. The grading of the indicators is determined by reference to the relevant range of provisions in the specification [1]. For example, the range of crushing values is 0–26%, and it has been pointed out in the literature that coarse aggregates with crushing values greater than 25% are susceptible to crushing during the rolling of the mix [27], which proves that the choice of crushing value range is significant. For the mixing temperature indicator, the asphalt heating temperature and the mix discharge temperature are used for consideration, with the median temperature range of the specification being the optimum temperature value, and the relative temperature deviation determines the range for each level. If the temperature range specified in the specification is , and the measured heating temperature is , the two ratios of the asphalt heating temperature and the mix discharge temperature are calculated according to Equation (18), and the larger of these is taken as the basis for evaluating the mixing temperature index. For the paving temperature and rolling temperature indicators, respectively, then the respective minimum temperature requirements are the lower limit; the upper and lower limit of the mixture discharge temperature are the upper limit of paving and rolling; the average of the interval is graded into five levels, and the higher the temperature indicates a better state; such that for the determination of the temperature limit range of , the actual measured heating temperature of , and the ratio calculated according to Formula (19) are the basis for evaluation. For the oil to stone ratio and thickness indicators, the grades are divided by deviation. Practical experience shows that asphalt content deviating from the optimum oil to stone ratio by more than 0.3% significantly affects the performance of the mix, so 0.3% can be used as a grading range for the oil to stone ratio. Here the permissible deviation of −5% of the total thickness design value of the highway is taken as the grading range of thickness, and the deviation is treated as 0 when positive. Other grades of pavement can be divided according to the corresponding grade for similar division methods. For the qualitative indicators, a rating between 0~100 was used for the grading based on consideration of the norms and the actual situation. The ranking of each indicator is shown in Table 10.
Table 9.
Construction control evaluation levels.
Table 10.
The evaluation level range of each index.
As the data between the evaluation levels of each evaluation index is not comparable, in order to facilitate the analysis of the data, the indexes are dimensionless and normalized in this paper. If the nature of the effect of the index on construction control is positive, treat it according to Equation (20); if the nature of the effect of the index on construction control is reversed, treat it according to Equation (21).
The intervals of the processed index levels and the measured values are shown in Table 11.
Table 11.
Results after normalization of each index.
4.3. Constructed Asphalt Pavement Construction Control of Matter-Element
From Equations (1) and (2), the classical and nodal domains of asphalt pavement construction control can be obtained as follows:
4.4. Calculation of the Correlation of Evaluation Indexes
The degree of correlation is calculated by Equation (4) and the results are shown in Table 12.
Table 12.
Correlation of evaluation indexes.
4.5. Evaluation of Asphalt Pavement Construction Control
From Equation (8), is calculated as:
Similarly, it can be calculated that:
In summary, the correlation of the asphalt pavement construction control level calculated from Equation (9) is
According to , the construction control level of this asphalt pavement is level II, and the eigenvalue of the level variable is obtained from Equation (11) as , which integrates the construction control bias of this asphalt pavement to level III.
According to the evaluation results, the construction control level of the paving and rolling factors is Level II and the evaluation conclusion is “Good”, but the evaluation result of the thickness and rolling speed of the subsystem is “Low”. For thickness control of the paver parameter settings, the screed and auger arrangement should be checked for reasonableness and the height of the mix around the fabric should be cofirmed. For the control of the rolling speed, the selection and training of the roller operator should be improved. The level of construction control for the material and mixing factors is level III, with an evaluation conclusion of “Medium”. The analysis shows that the evaluation conclusion for the material factor is “Poor” for the sludge content indicator and “Low” for the mixing factor for the gradation factor. There is a lot of room for improvement and upgrading. During the construction control process, the detection and control of mud content and gradation should be strengthened, especially the mud content index, which needs special attention in order to improve the construction control of asphalt pavement and ensure its construction quality.
5. Discussion
Firstly, from the perspective of research methods, the evaluation index system of analytic hierarchy process (AHP) and fuzzy comprehensive evaluation adopted in the literature [18,19,20,21] is a static attribute, the judgment matrix is inflexible, the weight determination is subjective, and the selection of index value is a set of real numbers. By contrast, the method adopted in this paper selects a set of real numbers, and the measured data is the interval point value of fuzziness, which can describe the variability of things, the quantitative change process and the degree of the qualitative change process. In addition, this paper considers using the extension interval value instead of the specific point value to construct the extension judgment matrix, which not only considers the subjectivity of expert judgment, but also combines the weight solution with the consistency test of the judgment matrix, thereby simplifying the calculation and overcoming the shortcomings of the rough calculation process and strong subjectivity of the traditional analysis method. Second, asphalt pavements construction is a complex process, and material, technology, personnel, and equipment all have influence on the quality of the asphalt; in addition, the environmental conditions, traffic load and the tension of tires and other adverse conditions, including the action of will, can cause irreversible deformation of asphalt pavement, affecting the service life of the asphalt road surface. Therefore, in the asphalt pavement construction control evaluation, many factors need to be considered, including quantitative and qualitative indicators, and there is a need to apply a new evaluation system to describe and deal with the construction control problem. However, literature [6,7,8,9,10,11,12] considers relatively single factors, which is insufficient to comprehensively and objectively analyze the construction quality of asphalt pavement.
6. Conclusions
- (1)
- Combining the characteristics of construction control of asphalt pavements, a construction control assessment model is established using toposable set theory. Considering the actual situation, the weight calculation results are more reasonable and accurate by constructing a topologizable interval judgment matrix compared with the previously constructed fixed value judgment matrix, and combining the judgment matrix consistency test with the weight calculation enables the calculation steps to be simplified.
- (2)
- The model proposed in this paper is used to calculate that the construction control level of the case study is Grade II, and the characteristic value of the variable is j^* = 2.4784, which is inclined to Grade III. It is verified that the model can evaluate the construction control of asphalt pavement more reasonably and scientifically, and can provide reference for the evaluation of construction control of asphalt pavement.
- (3)
- Compared with the assessment methods of existing specifications, the model can quantitatively assess the construction control rating level of asphalt pavements and better reflect the actual situation of construction control. It overcomes the shortcomings of other assessment methods, which are highly subjective and rough in calculation, and can objectively assess the construction control condition, providing reference for the construction control of similar asphalt pavements and improving the construction control scheme.
- (4)
- At the same time, it can be seen from the evaluation results that the mud content in aggregate and gradation in the mixing process need to be greatly improved in the subsequent construction process, and the detection and control of mud content and gradation should be strengthened to fully ensure the construction quality of asphalt pavement.
- (5)
- There are still some limitations in the research of asphalt pavement construction control technology in this paper. For example, due to the complicated construction process, some construction control indexes related to pavement performance may not be reflected in the construction quality control system, which needs to be further improved. The quantitative relationship between construction control indicators and pavement performance, as well as the degree of influence of variation of construction control indicators on pavement performance, need to be further discussed or determined through experimental analysis.
- (6)
- The causes of asphalt pavement damage include many features. Relevant practitioners should consider comprehensively the aspects of design, construction and maintenance. In terms of design, they can focus on the design idea of integrating pavement structure and pavement materials to improve the performance of asphalt pavement. In terms of maintenance, the focus is mainly prevention-oriented, combining prevention with treatment, long-term maintenance with regular inspection, and early detection and early treatment of problems, all of which not only improve the pavement performance, but also prolong the service life of the road.
Author Contributions
Conceptualization, J.C., Q.L. and Z.L.; methodology, J.C. and Z.L.; validation, Z.L.; formal analysis, J.C., Q.L. and H.L.; investigation, J.C. and Q.L.; resources, Q.L., Z.L. and H.L.; data curation, Z.L.; writing—original draft preparation, Q.L. and Z.L.; writing—review and editing, Z.L. and Q.L.; visualization, Q.L and Z.L.; supervision, Q.L. and Z.L.; project administration, J.C. and H.L.; funding acquisition, J.C. and H.L. All authors have read and agreed to the published version of the manuscript.
Funding
This research was funded by Henan Provincial Communications Construction Engineering Co., Ltd. (Grant No. HNJS-2020-K35).
Institutional Review Board Statement
Not applicable.
Informed Consent Statement
Not applicable.
Data Availability Statement
Not applicable.
Conflicts of Interest
The authors declare no conflict of interest.
References
- JTG F40-2004; Technical Specification for Construction of Highway Asphalt Pavements. People’s Traffic Publishing House: Beijing, China, 2004.
- Zhao, Y.L. Research on Construction Process Control of Asphalt Layer Based on BIM Technology. Master’s Thesis, Southeast University, Nanjing, China, 2018. [Google Scholar]
- Wang, S.; Sui, X.; Leng, Z.; Jiang, J.; Lu, G. Asphalt pavement density measurement using non-destructive testing methods: Current practices, challenges, and future vision. Constr. Build. Mater. 2022, 344, 128154. [Google Scholar] [CrossRef]
- Magar, S.; Xiao, F.P.; Singh, D.; Showkat, B. Applications of reclaimed asphalt pavement in India—A review. J. Clean. Prod. 2021, 335, 130221. [Google Scholar] [CrossRef]
- Zhao, Y.H. Asphalt Pavement Construction Control Technology Based on Performance. Master’s Thesis, Zhengzhou University, Zhengzhou, China, 2015. [Google Scholar]
- NCHRP 1-37A; Guide for Mechanistic-Empirical Design of New and Rehabilitated Pavement Structures. National Cooperative Highway Research Program, Transportation Research Board: Washington, DC, USA, 2004.
- Fugro Consultants (Firm); Arizona State University. A Performance-Related Specification for Hot-Mixed Asphalt; Transportation Research Board: Washington, DC, USA, 2011. [Google Scholar]
- Fattah, M.Y.; Helo, K.H.; Qasim, Z.I. Prediction models for fatigue resistance of local hot mix asphalt. Road Mater. Pavement Des. 2016, 17, 793–809. [Google Scholar] [CrossRef]
- Dave, E.V.; Buttlar, W.G.; Leon, S.E.; Behnia, B.; Paulino, G.H. IlliTC-low-temperature cracking model for asphalt pavements. Road Mater. Pavement Des. 2013, 14, 57–78. [Google Scholar] [CrossRef]
- Bhattacharya, B.B.; Mallela, J.; Titus-Glover, L.; Goldbaum, J. Calibration of Pavement Rutting Prediction in Colorado Using Layer-Specific Rutting Model Coefficients for Hot-Mix Asphalt in AASHTOWere Pavement ME Design. Transp. Res. Rec. 2016, 2590, 132–141. [Google Scholar] [CrossRef]
- Christensen, D.; Bonaquist, R.F. Modification of the Resistivity-Rutting Model to Use Recoverable Creep Compliance. Transp. Res. Rec. 2015, 2505, 48–56. [Google Scholar] [CrossRef]
- Mirzahosseini, M.; Najjar, Y.M.; Alavi, A.H.; Gandomi, A.H. Next-Generation Models for Evaluation of the Flow Number of Asphalt Mixtures. Int. J. Geomech. 2015, 15, 04015009. [Google Scholar] [CrossRef]
- Yaro, S.N.A.; Sutanto, M.H.; Usman, A.; Jagaba, A.H.; Sakadadi, M.Y. The Influence of Waste Rice Straw Ash as Surrogate Filler for Asphalt Concrete Mixtures. Construction 2022, 2, 118–125. [Google Scholar] [CrossRef]
- Danoshini, G.; Baqadeem, A.; Al-Shakhrit, A.K.S.; Jasni, N.E.; Masri, K.A. Statistical Analysis of Stone Mastic Asphalt Incorporating Kenaf Fibre. Construction 2021, 1, 12–17. [Google Scholar] [CrossRef]
- Arab, M.G.; Alzara, M.; Zeiada, W.; Omar, M.; Azam, A. Combined effect of compaction level and matric suction conditions on flexible pavement performance using construction and demolition waste. Constr. Build. Mater. 2020, 261, 119792. [Google Scholar] [CrossRef]
- Awed, A.M.; Tarbay, E.W.; El-Badawy, S.M.; Azam, A.M. Performance characteristics of asphalt mixtures with industrial waste/by-product materials as mineral fillers under static and cyclic loading, Road Mater. Pavement Des. 2022, 23, 335–357. [Google Scholar] [CrossRef]
- Tarbay, E.W.; Azam, A.M.; El-Badawy, S.M. Waste materials and by-products as mineral fillers in asphalt mixtures. Innov. Infrastruct. Solut. 2019, 4, 5. [Google Scholar] [CrossRef]
- Mohamed, M.; Tran, D.Q. Risk-based inspection for concrete pavement construction using fuzzy sets and bayesian networks. Autom. Constr. 2021, 128, 103761. [Google Scholar] [CrossRef]
- Zhang, Z.; Liu, P.; Rochlani, M.; Falla, G.C.; Leischner, S.; Oeser, M. A fuzzy comprehensive evaluation method to select the optimal mineral filler for optimization of the performance of asphalt mastics. Constr. Build. Mater. 2021, 298, 123847. [Google Scholar] [CrossRef]
- Han, C.; Tang, F.; Ma, T.; Gu, L.; Tong, Z. Construction quality evaluation of asphalt pavement based on BIM and GIS. Autom. Constr. 2022, 141, 104398. [Google Scholar] [CrossRef]
- Xiong, H.; Han, J.; Wang, J.; Ren, Q.; Wu, L. Application of high viscosity-high modulus modified asphalt concrete in bus rapid transit station pavement-A case study in Chengdu, China. Case Stud. Constr. Mater. 2022, 17, e01337. [Google Scholar] [CrossRef]
- Contreras-Nieto, C.; Shan, Y.; Lewis, P.; Hartell, J.A. Bridge maintenance prioritization using analytic hierarchy process and fusion tables. Autom. Constr. 2019, 101, 99–110. [Google Scholar] [CrossRef]
- Lee, L.-T.; Tao, D.-F.; Tseng, C.-Y.; Wu, M.-T. An extenics-based load balancing mechanism for distributed computing systems. In Proceedings of the 2002 IEEE Region 10 Conference on Computers, Communications, Control and Power Engineering. TENCOM’02. Proceedings, Beijing, China, 28–31 October 2022; Volume 1, pp. 371–374. [Google Scholar]
- Wang, F.; Xiao, Y.; Cui, P.; Lin, J.; Li, M.; Chen, Z. Correlation of asphalt performance indicators and aging Degrees: A review. Constr. Build. Mater. 2020, 250, 118824. [Google Scholar] [CrossRef]
- Li, Q.; Zhou, H.; Ma, Q.; Lu, L. Evaluation of Serviceability of Canal Lining Based on AHP—Simple Correlation Function Method-Cloud Model: A Case Study in Henan Province, China. Sustainability 2021, 13, 12314. [Google Scholar] [CrossRef]
- Li, Q.; Zhou, H.; Zhang, H. Durability evaluation of highway tunnel lining structure based on matter element extension-simple correlation function method-cloud model: A case study. Math. Biosci. Eng. 2021, 18, 4027–4054. [Google Scholar] [CrossRef]
- Wang, Q.; Li, S.; He, G.; Li, R.; Wang, X. Evaluating sustainability of water-energy-food (WEF) nexus using an improved matter-element extension model: A case study of China. J. Clean. Prod. 2018, 202, 1097–1106. [Google Scholar] [CrossRef]
- Dong, Y.; Chen, Q.; Ding, W.; Shao, N.; Chen, G.; Li, G. State Evaluation and Fault Prediction of Protection System Equipment Based on Digital Twin Technology. Appl. Sci. 2022, 12, 7539. [Google Scholar] [CrossRef]
- Li, L.; Kong, D.; Liu, Q.; Xiong, Y.; Chen, F.; Zhang, H.; Chu, Y. Comprehensive Identification of Surface Subsidence Evaluation Grades of Mines in Southwest China. Mathematics 2022, 10, 2664. [Google Scholar] [CrossRef]
- Liu, S.; Li, W. Indicators sensitivity analysis for environmental engineering geological patterns caused by underground coalmining with integrating variable weight theory and improved matter-element extension model. Sci. Total Environ. 2019, 686, 606–618. [Google Scholar] [CrossRef] [PubMed]
- Guo, D.J.; Sha, A.M. Quality Control Technology of Asphalt Pavement Construction; People’s Traffic Publishing House: Beijing, China, 2010. [Google Scholar]
- An, Y.L. Study on Tunnel Construction Risk Evaluation Considering Deformation Standard of Neighboring Structures. Master’s Thesis, Central South University, Changsha, China, 2009. [Google Scholar]
- Yan, D.F. Extension Analytic Hierarchy Process and Its Applications. Master’s Thesis, Dalian Maritime University, Dalian, China, 2012. [Google Scholar]
Publisher’s Note: MDPI stays neutral with regard to jurisdictional claims in published maps and institutional affiliations. |
© 2022 by the authors. Licensee MDPI, Basel, Switzerland. This article is an open access article distributed under the terms and conditions of the Creative Commons Attribution (CC BY) license (https://creativecommons.org/licenses/by/4.0/).