Abstract
The flow-induced rotational motion of tandem double cylinders has rarely been studied in existing papers. In order to further study the flow-induced rotation (FIR) of two mechanically tandem-coupled cylinders, an FIR device was designed in this paper, and the theoretical basis of this system was established. On this basis, a series of variable spacing ratio (L/D) tests were carried out in a recirculating water tunnel. The range of L/D was 4.0 ≤ L/D ≤ 9.0. The main experimental conclusions can be summarized as follows: (1) When L/D = 4.0 and 4.5, the rotational response was similar to vortex-induced vibration (VIV), which is different from typical VIV, in that the rotational oscillation would appear to be a re-growth region when velocitycontinued to increase after the oscillation entered the lower branch of VIV. Additionally, the oscillation was at a low level and the maximum arc length ratio (A*) was less than 0.55 in these two cases; (2) For L/D = 5.0, 5.5 and 6.0, the rotational responses all showed typical VIV. When the oscillation reached a high level, the maximum A* was more than 0.85 for each case; (3) When L/D = 7.0, 8.0 and 9.0, the rotational responses still presented typical VIV. The oscillation was at a medium level, and the maximum A* was between 0.53 and 0.72, but these three cases had a wider synchronization interval than the other cases, and the range showed an increasing trend with the growth of L/D.
1. Introduction
Flow-induced motion (FIM) is a complicated non-linear vibration phenomenon caused by the interaction between moving fluid and elastic bodies [1], which is widely used in practical engineering, such as marine risers [2,3,4,5], bridge latches [6,7] and high-rise buildings [8]. The FIM phenomenon could cause great damage to engineering. Therefore, much research [9,10] has focused on how to predict and suppress FIM to ensure the safety of engineering structures in the early stages. However, with the development and utilization of ocean energy and in-depth research on FIM, more scholars are focusing on exploiting ocean energy by means of the FIM phenomenon. A series of new ocean current and tidal current power generation devices have been proposed [11,12,13]. Among them, a typical one is the Vortex Induced Vibration for Aquatic Clean Energy (VIVACE), a new low-speed current power generation device, proposed by Bernitsas from the University of Michigan [14,15,16,17]. At the same time, scholars have also carried out a large number of studies on oscillation characteristics and energy conversion of FIM for multi-oscillators, most of which have concentrated on circular cylinders [18,19,20].
Previously, scholars mainly studied the effect of spacing on the wake and oscillation characteristics of the upstream and downstream cylinders through experimental methods. King and Johns [21] found that when two identical cylinders were partially, or completely, immersed in fluid, with a spacing ratio of 0.25 < L/D < 6, a complex interaction would occur between the wake vortex and the deflection of the cylinders. Zdravkovich [22,23,24] systematically studied the changes of wake vortex and flow force of tandem cylinders through the experimental method, and summarized the evolution process of the wake vortex of the upstream and downstream cylinders with the change of spacing. On this basis, Igarashi [25] analyzed the effect of spacing ratio and Reynolds number on vibration and wake of upstream and downstream cylinders, through experiments for a Reynolds number of 8.7 × 10³ ≤ Re ≤ 5.2 × 10⁴ and the spacing ratio of 1.03 ≤ L/D ≤ 5.0, and defined the wake path with different spacing ratios. Bokaian and Geoola [26,27] studied the vibration characteristics of upstream and downstream cylinders with different sizes through a series of physical experiments. It was shown that the oscillation wake of the upstream cylinder would be affected by the amplitude variation of the downstream cylinder. Yao et al. [28] studied the force of the upstream and downstream cylinders through the experimental method, under the condition that the Reynolds number range was 4.5 × 10⁴ < Re < 5.8 × 10⁵ and the spacing ratio was 2.5 ≤ L/D ≤ 5.02, and proved that the mutual disturbance between the two cylinders could disturb the lift and drag coefficients of the system. Mahir and Rockwell [29,30] conducted an experimental analysis on the wake of tandem double cylinders and their research showed that the wake of the double cylinder system was more complex and varied than that of a single cylinder under different phase conditions. Brika and Laneville [31] conducted an experimental study on the vibration of tandem cylinders, which showed that the resonance region of the tandem cylinders was larger than that of an isolated cylinder. Additionally, the resonance region decreased with increase of L/D.
Subsequently, with the continuous progress of CFD technology, and the diversification of test equipment, scholars have further analyzed the flow field and vibration characteristics of tandem double cylinders. Meneghini et al. [32] observed the flow field characteristics of two cylinders in series and calculated the vorticity lines and the force on the cylinders. Lin et al. [33] used particle image velocimetry (PIV) to measure the flow field of two tandem cylinders. Based on previous research results, Zhou and Yiu [34] concluded that there were three wake interference regions: extended-body regime, reattachment regime and co-shedding regime. Prasanth and Mittal [35,36] simulated the two cylinders in tandem arrangement at low Reynolds number and large spacing ratio (L/D = 5.5). The numerical results showed that the locking interval of the downstream cylinder was significantly larger than that of an isolated cylinder, due to the influence of the upstream cylinder, while the downstream cylinder had almost no influence on the upstream cylinder. Assi et al. [37] experimentally studied the vibration of tandem double cylinders with the upstream cylinder fixed, through a flume test. The results showed that wake galloping could be observed in the downstream cylinder, and the amplitude increased by nearly 50%, compared with that of a single cylinder, when the spacing ratio was 3.0 < L/D < 5.6. Moreover, Assi et al. [38] proposed the concept of wake-induced vibration (WIV) in their further research. In order to develop a clearer understanding of the WIV excitation mechanism, the response of the downstream cylinder in a steady shear flow was compared with typical VIV responses of a single cylinder. The test results showed that the WIV phenomenon of the downstream cylinder was excited by the interaction between the unstable vortices from the wake of the upstream cylinder and the downstream cylinder. Bao et al. [39] performed a numerical simulation on the VIV of the tandem double cylinders with two degrees of freedom. The results showed that the double resonance phenomenon occurred in all frequency ratios, and the vibration of the upstream cylinder was similar to that of an isolated cylinder under various working conditions, while the dynamic response of the downstream cylinder was more sensitive to the incoming direction than to the lateral direction, due to the change of the frequency ratio.
In later papers, scholars paid more attention to analyzing the internal mechanism of vibration characteristics. Ji et al. [40] conducted a comprehensive analysis on the mechanism of the large-amplitude response of the downstream cylinder in tandem double cylinders at Re = 100, and found that the shedding vortices of the upstream cylinder induced a low pressure area, which, in turn, stimulated the downstream cylinder to generate a large amplitude response. Chen et al. [41] numerically investigated the three tandem cylinders in the range of L/D = 1.2 to 5.0, and analyzed the influence of three key factors on the galloping phenomenon, including balance position offset, vortex shedding and timing between cylinders. Qin et al. [42] experimentally studied tandem double cylinders. It was found that there were different vibration mechanisms, such as locking, VIV and galloping, under various frequency ratio conditions. Furthermore, differing from previous research on the FIM of cylinders, Arionfard and Nishi [43,44] identified four mechanisms of vibration with two mechanically coupled circular cylinders that were free to rotate around a pivot, and they proposed the concept of gap switching-induced vibration (GSIV). Zhu et al. [45] numerically investigated the flow-induced rotation of a circular cylinder with a detached splitter plate at Re = 100, and found the occurrence of bifurcation at 0 ≤ G/D ≤ 0.5, which disappeared at 0.55 ≤ G/D ≤ 2.0. Chen and Wu [46] undertook extensive simulations to investigate the VIV of a piggyback circular cylinder system at Re = 100. It was found that the motion trajectories would take the form of a classical pattern of 8 when the system was in tandem arrangement. Furthermore, many scholars also conducted in-depth research [47,48,49] on the FIM power generation of tandem double cylinders. The results showed that the power generation efficiency of tandem double cylinders was much higher than that of an isolated cylinder, and revealed the vibration enhancement conditions of tandem double cylinders.
In conclusion, due to the influence of upstream cylinder wake vortices on the downstream cylinder, the vibration intensity and power generation potential of tandem double cylinders are both higher than that of a single cylinder, and research on multi-cylinder tandem power generation is bound to become an important development direction of FIM. However, power generation from freely vibrating multi-cylinders needs numerous power take-off (PTO) devices. If the tandem double cylinders do not vibrate freely in the cross-flow direction, but are free to vibrate rotationally and cooperatively, the vibration energy of the two cylinders can be collected at the same time. In the mode of double cylinder rotational oscillation, the single-unit capacity of the supporting power generation equipment could be increased and the amount of equipment could be greatly reduced, so this power generation method would be more economica,l both in terms of dispatching and costs. Nevertheless, in the case of rotational vibration of two tandem-coupled cylinders, whether the oscillation level is increased or decreased, compared with free vibration, is rarely mentioned in the existing research. Therefore, it is necessary to thoroughly investigate the flow-induced rotation (FIR) of two tandem-coupled cylinders and to summarize the oscillation characteristics. This paper systematically explores the FIR of two mechanically tandem-coupled cylinders at different spacing ratios, from both theoretical and experimental aspects. The aim was to further guide and promote the design and practical engineering application of marine power generation FIM devices. For the framework of this study, the remaining parts proceed as follows: The principle of the FIR system is introduced and the mathematical expression is deduced in Section 2, followed by a detailed description of the method and content of the experiment in Section 3. The rotational oscillation characteristics of the FIR system at various spacing ratios are presented and analyzed in Section 4. Finally, the main conclusions are summarized in Section 5.
2. Theoretical Basis
2.1. Principle of Flow-Induced Rotation
Figure 1 is a simplified schematic diagram of the flow-induced rotation (FIR) system. As shown in Figure 1, the double cylinders are mechanically coupled and arranged in series. When the water flows through the FIR system, the fluid force, Ffluid, forces the tandem-coupled double cylinders to rotate around its geometric central axis, O. The motion of the cylinders drives the upper rotary shaft with the pivot point, P, to rotate synchronously through the transmission device, composed of the transmission belt and the synchronous wheel. The upper rotary shaft, P, is connected to a hollow vertical rod through a three-way shaft sleeve to ensure that they also rotate synchronously. Two tension springs are connected to this hollow vertical rod by using a spring connector to generate the restoring force. Fk. Note that the spring connector can slide freely on the vertical rod.
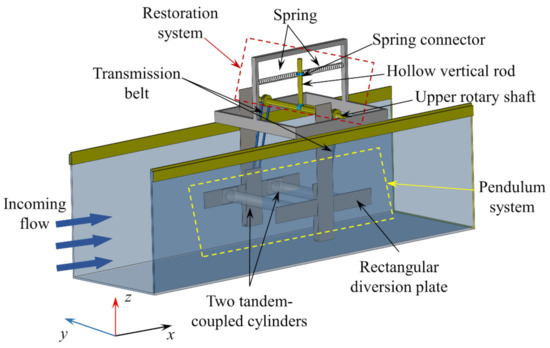
Figure 1.
Schematic diagram of the flow-induced rotation.
In order to facilitate the establishment of a mathematical model of the FIR system, the original system was divided into three subsystems: pendulum system, transmission system and restoration system.
2.2. Dynamic Model of Flow-Induced Rotation (FIR) System
2.2.1. Pendulum System
The pendulum system is the rotation part of the FIR system, including double circular cylinders in tandem arrangement and two rectangular diversion plates, as shown in Figure 1. The function of this diversion plate is to mechanically couple the cylinders and facilitate changing the spacing between the two cylinders. In the process of motion, the force of the pendulum system is shown in Figure 2, including the fluid force, Ffluid,up, on the upstream cylinder, the fluid force, Ffluid, down, on the downstream cylinder, the total torque, 2M1, provided by the left and right transmission belts, the torques generated by viscous traction acting on each cylinder surface, MVT,up and MVT,down, and the mechanical damping force (this force is not shown in Figure 2). According to this, the kinetic equation of the pendulum system is as follows:
where , and θ1 are the angular acceleration, angular velocity and angular displacement of the pendulum system, respectively, and is the damping coefficient of the pendulum system. J1 is the moment of inertia of the pendulum system to the rotary shaft O. L is the center distance of the upstream and downstream cylinders. M1 is the torque provided by a single transmission belt.
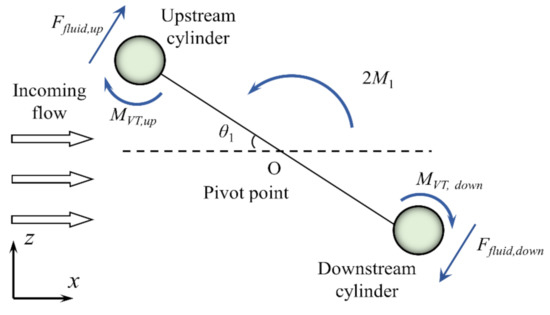
Figure 2.
Force analysis of pendulum system.
According to previous research, the Ffluid acting on the structure includes two parts: the inertial force, Finviscid, and the viscous force, Fviscous [50]. Obviously, the Finviscid on the upstream and downstream cylinders is the same and the torques of Finviscid to shaft O is calculated as follows:
where is the additional moment of inertia of the pendulum system to the rotary shaft O. However, the torques of Fviscous on the upstream and downstream cylinders to shaft O are calculated as follows:
where and is the instantaneous lift coefficient of the upstream and downstream cylinders, respectively, and Ρ is the fluid density. U is the incoming flow velocity. D is the diameter of the circular cylinder. H is the length of the cylinder. Additionally, it is clear that MVT,up and MVT,down, acting on the upstream and downstream cylinders, are equal, namely, MVT,up = MVT,down = MVT. The shear stress acting on the surface of each cylinder is named , and the expression of is:
where Cf is the friction resistance coefficient of the boundary layer on the cylinder surface, Cf = f(Re). By calculating the definite integral of the cylinder surface, the expression of MVT can be obtained as:
By substituting Equation (5) into Equation (6), then the expression of MVT can be further expressed as:
Therefore, Equation (1) can be further expressed as:
2.2.2. Restoration System
The restoration system is the part that provides restoring force. The restoring mechanism of the apparatus consists of two tension springs, the spring connector [43,44], the hollow vertical rod and the upper rotary shaft, P. The force of the restoration system after rotation through the angle θ2 includes the total restoring force, 2Fk, of the spring, the total torque, 2M2, provided by the left and right transmission belts and the mechanical damping force, as shown in Figure 3. According to this, the kinetic equation of restoration system is as follows:
where , and θ2 are the angular acceleration, angular velocity and angular displacement of the restoration system, respectively. is the moment of inertia of restoration system with respect to upper shaft, P, and is the mechanical damping coefficient of the restoration system. B is the distance between the upper rotating shaft and the spring connector when the restoration system is in the initial position (θ2 = 0).
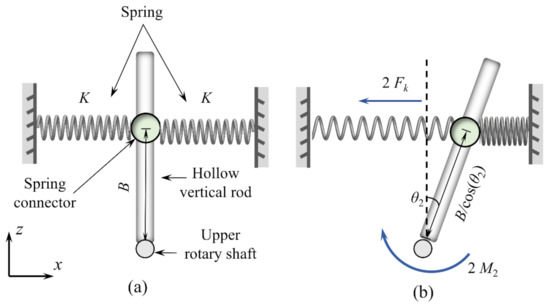
Figure 3.
Force analysis of restoration system: (a) Equilibrium position; (b) Force after rotation angle θ2.
The restoring force, Fk, produced by a single spring is expressed as:
where K is the stiffness of a single spring. Therefore, the final dynamic equation of the restoration system is:
2.2.3. Transmission System
The transmission system is the transfer motion part of the FIR system, which includes the left and right two transmission belts and the matching driving wheels. In the process of motion, the force of a single transmission belt and the matching driving wheels are shown in Figure 4a, including the torque, , provided by the pendulum system and the torque, , provided by the restoration system.
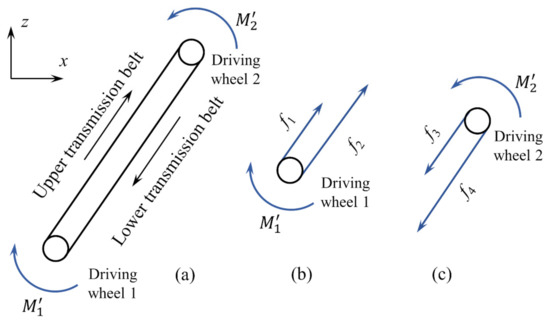
Figure 4.
Force analysis of transmission system: (a) The force of a single transmission belt and the matching driving wheels; (b) The force of the driving wheel 1; (c) The force of the driving wheel 2.
The force of wheel 1 is shown in Figure 4b, including the torque, , provided by pendulum system, the tension, , provided by the upper transmission belt and the tension, , provided by the lower transmission belt. Then, the dynamic equation of wheel 1 is as follows:
where Jwheel,1 is the moment of inertia of the driving wheel 1 around its own central axis. R1 is the radius of wheel 1.
In the same way, the force of wheel 2 is shown in Figure 4c, including the torque, , provided by restoration system, the tension, , provided by the upper transmission belt and the tension, , provided by the lower transmission belt. Then, the dynamic equation of wheel 2 is as follows:
where Jwheel,2 is the moment of inertia of the driving wheel 2 around its own central axis. R2 is the radius of wheel 2. Additionally, the driving wheels 1 and 2 have consistent specifications () and small mass, so their moments of inertia can be ignored. Clearly, the equations and are true, hence, it is concluded that is established. In other words, the following equation is also true:
2.2.4. Total Kinetic Equation of FIR System
Since the geometric dimensions of the driving wheels 1 and 2 are exactly the same, the relation of speed ratio can be obtained as:
Both θ1 and θ2 are denoted by θ. Combined with Equation (14), the kinetic equation of the pendulum system is further defined as:
Based on the equation of the restoration system, the kinetic equation of the FIR system can be simplified as:
Definition and , hence, the kinetic equation of the FIR system is further written as:
Considering the large Reynolds number (2.0 × 10⁴ ≤ Re ≤ 9.7 × 10⁴) and small angular displacement (θ ≤ 30°) in this experiment, it can be preliminarily judged that the order of magnitude of the term containing in Equation (18) is small, so it is not, temporarily, considered in this paper, and the more explicit impact of this term on the FIR system is further analyzed in subsequent research. Therefore, Equation (18) can be further simplified as:
The dimensionless parameter damping ratio (ζtotal) and the natural frequency (fn,air) of the system in air are introduced, and the following equations are established:
Substituting Equations (20) and (21) into Equation (19) gives the final kinetic equation of the FIR system:
3. Experimental Methods
3.1. Physical Model
3.1.1. Recirculating Water Tunnel
All experiments were carried out in the recirculating water tunnel at Tianjin University. The test area of the tunnel had a width of 1.0 m, and a water depth of 1.34 m. The water in the tunnel was driven by a variable frequency power pump with a velocity range of 0.0–1.8 m/s, as shown in Figure 5. The differences in the flow velocity and turbulence in the vertical direction were small, which illustrated that the incoming flow in the test area of the circular cylinder was uniform [51]. Additionally, a rectifying grid was set in front of the test area to allow water flow to enter the test area smoothly. The test velocities were set at 0.229 m/s ≤ U ≤ 1.1 m/s, with the corresponding Reynolds numbers of 20,105 ≤ Re ≤ 96,575. It should be noted that Re is defined as Re = UD/ν, where U is the characteristic velocity of the flow field, which is the test velocity in this paper; D is the characteristic length of the flow field, which is the diameter of the circular cylinder in this paper; ν is the kinematic viscosity.
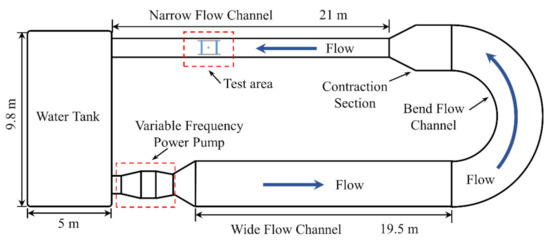
Figure 5.
Plan view schematic of the recirculating water tunnel.
The relevant parameters of the FIR experiment are shown in Table 1.

Table 1.
Test parameters.
3.1.2. Flow-Induced Rotation Device
The arrangement and details of the experimental physical model are shown in Figure 6. Additionally, the ratio of moment of inertia J* and other necessary parameters under each case are shown in Table 2. Here, the ratio of the moment of inertia J* is:
where is the total moment of inertia of the oscillation system, and is the total moment of inertia of the displaced mass of two tandem-coupled cylinders with respect to axis O.
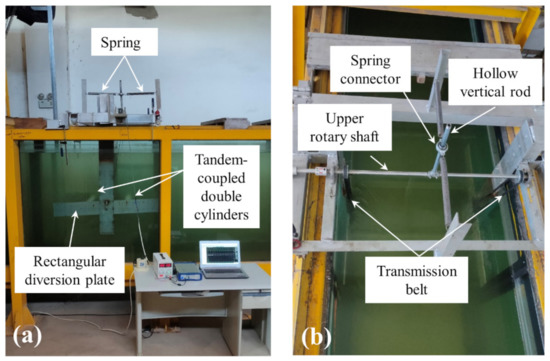
Figure 6.
Physical models of FIR system: (a) Front view; (b) Vertical view.
Table 2.
The parametric details of the experiments in this study.
3.1.3. Test Circular Cylinder
The specifications of the upstream and downstream test circular cylinders were consistent. The parameters of the cylindrical oscillator are listed in Table 3. It was made of polymethy1 methacrylate, and the interior was hollow to facilitate counterweight. Both ends of the oscillator were set with end plates of equal thickness to reduce the influence of boundary conditions in the test, as shown in Figure 7.
Table 3.
The parameters of the circular cylinder.
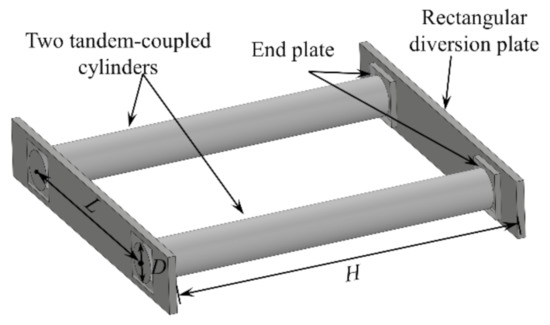
Figure 7.
Test circular cylinders.
3.2. Data Acquisition and Processing System
In the experiment, the rotational angular displacement θ was measured by a magnetic-sensitive angular displacement sensor. The measurement method involved connecting the rotating shaft of the sensor with the upper rotary shaft, P, by using shaft-coupling to ensure that they rotated synchronously, as shown in Figure 8b. The sensor could output a voltage signal proportional to the rotational angle, and the instantaneous voltage signal was captured by the data acquisition system, shown in Figure 8c. Finally, MATLAB software was used to process the recorded data. The sampling frequency was set to 50 Hz. Additionally, the oscillation frequency (fosc) of the FIR system was calculated by the Fast Fourier Transform (FFT) method under continuous oscillation for 60 s [18].
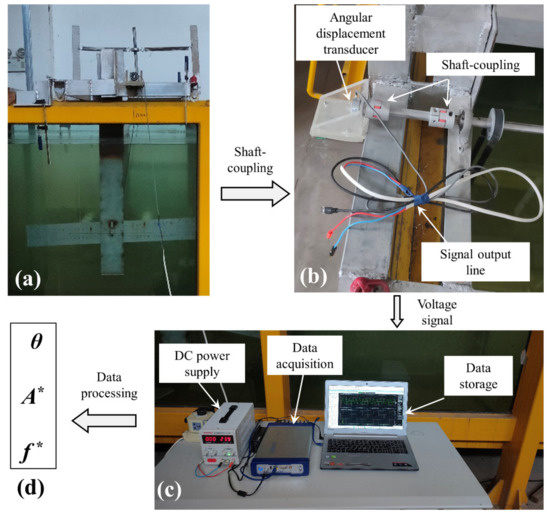
Figure 8.
Investigation process of flow-induced rotation: (a) The FIR system; (b) Angular displacement transducer; (c) Data acquisition and processing system; (d) Experimental data.
3.3. Free Decay Tests
Free decay tests, with different spacing ratios, were conducted to obtain the damping ratio (ζtotal) and natural frequency (fn,air) of the FIR system. The specific free decay test procedure was as follows:
First, the pendulum system was artificially deflected to a certain rotational angle under the condition of no water in the test water tunnel, and then released. Meanwhile, the test data was recorded with the help of a data acquisition system, shown in Figure 8c.
Four tests were performed at each L/D, and the average value of the four tests (ζtotal,ave and fn,air,ave) was used as the result. Figure 9a–d corresponded to the free decay curves with L/D = 4.0, 6.0, 7.0 and 9.0, respectively. The free decay test results of all cases were shown in Table 4 and Table 5. Here, the damping ratio ζtotal expression was defined as [18]:
where Ai is the ith peak of the free decay curve, and Ai+1 is the i+1th peak of the free decay curve. Additionally, the relative error of natural frequency between various cases was defined as:
where Casei is the natural frequency of the ith case, and Casei+1 is the natural frequency of the i+1th case. Moreover, the relative error of the damping ratio between various cases is defined as:
where Conditionj is the damping ratio of the ith working condition, and Conditionj+1 is the damping ratio of the j+1th working condition.
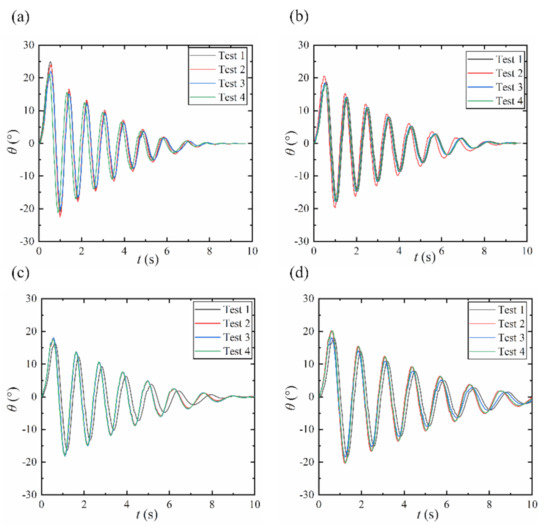
Figure 9.
Free decay curves: (a) L/D = 4.0; (b) L/D = 6.0; (c) L/D = 7.0; (d) L/D = 9.0.
Table 4.
Free decay test results of fn,air at various spacing ratios.
Table 5.
Free decay test results of ζtotal at various spacing ratios.
3.4. Validation of Mathematical Model
Figure 10 compares the experimentally measured results and calculated results of the natural frequency of the FIR system in air at different spacing ratios. The calculated result was obtained by substituting the Josc value in Table 2 into Equation (21). According to an analysis of Figure 10, there was little difference between the measured and the theoretical values of the natural frequency at each spacing ratio, and the relative errors (δ) were all less than 10%. The maximum δ was 6.86% in the case of L/D = 4.0. When L/D = 9.0, the δ was at its minimum, only 0.62%. Further analysis of Figure 10 shows that the calculated value of fn,air was larger than the measured value in each working condition, and the reason for this was that the masses of the transmission belt and driving wheel were omitted in the calculation process. The comparison results demonstrated that the present mathematical model for solving the natural frequency was reasonable, and could provide the theoretical basis for the following flow-induced rotation experiments.
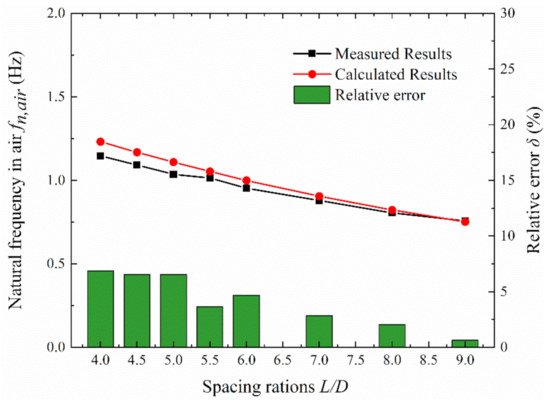
Figure 10.
Comparison between experimental and calculated values of system natural frequency.
4. Results and Discussion
The results for the flow-induced rotation characteristics of two mechanically coupled cylinders in tandem arrangement with various spacing ratios are presented and analyzed in this section.
4.1. L/D = 4.0 and 4.5
4.1.1. Rotation Response
The rotational oscillation response curves with L/D = 4.0 and 4.5 were areshown in Figure 11. Herein, the rotation arc length ratio A* (dimensionless parameter) was examined to characterize the oscillation level, and the calculation equation of A* was as follows:
where A is the average value of the peak of arc length in 60s of continuous oscillation. θmax is the average value of the peak of θ in 60s of continuous oscillation. L is the center distance of the upstream and downstream cylinders. D is the diameter of the circular cylinder.
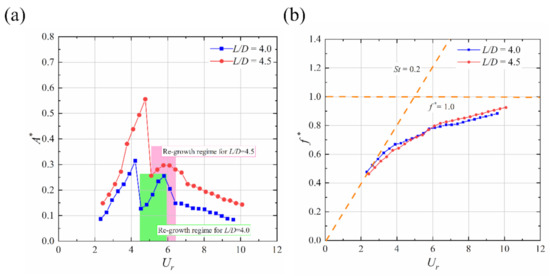
Figure 11.
Complete rotation response of FIR system at L/D = 4.0 and 4.5: (a) Arc length response; (b) Frequency response.
Additionally, the frequency ratio f* and reduced flow velocity Ur were defined as f* = fosc/fn,air and Ur = U/fn,air D, respectively.
(1) L/D = 4.0: in the range of 2.314 < Ur < 4.531, the A* first increased and, then, decreased sharply with increasing Ur, and the f* showed a continuous increase with the rise of Ur. The results showed that the rotational oscillation conformed to the response law of VIV and the maximum A* was 0.32 in this velocity range (in the complete A*–Ur curve, the first peak was named A*1st, and the second peak was named A*2nd, which meant A*1st,4.0 = 0.32). Nevertheless, as 4.531 < Ur < 5.798, the A* would present an increasing trend again, which meant that there was a re-growth region in the arc length responses. The reason might have been that with the increase of incoming flow velocity, the vortex shedding rate of the upstream cylinder was accelerated, which further promoted the rotational oscillation of the downstream cylinder, and finally led to the enhancement of the oscillation level of the two tandem-coupled cylinders. Note that the peak of A* could only reach 0.26 in this re-growth region (A*2nd,4.0 = 0.26). The results indicated that, although the arc length grew again at 4.531 < Ur < 5.798, it was actually still in the lower branch of VIV, which meant that the oscillation was still suppressed. Continuing to increase Ur until the maximum of the experiment (Ur = 9.599), resulted in a steady decrease in the A*. It showed that when Ur > 5.798, the rotational oscillation level of the FIR system decreased once again due to the suppression effect strengthening. The reason might be that, as the velocity continued to increase, the vortex shedding rate of the upstream cylinder became faster, resulting in the lower efficiency of reattachment to the downstream cylinder, and, finally, the overall oscillation level of the FIR system gradually decreasing.
(2) L/D = 4.5: for 2.430 < Ur < 5.093, the A* also showed the response law of firstincreasing and, then, decreasing. Meanwhile, the f* rose continuously. It was shown that the rotational vibration was also in line with the VIV in this velocity range. Additionally, as can be seen from Figure 11, A*1st,4.5 = 0.56, which was significantly higher than that when L/D = 4.0. When 5.093 < Ur < 6.091, the A* also had a tendency to grow again, just like when L/D = 4, but the secondary growth of L/D = 4.5 was less than L/D = 4.0, and it only increased to 0.3 (A*2nd,4.5 = 0.3). For Ur > 6.091, the A* started to show a downward trend. Further comparing the rotational oscillation responses of L/D = 4.0 and 4.5, it could be found that in the upper and lower branches of VIV, the A* of L/D = 4.5 was significantly higher than that of L/D= 4.0, indicating that the spacing of the two tandem-coupled cylinders had a significant effect on the arc length responses. Even if the spacing changed slightly, the rotational vibration response could vary considerably.
(3) Further analysis of the arc length response of L/D = 4.0 and 4.5 showed that with continuous increase of the test flow rate, the curve of A*–Ur had a sudden rise or fall, which meant that each branch of VIV had a clear dividing line. The reason might have been that the damping ratio of the FIR system at L/D = 4.0 and 4.5 belonged to the category of low damping ratio. The study by Khalak and Williamson [52] pointed out that when the damping ratio is small, the VIV response of the cylinder presents three obvious branches.
In summary, when the spacing ratio of the FIR system was 4.0 and 4.5, the flow-induced rotation response was similar to that of VIV response. Compared with the typical VIV rule, the difference was that, after the rotational vibration entered the lower branch of VIV, there was a re-growth region in the arc length response, and this region was no longer significant as the spacing ratio increased. Note that the vibration was also suppressed in this region.
4.1.2. Oscillation Time History and Spectral Characteristics
In order to further study the oscillation characteristics of the FIR system at L/D = 4.0 and 4.5, Figure 12 and Figure 13 show the time history and frequency spectra of the rotation angle (θ) at six typical velocities (U = 0.302 m/s, 0.483 m/s, 0.519 m/s, 0.592 m/s, 0.665 m/s and 0.882 m/s), respectively. The ordinate in the spectrum was normalized and the dominant oscillation frequency highlighted.
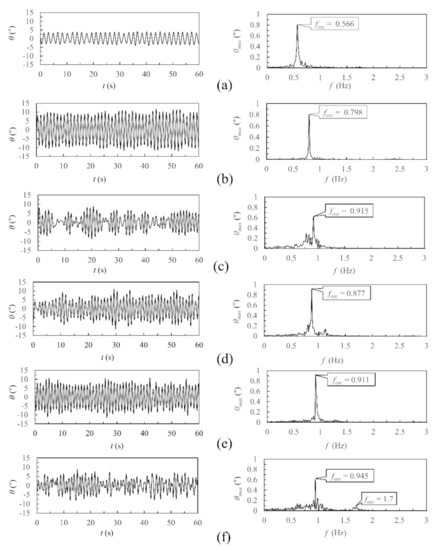
Figure 12.
Rotational oscillation time history and spectral characteristics at six typical velocities when L/D = 4.0: (a) U = 0.302m/s (Ur = 2.631); (b) U = 0.483 m/s (Ur = 4.215); (c) U = 0.519 m/s (Ur = 4.531); (d) U = 0.592 m/s (Ur = 5.165); (e) U = 0.665 m/s (Ur = 5.798); (f) U = 0.882m/s (Ur = 7.699).
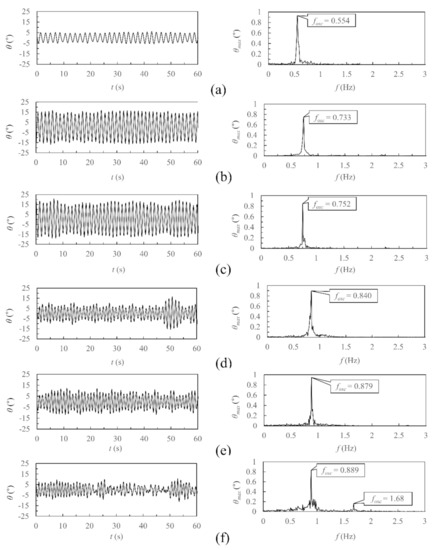
Figure 13.
Rotational oscillation time history and spectral characteristics at six typical velocities when L/D = 4.5: (a) U = 0.302 m/s (Ur = 2.764); (b) U = 0.483m/s (Ur = 4.428); (c) U = 0.519 m/s (Ur = 4.76); (d) U = 0.592 m/s (Ur = 5.426); (e) U = 0.665 m/s (Ur = 6.091); (f) U = 0.882 m/s (Ur = 8.088).
(1) U = 0.302m/s: It can be seen from the time history diagram that the θ of L/D = 4.0 and 4.5 was small at this flow rate, reaching only about 3.3° and 4.6°, respectively, and the waveform was relatively uniform. According to the spectrum analysis, the frequency bands of the two cases were narrow, the fosc values were 0.566 Hz and 0.554 Hz, respectively, and there were no frequency doubling characteristics. The results indicated that the rotational vibration was relatively stable and the oscillation energy was low at U = 0.302 m/s.
(2) U = 0.483 m/s: The waveforms of time history became more uniform and the θ increased remarkably in both cases, increasing to 10.5° and 12.6°, respectively. Additionally, it can be seen from the spectrum diagram that the values of the fosc of the two cases were higher than those of U = 0.302 m/s, and the frequency bands became narrower, indicating that the rotational oscillation of the two cases was stable and the vibration energy was concentrated at this velocity.
(3) U = 0.519 m/s: For L/D = 4.0, the θ began to decrease and the waveform of time history was disordered, the fosc increased to 0.915 Hz but the frequency band became wider, indicating that the rotary oscillation was suppressed and in an unstable state at U = 0.519 m/s. For L/D = 4.5, the θ was still growing, reaching about 14.2°. The fosc increased to 0.752 Hz and the frequency band was narrow, which suggested that the rotational vibration was not inhibited at this rate and the vibration was still fine. Further analysis of the time history and spectrum diagram with L/D = 4.0 found that the arc length response first increased and then decreased, and the frequency response continued to increase, indicating that the flow-induced rotation characteristics with L/D = 4.0 conformed to the VIV in the range of U = 0.302–0.519 m/s.
(4) U = 0.592 m/s: For L/D = 4.0, the waveform was unstable, but the θ rose slightly compared with that of U = 0.519 m/s. The frequency band was still wide. However, for L/D = 4.5, the waveform of time history became disorganized and the θ was significantly reduced. Additionally, the frequency band became wider and the fosc increased to 0.840 Hz. The results suggested that the rotational vibration with L/D = 4.5 was suppressed at U = 0.592 m/s. Meanwhile, it could also be concluded that for L/D = 4.5, the arc length response also first increased and then decreased when U = 0.302–0.592 m/s, and the dominant frequency always increased, which was also in line with the response law of VIV.
(5) U = 0.665 m/s: For L/D = 4.0, the θ continued to increase, reaching about 7.3°, but did not exceed the value reached at U = 0.483 m/s. Furthermore, compared with U = 0.592 m/s, the frequency band became narrower and the fosc increased to 0.911 Hz. For L/D = 4.5, the θ also increased, but the growth range was smaller than that of L/D = 4.0. The frequency band was narrow and the fosc increased to 0.879 Hz. The results showed that, for L/D = 4.0 and 4.5, after the vibration entered the lower branch of VIV, the arc length response tended to increase again, and the increase of L/D = 4.0 was more significant than that of L/D = 4.5.
(6) U = 0.882 m/s: It was found that the θ reduced in both cases and the waveforms were disordered. Meanwhile, the frequency bands of the two cases became wider, and both had the 2-fold frequency characteristic. This indicated that the rotary oscillations were significantly suppressed, the vibration was unstable and the vibration energy was dispersed at U = 0.882 m/s.
In brief, when L/D = 4.0 and 4.5, the rotation responses generally exhibited the similar VIV law. Differing from the typical VIV response, after the vibration entered the lower branch of VIV, the arc length response would appear as a re-growth region, and with the increase of spacing ratio, this region was no longer significant. The above results were consistent with the discussion of experimental results in Section 4.1.1.
4.2. L/D = 5.0, 5.5 and 6.0
4.2.1. Rotation Response
In this section, the rotation responses at L/D = 5.0, 5.5 and 6.0 are investigated. The complete response results are shown in Figure 14. The specific analyses are as follows:
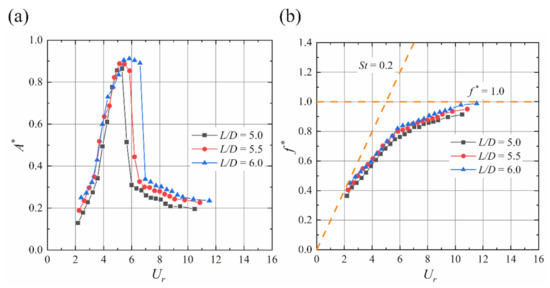
Figure 14.
Complete rotation response of FIR system at L/D = 5.0, 5.5 and 6.0: (a) Arc length response; (b) Frequency response.
(1) On the whole, in the entire test flow velocity range, the rotation responses of these three cases showed the typical VIV response law and there was no re-growth region. The A* first increased and then decreased sharply, as well as the f* increasing continuously with increase of Ur, which meant there was entering of the initial branch, the upper branch and the lower branch of VIV, in turn. Furthermore, the rotational oscillation responses of L/D = 5.0, 5.5 and 6.0 were characterized by longer arc length. The maximum A* of all three cases was more than 0.85, among which L/D = 6.0 was as high as 0.92, exceeding the A* of the VIV amplitude response of a single cylinder in the previous study [52]. It could be seen that when the distance between the two cylinders of FIR system increased from 4.5D to 5.0D, the rotation angle θ would increase significantly, which would greatly improve the oscillation level (arc length A).
(2) By carefully comparing the oscillation characteristics of these three cases, it could be seen that, in each branch of VIV, the A* showed a slight upward trend with the increase of L/D, implying that the case with L/D = 6.0 had a larger synchronization interval than the other two cases. Additionally, further analysis of the rotation response of L/D = 5.0, 5.5 and 6.0 showed that, when 4.0 < Ur < 5.5, the rotational oscillation was in the upper branch of VIV, and f* increased in this flow velocity range. Continuing to increase Ur, the growth rate of f* would slow down, and in the entire test velocity range, f* did not exceed 1.0. The reason might have been that the ratio of the moment of inertia J* of L/D = 5.0, 5.5 and 6.0 was still small (J* = 1.745–2.113). Even if the oscillation entered the nonlinear resonance zone when 4.0 < Ur < 5.5, the vibration frequency was not locked, but still showed an increasing trend. When Ur > 5.5, the rate of growth slowed, which was consistent with the research results of Kraghvav [53].
In general, when the spacing ratios of the two tandem-coupled cylinders were 5.0, 5.5 and 6.0, the oscillation responses all showed the typical VIV law and were characterized by high oscillation levels. Additionally, the vibration structure with L/D = 6.0 was more suitable for flow-induced motion power generation, because of its the longer arc length and the wider range of synchronization intervals.
4.2.2. Oscillation Time History and Spectral Characteristics
Similarly, in order to further study the vibrational characteristics of the FIR system with L/D = 5.0, 5.5 and 6.0, three typical flow velocities (U = 0.302 m/s, 0.556 m/s and 0.810 m/s) were selected for each working condition, to analyze the time history and spectral characteristics of the rotation angle θ, as shown in Figure 15, Figure 16 and Figure 17, respectively.
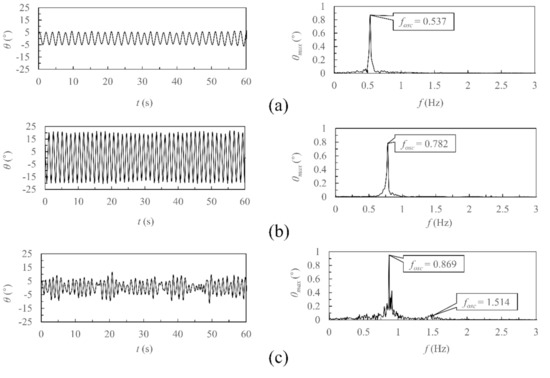
Figure 15.
Rotational oscillation time history and spectral characteristics at three typical velocities when L/D = 5.0: (a) U = 0.302 m/s (Ur = 2.877); (b) U = 0.556 m/s (Ur = 5.302); (c) U = 0.810 m/s (Ur = 7.726).
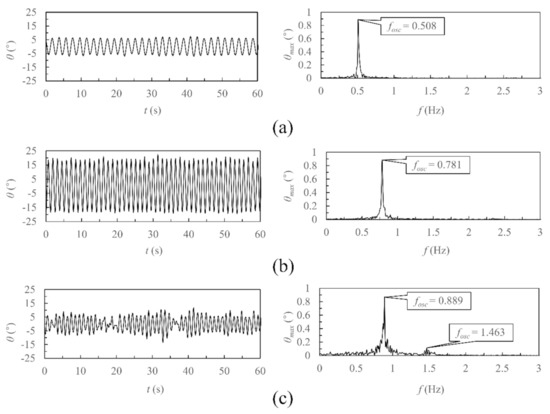
Figure 16.
Rotational oscillation time history and spectral characteristics at three typical velocities when L/D = 5.5: (a) U = 0.302 m/s (Ur = 2.975); (b) U = 0.556 m/s (Ur = 5.483); (c) U = 0.810 m/s (Ur = 7.991).
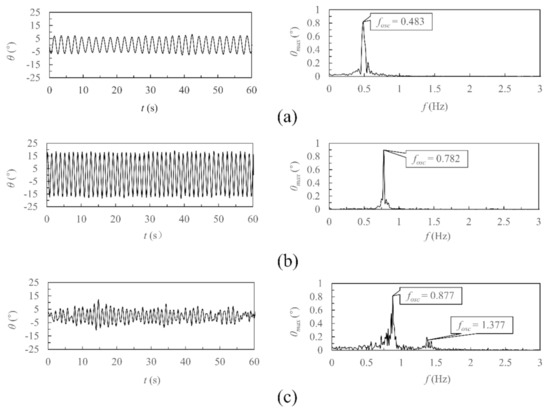
Figure 17.
Rotational oscillation time history and spectral characteristics at three typical velocities when L/D = 6.0: (a) U = 0.302 m/s (Ur = 3.164); (b) U = 0.556 m/s (Ur = 5.83); (c) U = 0.810 m/s (Ur = 8.496).
(1) U = 0.302 m/s: At this flow velocity, there was no significant difference in the time history of the three cases. The waveforms were stable and the θ value was low, all maintained at about 5.8°. The frequency bands were narrow and no frequency doubling features appeared. This indicated that the rotational oscillations of these three cases were relatively stable and the vibration energies were small. On the other hand, it could be seen that, when L/D = 5.0, 5.5 and 6.0, the FIR system started to vibrate with a smaller flow rate, and when the velocity reached 0.302 m/s, rotational vibration of a lower level would occur.
(2) U = 0.556 m/s: The analysis of the time history showed that the waveforms of the three cases were stable. Compared with that of U = 0.302 m/s, the θ all increased significantly and could reach about 18.5°. Additionally, as can be seen from the spectral diagram, the fosc of each case was obvious and increased to 0.782 Hz, 0.781 Hz and 0.782 Hz. The rotational oscillations were stable and energies concentrated at this flow velocity.
(3) U = 0.810 m/s: The change of time history of the three cases was similar, the θ decreased significantly and the waveforms were disordered. Meanwhile, the fosc of each case continued to increase, the frequency band became wider and there were 2-fold frequency doubling characteristics. The results indicated that, when U = 0.810 m/s, the rotational oscillation was suppressed significantly and it was unstable.
Comprehensive analysis of the oscillation time history and spectrum characteristics of the FIR system with L/D = 5.0, 5.5 and 6.0 showed that, at these three typical velocities, the θ first increased and then decreased, and the fosc continued to increase, which was consistent with the typical response law of VIV. The rotational vibration of these three working conditions could reach a high level because of the larger rotation angle.
4.3. L/D = 7.0, 8.0 and 9.0
4.3.1. Rotation Response
This section analyzes and summarizes the rotation characteristics when L/D = 7.0, 8.0 and 9.0. Figure 18 presents the rotational vibration responses of the FIR system at these three spacing ratios. The specific analysis is as follows:
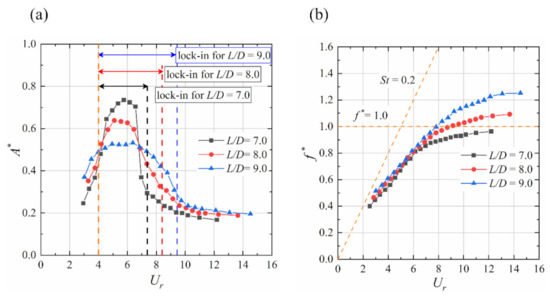
Figure 18.
Complete rotation response of FIR system at L/D = 7.0, 8.0 and 9.0: (a) Arc length response; (b) Frequency response.
(1) On the whole, within the test flow rate range, the rotational responses of these three cases still showed the typical VIV law. With the increase of Ur, the A* first increased and then decreased, while the f* presented continuous growth. Additionally, the maximum A* was 0.53–0.72 at these three spacing ratios, which was lower than the value when L/D = 5.0, 5.5 and 6.0, indicating that, when the distance between two cylinders exceeded 0.6 m (corresponding to L/D = 6.0), the oscillation level of the FIR system would decrease instead. By analyzing the definition of arc length ratio, A*, it was found that when L/D > 6.0, the θ would be significantly reduced, resulting in the A* being unable to reach the previous level, which indicated that the distance between the two cylinders should be controlled within a reasonable range to ensure the rotational oscillation reached an ideal level. Additionally, the range of synchronization interval at L/D = 7.0, 8.0 and 9.0 was significantly larger than those in the other cases. This meant that the FIR system with L/D = 7.0, 8.0 and 9.0 had stronger adaptability to the current velocity and was more favorable to FIM power generation.
(2) Comparing the A*–Ur curves of the three cases, it could be seen that in the initial and lower branches of VIV, the A* increased with the increase of L/D, while in the upper branch of VIV, the A* decreased with the increase of L/D, indicating that the relationship between the size of the synchronization interval in the three cases was as follows: L/D = 9.0 was the largest, followed by L/D = 8.0, and L/D = 7.0, which was the smallest. Further analyzing the frequency responsed of these three working conditions, it was found that when Ur > 8.5, the f* value of L/D = 8.0 and 9.0 exceeded 1.0 (f* > 1.0), and f* continued to increase with increase of Ur. The reason might have been that, when L/D = 8.0 and 9.0, the rotational oscillation would also enter the nonlinear resonance zone, but the characteristics of nonlinear resonance zone of these two cases were different from those when L/D ≤ 7.0. The specific performance was such that the oscillation frequency was no longer locked, but continued to increase with the increase of Ur until f* > 1.0. It should be noted that at this time, the locked interval of arc length response still existed and becames significantly wider. This phenomenon was highly similar to the research results of Kraghvav [53].
In conclusion, when the spacing ratios of two tandem-coupled cylinders were 7.0, 8.0 and 9.0, the rotation responses still presenteds the typical VIV law. Compared with other cases, the rotational oscillation in these three cases were at a medium level, and the maximum A* was between 0.53 and 0.72. Another notable characteristic of the rotation response was that the range of synchronization interval was larger, and this range tended to increase with the increase of L/D. Furthermore, it should be noted that the longer arc length response could only be generated when the distance between the two cylinders of the FIR system was in a rational range.
4.3.2. Oscillation Time History and Spectral Characteristics
In order to further understand the rotational oscillation characteristics of the FIR system when L/D = 7.0, 8.0 and 9.0, herein, four typical velocities (U = 0.265 m/s, 0.483 m/s, 0.628 m/s and 0.810 m/s) were selected for each L/D to analyze the time history and spectral characteristics of θ, as shown in Figure 19, Figure 20 and Figure 21, respectively. The specific analysis is as follows:
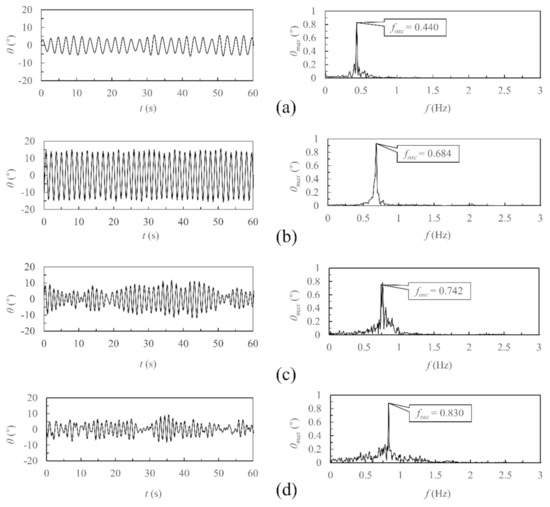
Figure 19.
Rotational oscillation time history and spectral characteristics at L/D = 7.0: (a) U = 0.265 m/s (Ur = 2.940); (b) U = 0.483 m/s (Ur = 5.355); (c) U = 0.628 m/s (Ur = 6.965); (d) U = 0.810 m/s (Ur = 8.977).
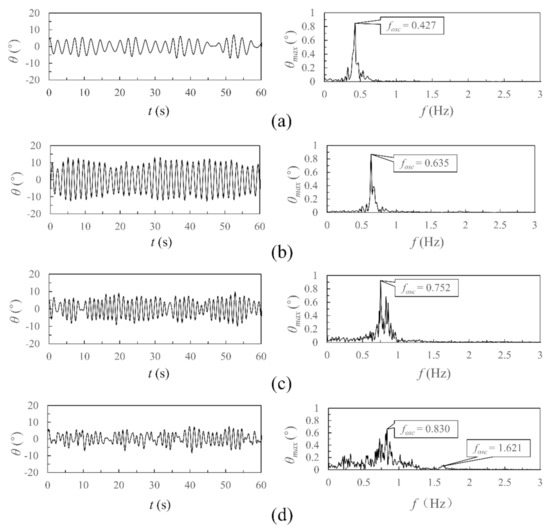
Figure 20.
Rotational oscillation time history and spectral characteristics at L/D = 8.0: (a) U = 0.265 m/s (Ur = 3.29); (b) U = 0.483 m/s (Ur = 5.993); (c) U = 0.628 m/s (Ur =7.794); (d) U = 0.810 m/s (Ur = 10.046).
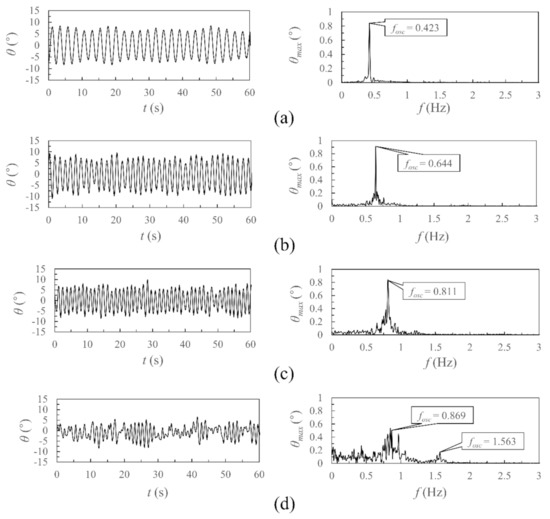
Figure 21.
Rotational oscillation time history and spectral characteristics at L/D = 9.0: (a) U = 0.265 m/s (Ur = 3.499); (b) U = 0.483 m/s (Ur = 6.372); (c) U = 0.628 m/s (Ur = 2.288); (d) U = 0.810 m/s (Ur = 10.682).
(1) U = 0.265 m/s: It can be seen from the time-history diagram that the θ of the three cases was small at this velocity. The cases of L/D = 7.0 and 8.0 maintained about 4.6°, while the case of L/D = 9.0 could reach 5.8°. Furthermore, it can be seen from the spectrogram that no frequency doubling occurred, but the frequency band was wide, which indicated that the vibration of the three cases was in an unstable state and the energy was not concentrated.
(2) U = 0.483 m/s: Firstly, compared with the time history diagram when U = 0.265 m/s, it could be found that the θ of L/D = 7.0 and 8.0 were greatly improved, increasing to about 11.8° and 8.9°, respectively, while the θ of L/D = 9.0 only increased slightly to 6.7°. Additionally, the waveforms of the three cases at this flow rate were uniform. Then, the analysis of the spectral diagram shows that the fosc of the three cases at this flow velocity were also increased, compared with that at U = 0.265 m/s, the frequency band narrowed, and there was no frequency doubling phenomenon. This showed that the rotational vibration becames stable and the vibrational energy was large.
(3) U = 0.628 m/s: When U increased to 0.628 m/s, it can be seen from the time history diagram that the waveforms of L/D = 7.0 and L/D = 8.0 became disordered, while the waveform of L/D = 9.0 was relatively stable. Meanwhile, the θ of L/D = 7.0 decreased sharply to about 6.1°, while the θ of L/D = 8.0 and 9.0 decreased slightly to about 5.5° and 5.9°, respectively. By analyzing the spectral diagram, it could be found that the fosc of the three cases continued to increase and the frequency band became wider than that of U = 0.483 m/s.
Comprehensive analysis of the time history and frequency spectral characteristics of the FIR system with L/D = 7.0, 8.0 and 9.0 at the above three typical flow rates, indicated that, with the increase of the test flow rate, the θ of the three cases first increased and then decreased, and the fosc kept increasing, which meant that the three cases all showed the response law of VIV. After entering the lower branch of VIV, the suppression effect of L/D = 7.0 was most significant, followed by L/D = 8.0, and was the smallest when L/D = 9.0, which led to the relationship between the range of synchronous intervals of the three cases such that L/D = 9.0 was the largest, L/D = 8.0 was second and L/D = 7.0 was the smallest.
(4) U = 0.810 m/s: When U increased to 0.810 m/s, the θ of L/D = 7.0, 8.0 and 9.0 all decreased to about 3.5° and the waveforms of the time history were all out of order. Meanwhile, the frequency bands became wider and there were the characteristics of frequency doubling, indicating that, after the vibration response of these three cases entered the lower branch of VIV, there was no “re-growth region”, and the vibration was still very unstable.
In conclusion, when the spacing ratios of the FIR system were 7.0, 8.0 and 9.0, the rotational oscillation responses presented the typical VIV law, and the range of the synchronization interval increased with increase of L/D. The result corresponds to the rotation response shown in Figure 18a, which proved the authenticity of the experimental results obtained.
5. Conclusions
In this paper, an experimental investigation on the flow-induced rotation (FIR) of two mechanically tandem-coupled cylinders at different spacing ratios (L/D) was carried out with the help of a self-circulating water tank. The Reynolds number ranged from 20,105 to 96,575. The complete rotation responses of the FIR system with L/D = 4.0–9.0 were analyzed emphatically. The major conclusions are as follows:
(1) For L/D = 4.0 and 4.5: The rotation response of the FIR system is similar to the VIV response, on the whole. The rotational oscillation is at a low level and the maximum arc length ratio (A*) is less than 0.56. Compared with the typical VIV response, the difference is that the arc length response appears as a re-growth region with the increase of velocity after entering the lower branch of VIV, but the oscillation is still suppressed in this region. As L/D increases, the re-growth region is no longer significant.
(2) For L/D = 5.0, 5.5 and 6.0: The rotation responses of the FIR system present the typical VIV response, and the oscillation reaches a high level with the maximum A* exceeding 0.85. Additionally, the vibration structure with L/D = 6.0 is more suitable for flow-induced motion power generation because of the longer arc length and the wider range of synchronization interval.
(3) For L/D = 7.0, 8.0 and 9.0: The rotation responses still show the VIV law. The oscillation is at the medium level, and the maximum A* is between 0.53 and 0.72. Compared with the other cases, the oscillation response of these three cases have a wider range of synchronization interval, and the range shows an increasing trend with the growth of the spacing ratio.
In this paper, the flow-induced rotation characteristics of two tandem-coupled cylinders at different spacing ratios were investigated. Nevertheless, the two key parameter and in Equation (22) were not actually measured in the existing experiments. A torque sensor will be introduced to measure these two parameters in future research. Additionally, the more definite influence of the term containing in Equation (18) on the FIR system will also be a focus of subsequent research. Finally, a generator will be installed, on the basis of the present experimental device, to evaluate the power generation level of the FIR system. Meanwhile, the new system’s dynamic equation can be further analyzed and solved after considering the generator damping.
Author Contributions
Conceptualization, F.L. and X.Y.; methodology, F.L., W.F., X.Y., D.R. and N.S.; software, W.F., X.Y., X.W. and D.Y.; validation, W.F., X.Y. and D.R.; formal analysis, F.L., W.F. and W.F.; investigation, W.F. and X.Y.; resources, F.L. and X.Y.; data curation, F.L., W.F. and X.Y.; writing—original draft preparation, W.F.; writing—review and editing, F.L., X.Y., D.R., N.S., X.W. and D.Y.; visualization, W.F. and X.Y.; supervision, F.L. and X.Y.; project administration, F.L. and X.Y.; funding acquisition, F.L. and X.Y. All authors have read and agreed to the published version of the manuscript.
Funding
This research was funded by the National Natural Science Foundation of China, grant number 51909190.
Institutional Review Board Statement
Not applicable.
Informed Consent Statement
Not applicable.
Data Availability Statement
The data presented in this study are available on request from the corresponding author. The data are not publicly available, due to privacy.
Acknowledgments
The authors would like to thank the peer reviewers and editors for their hard work and constructive feedback, which made a significant contribution to improving the paper.
Conflicts of Interest
The authors declare no conflict of interest.
References
- Mohamed, A.; Zaki, S.A.; Shirakashi, M.; Ali, M.S.; Samsudin, M.Z. Experimental investigation on vortex-induced vibration and galloping of rectangular cylinders of varying side ratios with a downstream square plate. J. Wind Eng. Ind. Aerodyn. 2021, 211, 104563. [Google Scholar] [CrossRef]
- Hong, K.S.; Shah, U.H. Vortex-induced vibrations and control of marine risers: A review. Ocean Eng. 2018, 152, 300–315. [Google Scholar] [CrossRef]
- Xu, W.; Ji, C.; Sun, H.; Ding, W.; Bernitsas, M.M. Flow-induced vibration of two elastically mounted tandem cylinders in cross-flow at subcritical Reynolds numbers. Ocean Eng. 2019, 173, 375–387. [Google Scholar] [CrossRef]
- Liu, G.; Li, H.; Qiu, Z.; Leng, D.; Li, Z.; Li, W. A mini review of recent progress on vortex-induced vibrations of marine risers. Ocean Eng. 2020, 195, 106704. [Google Scholar] [CrossRef]
- Leng, D.; Liu, D.; Li, H.; Jin, B.; Liu, G. Internal flow effect on the cross-flow vortex-induced vibration of marine risers with different support methods. Ocean Eng. 2022, 257, 111487. [Google Scholar] [CrossRef]
- Hwang, Y.C.; Kim, S.; Kim, H.K. Cause investigation of high-mode vortex-induced vibration in a long-span suspension bridge. Struct. Infrastruct. Eng. 2020, 16, 84–93. [Google Scholar] [CrossRef]
- Khan, H.H.; Islam, M.D.; Fatt, Y.Y.; Janajreh, I.; Alam, M.M. Flow-induced vibration on two tandem cylinders of different diameters and spacing ratios. Ocean Eng. 2022, 258, 111747. [Google Scholar] [CrossRef]
- Yan, B.; Ren, H.; Li, D.; Yuan, Y.; Li, K.; Yang, Q.; Deng, X. Numerical Simulation for Vortex-Induced Vibration (VIV) of a High-Rise Building Based on Two-Way Coupled Fluid-Structure Interaction Method. Int. J. Struct. Stab. Dyn. 2022, 22, 2240010. [Google Scholar] [CrossRef]
- Bearman, P.W. Vortex shedding from oscillating bluff bodies. Annu. Rev. Fluid Mech. 1984, 16, 195–222. [Google Scholar] [CrossRef]
- Sarpkaya, T. A critical review of the intrinsic nature of vortex-induced vibrations. J. Fluids Struct. 2004, 19, 389–447. [Google Scholar]
- Allen, J.J.; Smits, A.J. Energy harvesting eel. J. Fluids Struct. 2001, 15, 629–640. [Google Scholar] [CrossRef]
- Taylor, G.W.; Burns, J.R.; Kammann, S.A.; Powers, W.B.; Welsh, T.R. The energy harvesting eel: A small subsurface ocean/river power generator. IEEE J. Ocean. Eng. 2001, 26, 539–547. [Google Scholar] [CrossRef]
- Pobering, S.; Schwesinger, N. A novel hydropower harvesting device. In Proceedings of the International Conference on MEMS, NANO and Smart System, Banff, AB, Canada, 25–27 August 2004. [Google Scholar]
- Bernitsas, M.M.; Raghavan, K.; Ben-Simon, Y.; Garcia, E.M.H. VIVACE (Vortex Induced Vibration Aquatic Clean Energy): A new concept in generation of clean and renewable energy from fluid flow. J. Offshore Mech. Arct. Eng. 2008, 130, 041101. [Google Scholar] [CrossRef]
- Bernitsas, M.M.; Ben-Simon, Y.; Raghavan, K.; Garcia, E.M.H. The VIVACE converter: Model tests at high damping and Reynolds number around 105. J. Offshore Mech. Arct. Eng. 2009, 131, 011102. [Google Scholar] [CrossRef]
- Raghavan, K.; Bernitsas, M.M. Experimental investigation of Reynolds number effect on vortex induced vibration of rigid circular cylinder on elastic supports. Ocean Eng. 2011, 38, 719–731. [Google Scholar] [CrossRef]
- Lee, J.H.; Bernitsas, M.M. High-damping, high-Reynolds VIV tests for energy harnessing using the VIVACE converte. Ocean Eng. 2011, 38, 1697–1712. [Google Scholar] [CrossRef]
- Shao, N.; Xu, G.; Liu, F.; Yan, X.; Wang, X.; Deng, H.; Zheng, Z. Experimental Study on the Flow-Induced Motion and Hydrokinetic Energy of Two T-section Prisms in Tandem Arrangement. Appl. Sci. 2020, 10, 1136. [Google Scholar] [CrossRef]
- Liu, M.; Wang, H.; Shao, F.; Jin, X.; Tang, G.; Yang, F. Numerical investigation on vortex-induced vibration of an elastically mounted circular cylinder with multiple control rods at low Reynolds number. Appl. Ocean Res. 2022, 118, 102987. [Google Scholar] [CrossRef]
- Chen, W.; Ji, C.; Xu, D.; Alam, M.M. Three-dimensional direct numerical simulations of two interfering side-by-side circular cylinders at intermediate spacing ratios. Appl. Ocean Res. 2022, 123, 103162. [Google Scholar] [CrossRef]
- King, R.; Johns, D.J. Wake interaction experiments with two flexible circular cylinders in flowing water. J. Sound Vib. 1976, 45, 259–283. [Google Scholar] [CrossRef]
- Zdravkovich, M.M. Review of flow interference between two circular cylinders in various arrangements. J. Fluids Eng. 1977, 99, 618–633. [Google Scholar] [CrossRef]
- Zdravkovich, M.M. Flow induced oscillations of two interfering circular cylinders. J. Sound Vib. 1985, 101, 511–521. [Google Scholar] [CrossRef]
- Zdravkovich, M.M. The effects of interference between circular cylinders in cross flow. J. Fluids Struct. 1987, 1, 239–261. [Google Scholar] [CrossRef]
- Igarashi, T. Characteristics of the flow around two circular cylinders arranged in tandem: 1st report. Bull. JSME 1981, 24, 323–331. [Google Scholar] [CrossRef]
- Bokaian, A.; Geoola, F. Wake-induced galloping of two interfering circular cylinders. J. Fluid Mech. 1984, 146, 383–415. [Google Scholar] [CrossRef]
- Bokaian, A.; Geoola, F. Wake displacement as cause of lift force on cylinder pair. J. Eng. Mech. 1985, 111, 92–99. [Google Scholar] [CrossRef]
- Yao, X.; Chen, Q.; Xu, W. Experimental research on two circular cylinders in tandem arrangements at critical Reynolds numbers. J. Vib. Eng. 1994, 7, 17–22. [Google Scholar]
- Mahir, N.; Rockwell, D. Vortex formation from a forced system of two cylinders. Part I: Tandem arrangement. J. Fluids Struct. 1996, 10, 473–489. [Google Scholar] [CrossRef]
- Mahir, N.; Rockwell, D. Vortex formation from a forced system of two cylinders. Part II: Side-by-side arrangement. J. Fluids Struct. 1996, 10, 491–500. [Google Scholar] [CrossRef]
- Brika, D.; Laneville, A. Wake interference between two circular cylinders. J. Wind Eng. Ind. Aerodyn. 1997, 72, 61–70. [Google Scholar] [CrossRef]
- Meneghini, J.R.; Saltara, F.; Siqueira, C.L.R.; Ferrarijr, J.A. Numerical simulation of flow interference between two circular cylinders in tandem and side-by-side arrangements. J. Fluids Struct. 2001, 15, 327–350. [Google Scholar] [CrossRef]
- Lin, J.C.; Yang, Y.; Rockwell, D. Flow past two cylinders in tandem: Instantaneous and averaged flow structure. J. Fluids Struct. 2002, 16, 1059–1071. [Google Scholar] [CrossRef]
- Zhou, Y.; Yiu, M.W. Flow structure, momentum and heat transport in a two-tandem-cylinder wake. J. Fluid Mech. 2006, 548, 17–48. [Google Scholar] [CrossRef]
- Prasanth, T.K.; Mittal, S. Flow-induced oscillation of two circular cylinders in tandem arrangement at low Re. J. Fluids Struct. 2009, 25, 1029–1048. [Google Scholar] [CrossRef]
- Prasanth, T.K.; Mittal, S. Vortex-induced vibration of two circular cylinders at low Reynolds number. J. Fluids Struct. 2009, 25, 731–741. [Google Scholar] [CrossRef]
- Assi, G.R.S.; Meneghini, J.R.; Aranha, J.A.P.; Bearman, P.W.; Casaprima, E. Experimental investigation of flow-induced vi-bration interference between two circular cylinders. J. Fluids Struct. 2006, 22, 819–827. [Google Scholar] [CrossRef]
- Assi, G.R.S.; Bearman, P.W.; Meneghini, J.R. On the wake-induced vibration of tandem circular cylinders: The vortex interaction excitation mechanism. J. Fluid Mech. 2010, 661, 365–401. [Google Scholar] [CrossRef]
- Bao, Y.; Huang, C.; Zhou, D.; Tu, J.; Han, Z. Two-degree-of-freedom flow-induced vibrations on isolated and tandem cylinders with varying natural frequency ratios. J. Fluids Struct. 2012, 35, 50–75. [Google Scholar] [CrossRef]
- Ji, C.; Chen, W.; Huang, J.; Xu, W. Numerical investigation on flow-induced vibration of two cylinders in tandem arrangements and its coupling mechanisms. Acta Mech. Sin. 2014, 46, 862–870. [Google Scholar]
- Chen, W.; Ji, C.; Williams, J.; Xu, D.; Yang, L.; Cui, Y. Vortex-induced vibrations of three tandem cylinders in laminar crossflow: Vibration response and galloping mechanism. J. Fluids Struct. 2018, 78, 215–238. [Google Scholar] [CrossRef]
- Qin, B.; Alam, M.M.; Ji, C.; Liu, Y.; Xu, S. Flow-induced vibrations of two cylinders of different natural frequencies. Ocean Eng. 2018, 155, 189–200. [Google Scholar] [CrossRef]
- Arionfard, H.; Nishi, Y. Flow-induced vibrations of two mechanically coupled pivoted circular cylinders: Characteristics of vibration. J. Fluids Struct. 2018, 80, 165–178. [Google Scholar] [CrossRef]
- Arionfard, H.; Nishi, Y. Flow-induced vibration of two mechanically coupled pivoted circular cylinders: Vorticity dynamics. J. Fluids Struct. 2018, 82, 505–519. [Google Scholar] [CrossRef]
- Zhu, H.; Tang, T.; Alam, M.M.; Song, J.; Zhou, T. Flow-induced rotation of a circular cylinder with a detached splitter plate and its bifurcation behavior. Appl. Ocean Res. 2022, 122, 103150. [Google Scholar] [CrossRef]
- Chen, L.; Wu, G. Vortex-induced three-degree-of-freedom vibration of a piggyback circular cylinder system. Appl. Ocean Res. 2022, 123, 103145. [Google Scholar] [CrossRef]
- Ding, L.; Bernitsas, M.M.; Kim, E.S. 2-D URANS vs. experiments of flow induced motions of two circular cylinders in tandem with passive turbulence control for 30,000 <Re <105,000. Ocean Eng. 2013, 72, 429–440. [Google Scholar]
- Kim, E.S.; Bernitsas, M.M. Performance prediction of horizontal hydrokinetic energy converter using multiple-cylinder synergy in flow induced motion. Appl. Energy 2016, 170, 92–100. [Google Scholar] [CrossRef]
- Sun, H.; Ma, C.; Kim, E.S.; Nowakowski, G.; Mauer, E.; Bernitsas, M.M. Hydrokinetic energy conversion by two rough tandem-cylinders in flow induced motions: Effect of spacing and stiffness. Renew. Energy 2017, 107, 61–80. [Google Scholar] [CrossRef]
- Williamson, C.H.K.; Govardhan, R. Vortex-induced vibrations. Annu. Rev. Fluid Mech. 2004, 36, 413–455. [Google Scholar] [CrossRef]
- Shao, N.; Lian, J.; Xu, G.; Liu, F.; Deng, H.; Ren, Q.; Yan, X. Experimental investigation of flow-induced motion and energy conversion of a T-section prism. Energies 2018, 11, 2035. [Google Scholar] [CrossRef]
- Khalak, A.; Williaamson, C.H.K. Fluid forces and dynamics of a hydroelastic structure with very low mass and damping. J. Fluids Struct. 1997, 11, 973–982. [Google Scholar] [CrossRef]
- Raghavan, K. Energy Extraction from a Steady Flow Using Vortex Induced Vibration. Ph.D. Thesis, University of Michigan, Ann Arbor, MI, USA, 2007. [Google Scholar]
Publisher’s Note: MDPI stays neutral with regard to jurisdictional claims in published maps and institutional affiliations. |
© 2022 by the authors. Licensee MDPI, Basel, Switzerland. This article is an open access article distributed under the terms and conditions of the Creative Commons Attribution (CC BY) license (https://creativecommons.org/licenses/by/4.0/).