Abstract
Landslide susceptibility assessment is an effective non-engineering landslide prevention at the regional scale. This study aims to improve the accuracy of landslide susceptibility assessment by using an optimized statistical index (SI) method. A landslide inventory containing 493 historical landslides was established, and 20 initial influencing factors were selected for modeling. First, a combination of GeoDetector and recursive feature elimination was used to eliminate the redundant factors. Then, an optimization method for weights of SI was adopted based on Gaussian process regression (GPR). Finally, the predictive abilities of the original SI model, the SI model with optimized factors (GD-SI), and the SI model with optimized factors and weights (GD-GPR-SI) were compared and evaluated by the area under the receiver operating characteristic curve (AUC) on the testing datasets. The GD-GPR-SI model has the highest AUC value (0.943), and the GD-SI model (0.936) also has a higher value than the SI model (0.931). The results highlight the necessity of factor screening and weight optimization. The factor screening method used in this study can effectively eliminate factors that negatively affect the SI model. Furthermore, by optimizing the SI weights through GPR, more reasonable weights can be obtained for model performance improvement.
1. Introduction
Landslide is a natural disaster that can be defined as the movement of rock, dirt, or debris down a slope [1]. Landslides are common around the world and commonly occur in mountainous areas, posing varying degrees of threat to people’s life and property safety [2]. Froude and Petley [3] conducted a temporal and spatial analysis of the global data set of fatal non-seismic landslides from January 2004 to December 2016. Their data showed that 55,997 people were killed in 4862 different landslide events, with Asia being the major region suffering from landslide disasters. In addition, the number of landslides caused by human activities is increasing. Landslide susceptibility mapping (LSM) is an effective risk assessment method used for landslide prevention and control. In recent years, various models have been applied to landslide susceptibility mapping. Improving or innovating these models to obtain more accurate mapping is a major difficulty in landslide susceptibility assessment studies [4].
At present, quantitative models applied to landslide susceptibility assessment can be divided into four categories: physical-based models, opinion-driven models, bivariate statistical models, and machine learning-based models [5]. Physical-based models are suitable for local-area scale mapping and analysis and have a strong landslide warning ability [6]. However, because of the large amount of required field survey data, the evaluation process is complicated and expensive, making it unsuitable for landslide risk evaluation in large-scale areas [7]. Opinion-driven models such as the analytical hierarchy process [8], step-wise assessment ratio analysis [9], and analytical network process [10] have also been applied in numerous landslide susceptibility studies. In these models, evaluation is based on existing expert knowledge, and the evaluation process does not follow a consistent standard, making quantifying the results difficult. Bivariate statistical models are information mining methods based on statistics, such as frequency ratio (FR) [11,12], statistical index (SI) [13], certainty factor (CF) [14], and evidence weight [15]. This type of model is straightforward to implement, easy to understand, and has satisfactory prediction performance. More recently, due to the growing development and maturity of big data mining techniques, machine learning has become a hotspot in the field of landslide susceptibility research owing to its powerful data analysis and prediction abilities. In essence, machine learning and multivariate statistical analysis intersect. Further examples including logistic regression (LR) [16,17], random forest [18,19,20], support vector machine [21,22], artificial neural network [23,24], and other algorithms, have been applied in landslide susceptibility assessment with advanced prediction performance. In addition to the above models, hybrid methods utilizing multiple model types also achieved excellent performance [25,26].
Statistical models and machine learning-based models are the most widely used quantitative analysis models. However, both types of models have specific disadvantages. Although machine learning-based algorithms have high predictive accuracy, their underlying rules are complicated and difficult to express intuitively. Hence, they are not conducive to analyzing the relationship between landslides and factors [27,28]. Bivariate statistical models overcome this problem [29,30], but they employ a certain irrationality in the distribution of weights, which decreases their predictive accuracy. According to Tobler’s first law of geography, objects that are close to each other in geographical space are also more closely related [31]. For models such as SI and FR, each class has the same weight. For continuous factors such as altitude, this leads to sudden changes in the weights at the boundary of different classes, and similar factor values have completely different weights. In the same class, different factor values have the same weight, which is unreasonable [9,32,33].
Model quality is directly related to the accuracy of its evaluation, but the selection of influencing factors also affects landslide susceptibility evaluation results [34]. At present, popular factor screening methods include the information gain ratio [35], variance inflation factors [36], recursive feature elimination (RFE) [37], rough set [38], principal component analysis [39], Pearson correlation coefficient [40], and Spearman correlation coefficient [41]. In addition, the GeoDetector method proposed by Wang et al., (2010) effectively uses spatial information of data to identify the primary factors affecting a certain phenomenon [42,43]. This has been innovatively applied to landslide susceptibility analysis [44,45].
This study aims to develop a hybrid optimization method for the SI model. This method optimizes the SI weight through GPR, which can avoid the irrationality of the bivariate statistical model mentioned above and improve the accuracy of landslide susceptibility assessment. In addition, the integration of GeoDetector and RFE is used to further optimize landslide influencing factors used for modeling. The area along Duwen highway in Sichuan Province, China, was used as the study area. A landslide inventory was created, and the overall performance of the SI model, SI model with optimized factors (GD-SI), and SI model with optimized factors and weights (GD-GPR-SI) were compared and analyzed.
2. Materials
2.1. Study Area
The study area stretches along the Duwen Highway (see Figure 1), located in Sichuan Province, China. Its geographic coverage is 103°36′ E–103°64′ E longitude and 30°94′ N–31°52′ N latitude, with an area of 922 km2. The Minjiang River, an important branch of the upper reaches of the Yangtze River, is the main river in the study area. Many hydropower structures have been built along this river to provide energy for nearby areas. The Duwen Highway is built along the basin. In addition, many roads are distributed throughout the study area. On 12 May 2008, an earthquake with a magnitude of Ms 8.0 occurred in the study area, leading to a large number of secondary disasters, including a large number of landslides [46].
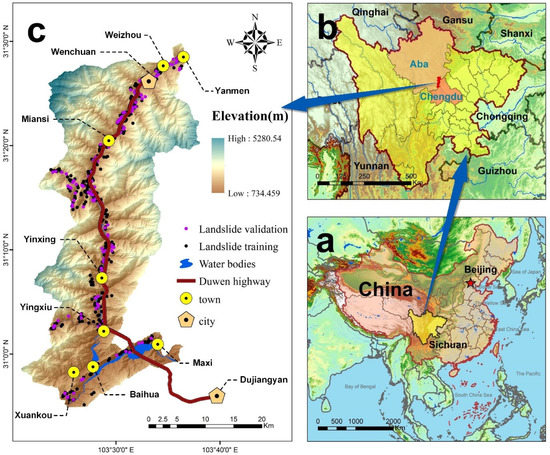
Figure 1.
Landslide inventory map and location of the study area: (a) location of Sichuan Province in China; (b) location of the study area; (c) study area and landslide inventory map.
The altitude in the study area varies significantly. The lowest altitude is ~734 m, and the highest altitude is ~5280 m, providing favorable conditions for landslide formation [47]. The study area has a continental monsoon climate. The annual rainfall is 800–1300 mm [45]. There is a wide range of stratigraphic outcrops in the study area, primarily Triassic in age. The area has good vegetation coverage and is primarily covered with forests. Hard rocks are mainly distributed in the north and middle of the study area, while soft rocks are primarily distributed in the southern regions. In addition, the exposed bedrock is primarily composed of granite, diorite, limestone, phyllite, sandstone, and granite [48].
2.2. Landslide Inventory
An accurate landslide inventory map is the basis for effective landslide susceptibility assessment [35]. Landslide data in this study originates from a 0.5 m resolution multi-band remote sensing image obtained by the Pleiades satellite in 2014. Based on remote sensing image interpretation and field investigation verification, 493 historical landslides were identified in the study area. According to the Varnes classification system [49], the landslides in the study area mainly belong to rock fall, and a small part of them belong to debris fall and debris flow. The total landslide area is 15.6 km2, accounting for 1.69% of the study area. The average area, maximum area, and minimum area of landslide are 0.032 km2, 0.991 km2, and 0.00041 km2 respectively. Roads in the study area are the main infrastructure that suffers from landslide damage, causing enormous economic losses. In this study, the geometric center of the landslide surface is taken as the landslide point.
According to the data and prior knowledge, a 30 m × 30 m grid was selected as the basic evaluation unit. Consequently, 1,024,455 grids were created for the study area, and 493 landslide points were located in different evaluation units, with a total of 493 landslide units. By random sampling, 70% (345 landslides) of landslides were used as training data for modeling, while the other 30% (148 landslides) were used for testing. A landslide inventory map was established using these data (see Figure 1a).
2.3. Landslide Influencing Factors
The selection of influencing factors is a key step in landslide susceptibility modeling [30]. The formation mechanism of a landslide is complicated, and its occurrence is the result of numerous factors [36,50]. Factors affecting the emergence of a landslide vary with different study areas. Therefore, at present, there is no definite rule for the selection of landslide influencing factors [33,51]. According to previous studies [5,44,45,47,52] and data availability, the landslide influencing factors in the study area are divided into four categories, and 20 factors were selected as the initial factors. These include topographic factors (altitude, slope, aspect, plan curvature, profile curvature, degree of relief, and topographic wetness index (TWI)), geological factors (lithology, seismic intensity, distance from fault zones, and stratigraphy), ecological factors (distance from main rivers, distance from streams, annual rainfall, normalized difference vegetation index (NDVI), land cover, and soil erosion intensity), and factors related to human engineering activities (distance from roads, residential kernel density, and distance from hydropower stations). Land cover data originates from GlobeLand30 (http://www.globallandcover.com/, accessed on 21 April 2021), and the NDVI data originates from Geospatial Data Cloud (http://www.gscloud.cn/, accessed on 7 August 2021). Topographic factors including altitude, plan curvature, profile curvature, slope, aspect, degree of relief, and TWI, were derived from a digital elevation model (DEM) with a 30 m resolution. All other factor data including the DEM were provided by the Sichuan Province Bureau of Surveying, Mapping, and Geoinformation, China.
In this study, ArcGIS (version 10.7.1, ESRI, Redlands, CA, USA) software was used to overlay all factor layers with the landslide inventory map and then calculate the distance from roads, rivers, faults, and hydropower stations to each grid. Subsequently, all continuous factors were reclassified according to previous studies and prior knowledge. The equal interval method was used to classify distance factors (such as rivers and roads, and this method was also applied to annual rainfall due to the availability of data). Specific factors, including plan curvature, profile curvature, and aspect, were classified based on the experience provided by previous studies [9,30,53]. Other factors were classified using the Jenks natural breaks method. Table 1 shows the specific classification of each factor, and Figure 2 shows the reclassified factor layers.

Table 1.
Classification of landslide influencing factors.
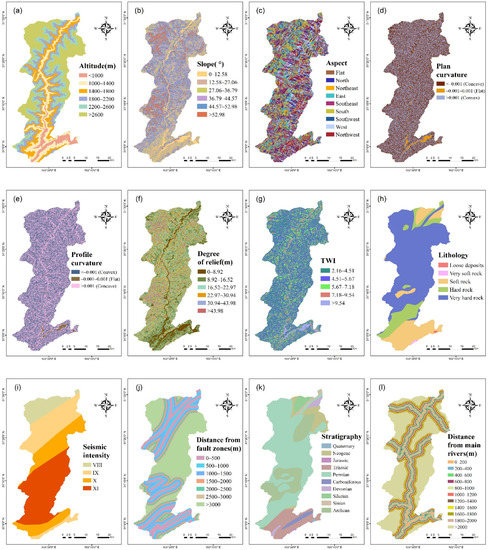
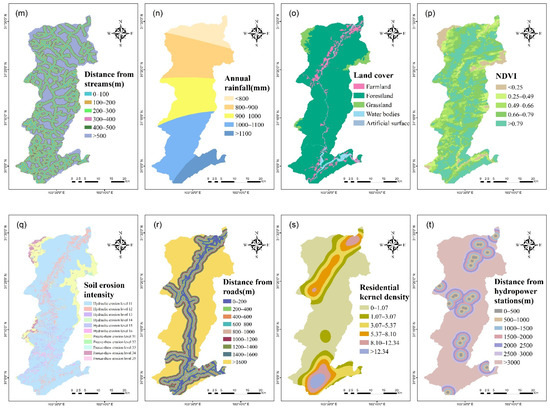
Figure 2.
Landslide influencing factor layers: (a) altitude; (b) slope; (c) aspect; (d) plan curvature; (e) profile curvature; (f) degree of relief; (g) topographic wetness index (TWI); (h) lithology; (i) seismic intensity; (j) distance from fault zones; (k) stratigraphy; (l) distance from main rivers; (m) distance from streams; (n) annual rainfall; (o) normalized difference vegetation index (NDVI); (p) land cover; (q) soil erosion intensity; (r) distance from roads; (s) residential kernel density; (t) distance from hydropower stations.
2.3.1. Topographic Factors
Altitude is a commonly used factor in landslide susceptibility assessments and plays an important role in landslide occurrence demonstrated by many studies [44,45,47,54]. Environmental conditions (such as vegetation distribution and rainfall) vary with altitude, affecting the occurrence of landslides [30].
Slope is one of the most direct and important factors affecting slope stability [52]. With changing slope degrees, the stress field in the slope also changes, affecting slope stability [9]. In general, the steeper the slope, the greater the chance of failure [55].
Aspect refers to the direction a slope faces, which primarily affects environmental conditions such as soil moisture, weathering, and topographic vegetation through rainfall, wind, and solar radiation, thereby indirectly affecting slope stability [53]. Aspect ranges from 0° to 360°, which can be divided into eight basic directions of North, Northeast, East, Southeast, South, Southwest, West, and Northwest, as well as flat areas.
Plan curvature and profile curvature are two types of curvature commonly used in landslide susceptibility studies to reflect the geometric characteristics of slopes. The plan curvature affects the convergence and divergence of flow, while the profile curvature affects the acceleration and deceleration of flow [9,30,36,41,44]. A positive plan curvature indicates that the slope is sideward convex, while a negative value indicates that the slope is sideward concave, and values around zero represent flat surfaces. On the contrary, positive and negative values of profile curvature indicate upward concave and upward convex respectively [9,33].
The degree of relief refers to the difference between the highest altitude and the lowest altitude in a specific area and has a regional correlation with landslide occurrence [51,52]. The calculation formula is:
where is the degree of relief of a unit area, is the altitude of the highest point in the area, and is the altitude of the lowest point in the area.
TWI is a physical indicator of the impact of regional topography on the direction and accumulation of runoff flow. This index helps identify rainfall-runoff patterns, potential areas with increased soil moisture, and waterlogging areas, as well as quantify the control of topography over basic hydrological processes, which is commonly used in landslide susceptibility assessments [36,44,52,53]. In this study, TWI was calculated with the SAGA-GIS (http://saga-gis.org, accessed on 11 July 2021) software using the following calculation formula:
where is the slope contributing area, and is the slope gradient.
2.3.2. Geological Factors
Lithology is an important factor affecting slope stability, which is commonly used as a key factor in landslide studies [41]. Changes in lithology largely alter the strength and permeability of rocks, resulting in differences in landslide susceptibility [56]. In this study, lithology primarily refers to rock mass strength. Classification criteria are based on the “Engineering Rock Mass Classification Standard”, which is one of the national standards (GB50218-2014) of China.
Earthquakes are commonly regarded as a direct factor leading to landslides, and many scholars have defined them as a landslide-triggering factor [9,33,44,47]. The Wenchuan earthquake in 2008 triggered a large number of landslides in the study area [57] and indirectly led to changes in its ecological environment [45]. In this study, the seismic intensity of the Wenchuan earthquake was used as an influencing factor and such data was obtained from the China Earthquake Administration (CEA 2008).
Faults are another important factor affecting slope stability. Because tectonic faults reduce the strength of the surrounding rock mass, landslides are likely to occur near faults [53,58]. Active faults usually increase the probability of landslide occurrence [41]. The fault zones in the study area are relatively well-developed, making them prone to geological disasters [45].
Permeability and strength of rocks and soils can vary significantly with stratigraphy (divided by geological ages), which is closely related to the change of slope stability [53,59]. According to research [60], stratigraphy has a specific influence on the distribution of landslides. In certain stratigraphy, the slope will be more susceptible to sliding. Therefore, some scholars have considered this factor in the study of landslide susceptibility [5,61]. There are 10 types of stratigraphy with different geological ages in the study area.
2.3.3. Ecological Factors
Erosion of the slope toe by fluvial activity, changes in pore water pressure, and runoff can lead to a decrease in slope stability [36,41,62]. Therefore, distance from the river is regarded as an important factor causing landslides in the mountains [58]. In general, the smaller the distance to the river, the lower the slope stability, resulting in an increased probability of landslide occurrence [63]. At present, most landslide susceptibility assessment studies have considered the influence of hydrological networks on landslides. However, rivers of different scales exert different impacts on slopes, which many studies have ignored, hindering the accurate analysis of the impacts of rivers on landslides. In this study, to accurately identify the relationship between the hydrological network and landslide occurrence, the river system was divided into two categories according to the tributary level: the distance from the main river and the distance from the stream. In this context, the main river refers to tributaries of Grade 6 and above, and the rest are classified as streams.
Rainfall is a major triggering factor for landslides. High-intensity rainfall will lead to an increase in the pore water pressure inside the slope, increasing the sliding mass and decreasing the shear strength of the rock mass, which increases the chance of landslides [9,25]. This study used the annual rainfall in the study area as a landslide influencing factor.
Land cover is closely related to the occurrence of landslides [64], as it has a certain impact on the scale and type of landslides [33]. Different land cover types can lead to significant differences in vegetation types and frequency of human engineering activities, resulting in changes in landslide susceptibility [41].
NDVI is an index reflecting vegetation growth within a given area. Vegetation coverage is closely related to runoff, infiltration, and weathering on the slope surfaces [30], affecting the occurrence of landslides. Therefore, NDVI can be used to quantify the impact of vegetation density on landslides [41]. The calculation formula is:
where is the reflection value of the near-infrared band, and is the reflection value of the red band.
Eroded soil makes up most landslides, reflecting the long-term rainfall erosion damage of landslides [65]. Soil erosion has a non-negligible effect on the occurrence of landslides [66]. Soil erosion intensity reflects the intensity of destruction, denudation, transportation, and deposition of soil in a region under the effect of water, wind, freeze-thaw cycles, or gravity [67]. Soil erosion modulus is the primary index for soil erosion intensity classification. The soil erosion intensity classification standard in this study is based on the “Classification Standard for Soil Erosion Classification” (SL 190-2008) issued by the Ministry of Water Resources of China. There are 11 soil erosion intensity levels in the study area, of which levels 11–16 are hydraulic erosion and levels 31–35 are freeze-thaw erosion.
2.3.4. Human Engineering Activity Factors
Landslides near highways are a common phenomenon in certain mountainous areas [30,52]. The construction of roads commonly changes the surrounding topography and geological conditions as well as the original equilibrium state of the slope, making it unstable [9,41,56,68,69]. Therefore, the distance from roads is an important human activity factor affecting the occurrence of landslides [25,53,58]. In general, the smaller the distance to roads, the greater the probability of landslides [70].
To quantify the impact of human engineering activities on landslides, different methods (e.g., HAILS and POI kernel density) have been applied to landslide susceptibility studies to represent the intensity of human engineering activities [44,54]. The density of settlements in a specific area highly reflects the strength of human engineering activities in that area. Therefore, residential kernel density was used as an influencing factor to characterize the intensity of human engineering activities.
The study area is rich in water resources, and many water conservancy projects have been constructed, of which hydropower projects are especially common. Reservoir landslide is a typical geological disaster in hydropower reservoirs [71]. Hydropower projects destroy the original ecological environment and change geological conditions. Especially during water storage and drainage, water level fluctuation in the reservoir can destroy the stability of surrounding slopes, leading to landslides [71,72]. Therefore, the distance from hydropower stations was taken as a landslide influencing factor.
3. Methods
3.1. Statistical Index
SI is a binary statistical analysis [33,68]. Because of its simplicity and robustness, SI is commonly used in landslide susceptibility studies [25,69,73,74]. This method objectively assigns weights to each factor class by calculating the natural logarithm of the ratio of the landslide density in a certain factor class to that of the entire study area. The calculation formula of this method is:
where is the weight value of category of factor , is the landslide density in class of factor , is the landslide density in the entire study area, is the number of landslide units in class of factor , is the number of units contained in class of factor , is the total number of landslide units in the study area, and is the total number of units in the study area.
After all are calculated, the landslide susceptibility index (LSI) of each evaluation unit is calculated using the following formula: , where is the number of factors, and is the weight value of factor in the evaluation unit.
3.2. GeoDetector
GeoDetector is a statistical method that can detect spatial stratified heterogeneity and identify the underlying driving force [42,43]. This method was originally applied in the field of health risk assessment [42] and has been widely used in various fields in recent years, including landslide susceptibility assessments because of its powerful factor analysis capabilities [42,44,45,52,54]. The basic assumption of the GeoDetector can be drawn as: if the variable X (factors) has an important impact on the variable Y (landslide or not), the distribution of them should be very similar. GeoDetector includes four detectors: risk detector, factor detector, ecological detector, and interaction detector. This study used the factor detector to screen for influencing factors. GeoDetector is freely available at http://www.geodetector.org/ (accessed on 8 May 2021).
The factor detector can detect the extent to which influencing factors explain the spatially stratified heterogeneity of a dependent variable and use the q-value to measure this property [43]. The specific concept of the q value is:
where
is the strata; and are the number of units in stratum and the whole area, respectively; and are the variances of the in the stratum and the whole area, respectively; is the sum of variances within the stratum, and is the total variances of the whole area.
The range of q value is 0 to 1, where the larger the q value, the stronger the explanatory power of the factor to the variable . In addition, the factor detector can also calculate the statistical significance of the q value and express it as a p value. A small p value represents strong statistical significance [43].
3.3. Recursive Feature Elimination
RFE is a feature screening method derived from machine learning [75]. RFE is essentially a greedy algorithm based on feature sorting technology. The basic idea is to start from the original feature set and remove the least relevant features according to the feature importance determined by the classifier. After several iterations, multiple feature subsets are obtained, and the optimal subset is selected based on the prediction accuracy of the classifier. The premise of RFE is that the classifier can calculate the feature importance (such as random forest and support vector machine).
The flowchart of the RFE method is shown in Figure 3, which mainly includes five steps. (1) The initial feature set contains features, and the classifier is trained on this basis. (2) The importance ranking of the features in the feature set is calculated. (3) The least relevant feature is eliminated according to the importance ranking, and a new feature subset containing features is obtained. (4) The feature subset obtained in Step 3 is taken as a new feature set, and Steps 1–3 are repeated. A new feature subset is obtained in each iteration, and finally, feature subsets are obtained. (5) According to the accuracy of the classifier, the optimal subset is selected.
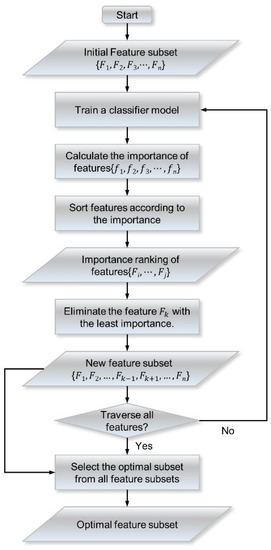
Figure 3.
Flow chart of the RFE algorithm.
3.4. Gaussian Process Regression
As a kernel-based machine learning algorithm, GPR can effectively analyze small samples and low-dimensional regression problems and is therefore widely used in the research fields of lithium-ion battery and solar energy prediction [76,77]. GPR is essentially a non-parametric model that uses Gaussian process priors to perform regression analysis on data [78]. GPR uses probabilistic methods to train on sample data, while other regression methods require detailed modeling parameters. Furthermore, GPR is determined by both the mean function and covariance function, and Bayesian inference is used to obtain hypotheses for posterior probability [79]. GPR has wider applicability for dealing with complicated and nonlinear problems [78].
A Gaussian process is commonly determined by the following functional formula:
where
are random variables, and and are mean function and covariance function, respectively. Usually, to simplify the calculation process [77]. Considering that the observed target value contains noise, the general model for establishing GPR is:
where is noise and . Thus, the prior distribution of the observed value is:
where is an n-dimensional identity matrix. Assuming that the testing dataset and the training dataset have the same Gaussian distribution, the joint prior distribution of the observed value and the predicted value is:
where is the covariance matrix of the training dataset, is the covariance matrix of the testing dataset, and is the covariance matrix between the training dataset and the testing dataset . Accordingly, the posterior distribution of the predicted value can be calculated as:
where
and and are the mean and covariance of the predicted value on the testing dataset , respectively.
Choosing the covariance function (i.e., the kernel function) is one of the key factors affecting model performance. As part of the model assumptions, the covariance function describes the correlation between samples [79]. Commonly used covariance functions include the rational quadratic covariance function, exponential covariance function, squared exponential covariance function, and Matérn covariance function. In this study, different covariance functions are compared based on the root mean square error (RMSE), and the exponential covariance function with the smallest RMSE was selected. Its functional formula is:
where is the signal standard deviation, is the characteristic length scale, and is the Euclidean distance between and . Using the maximum likelihood method, the hyperparameter of the covariance function can be obtained.
3.5. Model Validation Method
The receiver operating characteristic (ROC) curve is widely used for evaluating model performance in landslide susceptibility studies [41,44,56,80]. Its y-axis represents the model sensitivity (i.e., the true positive rate), while the x-axis represents 1-specificity (i.e., the false positive rate) [56]. When the area under the curve (AUC) > 0.5, the model is considered to have a good classification ability, and the larger the AUC value, the stronger the classification ability of the model [52,68]. To plot the ROC curve, the LSI was taken as the x-axis (1-specificity), and the cumulative percentage of landslide units was taken as the y-axis (the sensitivity). Finally, the cumulative curve was plotted [32].
4. Modeling Process and Results
The modeling process (see Figure 4) can be divided into the following six stages: (1) According to historical landslides, a landslide inventory map was created and subsequently divided into a training dataset (70%) and a test dataset (30%). (2) Twenty initial landslide influencing factors were selected to construct a spatial database. These factors were then overlaid with the landslide inventory map and reclassified. (3) The SI method was used to assign weights to each class of factors to obtain the SI model. (4) The factors were screened using GeoDetector combined with recursive feature elimination, and the GD-SI model was obtained. (5) The weights of continuous factors were optimized using GPR, and the final hybrid model GD-GPR-SI was obtained. (6) The performances of SI, GD-SI, and GD-GPR-SI were compared and evaluated, and landslide susceptibility maps were finally drawn.
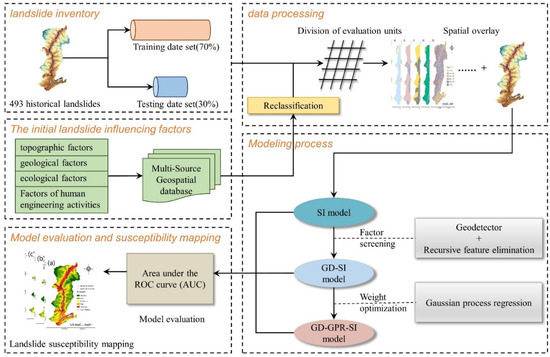
Figure 4.
Methodological flowchart.
4.1. Implementation of SI
The SI model was constructed using the training dataset, and a total of 345 landslides were used to calculate the SI weights. By overlaying factor layers with the landslide inventory map, the relationships between factor classes and landslides were obtained (see Table 2). The definition implies that when the SI value is greater than 0, the factor class exerts a promoting effect on the occurrence of landslides. In contrast, when the SI value is less than 0, the factor class is not conducive to the occurrence of landslides [81]. As there are no landslides in certain factor classes (for example, the number of landslides is 0 when the land cover is water), for these classes, SI values cannot be calculated from the formula (4). In this study, the minimum SI value (−3.352) was obtained when the altitude is 2200–2600 m, indicating that the probability of landslide occurrence is low in this class. Moreover, if there is no landslide in a factor class, the class is unfavorable for the occurrence of landslides. Therefore, the SI value of factor classes without landslides was set to a value less than the minimum value (namely −3.5) to indicate that these classes are extremely unfavorable for the occurrence of landslides.
Table 2.
The spatial relationship between landslides and influencing factors and the results of SI.
4.2. Construction of the GD-SI Model
4.2.1. GeoDetector Result
GeoDetector analysis was performed using both the spatially superimposed factor data and the landslide training dataset. In this study, landslide influencing factors are independent variables, and the classification is consistent with Table 1, while the dependent variable is the occurrence of a landslide (in which case a value of 1 is assigned) or no occurrence of a landslide (in which case a value of 0 is assigned), which is a binary variable. Because GeoDetector requires negative samples, random sampling was performed to produce the same amount of non-landslide samples. To reduce contingency and make the analysis results more reliable, 10 times random sampling of non-landslide samples were conducted to obtain the 10 times GeoDetector results. The analysis result is determined by the average q value and p value. The factor detector results are shown in Figure 5. The q value is the index of the factor’s explanatory power for landslides, and the p value represents the statistical significance.
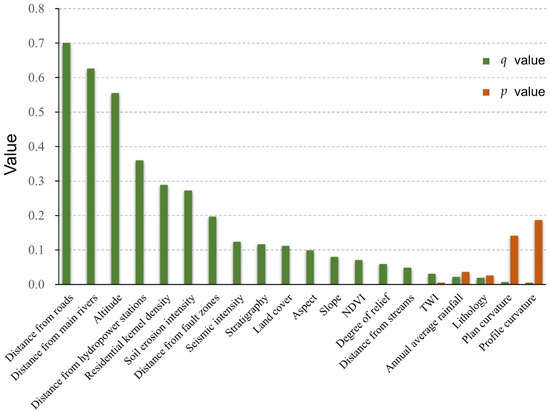
Figure 5.
Factor Detector results.
The results show that the q values for the distance from roads (q = 0.701), distance from main rivers (q = 0.626), and altitude (q = 0.555) are among the top three, indicating that these factors have the greatest impacts on landslides. The q values for plan curvature (q = 0.007) and profile curvature (q = 0.005) are both less than 0.01, indicating that these two factors are not related to landslide occurrence. In addition, these two factors did not pass the significance test (p < 0.05). Therefore, plan curvature and profile curvature were eliminated, and the remaining 18 factors were retained for further factor screening.
4.2.2. Factor Screening Based on GD and RFE
This study combined GeoDetector with the concept of RFE to perform factor screening for SI models. First, 18 landslide influencing factors preliminarily screened by GeoDetector were used as the initial feature set. Then, the GeoDetector q-value ranking was used as the feature importance ranking. Subsequently, the least important feature was recursively removed, and AUC values of the models under each factor subset were recorded in turn. The results are shown in Figure 6, which depicts the trend of the AUC values of the model with the number of factors. The results show that when the number of factors is 18, the model AUC value is the highest.
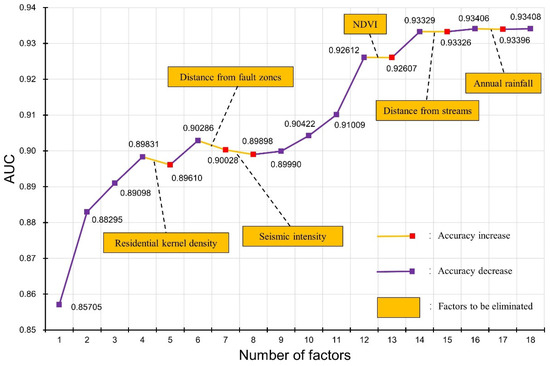
Figure 6.
The results of recursive feature elimination based on GeoDetector.
Considering the adaptation between the factor importance ranking based on GeoDetector and the SI model, the concept of the RFE algorithm was improved. If the performance of the model is improved after a certain factor is eliminated in order, it indicates that the factor has a negative impact on the model to a great probability. Therefore, if the AUC value of the model increases, the related factor will be eliminated, as shown by the yellow line in Figure 6. As a result, six factors including annual average rainfall, distance from streams, NDVI, seismic intensity, distance from fault zones, and residential kernel density were eliminated. The 12 factors of distance from roads, distance from main rivers, altitude, distance from hydropower stations, soil erosion intensity, stratigraphy, land cover, aspect, slope, degree of relief, topographic wetness index, and lithology were thus retained. The model obtained after screening the factors by this hybrid method was named the GD-SI model.
4.3. Construction of the GD-GPR-SI Model
For the traditional bivariate statistical models, each factor class has the same weight, causing all values in the same class for continuous factors to be weighted equally, which is contrary to Tobler’s First Law of Geography. To solve this problem, the GPR algorithm was used to optimize the weights obtained by the SI model.
First, for continuous factors, the following eight factors were included: distance from roads, distance from main rivers, altitude, distance from hydropower stations, aspect, slope, degree of relief, and TWI. The weight of each factor class obtained by the SI model was used as the weight of the central value of the class. Then, the central value of the class was used as the independent variable, its weight value was used as the dependent variable, and GPR was used to perform regression learning, giving the weight of all factor values (as shown in Figure 7). For discrete factors, including soil erosion intensity, stratigraphy, land cover, and lithology, the weights of the SI model were used as final weight values.
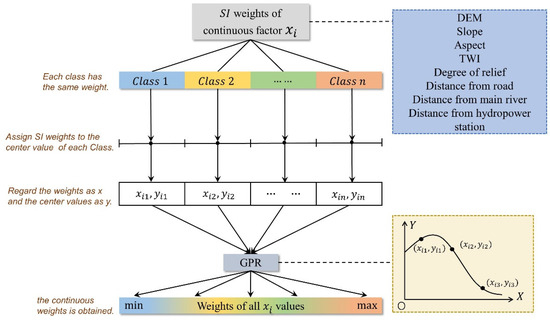
Figure 7.
The algorithm for optimizing the SI model by Gaussian process regression.
MATLAB R2020b software was used to implement GPR. The results of the regression are presented in Figure 8, which shows that the trends of factor weights change with varying factor values. The RMSE values of the models for each factor are listed in Table 3. Finally, the weights of all factors were accumulated to obtain the LSI of each evaluation unit. This hybrid model was named the GD-GPR-SI model.
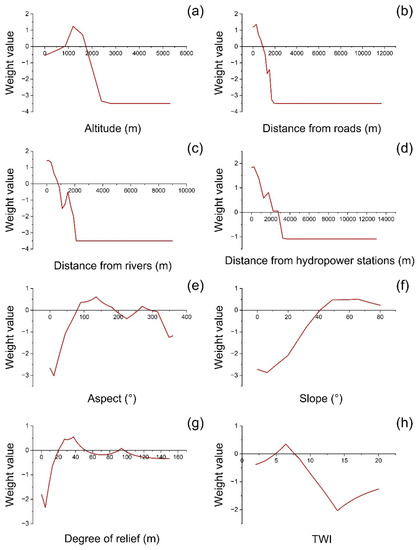
Figure 8.
Results of weight regression using Gaussian process regression algorithm: (a) distance from roads; (b) distance from main rivers; (c) altitude; (d) distance from hydropower stations; (e) aspect; (f) slope; (g) degree of relief; (h) TWI.
Table 3.
Root Mean Squared Error (RMSE) of GPR regression results.
4.4. Correlation between Selected Factors and Landslide
Through factor screening, 12 landslide influencing factors were retained. Among them, the distance from roads is the most important factor (q = 0.701), and its SI value is the highest (1.478) when it is 200–400 m, indicating that it is most favorable for the occurrence of landslides in this class. As shown by the GPR regression result (see Figure 8a), the greater the distance from roads, the lower the probability of landslide occurrence. The distance from main rivers (q = 0.626) ranked second in importance with the largest SI value (1.437) at 0–200 m. Similar to distance from roads, the factor weight is approximately inversely proportional to the distance (see Figure 8b). As the third most important factor, altitude (q = 0.555) is most favorable for the occurrence of landslides at 1000–1400 m (SI = 1.246), and no landslides occurred in areas above 2600 m. The importance of distance from hydropower stations is second only to that of altitude (q = 0.36) as a human engineering factor in this study. When it is 0–500 m, the SI value is the largest (1.875), and the larger the distance, the smaller the SI value (see Figure 8d). Aspect (q = 0.099), slope (q = 0.08), degree of relief (q = 0.059), and TWI (q = 0.031) are four topographic factors derived from the digital elevation model, and all have a relatively weak influence on landslide occurrence (q < 0.1). For Aspect, the probability of landslide is highest in the southeastern direction (SI = 0.616). With an increasing slope (see Table 2 and Figure 8f), the probability of landslide occurrence gradually increases. When the degrees of relief and TWI are 30.94–43.98 m and 5.67–7.18, SI values are the largest at 0.353 and 0.554, respectively. In addition, for geological factors, the two discrete factors stratigraphy (q = 0.117) and lithology (q = 0.019) were retained. For stratigraphy, results show that in Devonian units, landslides are most likely to occur (SI = 0.905), while for lithology, the probability of landslides is highest in hard rock (SI = 0.315). Finally, for environmental factors, in addition to the distance from main rivers, the two factors of soil erosion intensity (0.272) and land cover (0.111) were retained. For soil erosion intensity, hydraulic erosion level 14 (SI = 1.546) is most likely to cause landslides. For land covers, except for water bodies and artificial surfaces, forestland (SI = −0.103) is not conducive to the occurrence of landslides, no landslides have occurred on grassland, and farmland (SI = 1.246) is relatively more favorable for the occurrence of landslides.
4.5. Landslide Susceptibility Mapping
After obtaining the LSI of each evaluation unit, ArcGIS 10.7.1 software was used to draw landslide susceptibility maps. The natural breaks method can identify a classification that maximizes the difference between categories, which is widely used in landslide susceptibility mapping [26,30]. In this study, the natural breaks method was used to divide LSI values into five categories from high to low, representing very high, high, moderate, low, and very low landslide susceptibility levels, respectively. Figure 9a–c show the landslide susceptibility maps obtained by the SI model, the GD-SI model, and the GD-GPR-SI model, respectively. Figure 10 shows the area percentage of each susceptibility class of models.
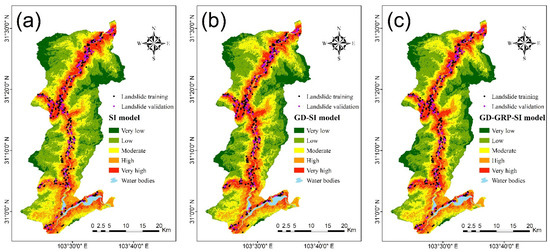
Figure 9.
Landslide susceptibility maps: (a) SI model; (b) GD-SI model; (c) GD-GPR-SI model.

Figure 10.
Area percentage of different susceptibility classes.
Based on the landslide susceptibility maps, high susceptibility areas are approximately distributed along roads and rivers, which is consistent with the distribution of historical landslides. Moreover, most landslides are located in valleys, which are also compatible with the characteristics of landslides in mountainous areas [44,82]. These observations indicate that the landslide susceptibility maps obtained by the three models are reasonable and reliable as well as prove the validity of the factor analysis results of GeoDetector.
4.6. Validation of Models
The performance of SI model, GD-SI model, and GD-GPR-SI model was compared and analyzed based on the ROC curves. The accuracy on the testing dataset reflects the predictive ability of the model, and the ROC curves of three models were plotted based on the testing dataset. Figure 11 shows the prediction rate curves of the SI (AUC = 0.931) model, GD-SI (AUC = 0.936) model, and GD-GPR-SI (AUC = 0.943) model. Results show that all three models have strong predictive capabilities (AUC > 0.93), which corroborates the reliability of the SI model. Moreover, the GD-GPR-SI model has the highest AUC value, followed by the GD-SI model, and finally the SI model. Results highlight the superiority of the hybrid model. Therefore, both the factor screening method and the GPR optimization method proposed in this study improved the performance of the SI model and proved effective.
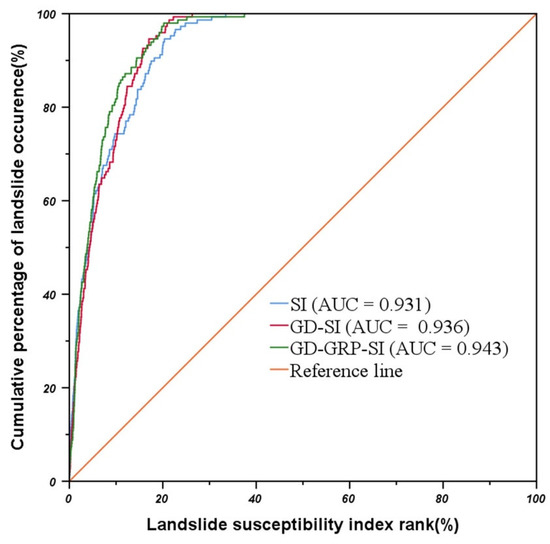
Figure 11.
ROC curves of different models on the testing dataset.
5. Discussion
5.1. The Dominant Factors of Landslides in the Study Area
The selection of landslide impact factors is one of the key steps of landslide susceptibility assessments. Including uncorrelated factors commonly increases model uncertainty [83]. Various methods have been used to select appropriate landslide influencing factors, but there are no definite rules or universal methods for how to select the best combination of factors [52]. As a statistical model, GeoDetector can make full use of the spatial information included in the data to calculate the degree of explanation of the independent variables relative to the dependent variables. Several current studies [44,45,52] set the q value threshold based on empirical knowledge, to eliminate factors below the threshold, which are highly subjective approaches. In addition, adapting GeoDetector to the used landslide susceptibility evaluation model should also be considered. To address these problems, the GeoDetector method was combined with the concept of RFE to construct a new mixed factor screening method that can be applied to statistical models. A previous study [54] combined these two methods, applied them to the random forest model, and achieved good results. On this basis, the current study applies a combination of these two methods to the traditional bivariate statistical model (SI). The RFE method could be improved to more effectively combine the GeoDetector with the SI model.
The initial factor set contains 20 factors. Through the GeoDetector preliminary screening, two factors (i.e., plan curvature and profile curvature) that fail to pass the significance test were eliminated. Then, using the hybrid method of GeoDetector and RFE, six factors that negatively impacted the model were eliminated, and 12 factors were accordingly retained. By comparing the AUC of the ROC curves of the original factor set and the optimized factor set on the model, the predictive ability of the model using the retained 12 factors (0.936) was found to be higher than that using 20 factors (0.936) (see Figure 11). The number of factors was decreased and the performance of the model was improved, which proves the effectiveness of factor screening.
GeoDetector results (see Figure 5) show that among the 12 factors that were finally selected, distance from roads, distance from main rivers, and altitude are the three factors with the strongest effect on landslide occurrence. Historical landslides (see Figure 1) are generally distributed along both sides of roads and rivers, which is consistent with the results of GeoDetector showing that these two factors largely control the distribution of landslides. In addition, the SI values in Table 2 and the regression results in Figure 8a,b show that with increasing distance from main rivers and roads, the SI weight value generally tends to decrease, and the probability of landslide occurrence also gradually decreases, which is consistent with the results of most studies [30,84]. Furthermore, another conclusion of this study is that the impact of rivers at different scales on landslide occurrence is inconsistent. The hydrological network in the study area was classified into main rivers and streams according to their level of tributaries. Figure 5 shows that the distance from streams has little correlation to landslide occurrence (q < 0.05), while the distance from main rivers has a higher q value (q = 0.626), which is largely due to the different scour and erosion capacities of rivers of different scales. Therefore, future research should consider this difference. The importance of altitude (q = 0.555) ranks after the distance from main rivers. An altitude ranges between 1000–1400 m (SI = 1.246) is most conducive to the occurrence of landslides, while in high-altitude areas, the probability of landslides is very low. Two studies have reached the same conclusion [28,53]. This was found to be largely due to differences in rock characteristics as well as the intensity of human engineering activities at different altitudes [9,85]. Distance from hydropower stations also has a relatively high q value (0.36), and the regression results (see Figure 8d) show that the larger the distance, the lower the probability of landslides. In addition, for land cover, Table 2 shows that 87.04% of the study area is covered by forestland, but the SI value in this area is negative, indicating that it is not favorable for the occurrence of landslides. In contrast, the probability of landslide occurrence in farmland is the highest (SI = 1.246). These results indicate that human engineering activities exert an important impact on the occurrence of landslides in the study area. Therefore, corresponding measures should be taken to address this risk.
5.2. Advantages of the Hybrid Model
Aiming at the unreasonable weight distribution of the traditional bivariate statistical models, in this study, GPR in machine learning was used to optimize the factor weights. More reasonable weight values were obtained, which finally improved the performance of the landslide susceptibility model. Using GPR, the trend of factor values changing with weights can be intuitively displayed, which helps to better grasp the relationship between factors and landslides. This process is primarily derived from interpolation, which indicates that adjacent regions should have the same characteristics.
Improving the accuracy of LSM by combining different models and forming a hybrid model is a common method. At present, many scholars have combined traditional statistical models and opinion-driven models with machine learning-based algorithms, and the performance of the resulting hybrid models is better than that of the original models [9,25,26,74]. These studies show that hybrid models have good application potential, but the key is how to combine models effectively. Machine learning-based models can mine useful information from a large volume of data, while statistical models have clear mathematical meanings and are conducive to the analysis of the relationships between factors and landslides. Hybrids of both models have been used. The RF-CF (random forest-certainty factor) model proposed by Chen et al. [25], the FT-IV-RF (fractal theory-information value-random forest model) model proposed by Zhao et al. [86], and the EBF-KLR (evidential belief function- kernel logistic regression) model proposed by Chen et al. [74] are innovative combinations of statistical models and machine learning-based models that have been proven to outperform the single models. In this study, a machine learning-based model was used to obtain the distribution pattern of factor weights based on statistical models. The hybrid model combines the advantages of both models, is straightforward to interpret, and can mine the potential information of factor weights. Therefore, by integrating models, the advantages of different models can be effectively combined, which provides a promising method for landslide susceptibility assessment.
5.3. Limitations of This Study and Prospects of Future Research
Although the proposed methods in this study improved the accuracy of landslide susceptibility assessment to a certain extent, certain limitations remain. First, grid units are most commonly used as evaluation units. However, they do not correlate well with real-world geological environments [87]. Therefore, slope units [12] and terrain units [88] have been used in landslide susceptibility assessment. The existing methods for extracting slope units are complicated, and their effect is not ideal. Thus, these methods are not widely used [29]. In addition, the size of grid units also affects the accuracy of landslide susceptibility assessment [89]. Across different study areas, environmental conditions are quite different, and there is no clear criterion for choosing an optimal grid size [56]. In this study, based on literature and expert knowledge as well as considering the computational cost and the actual conditions of the study area, a grid of 30 m × 30 m was selected as the evaluation unit. The selection of the optimal evaluation unit is also a difficult problem that should be addressed in future research.
Furthermore, in the process of regressing SI weights using GPR, the SI weight value of a class was assigned to the central value of this class. Although this allocation method has brought good results in this study, it still contains some subjectivity. Therefore, future research should consider more reasonable allocation methods to further improve the accuracy of landslide susceptibility assessments. Moreover, considering the second law of geography, a more reasonable screening of regional risk factors should take into account their spatial local heterogeneous (SLH) associations with landslides, and such SLH-based factor screening methods [90,91] are also worthy of continued research in the future.
6. Conclusions
For bivariate statistical models such as SI, the distribution of weights does not conform to the reality of factors, which require improvement. Moreover, the selection of factors has a non-negligible impact on the performance of LSM models. This study proposes a hybrid optimization method for the SI model, with the aim of addressing these problems and improving the accuracy and reliability of LSM.
The hybrid approach of GeoDetector and RFE was used for factor screening (the obtained model was named GD-SI). The number of factors decreased from 22 to 12, but the AUC value on the testing dataset increased from 0.931 to 0.936. Results show that the prediction performance of the model was improved, proving the effectiveness and reliability of factor screening. Furthermore, the weights of the GD-SI model were optimized using GPR (the obtained model was named GD-GPR-SI). The GD-GPR-SI (AUC = 0.943) model has a higher AUC value than the GD-SI model (AUC = 0.936) on the testing dataset. Therefore, by optimizing GPR, more reasonable weights were obtained, and the predictive ability of the model was improved.
The methods proposed in this study improved the predictive ability of the LSM model, which can be used as a general framework for it. The obtained landslide susceptibility maps can also provide a decision-making basis for landslide prevention and control. Further consideration should be given to the optimization of evaluation units and improvement of the quality of data for modeling.
Author Contributions
Conceptualization, Y.Y.; Data curation, Y.Z.; Formal analysis, F.Z.; Investigation, C.S.; Methodology, C.C.; Software, C.C.; Supervision, C.S.; Validation, F.Z.; Visualization, C.S.; Writing—original draft, C.C.; Writing—review & editing, Y.Y. and C.S. All authors have read and agreed to the published version of the manuscript.
Funding
This research was funded by the National Natural Science Foundation of China, grant number 42071379, 41701448; Technical development project (Potential pipeline threat event identification from the perspective of unmanned aerial vehicle) of East Crude Oil Storage and Transportation of National pipe network group Co., Ltd., grant number GWHT20220021074.
Institutional Review Board Statement
Not applicable.
Informed Consent Statement
Not applicable.
Data Availability Statement
The data used in this study are available on request from the corresponding author.
Acknowledgments
We would like to express our gratitude to the reviewers and editors, whose comments and suggestions have greatly helped to improve the quality of the manuscript. We are also grateful to Qin Wan (Southwest Petroleum University, China) for help in revising the manuscript.
Conflicts of Interest
The authors declare no conflict of interest.
References
- Cruden, D.M. A simple definition of a landslide. Bull. Int. Assoc. Eng. Geol. 1991, 43, 27–29. [Google Scholar] [CrossRef]
- Petley, D. Global patterns of loss of life from landslides. Geology 2012, 40, 927–930. [Google Scholar] [CrossRef]
- Froude, M.J.; Petley, D.N. Global fatal landslide occurrence from 2004 to 2016. Nat. Hazard Earth Syst. 2018, 18, 2161–2181. [Google Scholar] [CrossRef]
- Reichenbach, P.; Rossi, M.; Malamud, B.D.; Mihir, M.; Guzzetti, F. A review of statistically-based landslide susceptibility models. Earth-Sci. Rev. 2018, 180, 60–91. [Google Scholar] [CrossRef]
- Merghadi, A.; Yunus, A.P.; Dou, J.; Whiteley, J.; ThaiPham, B.; Bui, D.T.; Avtar, R.; Abderrahmane, B. Machine learning methods for landslide susceptibility studies: A comparative overview of algorithm performance. Earth-Sci. Rev. 2020, 207, 103225. [Google Scholar] [CrossRef]
- Piciullo, L.; Calvello, M.; Cepeda, J.M. Territorial early warning systems for rainfall-induced landslides. Earth-Sci. Rev. 2018, 179, 228–247. [Google Scholar] [CrossRef]
- Shinoda, M.; Miyata, Y.; Kurokawa, U.; Kondo, K. Regional landslide susceptibility following the 2016 Kumamoto earthquake using back-calculated geomaterial strength parameters. Landslides 2019, 16, 1497–1516. [Google Scholar] [CrossRef]
- Panchal, S.; Shrivastava, A.K. A Comparative Study of Frequency Ratio, Shannon’s Entropy and Analytic Hierarchy Process (AHP) Models for Landslide Susceptibility Assessment. ISPRS Int. J. Geo-Inf. 2021, 10, 603. [Google Scholar] [CrossRef]
- Dehnavi, A.; Aghdam, I.N.; Pradhan, B.; Varzandeh, M.H.M. A new hybrid model using step-wise weight assessment ratio analysis (SWAM) technique and adaptive neuro-fuzzy inference system (ANFIS) for regional landslide hazard assessment in Iran. Catena 2015, 135, 122–148. [Google Scholar] [CrossRef]
- Gheshlaghi, H.A.; Feizizadeh, B. An integrated approach of analytical network process and fuzzy based spatial decision making systems applied to landslide risk mapping. J. Afr. Earth Sci. 2017, 133, 15–24. [Google Scholar] [CrossRef]
- Zare, N.; Hosseini, S.A.O.; Hafizi, M.K.; Najafi, A.; Majnounian, B.; Geertsema, M. A Comparison of an Adaptive Neuro-Fuzzy and Frequency Ratio Model to Landslide-Susceptibility Mapping along Forest Road Networks. Forests 2021, 12, 1087. [Google Scholar] [CrossRef]
- Luo, W.; Liu, C.C. Innovative landslide susceptibility mapping supported by geomorphon and geographical detector methods. Landslides 2018, 15, 465–474. [Google Scholar] [CrossRef]
- Wang, Q.; Li, W.; Wu, Y.; Pei, Y.; Xie, P. Application of statistical index and index of entropy methods to landslide susceptibility assessment in Gongliu (Xinjiang, China). Environ. Earth Sci. 2016, 75, 599. [Google Scholar] [CrossRef]
- Zhao, X.; Chen, W. GIS-Based Evaluation of Landslide Susceptibility Models Using Certainty Factors and Functional Trees-Based Ensemble Techniques. Appl. Sci. 2020, 10, 16. [Google Scholar] [CrossRef]
- Batar, A.K.; Watanabe, T. Landslide Susceptibility Mapping and Assessment Using Geospatial Platforms and Weights of Evidence (WoE) Method in the Indian Himalayan Region: Recent Developments, Gaps, and Future Directions. ISPRS Int. J. Geo-Inf. 2021, 10, 114. [Google Scholar] [CrossRef]
- Viet-Ha, N.; Mohammadi, A.; Shahabi, H.; Bin Ahmad, B.; Al-Ansari, N.; Shirzadi, A.; Geertsema, M.; Kress, V.R.; Karimzadeh, S.; Kamran, K.V.; et al. Landslide Detection and Susceptibility Modeling on Cameron Highlands (Malaysia): A Comparison between Random Forest, Logistic Regression and Logistic Model Tree Algorithms. Forests 2020, 11, 830. [Google Scholar] [CrossRef]
- Kalantar, B.; Pradhan, B.; Naghibi, S.A.; Motevalli, A.; Mansor, S. Assessment of the effects of training data selection on the landslide susceptibility mapping: A comparison between support vector machine (SVM), logistic regression (LR) and artificial neural networks (ANN). Geomat. Nat. Hazards Risk 2018, 9, 49–69. [Google Scholar] [CrossRef]
- Viet-Ha, N.; Shirzadi, A.; Shahabi, H.; Chen, W.; Clague, J.J.; Geertsema, M.; Jaafari, A.; Avand, M.; Miraki, S.; Asl, D.T.; et al. Shallow Landslide Susceptibility Mapping by Random Forest Base Classifier and Its Ensembles in a Semi-Arid Region of Iran. Forests 2020, 11, 421. [Google Scholar] [CrossRef]
- Viet-Hung, D.; Nhat-Duc, H.; Le-Mai-Duyen, N.; Dieu Tien, B.; Samui, P. A Novel GIS-Based Random Forest Machine Algorithm for the Spatial Prediction of Shallow Landslide Susceptibility. Forests 2020, 11, 118. [Google Scholar] [CrossRef]
- Zhang, W.; Liu, S.; Wang, L.; Samui, P.; Chwala, M.; He, Y. Landslide Susceptibility Research Combining Qualitative Analysis and Quantitative Evaluation: A Case Study of Yunyang County in Chongqing, China. Forests 2022, 13, 1055. [Google Scholar] [CrossRef]
- Dieu Tien, B.; Shirzadi, A.; Shahabi, H.; Geertsema, M.; Omidvar, E.; Clague, J.J.; Binh Thai, P.; Dou, J.; Asl, D.T.; Bin Ahmad, B.; et al. New Ensemble Models for Shallow Landslide Susceptibility Modeling in a Semi-Arid Watershed. Forests 2019, 10, 743. [Google Scholar] [CrossRef]
- Xie, W.; Nie, W.; Saffari, P.; Robledo, L.F.; Descote, P.-Y.; Jian, W. Landslide hazard assessment based on Bayesian optimization-support vector machine in Nanping City, China. Nat. Hazards 2021, 109, 931–948. [Google Scholar] [CrossRef]
- Vu Viet, N.; Binh Thai, P.; Ba Thao, V.; Prakash, I.; Jha, S.; Shahabi, H.; Shirzadi, A.; Dong Nguyen, B.; Kumar, R.; Chatterjee, J.M.; et al. Hybrid Machine Learning Approaches for Landslide Susceptibility Modeling. Forests 2019, 10, 157. [Google Scholar] [CrossRef]
- Kawabata, D.; Bandibas, J. Landslide susceptibility mapping using geological data, a DEM from ASTER images and an Artificial Neural Network (ANN). Geomorphology 2009, 113, 97–109. [Google Scholar] [CrossRef]
- Chen, W.; Xie, X.S.; Peng, J.B.; Shahabi, H.; Hong, H.Y.; Bui, D.T.; Duan, Z.; Li, S.J.; Zhu, A.X. GIS-based landslide susceptibility evaluation using a novel hybrid integration approach of bivariate statistical based random forest method. Catena 2018, 164, 135–149. [Google Scholar] [CrossRef]
- Chen, W.; Sun, Z.H.; Han, J.C. Landslide Susceptibility Modeling Using Integrated Ensemble Weights of Evidence with Logistic Regression and Random Forest Models. Appl. Sci. 2019, 9, 171. [Google Scholar] [CrossRef]
- Chen, L.; Guo, H.; Gong, P.; Yang, Y.; Zuo, Z.; Gu, M. Landslide susceptibility assessment using weights-of-evidence model and cluster analysis along the highways in the Hubei section of the Three Gorges Reservoir Area. Comput. Geosci. 2021, 156, 104899. [Google Scholar] [CrossRef]
- Jaafari, A.; Najafi, A.; Pourghasemi, H.R.; Rezaeian, J.; Sattarian, A. GIS-based frequency ratio and index of entropy models for landslide susceptibility assessment in the Caspian forest, northern Iran. Int. J. Environ. Sci. 2014, 11, 909–926. [Google Scholar] [CrossRef]
- Yong, C.; Dong, J.; Fei, G.; Bin, T.; Tao, Z.; Hao, F.; Li, W.; Qinghua, Z. Review of landslide susceptibility assessment based on knowledge mapping. Stoch. Environ. Res. Risk Assess. 2022, 36, 2399–2417. [Google Scholar] [CrossRef]
- Chen, W.; Chen, X.; Peng, J.B.; Panahi, M.; Lee, S. Landslide susceptibility modeling based on ANFIS with teaching-learning-based optimization and Satin bowerbird optimizer. Geosci. Front. 2021, 12, 93–107. [Google Scholar] [CrossRef]
- Tobler, W.R. A Computer Movie Simulating Urban Growth in the Detroit Region. Econ. Geogr. 1970, 46, 234–240. [Google Scholar] [CrossRef]
- Aghdam, I.N.; Pradhan, B.; Panahi, M. Landslide susceptibility assessment using a novel hybrid model of statistical bivariate methods (FR and WOE) and adaptive neuro-fuzzy inference system (ANFIS) at southern Zagros Mountains in Iran. Environ. Earth Sci. 2017, 76, 237. [Google Scholar] [CrossRef]
- Aghdam, I.N.; Varzandeh, M.H.M.; Pradhan, B. Landslide susceptibility mapping using an ensemble statistical index (Wi) and adaptive neuro-fuzzy inference system (ANFIS) model at Alborz Mountains (Iran). Environ. Earth Sci. 2016, 75, 553. [Google Scholar] [CrossRef]
- Jebur, M.N.; Pradhan, B.; Tehrany, M.S. Optimization of landslide conditioning factors using very high-resolution airborne laser scanning (LiDAR) data at catchment scale. Remote Sens. Environ. 2014, 152, 150–165. [Google Scholar] [CrossRef]
- Zhou, C.; Yin, K.L.; Cao, Y.; Ahmed, B.; Li, Y.Y.; Catani, F.; Pourghasemi, H.R. Landslide susceptibility modeling applying machine learning methods: A case study from Longju in the Three Gorges Reservoir area, China. Comput. Geosci. 2018, 112, 23–37. [Google Scholar] [CrossRef]
- Chen, X.; Chen, W. GIS-based landslide susceptibility assessment using optimized hybrid machine learning methods. Catena 2021, 196, 104833. [Google Scholar] [CrossRef]
- Sun, D.L.; Wen, H.J.; Wang, D.Z.; Xu, J.H. A random forest model of landslide susceptibility mapping based on hyperparameter optimization using Bayes algorithm. Geomorphology 2020, 362, 107201. [Google Scholar] [CrossRef]
- Liu, J.P.; Zeng, Z.P.; Liu, H.Q.; Wang, H.B. A rough set approach to analyze factors affecting landslide incidence. Comput. Geosci. 2011, 37, 1311–1317. [Google Scholar] [CrossRef]
- Li, L.M.; Cheng, S.K.; Wen, Z.Z. Landslide prediction based on improved principal component analysis and mixed kernel function least squares support vector regression model. J. Mt. Sci. 2021, 18, 2130–2142. [Google Scholar] [CrossRef]
- Zhang, T.Y.; Han, L.; Chen, W.; Shahabi, H. Hybrid Integration Approach of Entropy with Logistic Regression and Support Vector Machine for Landslide Susceptibility Modeling. Entropy 2018, 20, 884. [Google Scholar] [CrossRef]
- Wu, Y.L.; Ke, Y.T.; Chen, Z.; Liang, S.Y.; Zhao, H.L.; Hong, H.Y. Application of alternating decision tree with AdaBoost and bagging ensembles for landslide susceptibility mapping. Catena 2020, 187, 104396. [Google Scholar] [CrossRef]
- Wang, J.F.; Li, X.H.; Christakos, G.; Liao, Y.L.; Zhang, T.; Gu, X.; Zheng, X.Y. Geographical Detectors-Based Health Risk Assessment and its Application in the Neural Tube Defects Study of the Heshun Region, China. Int. J. Geogr. Inf. Sci. 2010, 24, 107–127. [Google Scholar] [CrossRef]
- Wang, J.F.; Zhang, T.L.; Fu, B.J. A measure of spatial stratified heterogeneity. Ecol. Indic. 2016, 67, 250–256. [Google Scholar] [CrossRef]
- Xie, W.; Li, X.S.; Jian, W.B.; Yang, Y.; Liu, H.W.; Robledo, L.F.; Nie, W. A Novel Hybrid Method for Landslide Susceptibility Mapping-Based GeoDetector and Machine Learning Cluster: A Case of Xiaojin County, China. ISPRS Int. J. Geo-Inf. 2021, 10, 93. [Google Scholar] [CrossRef]
- Yang, J.T.; Song, C.; Yang, Y.; Xu, C.D.; Guo, F.; Xie, L. New method for landslide susceptibility mapping supported by spatial logistic regression and GeoDetector: A case study of Duwen Highway Basin, Sichuan Province, China. Geomorphology 2019, 324, 62–71. [Google Scholar] [CrossRef]
- Yin, Y.P.; Wang, F.W.; Sun, P. Landslide hazards triggered by the 2008 Wenchuan earthquake, Sichuan, China. Landslides 2009, 6, 139–152. [Google Scholar] [CrossRef]
- Yang, Y.; Yang, J.T.; Xu, C.D.; Xu, C.; Song, C. Local-scale landslide susceptibility mapping using the B-GeoSVC model. Landslides 2019, 16, 1301–1312. [Google Scholar] [CrossRef]
- Zhang, H.Z.; Chi, T.H.; Fan, J.R.; Hu, K.H.; Peng, L. Spatial Analysis of Wenchuan Earthquake-Damaged Vegetation in the Mountainous Basins and Its Applications. Remote Sens. 2015, 7, 5785–5804. [Google Scholar] [CrossRef]
- Hungr, O.; Leroueil, S.; Picarelli, L. The Varnes classification of landslide types, an update. Landslides 2014, 11, 167–194. [Google Scholar] [CrossRef]
- Hong, H.Y.; Pourghasemi, H.R.; Pourtaghi, Z.S. Landslide susceptibility assessment in Lianhua County (China): A comparison between a random forest data mining technique and bivariate and multivariate statistical models. Geomorphology 2016, 259, 105–118. [Google Scholar] [CrossRef]
- Wang, Y.; Sun, D.L.; Wen, H.J.; Zhang, H.; Zhang, F.T. Comparison of Random Forest Model and Frequency Ratio Model for Landslide Susceptibility Mapping (LSM) in Yunyang County (Chongqing, China). Int. J. Environ. Res. Public Health 2020, 17, 4206. [Google Scholar] [CrossRef] [PubMed]
- Zhou, X.Z.; Wen, H.J.; Zhang, Y.L.; Xu, J.H.; Zhang, W.G. Landslide susceptibility mapping using hybrid random forest with GeoDetector and RFE for factor optimization. Geosci. Front. 2021, 12, 101211. [Google Scholar] [CrossRef]
- Chen, W.; Pourghasemi, H.R.; Panahi, M.; Kornejady, A.; Wang, J.L.; Xie, X.S.; Cao, S.B. Spatial prediction of landslide susceptibility using an adaptive neuro-fuzzy inference system combined with frequency ratio, generalized additive model, and support vector machine techniques. Geomorphology 2017, 297, 69–85. [Google Scholar] [CrossRef]
- Sun, D.L.; Shi, S.X.; Wen, H.J.; Xu, J.H.; Zhou, X.Z.; Wu, J.P. A hybrid optimization method of factor screening predicated on GeoDetector and Random Forest for Landslide Susceptibility Mapping. Geomorphology 2021, 379, 107623. [Google Scholar] [CrossRef]
- Bui, D.T.; Lofman, O.; Revhaug, I.; Dick, O. Landslide susceptibility analysis in the Hoa Binh province of Vietnam using statistical index and logistic regression. Nat Hazards 2011, 59, 1413–1444. [Google Scholar] [CrossRef]
- Zhao, Y.; Wang, R.; Jiang, Y.J.; Liu, H.J.; Wei, Z.L. GIS-based logistic regression for rainfall-induced landslide susceptibility mapping under different grid sizes in Yueqing, Southeastern China. Eng. Geol. 2019, 259, 105147. [Google Scholar] [CrossRef]
- Xu, C.; Xu, X.W.; Yao, X.; Dai, F.C. Three (nearly) complete inventories of landslides triggered by the May 12, 2008 Wenchuan Mw 7.9 earthquake of China and their spatial distribution statistical analysis. Landslides 2014, 11, 441–461. [Google Scholar] [CrossRef]
- Balogun, A.L.; Rezaie, F.; Pham, Q.B.; Gigovic, L.; Drobnjak, S.; Aina, Y.A.; Panahi, M.; Yekeen, S.T.; Lee, S. Spatial prediction of landslide susceptibility in western Serbia using hybrid support vector regression (SVR) with GWO, BAT and COA algorithms. Geosci. Front. 2021, 12, 101104. [Google Scholar] [CrossRef]
- Dou, J.; Yunus, A.P.; Dieu Tien, B.; Sahana, M.; Chen, C.-W.; Zhu, Z.; Wang, W.; Binh Thai, P. Evaluating GIS-Based Multiple Statistical Models and Data Mining for Earthquake and Rainfall-Induced Landslide Susceptibility Using the LiDAR DEM. Remote Sens. 2019, 11, 638. [Google Scholar] [CrossRef]
- Liu, L.; Xu, C.; Xu, X.; Tian, Y.; Ran, Y.; Chen, J. Interactive statistical analysis of predisposing factors for earthquake-triggered landslides: A case study of the 2013 Lushan, China Ms7.0 earthquake. Environ. Earth Sci. 2015, 73, 4729–4738. [Google Scholar] [CrossRef]
- Merghadi, A.; Abderrahmane, B.; Dieu Tien, B. Landslide Susceptibility Assessment at Mila Basin (Algeria): A Comparative Assessment of Prediction Capability of Advanced Machine Learning Methods. ISPRS Int. J. Geo-Inf. 2018, 7, 268. [Google Scholar] [CrossRef]
- Deng, H.; Wu, L.Z.; Huang, R.Q.; Guo, X.G.; He, Q. Formation of the Siwanli ancient landslide in the Dadu River, China. Landslides 2017, 14, 385–394. [Google Scholar] [CrossRef]
- Juliev, M.; Mergili, M.; Mondal, I.; Nurtaev, B.; Pulatov, A.; Hubl, J. Comparative analysis of statistical methods for landslide susceptibility mapping in the Bostanlik District, Uzbekistan. Sci. Total Environ. 2019, 653, 801–814. [Google Scholar] [CrossRef]
- Wang, X.; Huang, Z.; Hong, M.M.M.; Zhao, Y.F.; Ou, Y.S.; Zhang, J. A comparison of the effects of natural vegetation regrowth with a plantation scheme on soil structure in a geological hazard-prone region. Eur. J. Soil Sci. 2019, 70, 674–685. [Google Scholar] [CrossRef]
- Huang, F.M.; Chen, J.W.; Du, Z.; Yao, C.; Huang, J.S.; Jiang, Q.H.; Chang, Z.L.; Li, S. Landslide Susceptibility Prediction Considering Regional Soil Erosion Based on Machine-Learning Models. ISPRS Int. J. Geo-Inf. 2020, 9, 377. [Google Scholar] [CrossRef]
- Pradhan, B.; Chaudhari, A.; Adinarayana, J.; Buchroithner, M.F. Soil erosion assessment and its correlation with landslide events using remote sensing data and GIS: A case study at Penang Island, Malaysia. Environ. Monit. Assess. 2012, 184, 715–727. [Google Scholar] [CrossRef] [PubMed]
- Duan, X.W.; Liu, B.; Gu, Z.J.; Rong, L.; Feng, D.T. Quantifying soil erosion effects on soil productivity in the dry-hot valley, southwestern China. Environ. Earth Sci. 2016, 75, 1164. [Google Scholar] [CrossRef]
- Zhang, G.F.; Cai, Y.X.; Zheng, Z.; Zhen, J.W.; Liu, Y.L.; Huang, K.Y. Integration of the Statistical Index Method and the Analytic Hierarchy Process technique for the assessment of landslide susceptibility in Huizhou, China. Catena 2016, 142, 233–244. [Google Scholar] [CrossRef]
- Yalcin, A.; Reis, S.; Aydinoglu, A.C.; Yomralioglu, T. A GIS-based comparative study of frequency ratio, analytical hierarchy process, bivariate statistics and logistics regression methods for landslide susceptibility mapping in Trabzon, NE Turkey. Catena 2011, 85, 274–287. [Google Scholar] [CrossRef]
- Arabameri, A.; Pradhan, B.; Rezaei, K.; Lee, C.W. Assessment of Landslide Susceptibility Using Statistical- and Artificial Intelligence-Based FR-RF Integrated Model and Multiresolution DEMs. Remote Sens. 2019, 11, 999. [Google Scholar] [CrossRef]
- Zhou, J.W.; Lu, P.Y.; Yang, Y.C. Reservoir Landslides and Its Hazard Effects for the Hydropower Station: A Case Study. In Advancing Culture of Living with Landslides, Vol 2: Advances in Landslide Science; Springer: Cham, Switzerland, 2017; pp. 699–706. [Google Scholar] [CrossRef]
- Xia, M.; Ren, G.M.; Zhu, S.S.; Ma, X.L. Relationship between landslide stability and reservoir water level variation. Bull. Eng. Geol. Environ. 2015, 74, 909–917. [Google Scholar] [CrossRef]
- Regmi, A.D.; Devkota, K.C.; Yoshida, K.; Pradhan, B.; Pourghasemi, H.R.; Kumamoto, T.; Akgun, A. Application of frequency ratio, statistical index, and weights-of-evidence models and their comparison in landslide susceptibility mapping in Central Nepal Himalaya. Arab. J. Geosci. 2014, 7, 725–742. [Google Scholar] [CrossRef]
- Chen, W.; Shahabi, H.; Shirzadi, A.; Hong, H.Y.; Akgun, A.; Tian, Y.Y.; Liu, J.Z.; Zhu, A.X.; Li, S.J. Novel hybrid artificial intelligence approach of bivariate statistical-methods-based kernel logistic regression classifier for landslide susceptibility modeling. Bull. Eng. Geol. Environ. 2019, 78, 4397–4419. [Google Scholar] [CrossRef]
- Guyon, I.; Weston, J.; Barnhill, S.; Vapnik, V. Gene Selection for Cancer Classification using Support Vector Machines. Mach. Learn. 2002, 46, 389–422. [Google Scholar] [CrossRef]
- Sheng, H.M.; Xiao, J.; Cheng, Y.H.; Ni, Q.; Wang, S. Short-Term Solar Power Forecasting Based on Weighted Gaussian Process Regression. IEEE Trans. Ind. Electron. 2018, 65, 300–308. [Google Scholar] [CrossRef]
- Liu, K.L.; Hu, X.S.; Wei, Z.B.; Li, Y.; Jiang, Y. Modified Gaussian Process Regression Models for Cyclic Capacity Prediction of Lithium-Ion Batteries. IEEE Trans. Transp. Electr. 2019, 5, 1225–1236. [Google Scholar] [CrossRef]
- Zhou, Y.; Liu, Y.F.; Wang, D.J.; De, G.; Li, Y.; Liu, X.J.; Wang, Y.Y. A novel combined multi-task learning and Gaussian process regression model for the prediction of multi-timescale and multi-component of solar radiation. J. Clean. Prod. 2021, 284, 124710. [Google Scholar] [CrossRef]
- Li, X.Y.; Yuan, C.G.; Li, X.H.; Wang, Z.P. State of health estimation for Li-Ion battery using incremental capacity analysis and Gaussian process regression. Energy 2020, 190, 116467. [Google Scholar] [CrossRef]
- Bui, D.T.; Pradhan, B.; Lofman, O.; Revhaug, I.; Dick, O.B. Landslide susceptibility mapping at Hoa Binh province (Vietnam) using an adaptive neuro-fuzzy inference system and GIS. Comput. Geosci. 2012, 45, 199–211. [Google Scholar] [CrossRef]
- Pourghasemi, H.R.; Moradi, H.R.; Aghda, S.M.F. Landslide susceptibility mapping by binary logistic regression, analytical hierarchy process, and statistical index models and assessment of their performances. Nat. Hazards 2013, 69, 749–779. [Google Scholar] [CrossRef]
- Wu, R.; Zhang, Y.; Guo, C.; Yang, Z.; Tang, J.; Su, F. Landslide susceptibility assessment in mountainous area: A case study of Sichuan-Tibet railway, China. Environ. Earth Sci. 2020, 79, 157. [Google Scholar] [CrossRef]
- Lee, S.; Talib, J.A. Probabilistic landslide susceptibility and factor effect analysis. Environ. Geol. 2005, 47, 982–990. [Google Scholar] [CrossRef]
- Devkota, K.C.; Regmi, A.D.; Pourghasemi, H.R.; Yoshida, K.; Pradhan, B.; Ryu, I.C.; Dhital, M.R.; Althuwaynee, O.F. Landslide susceptibility mapping using certainty factor, index of entropy and logistic regression models in GIS and their comparison at Mugling-Narayanghat road section in Nepal Himalaya. Nat. Hazards 2013, 65, 135–165. [Google Scholar] [CrossRef]
- Achour, Y.; Pourghasemi, H.R. How do machine learning techniques help in increasing accuracy of landslide susceptibility maps? Geosci. Front. 2020, 11, 871–883. [Google Scholar] [CrossRef]
- Zhao, B.; Ge, Y.; Chen, H. Landslide susceptibility assessment for a transmission line in Gansu Province, China by using a hybrid approach of fractal theory, information value, and random forest models. Environ. Earth Sci. 2021, 80, 441. [Google Scholar] [CrossRef]
- Chiessi, V.; Toti, S.; Vitale, V. Landslide Susceptibility Assessment Using Conditional Analysis and Rare Events Logistics Regression: A Case-Study in the Antrodoco Area (Rieti, Italy). J. Geosci. Environ. Prot. 2016, 4, 72394. [Google Scholar] [CrossRef]
- Baeza, C.; Lantada, N.; Moya, J. Influence of sample and terrain unit on landslide susceptibility assessment at La Pobla de Lillet, Eastern Pyrenees, Spain. Environ. Earth Sci. 2010, 60, 155–167. [Google Scholar] [CrossRef]
- De Sy, V.; Schoorl, J.M.; Keesstra, S.D.; Jones, K.E.; Claessens, L. Landslide model performance in a high resolution small-scale landscape. Geomorphology 2013, 190, 73–81. [Google Scholar] [CrossRef]
- Wan, Q.; Tang, Z.; Pan, J.; Xie, M.; Wang, S.; Yin, H.; Li, J.; Liu, X.; Yang, Y.; Song, C. Spatiotemporal heterogeneity in associations of national population ageing with socioeconomic and environmental factors at the global scale. J. Clean. Prod. 2022, 373, 133781. [Google Scholar] [CrossRef]
- Song, C.; Yin, H.; Shi, X.; Xie, M.; Yang, S.; Zhou, J.; Wang, X.; Tang, Z.; Yang, Y.; Pan, J. Spatiotemporal disparities in regional public risk perception of COVID-19 using Bayesian Spatiotemporally Varying Coefficients (STVC) series models across Chinese cities. Int. J. Disaster Risk Reduct. 2022, 77, 103078. [Google Scholar] [CrossRef]
Publisher’s Note: MDPI stays neutral with regard to jurisdictional claims in published maps and institutional affiliations. |
© 2022 by the authors. Licensee MDPI, Basel, Switzerland. This article is an open access article distributed under the terms and conditions of the Creative Commons Attribution (CC BY) license (https://creativecommons.org/licenses/by/4.0/).