You are currently viewing a new version of our website. To view the old version click .
Applied Sciences
  • Article
  • Open Access

26 September 2022

Research on a Fault Diagnosis Method of an A-Class Thermal Insulation Panel Production Line Based on Multi-Sensor Data Fusion

,
,
and
1
School of Electrical Engineering, China University of Mining and Technology, Xuzhou 221000, China
2
School of Information and Engineering, Xuzhou College of Industrial Technology, Xuzhou 221000, China
3
IOT Perception Mine Research Center, China University of Mining and Technology, Xuzhou 221000, China
4
School of Mechatronic Engineering, China University of Mining and Technology, Xuzhou 221000, China
This article belongs to the Special Issue Intelligent Machine Fault Diagnosis

Abstract

To detect the running state of an A-class thermal insulation board production line in real time, conveniently and accurately, a fault diagnosis method based on multi-sensor data fusion was proposed. The proposed algorithm integrates the ideas of Convolutional Neural Network (CNN), Long Short-Term Memory (LSTM) and Attention Mechanism, and combines a Dilated Convolution Module (DCM) with LSTM to recognize complex signals of multiple sensors. By introducing an attention mechanism, the recognition performance of the network was improved. Finally, the real-time status information of the production line was obtained by integrating attention weight. Experimental results show that for the custom multi-sensor dataset of A-class insulation board production line, the proposed CNN-LSTM fault diagnosis method achieved 98.97% accuracy. Compared with other popular algorithms, the performance of the proposed CNN-LSTM model performed excellently in each evaluation index is better.

1. Introduction

A-class insulation boards as one of the main materials of green environmental protection building insulation, are widely used in the construction industry because of their good thermal insulation properties. However, the manufacturing process of composite insulation board is very complex. A conventional insulation board production line consists of a rolling machine, molding machine, high pressure foaming machine, laminating machine, cutting machine and palletizing machines [1,2]. If one of the pieces of equipment fails, it affects the operation of the whole production line and results in the discontinuity of the process as well as other problems and various defects of the product. Therefore, effective fault diagnosis of the equipment can ensure the safe and stable operation of the insulation board production line.
The existing fault diagnosis methods for complex dynamic industrial systems include analytical methods, statistical methods and intelligent methods [3,4], and the technologies of distributed control systems, data storage, transmission have been widely used. However, in the face of massive data and control variables of production processes and equipment operation state, traditional analysis methods it has been difficult to fully extract the fault symptoms and causal logic relationship of data [5]. At the same time, complex systems contain the characteristics of dynamic randomness, multi-source uncertainty, high coupling and strong interference. Hence, it is difficult to establish accurate mathematical models and a complete or perfect expert knowledge system. The data-driven intelligent fault diagnosis method is more applicable because of data computational and modeling complexity in the era of big data [6]. Intelligent fault diagnosis methods have the advantages of direct and effective statistical analysis and information extraction of massive, multi-source and high-dimensional data. Based on the collected monitoring data of different sources and different types, intelligent fault diagnosis methods make use of various data mining techniques to obtain useful hidden information and achieve the purpose of detection and diagnosis [7].
An intelligent production line consists of multiple professional and automatic production lines and deploys a large number of intelligent sensors and components to the key link of product processing. Intelligent production lines are developing to provide high automation and integration. As the complexity of the production line increases, the possibility of module failures in the whole system increases [8,9]. Traditionally, this relies mainly on experienced workers to judge the running status of equipment. These methods make judgments on the state of equipment in the future based on general information recorded by the history of equipment maintenance, and may be limited due to the lack of complete analysis of equipment status and the influence of environmental factors [10]. In addition, the scheduled maintenance mode leads to insufficient or excessive maintenance and other problems. Compared with a traditional production line, an intelligent production line can monitor the running process and identify the running state of each component in the production process. Therefore, effective prediction of potential failures in the production line is essential to reduce maintenance and operation costs, and improve the overall performance of the production line.
Current production line fault diagnosis methods based on machine learning have problems of low prediction accuracy, slow response and high false alarm rate. Therefore, in view of the above problems, we propose a fault diagnosis method based on a recurrent neural network to accurately predict all kinds of faults that may occur in the production process of an A-class thermal insulation board production line.
A novel fault diagnosis method for an A-class thermal insulation panel production line based on deep learning is proposed. The main contributions of this paper are as follows:
(1) Convolutional Neural Network (CNN) and Long Short-Term Memory (LSTM) are integrated in the proposed fault diagnosis method;
(2) Am attention mechanism is introduced to obtain special data and mask useless information, which improves the feature extraction ability of the proposed model;
(3) A Dilated Convolution Module (DCM) with LSTM is proposed in the CNN-LSTM model, which reduces the number of parameters while maintaining the ability of model feature extraction.
The rest of the paper is organized as follows. Section 2 introduces related work concerning fault diagnosis methods and the background of deep learning methods based on data fusion and LSTM. The proposed fault diagnosis method of an A-class thermal insulation panel production line is demonstrated in Section 3, and experiments and corresponding results are presented in Section 4. Finally, Section 5 shows the application of the detection system, and Section 6 concludes this paper and discusses future work.

3. Fault Diagnosis Method Based on LSTM and Multi-Sensor Data Fusion

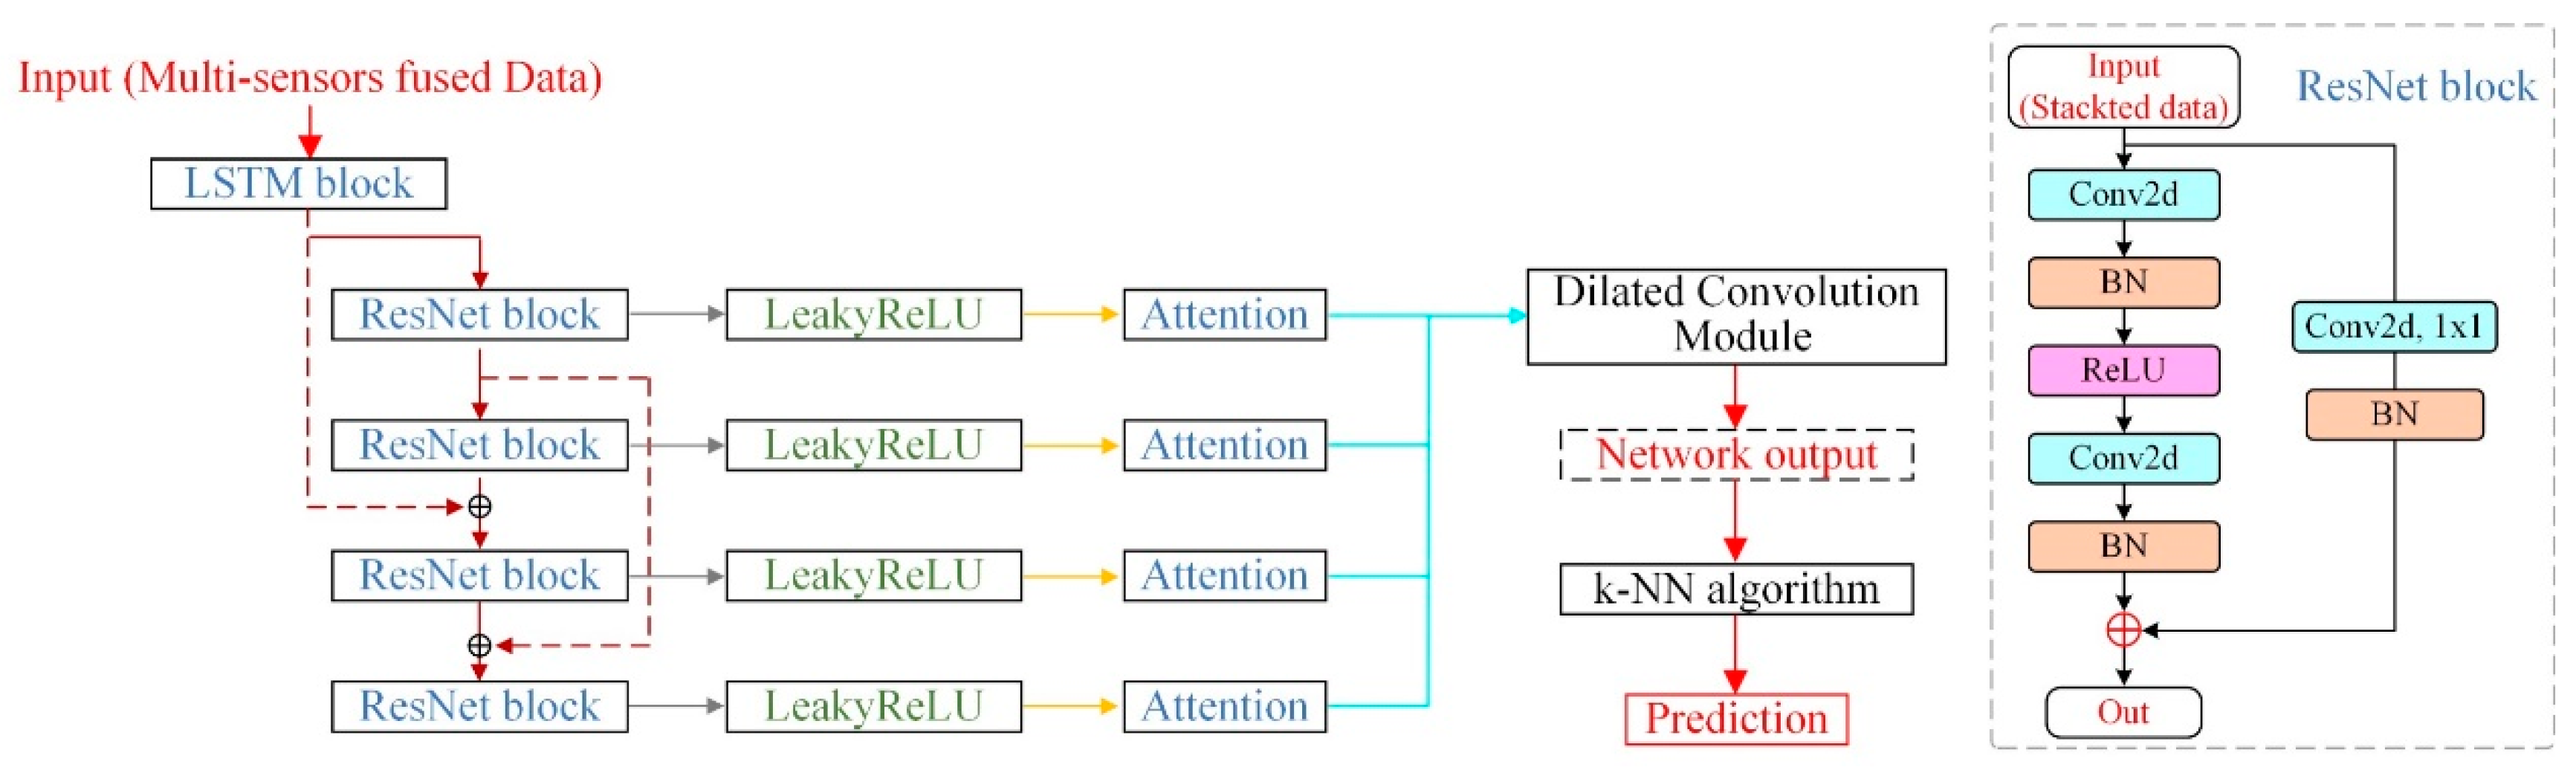
3.1. The Network Architecture of LSTM Based on Multi-Sensor Data Fusion

The architecture of a LSTM network is one kind of Recurrent Neural Network (RNN) network. Compared with basic version of RNN, LSTM can address the problem of exploding gradients and gradient vanishing and deal with relatively long-term data. The network architecture of LSTM is more complicated than of RNN, and the internal framework of LSTM adds three gated activation functions, i.e., input gate i t , forgetting gate f t and output gate o t . The gated mechanism alleviates the problems of vanishing gradient and exploding gradient of RNN and solves the problem of long-term dependence relationship. The essential updating of LSTM can be described as follows:
i t = σ ( W i · [ h t 1 ,   x t ] + b i )
f t = σ ( W f · [ h t 1 ,   x t ] + b f )
o t = σ ( W o · [ h t 1 ,   x t ] + b o )
where, i t , f t and o t denote input gate, forget gate and output gate, respectively, h t 1 denotes last time output, W * denotes the weight coefficient matrix, and b * represents the offset vector. The network architecture of a basic LSTM block is displayed in Figure 1. According to characteristics of time sequence data and multi-factor correlation, a fault diagnosis method of an A-class thermal insulation panel production line is proposed based on LSTM and multi-sensor feature fusion. The detailed network architecture is shown in Figure 2. The outputs of LSTM block are concatenated along channels, which satisfy the requirements for subsequent attention and dilated convolution modules. Because of the implementation of a ResNet block, and attention and dilated Convolution modules, the proposed model can merge the outputs of the LSTM block and predict the state of the production line.
Figure 1. The schematic diagram of basic LSTM block.
Figure 2. The network architecture of the proposed CNN-LSTM based on multi-sensor fusion.
The basic LSTM block has three main stages:
  • Forget stage. This phase is mainly about selectively forgetting the input passed in by the previous node. That is, the network determines whether the intermediate information should be forgotten or remembered. Specifically, it controls information flow from the previous state, which needs to be retained or forgotten, by calculating the value of the forgetting gate.
  • Memory stage. This stage is to decide what new information should be kept in the cell state. A sigmoid layer as the input gate layer decides which values should be updated. A tanh layer creates a vector of new candidate values, then combines above values to create an update to the state;
  • Output stage. This is the final stage to decide which information is outputted. This output of the proposed CNN-LSTM contains prediction of each sensor deployed on equipment. Then, the network output is fed into the k-NN algorithm to obtain the final prediction.
The network output shown in Figure 2 is a ten-dimension tensor in which each dimension corresponds to the state of each sensor deployed in the A-class thermal insulation panel production line. Therefore, the output of the proposed CNN-LSTM model is a prediction of the current state of the production line. Finally, the fault diagnosis result is predicted by the k-NN algorithm, as further discussed in Section 4.
The proposed network structure of LSTM based on hierarchical residual connection is divided into three parts: the LSTM block, the ResNet module and the attention module. To enhance the feature expression ability of the current hidden layer state, the output of LSTM block is stacked by four residual connections and a LeakyReLU activation function. Then, the feature extraction capability of the network is improved by the attention module and the dilated convolution module. Finally, the predicted results are obtained by the Softmax function.

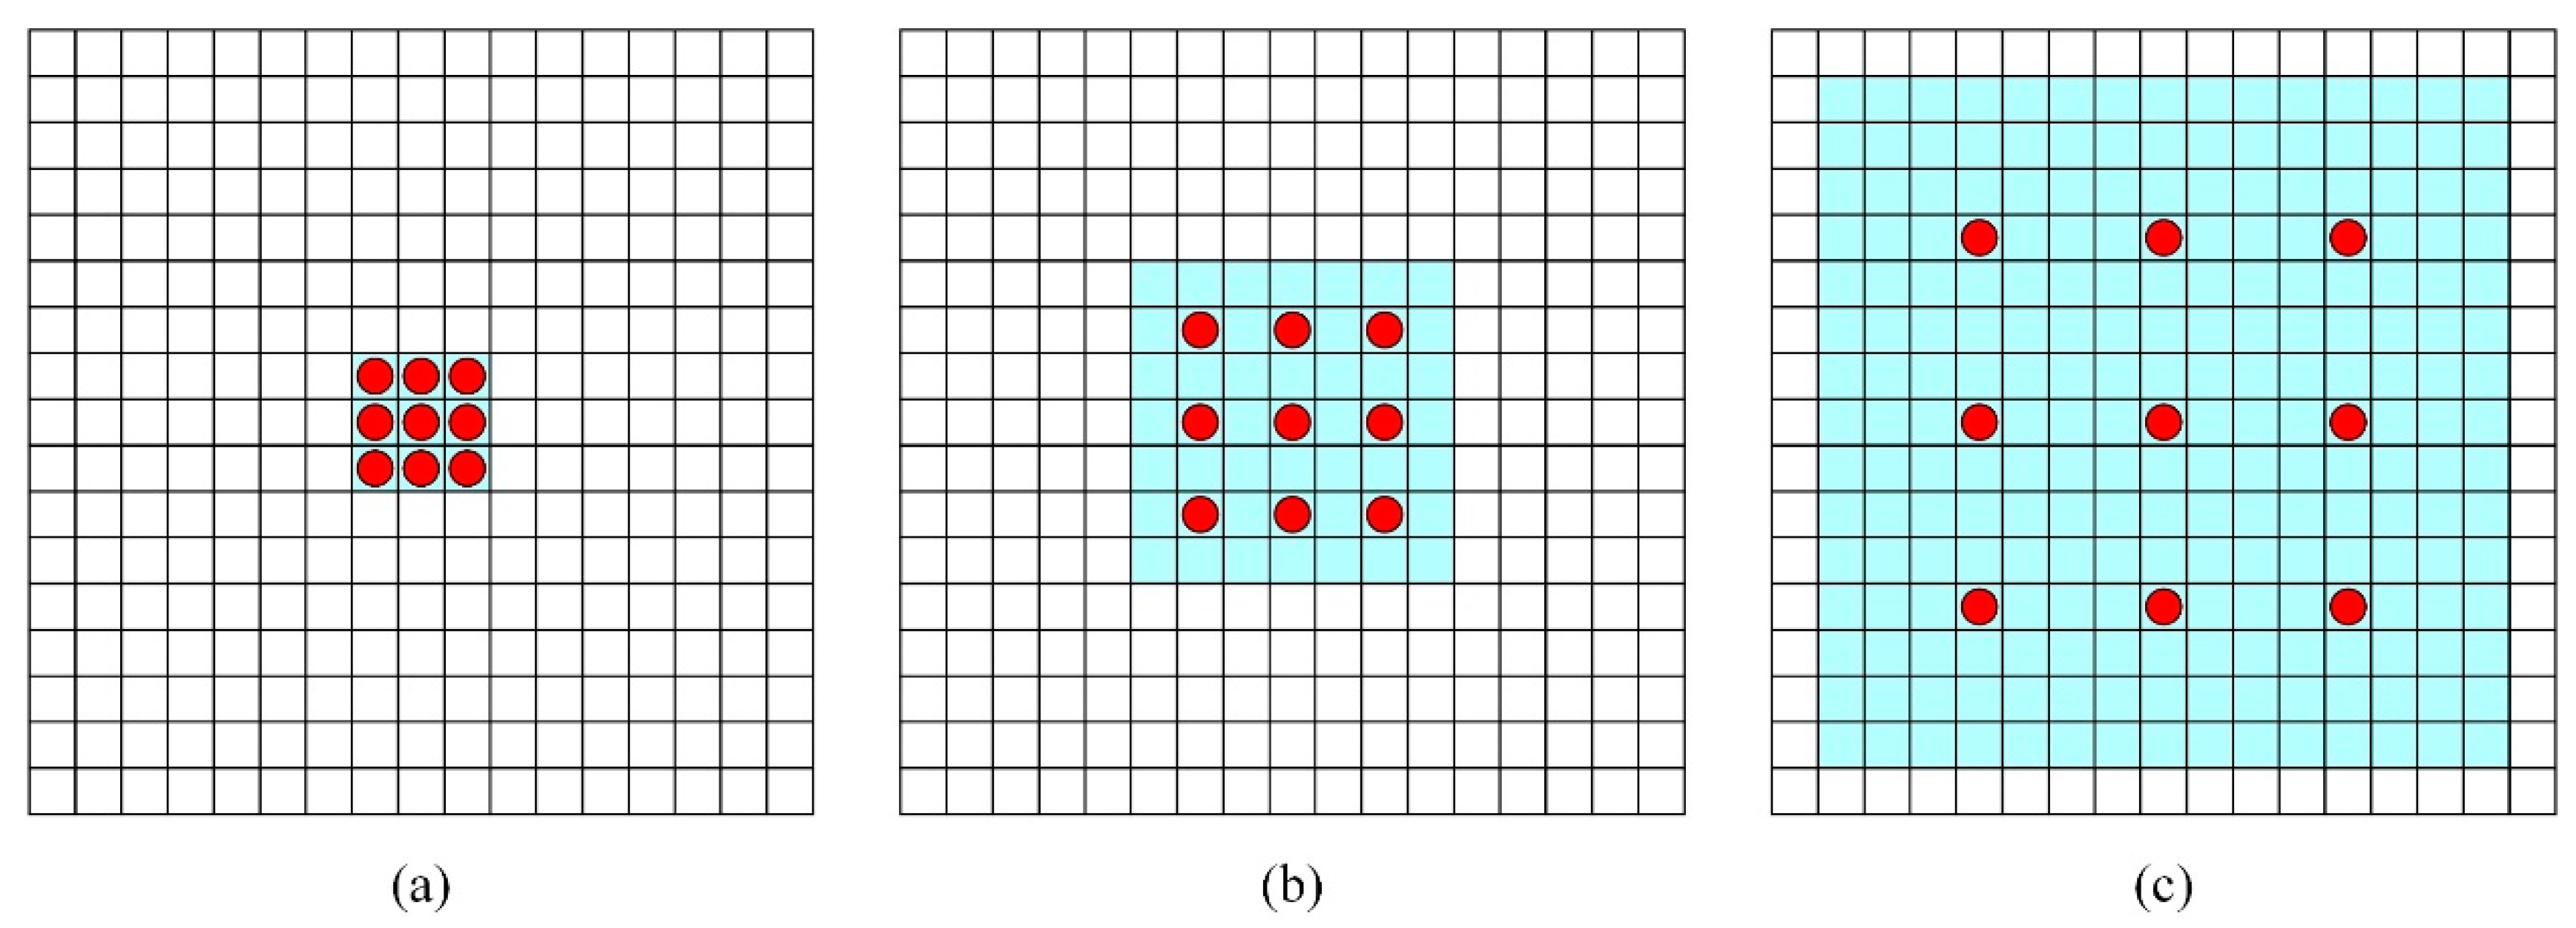
3.2. Dilated Convolution Module

Dilated convolution is proposed to solve some problems in image segmentation. For the task of image segmentation, the image fed into the convolutional network is filtered by convolutional layer before pooling layer. Image size can be reduced while the receptive field can be increased. Finally, the image size can be restored by up-sampling. However, in the process of downsampling or upsampling of the image, internal features and spatial hierarchical information are usually lost. Dilated convolution is proposed to alleviate the above problem. The dilated convolution module is shown in Figure 3, and can be described as:
r = i d i ( s i 1 )
where, r is the receptive field, d i represents dilation rate and s i denotes filter size.
Figure 3. Dilated Convolution layer with different dilation rates. (a) Kernel size of Dilated Convolution is 3 × 3 and dilation rate is 1, which is same as the normal convolution process. (b) 2-dilated conv with kernel size is 3 × 3 and zero padding; (c) 4-dilated conv.
The advantage is that the receptive field of the dilated convolution module is increased while losing hardly any detail information. The original 3 × 3 convolution kernel has a 5 × 5 (dilated rate = 2) or larger receptive field with the same number of parameters and computation cost of a normal convolutional module. For LSTM network, dilated convolution can fuse feature information of different scales and establish the dependence between features of different time series, which improves the recognition ability of the LSTM network.

3.3. Attention Mechanism

For different types of input data, the feature extraction ability of the LSTM network is different. In other words, some components of the input data may dominate the network data. With the attention mechanism introduced, the proposed network can focus on essential hidden features. Therefore, the outputs from different depths of the residual module are fed into the attention layer, which extracts multiscale features and enhances the proposed network prediction accuracy efficiently. The details of the attention block are displayed in Figure 4.
Figure 4. The attention block for the proposed CNN-LSTM network.
After full feature extraction from CNN-LSTM module, the characteristics of multi-sensor information acquired are sent to the proposed attention mechanism to optimize feature extraction. In addition to improving the depth of feature extraction, the proposed model can effectively identify specific information and adaptively adjust channel characteristics, which independently learn the critical information of various sensor features in the fault diagnosis of an A-class insulation panel production line. Hence, the proposed attention block effectively enhances the feature extraction ability.

4. Experiments

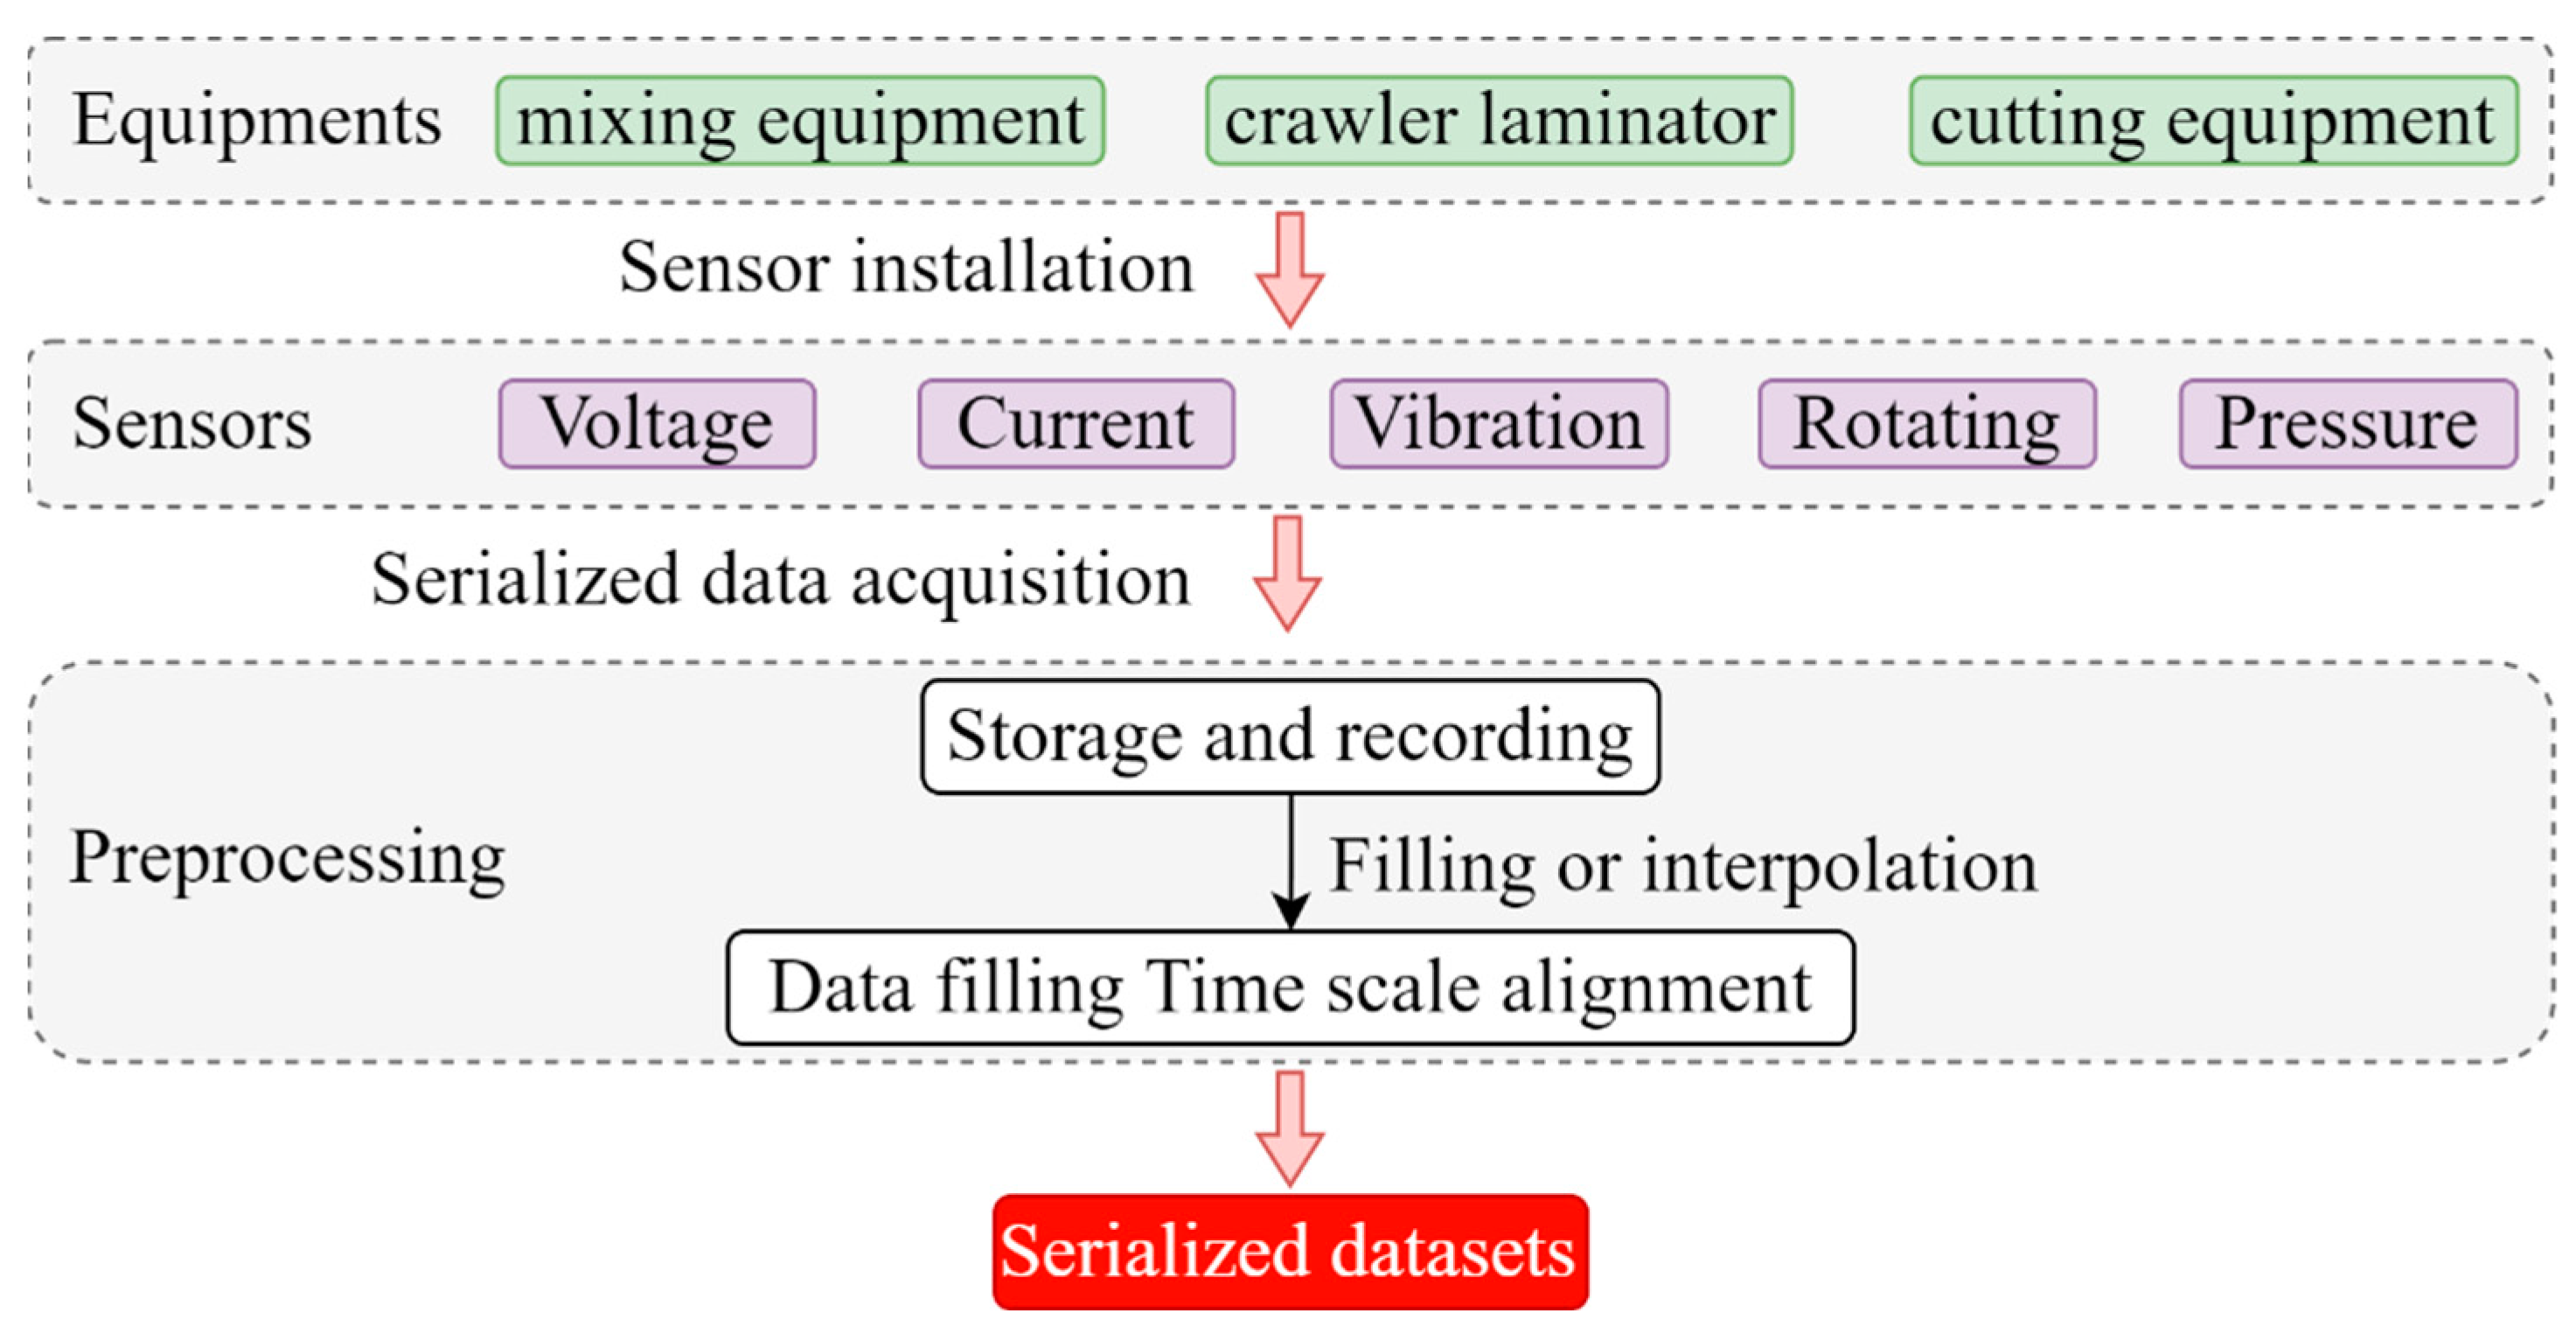
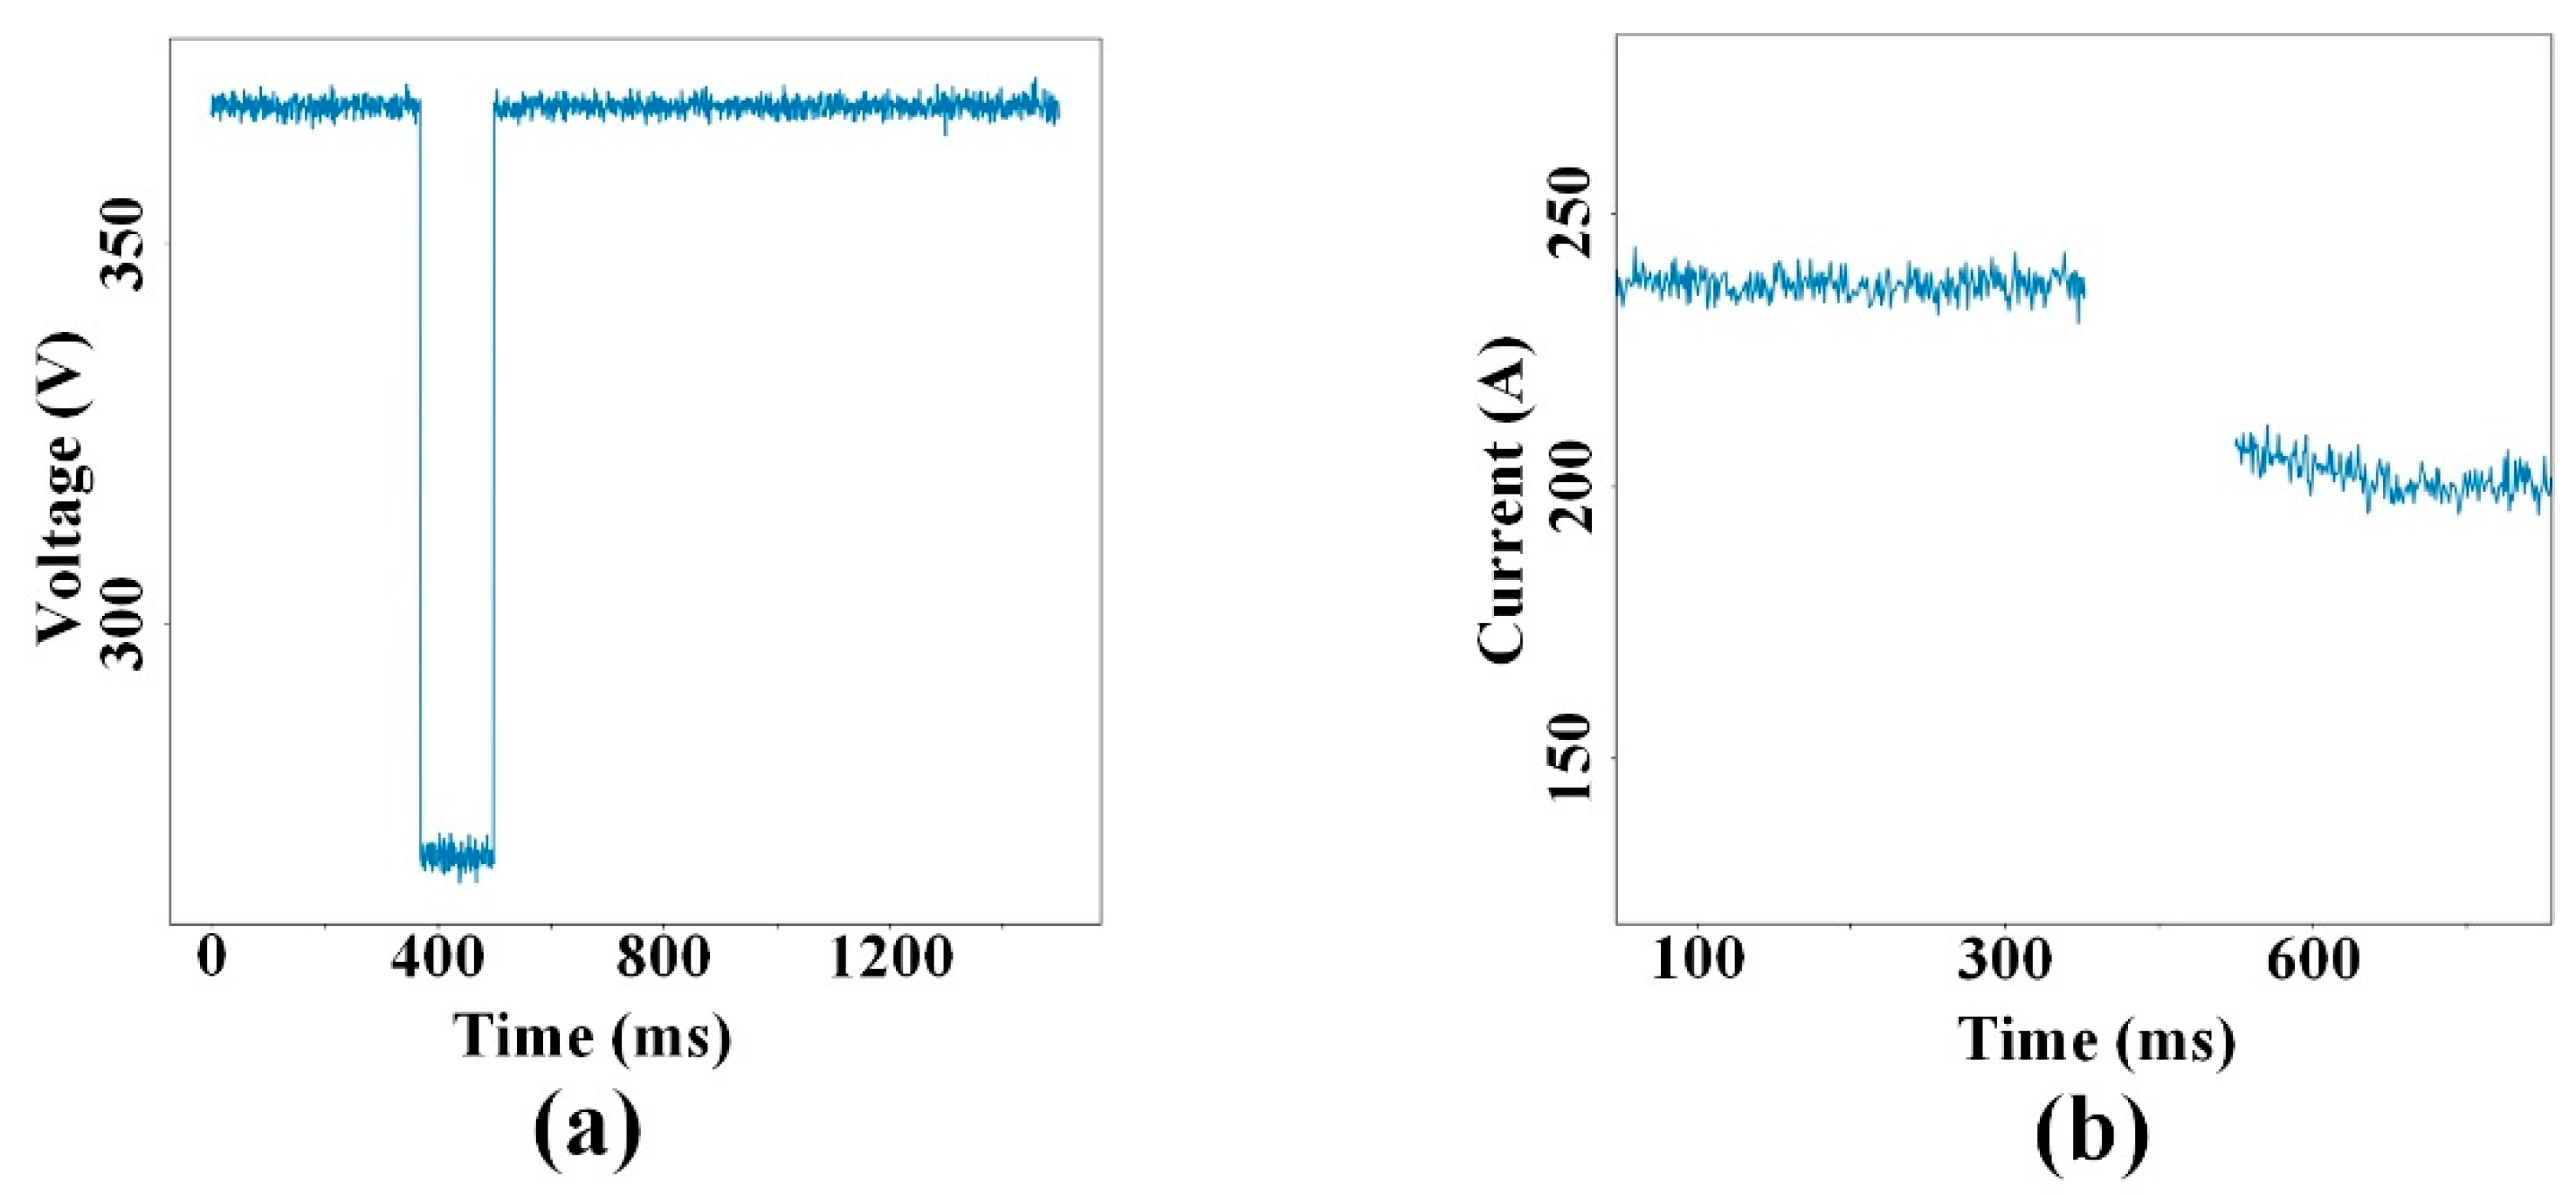
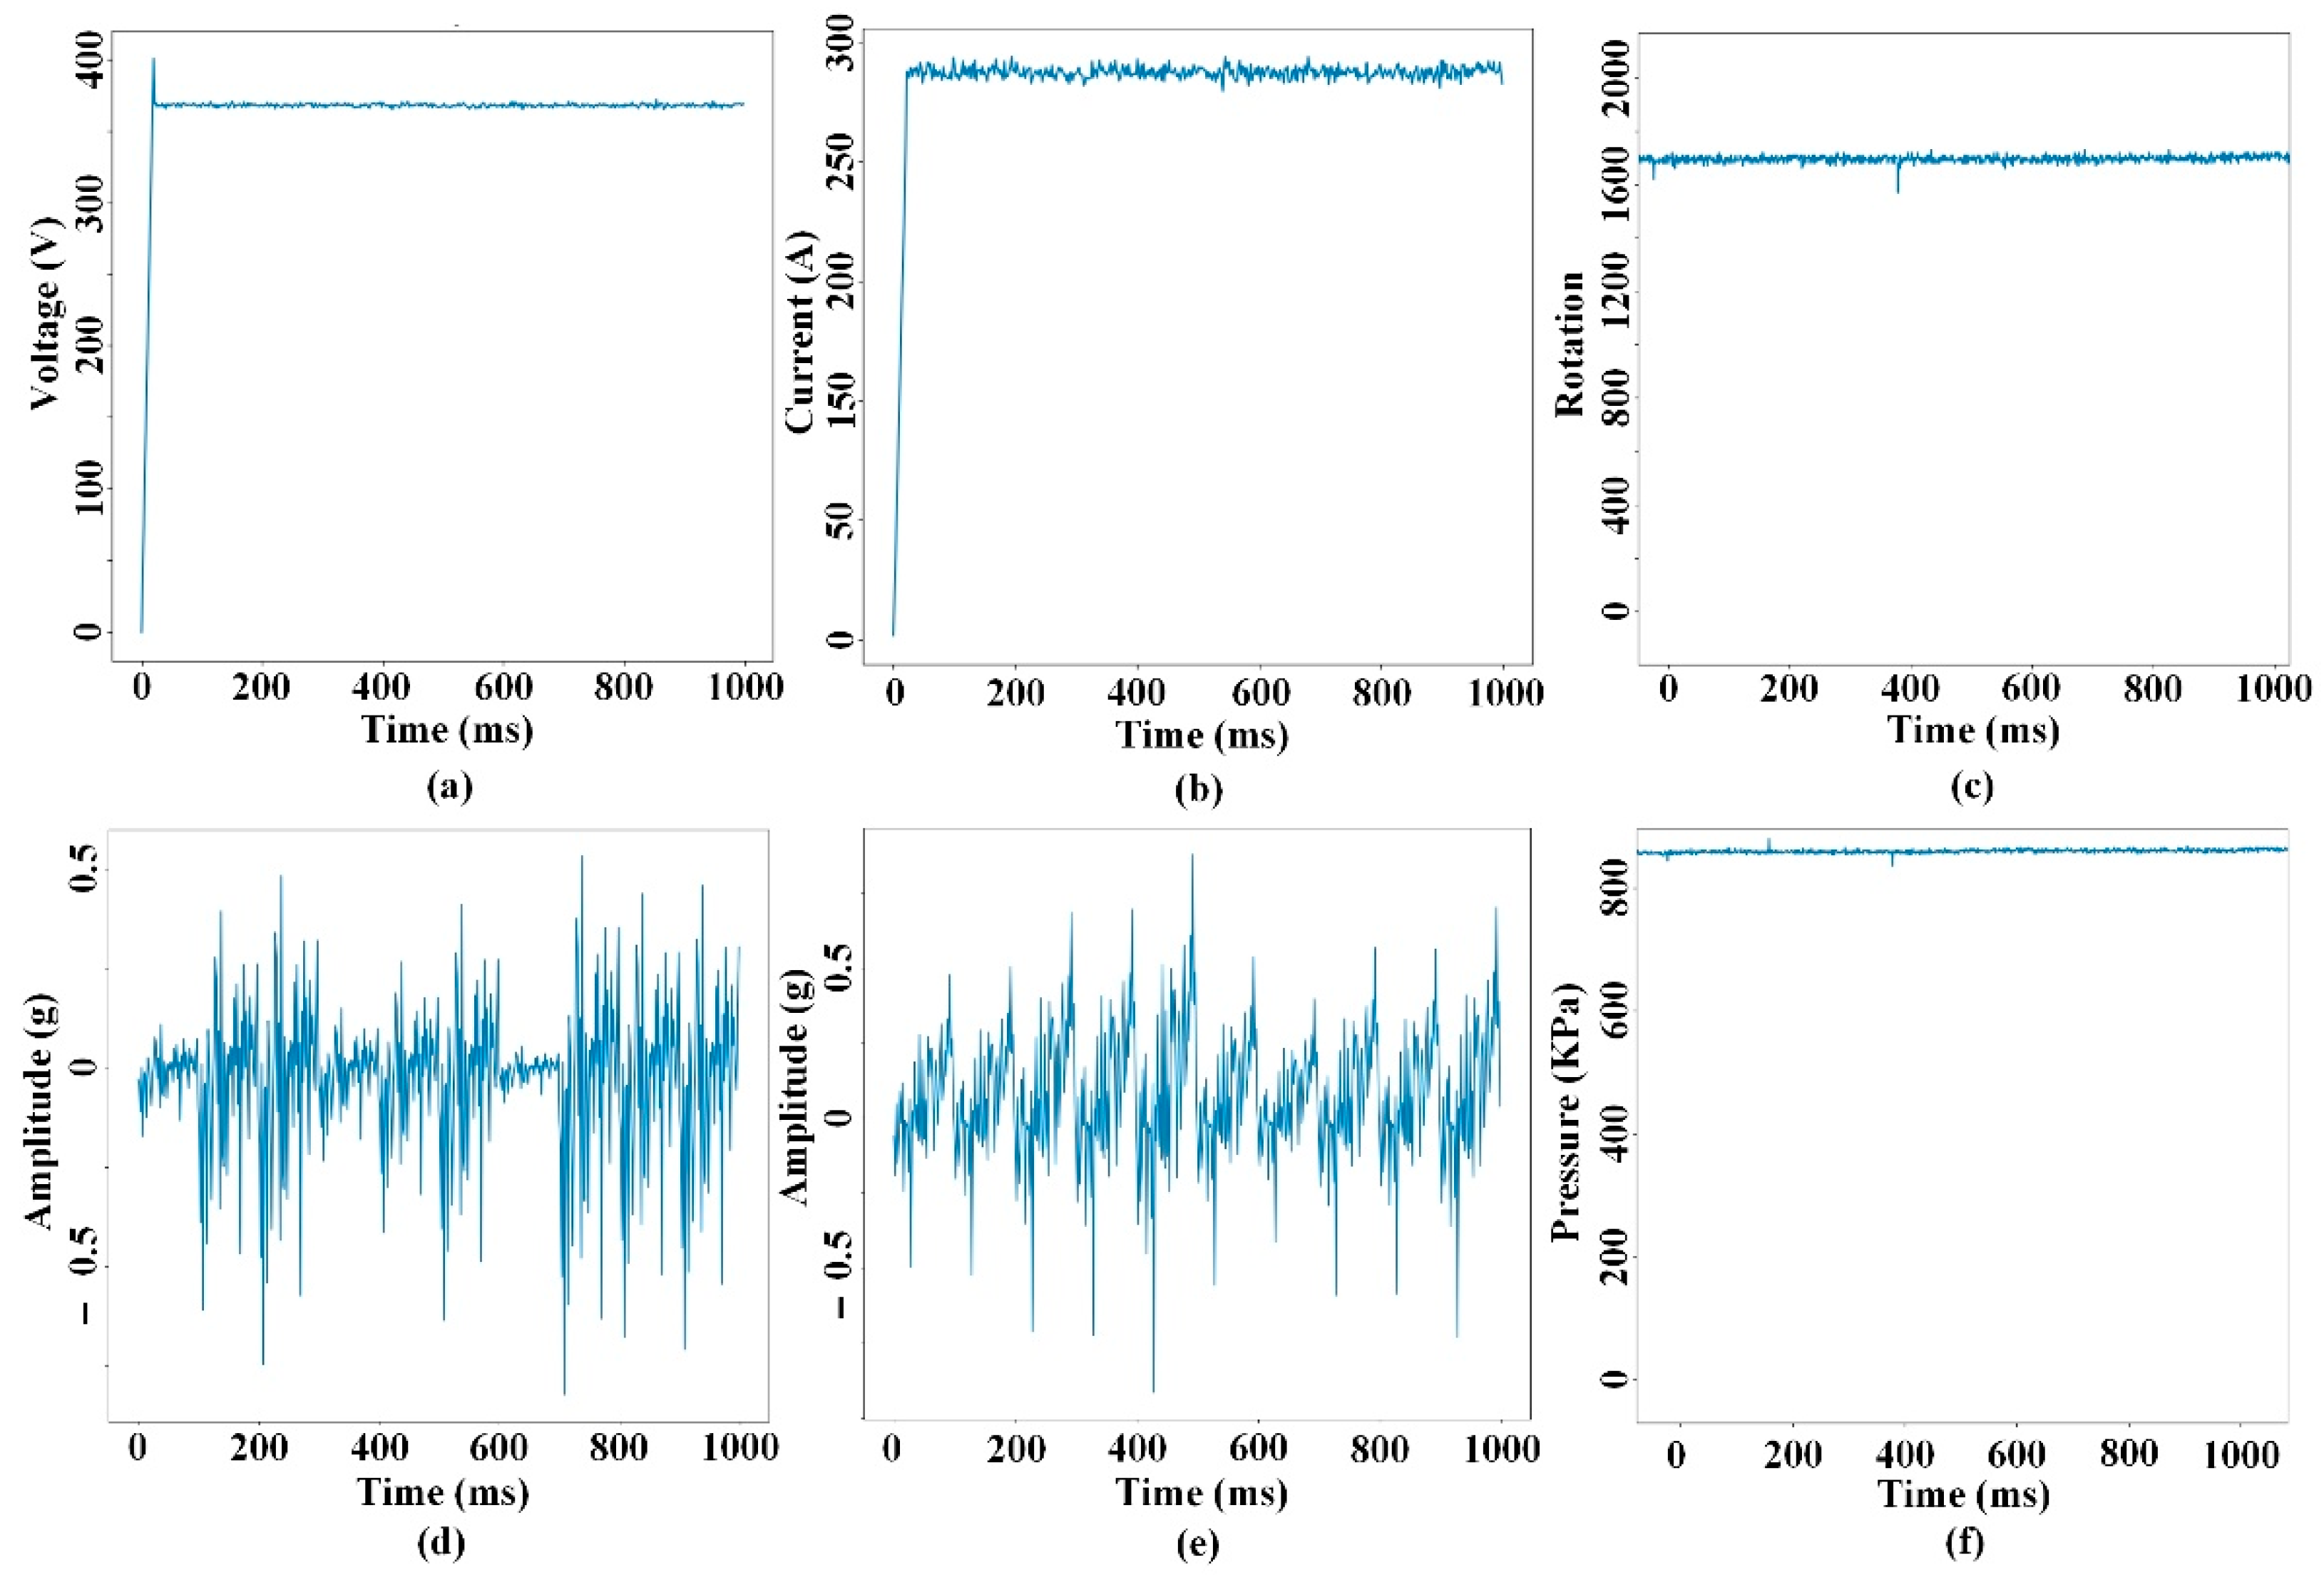
4.1. Data Preprocessing

Data fill and timing alignment. Multiple sensors are installed in the fault diagnosis system of an A-class insulation panel production line for the mixing equipment, crawler Laminator and cutting equipment. Each sensor measures the corresponding key parameters, e.g., voltage, current or vibration signals, which are recorded in the form of time series. However, due to various reasons, the data collected by various sensors are missing on a small scale. In addition, because of different sensors, the data collected by different types of sensors has the problem of time inconsistency. Data loss and data synchronization affect the data quality, leading to a decrease in accuracy of prediction analysis. Therefore, it is necessary to perform the processing of data filling and time scale alignment for the collected original data. Data preprocessing is shown in Figure 5.
Figure 5. Acquisition and preprocessing of data fill and timing alignment.
To solve the problem of missing data values, when the missing data is small, the historical data of the previous moment (or the next moment) of the missing data can be used to make up the missing data by a filling or interpolation method. A data completion method based on quadratic interpolation can be introduced, since the missing data are few. A fitting curve by quadratic interpolation can estimate the overall trend of a small data gap. When there is a large amount of missing data, the above method is no longer applicable, so it is necessary to compare the data measured by sensors of adjacent measuring points or other relevant measuring points, and fill the missing data according to the data correlation. The preferred method is to find similar data at a similar time by data similarity analysis. Principal component analysis (PCA) was used to perform data dimensionality reduction. The adjacent data whose similarity reached the threshold were used for data completion. If no similar data could be found, the entire segment of data with missing data were discarded. To solve the problem of time inconsistency of data collected by various sensors, it is necessary to transform the data. According to a uniform time interval, the mean value of all data values in the corresponding time period was taken to ensure the consistency of data collection frequency.
Time series data selection. In this paper, the data measured by a variety of sensors on the production line of an A-class insulation board were predicted and studied. According to a large number of relevant works, the data obtained from the actual measurement of A-class insulation board were selected. The signals of the LSTM-based multi-feature fusion prediction model adopted in this paper consisted of five parts, i.e., voltage, current, vibration, rotation and pressure, as listed in Table 1.
Table 1. Specification of different sensors installed on the production line.
K-Nearest Neighbor algorithm. The output of the proposed CNN-LSTM model is a 10-dimension tensor, which can perform fault diagnosis by cascading a certain classification algorithm. Hence, K-Nearest Neighbor (K-NN) was introduced as the final classifier because of high accuracy and flexibility. The capacity of the custom multiple-sensor dataset is enormous, so, labeling the custom dataset is time-consuming and tedious. Therefore, the k-means algorithm was introduced to preprocess the custom dataset, and labeling and double-checking each cluster by experienced experts. The well-prepared custom dataset by k-means algorithm can be used as training dataset for the proposed CNN-LSTM model.

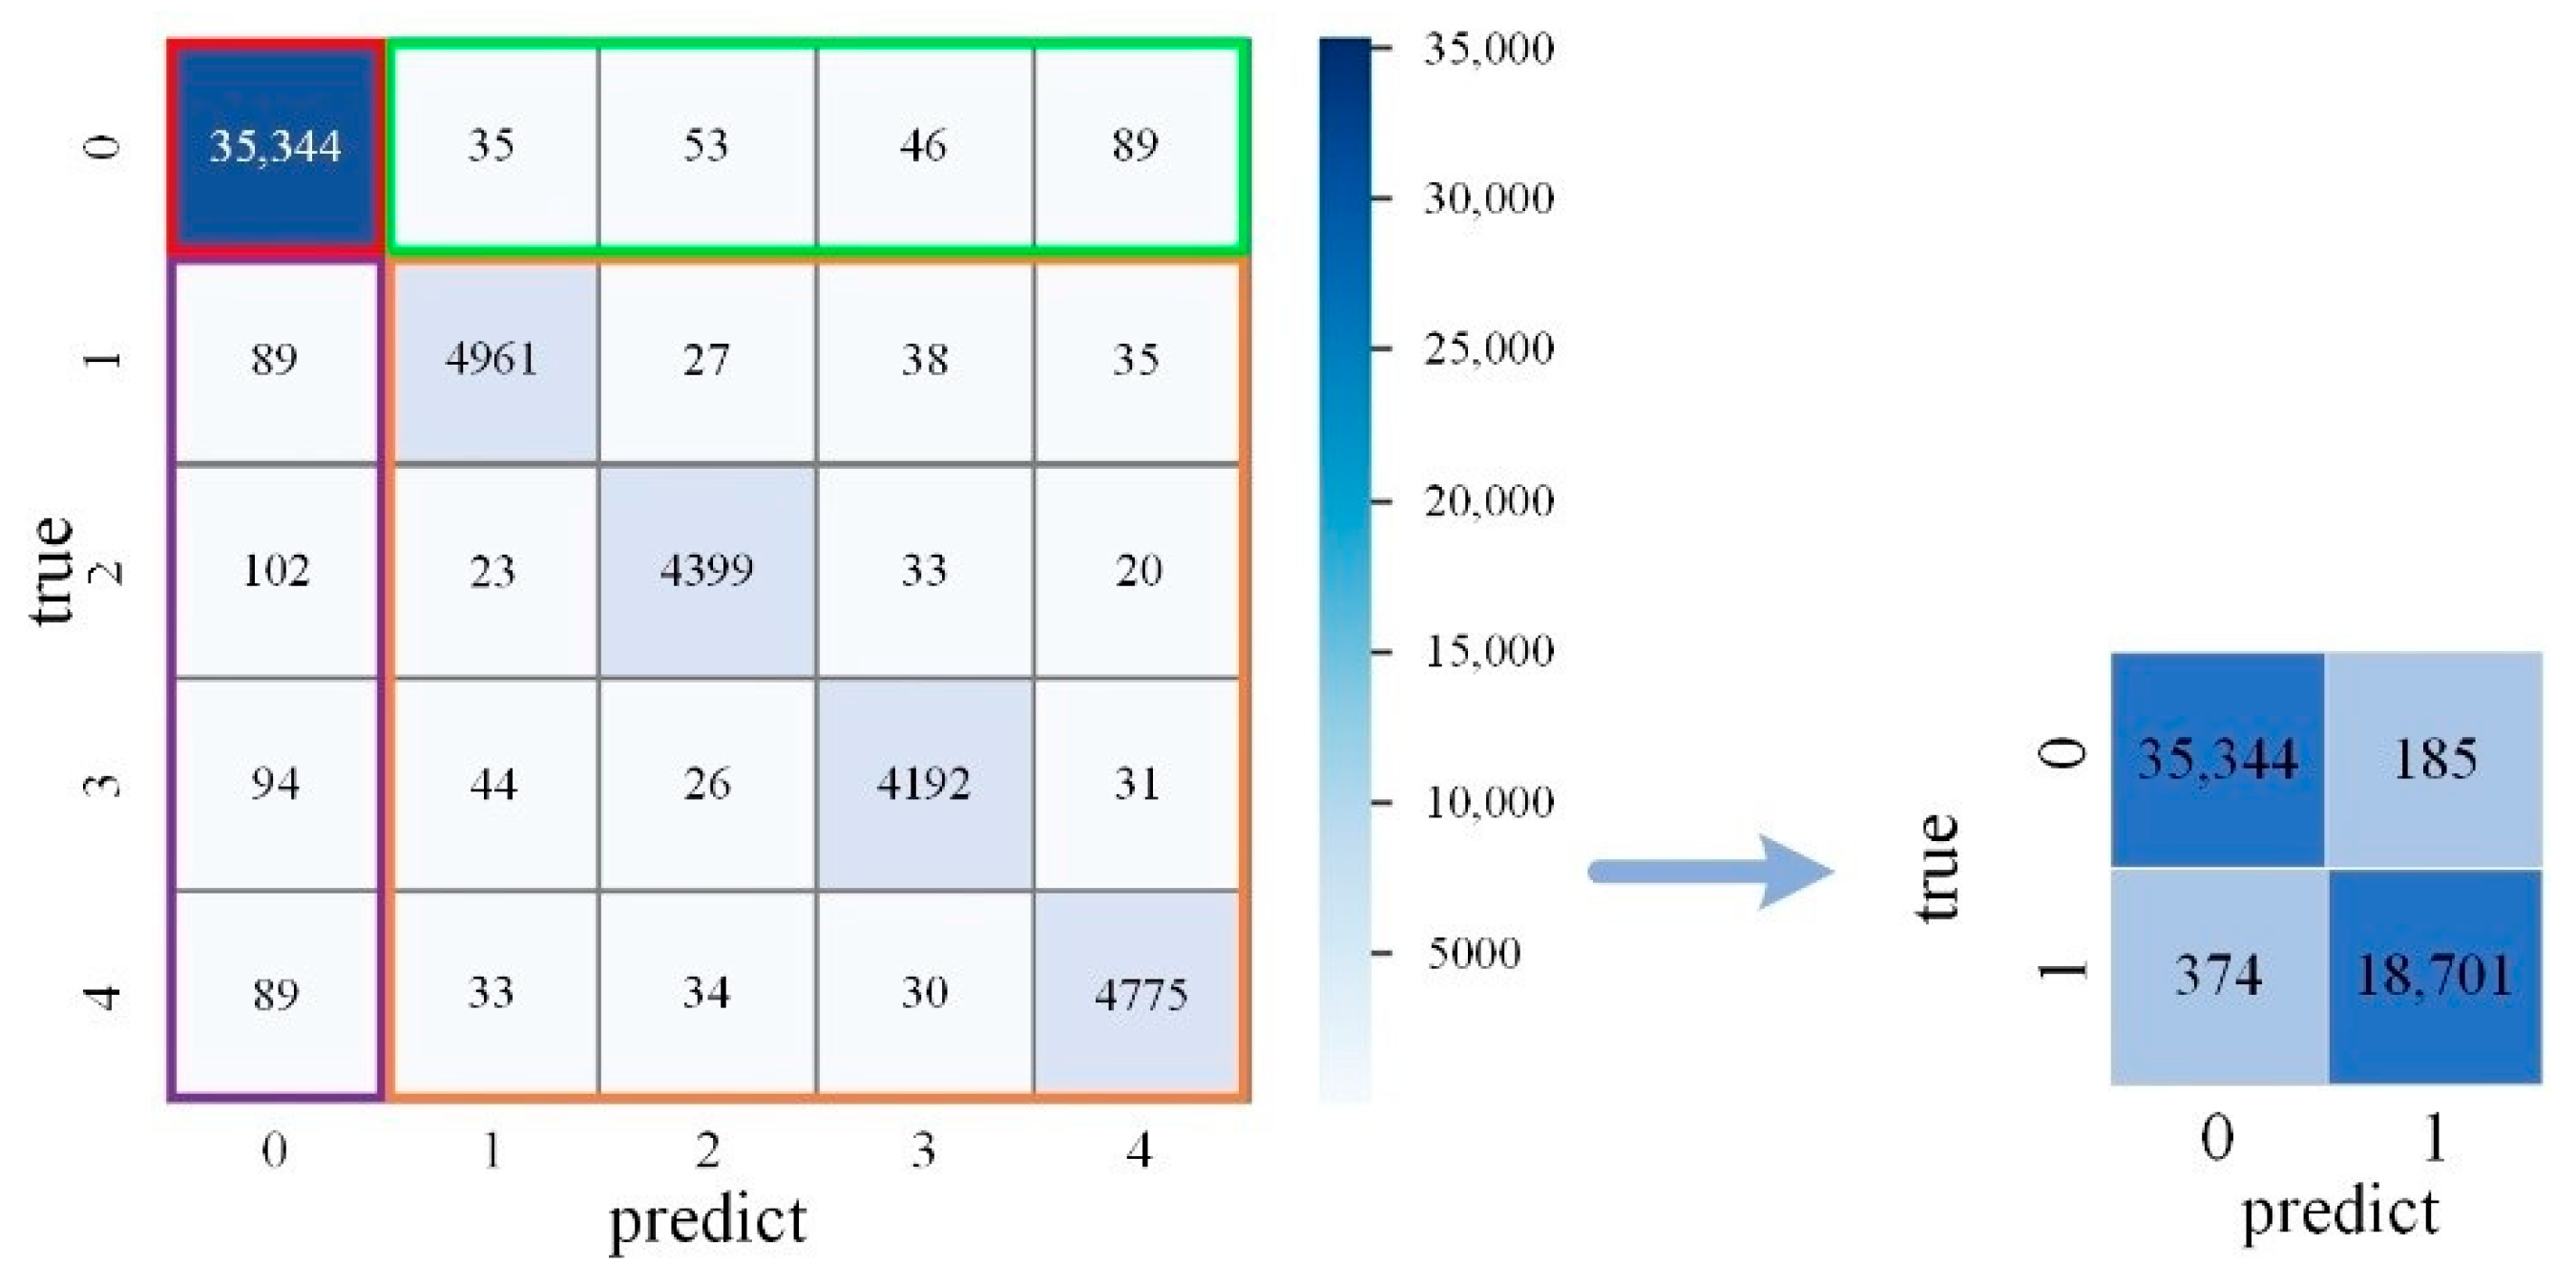
4.2. Experiments and Evaluation Method

Preparation. After the preprocessing of the data collected by various sensors in an A-class insulation panel production line, a complete time sequence signal dataset was established for training the CNN-LSTM network. Custom training and testing datasets acquired by above sensors are listed in Table 2. The running data of an A-class insulation panel production line at an average 16 h per day for 20 days were collected and preprocessed by a data filling algorithm. Data sampling rate was fixed at 1 kHz, and the mean of every 250 points was considered as a sample point. Therefore, the length of each sample in the custom multi-sensors dataset was 0.25 s, i.e., four samples per second.
Table 2. Detailed description of the custom dataset.
The collected dataset of the operation status of an A-class insulation board production line includes the normal operation status of the production line and five failure states: abnormal pressure of air compressor, failure or abnormality of cutting equipment, abnormal state of raw material mixing equipment, main motor failure, and spindle failure of stirring kettle, as listed in Table 3. Since serious data imbalance existed in the custom multiple-sensor dataset, data augmentation was applied to alleviate the influence of data imbalance. The data augmentation algorithm was mainly implemented by randomly cropping and inserting. Target data segment, i.e., data of abnormal state were randomly cropped and inserted into data of normal state. An abnormal pressure of the air compressor may lead to serious production accidents, and was one of the key monitoring nodes. Failure or abnormality of other equipment may cause serious quality problems of A-class thermal insulation boards. Therefore, a data augmentation algorithm was mainly applied at the time periods when abnormal appearance was observed. The ratio of normal to abnormal (air compressor, cutting equipment, mixing equipment and stirring kettle) state was 65.4 : 34.6   ( 8 : 9.3 : 8.3 : 9 ) , which is close to 65 : 35 . The original data captured from each sensor is displayed in Figure 6. These abnormal data were caused by electromagnetic interference, load change or other reasons, and may revert to normal in a short time, and should not be treated as faults. Hence, the original data should be preprocessed. Part of the preprocessed training data is shown in Figure 7. Considering the high-sensitivity of deployed sensors, the average value and overall trend of each sensor are helpful to train the proposed model and predict the state of the production line. To give a rough impression, subplots (a) and (b) refer to the starting moment, and subplots (c) to (f) reflect the normal running state of corresponding equipment.
Table 3. The possible state of each device in A-class insulation panel production line (Original dataset).
Figure 6. Original data captured from various sensors. Subplots (a,b) are curves of voltage and current, in which abnormal data exist.
Figure 7. The preprocessed dataset of multi-sensor signals. Subplots (af) are signals of voltage, current, rotation, vibration-x, vibration-y and pressure, respectively. Subplots (a,b) refer to the starting moment, and subplots (cf) reflect the normal running state of corresponding equipment.
As can be seen from the figure, the preprocessed data have the same sampling frequency, which can effectively represent the operating status of each device.
Training. Adam was selected as the optimizer with a momentum of β 1 = 0.95 , β 2 = 0.997 in the training process. Batch size was fixed to 128, and the learning rate was 0.0002 at the beginning. The decay ratio of learning rate was 0.98 per five epochs; hence, the final learning rate was 2 e 4 × 0.98 40 8.9 e 5 . In the training process, the changes of mean square error (MSE) loss of the training and testing set are shown in Figure 8. In the first 30 epochs of training, the mean square error loss of the training set and test set showed a rapid decreasing trend, but after epoch 160, the decreasing trend became slower. As can be seen from Figure 8, in the training and testing set, MSE loss after training of epoch 180 are both minimum values. To select the model with the best performance, the model parameters after epoch 190 of training were selected as the final CNN-LSTM model parameters. At this time, the MSE loss of the training and testing set were about 0.4227 and 0.4213, respectively.
Figure 8. MSE loss curves of the proposed CNN-LSTM model. (a) Loss curve of the training dataset. (b) Loss curve of the testing dataset.
Testing. To verify the feasibility and effectiveness of the proposed CNN-LSTM model for the fault diagnosis method of an A-class thermal insulation board production line, four evaluation indexes, i.e., accuracy, precision, recall and F1-sore, were adopted to evaluate the prediction of the model and compare these with other algorithms, e.g., RNN [39], LSTM [40], SVM [33] and 1D-CNN [41]. In the same dataset, the proposed LSTM fault diagnosis model was used to train the multi-sensor dataset of an A-class insulation panel production line. The comparison is shown in Table 4, and the formulations can be described as follows:
Precision = TP / ( TP + FP )
Recall = TP / ( TP + FN )
Accuracy = ( TP + TN ) / ( TP + TN + FP + FN )
F 1 = 2 · ( Precision · Recall ) / ( Precision + Recall )
where, TP ,   FP ,   TN   and   FN denote True Positive, False Positive, True Negative and False Negative. All algorithms involved in the comparison were slightly modified to fit the task, which was to predict the state of the production line in the next 10 s by the data of the last 100 s. Time consumption refers to the cost of time per prediction. The confusion matrix is shown in Figure 9 to provide further insights. The essential problem is how to predict if the production line is running properly or not. Although the output of the proposed CNN-LSTM model is multi-classification, false classifications among abnormal states of different equipment are not concerned. In other words, the multi-classification can be regarded as binary classification. Therefore, the left multi-classification confusion matrix in Figure 9 can be converted to a right matrix, which simplifies the fault diagnosis problem, in which 0 and 1 represent the normal and abnormal states, respectively.
Table 4. Comparison of results between the proposed network and other algorithms.
Figure 9. Confusion matrix of the proposed model, with 0 to 4 referring to normal and abnormal of states of the air compressor, cutting equipment, mixing equipment and stirring kettle, respectively.
In terms of fault diagnosis performance, the proposed CNN-LSTM model was obviously superior to other network based on RNN and SVM-based methods. Compared with typical deep RNN model and LSTM models applied in recent years, the proposed CNN-LSTM model is better by all criteria, reaching 98% on average and meeting the needs of fault diagnosis in actual production.

5. Application

The proposed fault diagnosis system was applied in an actual production environment. The A-class insulation board production line consists of mixing equipment, a caterpillar laminating machine and cutting equipment. It is essential to keep each piece of equipment of an A-class insulation board production line normal and efficient in operation. Therefore, the voltage and current data of key nodes, vessel pressure and vibration signals of key motors of mixing equipment, crawler laminator and cutting equipment were sampled and monitored in real time. The production line of an A-class insulation board production line and its various sensors for key nodes are shown in Figure 10, and the specifications of deployed sensors are listed in Table 5. Data were acquired and sent to a computer by a PLC. All kinds of collected signals were preprocessed to ensure the integrity and credibility for each key node. Detailed procedures of signal preprocessing are described in Section 4. The training and testing datasets consisted of preprocessed multi-sensor data and were fed into the proposed CNN-LSTM network. The proposed CNN-LSTM network and datasets were sent to the server for training to obtain well-trained predictable models. The configuration of the high-performance server used for training is shown in Table 6.
Figure 10. The A-class insulation board production line and detailed pictures of various sensors. (A) Container pressure sensor. (B) Voltage sensor (AC). (C) Current sensor (DC). (D) Vibration sensor.
Table 5. Specifications of different sensors deployed in the production line.
Table 6. Specification of the high-performance server.
Data collected by each sensor were processed by a computer and fed into the proposed CNN-LSTM model. The output of the network contained the prediction of the next 10 s states of each piece of equipment, and was classified by the k-NN algorithm to obtain the final diagnosis. Days of industrial testing proved the prediction accuracy and stability of the proposed model. Prediction accuracy over 10 s reached 98.7%, and decreased by 6% when the prediction duration was increased to 15%. In general, a timely response, i.e., load reduction or shutdown, could be made with accurate prediction within 10 s. Hence, the proposed CNN-LSTM model satisfied the requirement of industrial production.

6. Conclusions and Future Works

In this paper, a fault diagnosis method for an A-class insulation panel production line based on multi-sensor fusion is proposed. A CNN-LSTM-based network, combined with an attention mechanism, improved hidden features extraction. Real-time data of an A-class insulation panel production line were collected by placing multiple sensors at key nodes. A well-trained model based on CNN-LSTM was validated by multiple sets of experiments. The experimental results showed that the prediction precision of the proposed fault diagnosis method reached 98.7%, could accurately predict different types of faults for an A-class insulation panel production line, and fully met the needs of industrial production. In future work, research on production line state prediction method for an A-class insulation board will be carried out to predict the production line state in real time and to improve production efficiency.

Author Contributions

Conceptualization, Y.W. and X.L. (Xiaowen Liu); methodology, Y.W.; software, Y.W.; validation, X.G. and X.L. (Xinhua Liu); formal analysis, X.G.; investigation, X.G.; resources, X.L. (Xinhua Liu); data curation, X.G.; writing–original draft preparation, Y.W.; writing-review and editing, X.L. (Xinhua Liu); visualization, Y.W.; supervision, X.L. (Xiaowen Liu); project administration, X.L. (Xiaowen Liu); funding acquisition, X.L. (Xinhua Liu). All authors have read and agreed to the published version of the manuscript.

Funding

This research was funded by the Postgraduate Research & Practice Innovation Program of Jiangsu Province, grant number SJCX22_1139.

Institutional Review Board Statement

Not applicable.

Data Availability Statement

Some or all data, models, or codes that support the findings of this study are available from the corresponding author upon reasonable request.

Conflicts of Interest

The authors declare that there is no conflict of interest regarding the publication of this article.

References

  1. Cintura, E.; Nunes, L.; Esteves, B.; Faria, P. Agro-industrial wastes as building insulation materials: A review and challenges for Euro-Mediterranean countries. Ind. Crop. Prod. 2021, 171, 113833. [Google Scholar] [CrossRef]
  2. Giannotas, G.; Kamperidou, V.; Barboutis, I. Tree bark utilization in insulating bio-aggregates: A review. Biofuels Bioprod. Biorefining 2021, 15, 1989–1999. [Google Scholar] [CrossRef]
  3. Wang, H.; Li, S.; Song, L.; Cui, L.; Wang, P. An Enhanced Intelligent Diagnosis Method Based on Multi-Sensor Image Fusion via Improved Deep Learning Network. IIEEE Trans. Instrum. Meas. 2019, 69, 2648–2657. [Google Scholar] [CrossRef]
  4. Zhao, R.; Yan, R.; Chen, Z.; Mao, K.; Wang, P.; Gao, R.X. Deep learning and its applications to machine health monitoring. Mech. Syst. Signal Process. 2019, 115, 213–237. [Google Scholar] [CrossRef]
  5. Okada, K.F.A.; de Morais, A.S.; Oliveira-Lopes, L.C.; Ribeiro, L. A Survey on Fault Detection and Diagnosis Methods. In Proceedings of the 14th IEEE International Conference on Industry Applications (INDUSCON), São Paulo, Brazil, 15–18 August 2021; pp. 1422–1429. [Google Scholar]
  6. Zhang, W.T.; Yang, D.; Wang, H.C. Data-Driven Methods for Predictive Maintenance of Industrial Equipment: A Survey. IEEE Syst. J. 2019, 13, 2213–2227. [Google Scholar] [CrossRef]
  7. Qin, S.J. Survey on data-driven industrial process monitoring and diagnosis. Annu. Rev. Control 2012, 36, 220–234. [Google Scholar] [CrossRef]
  8. Lei, Y.; Yang, B.; Jiang, X.; Jia, F.; Li, N.; Nandi, A.K. Applications of machine learning to machine fault diagnosis: A review and roadmap. Mech. Syst. Signal Processing 2020, 138, 106587. [Google Scholar] [CrossRef]
  9. Duan, Z.; Wu, T.; Guo, S.; Shao, T.; Malekian, R.; Li, Z. Development and trend of condition monitoring and fault diagnosis of multi-sensors information fusion for rolling bearings: A review. Int. J. Adv. Manuf. Technol. 2018, 96, 803–819. [Google Scholar] [CrossRef]
  10. Lei, Y.G.; Lin, J.; He, Z.J.; Zuo, M.J. A review on empirical mode decomposition in fault diagnosis of rotating machinery. Mech. Syst. Signal Process. 2013, 35, 108–126. [Google Scholar] [CrossRef]
  11. Sun, J.-H.; Jeon, B.-S.; Lim, J.-W.; Lim, M.-T. Stereo Vision based 3D Modeling System For Mobile Robot. In Proceedings of the International Conference On Control, Automation And Systems (ICCAS 2010), Gyeonggi-do, Korea, 27–30 October 2010; pp. 71–75. [Google Scholar]
  12. Zhang, D.; Zhao, J.; Xu, Z.; Wang, Z. Strength Analysis of Dual-Chamber Hydrodynamic Coupling Based on One Way FSI. Mech. Eng. Green Manuf. 2010, 34-35, 105–110. [Google Scholar] [CrossRef]
  13. Tian, Y.; Lin, Z.-D.; Wang, X.-Y.; Che, L.-Y.; Lu, D.-W. Experimental progress of quantum machine learning based on spin systems. Acta Phys. Sin. 2021, 70, 140305. [Google Scholar] [CrossRef]
  14. Xie, J.; Su, Y.; Xue, D.; Jiang, X.; Fu, H.; Huang, H. Machine Learning for Materials Research and Development. Acta Metall. Sin. 2021, 57, 1343–1361. [Google Scholar]
  15. Safaeipour, H.; Forouzanfar, M.; Casavola, A. A survey and classification of incipient fault diagnosis approaches. J. Process Control 2021, 97, 1–16. [Google Scholar] [CrossRef]
  16. Zheng, H.; Wang, R.; Yang, Y.; Yin, J.; Li, Y.; Li, Y.; Xu, M. Cross-Domain Fault Diagnosis Using Knowledge Transfer Strategy: A Review. IEEE Access 2019, 7, 129260–129290. [Google Scholar] [CrossRef]
  17. Zaytoon, J.; Lafortune, S. Overview of fault diagnosis methods for Discrete Event Systems. Annu. Rev. Control 2013, 37, 308–320. [Google Scholar] [CrossRef]
  18. Xu, X.; Wang, H.; Zhang, N.; Liu, Z.; Wang, X. Review of the Fault Mechanism and Diagnostic Techniques for the Range Extender Hybrid Electric Vehicle. IEEE Access 2017, 5, 14234–14244. [Google Scholar] [CrossRef]
  19. Yang, Y.W.; Chen, G. Artificial neural network forecasting method in monitoring technique by spectrometric oil analysis. Spectrosc. Spectr. Anal. 2005, 25, 1339–1343. [Google Scholar]
  20. Li, H.; Xiao, D. Survey on data driven fault diagnosis methods. Control Decis. 2011, 26, 1–9. [Google Scholar] [CrossRef]
  21. Xu, F.; Tse, P.W. A method combining refined composite multiscale fuzzy entropy with PSO-SVM for roller bearing fault diagnosis. J. Cent. South Univ. 2019, 26, 2404–2417. [Google Scholar] [CrossRef]
  22. Velasco-Gallego, C.; Lazakis, I. Development of a time series imaging approach for fault classification of marine systems. Ocean Eng. 2022, 263, 112297. [Google Scholar] [CrossRef]
  23. Zhao, Y.; Ma, F.-X.; Wang, A.-J.; Li, D.-C.; Song, Y.-M.; Wu, J.; Cui, F.-X.; Li, Y.-Y.; Cao, Z.-C. Research on Electric Breakdown Fault Diagnosis Model of Transformer Insulated Oil Based on Fluorescent Double-Color Ratio. Spectrosc. Spectr. Anal. 2022, 42, 1134–1138. [Google Scholar]
  24. Velasco-Gallego, C.; Lazakis, I. RADIS: A real-time anomaly detection intelligent system for fault diagnosis of marine machinery. Expert Syst. Appl. 2022, 204, 117634. [Google Scholar] [CrossRef]
  25. Zhang, Z.-W.; Chen, H.-H.; Li, S.-M.; Wang, J.-R. A novel sparse filtering approach based on time-frequency feature extraction and softmax regression for intelligent fault diagnosis under different speeds. J. Cent. South Univ. 2019, 26, 1607–1618. [Google Scholar] [CrossRef]
  26. Yang, J.; Yin, S.; Sun, C.; Gao, T. A novel convolutional neural network with interference suppression for the fault diagnosis of mechanical rotating components. Neural Comput. Appl. 2022, 34, 10971–10987. [Google Scholar] [CrossRef]
  27. Zhao, B.; Zhang, X.; Wu, Q.; Yang, Z.; Zhan, Z. A novel unsupervised directed hierarchical graph network with clustering representation for intelligent fault diagnosis of machines. Mech. Syst. Signal Process. 2023, 183, 109615. [Google Scholar] [CrossRef]
  28. Du, D.-P.; Wang, S.-Y.; Guan, H.-T.; Wang, W.-B. Intelligent Fault Classification and Identification of Heat Exchange Station Based on Time-Series Analysis. In Proceedings of the 2021 6th International Conference on Automation, Control and Robotics Engineering (CACRE), Dalian, China, 15–17 July 2021; pp. 343–350. [Google Scholar]
  29. Zhou, J.; Hong, X.; Jin, P. Information Fusion for Multi-Source Material Data: Progress and Challenges. Appl. Sci. 2019, 9, 3473. [Google Scholar] [CrossRef]
  30. Zhang, P.; Li, T.; Wang, G.; Luo, C.; Chen, H.; Zhang, J.; Wang, D.; Yu, Z. Multi-source information fusion based on rough set theory: A review. Inf. Fusion 2021, 68, 85–117. [Google Scholar] [CrossRef]
  31. Xing, J.; Wu, W.; Cheng, Q.; Liu, R. Traffic state estimation of urban road networks by multi-source data fusion: Review and new insights. Phys. Stat. Mech. Its Appl. 2022, 595, 127079. [Google Scholar] [CrossRef]
  32. Weiss, S.; Achtelik, M.W.; Lynen, S.; Chli, M.; Siegwart, R. Real-time Onboard Visual-Inertial State Estimation and Self-Calibration of MAVs in Unknown Environments. In Proceedings of the IEEE International Conference on Robotics & Automation, Saint Paul, MN, USA, 14–18 May 2012. [Google Scholar]
  33. Li, Z.-M.; Gui, W.-H.; Zhu, J.-Y. Fault detection in flotation processes based on deep learning and support vector machine. J. Cent. South Univ. 2019, 26, 2504–2515. [Google Scholar] [CrossRef]
  34. Gu, Z.-Y.; Zhu, Y.-Y.; Xiang, J.-L.; Zeng, Y. A prediction method of operation trend for large axial-flow fan based on vibration-electric information fusion. J. Cent. South Univ. 2021, 28, 1786–1796. [Google Scholar] [CrossRef]
  35. Zhang, Y.; Jia, X.; Guo, B. Bayesian framework for satellite rechargeable lithium battery synthesizing bivariate degradation and lifetime data. J. Cent. South Univ. 2018, 25, 418–431. [Google Scholar] [CrossRef]
  36. Changchang, C.; Huawei, W.; Xiaomei, N.; Jiyu, H. Fault fusion diagnosis of aero-engine based on deep learning. J. Beijing Univ. Aeronaut. Astronaut. 2018, 44, 621–628. [Google Scholar]
  37. Ke, S.; Yanfei, Z.; Jinliang, G. Multi-sensor data fusion and navigation line extraction method based on discrete factor. J. South China Agric. Univ. 2022, 43, 92–98. [Google Scholar]
  38. Siqi, S.; Kun, H.; Cheng, L. Mobile node localization of underwater sensor array network based on multi-information fusion. Transducer Microsyst. Technol. 2022, 41, 143–146+151. [Google Scholar]
  39. Shahnazari, H. Fault diagnosis of nonlinear systems using recurrent neural networks. Chem. Eng. Res. Des. 2020, 153, 233–245. [Google Scholar] [CrossRef]
  40. Hao, S.J.; Ge, F.X.; Li, Y.M.; Jiang, J.Y. Multisensor bearing fault diagnosis based on one-dimensional convolutional long short-term memory networks. Measurement 2020, 159, 107802. [Google Scholar] [CrossRef]
  41. Eren, L.; Ince, T.; Kiranyaz, S. A Generic Intelligent Bearing Fault Diagnosis System Using Compact Adaptive 1D CNN Classifier. J. Signal Process. Syst. Signal Image Video Technol. 2019, 91, 179–189. [Google Scholar] [CrossRef]
Publisher’s Note: MDPI stays neutral with regard to jurisdictional claims in published maps and institutional affiliations.

Article Metrics

Citations

Article Access Statistics

Multiple requests from the same IP address are counted as one view.