1. Introduction
One of the most significant factors causing runway excursions is poor braking performance. Loss of control on the runway accounted for 15.5% of all the aviation accidents that occurred between 2010 and 2019 [
1]. In 2019 alone, those accidents cost the air transportation industry
$4B directly. Most of the accidents occur during winter since the runway is contaminated by snow, slush, ice, brine or water, rendering the surfaces slippery [
2]. They all have a negative effect on braking performance, significantly reducing the friction between aircraft tires and the runway surface, inhibiting maneuverability [
1,
2,
3,
4,
5,
6,
7].
Different methods exist in the literature to evaluate braking performance based on the state of the surface. Most of these are American Society for Testing and Materials (ASTM, West Conshohocken, PA, USA) standards used to measure the surface friction characteristics. These tests can be divided in four classes: (i) fixed tests, (ii) braking tests, (iii) contact tests, and (iv) non-contact tests.
Fixed tests are the most popular. There are a few apparatuses which allow the friction between the tire and runway to be measured directly. These apparatus are capable of performing lateral force tests (ASTM E670) [
8], fixed slip tests (ASTM E2340) [
9], and locked wheel tests (ASTM E274) [
10]. They all work following the same principle where a host vehicle drags a tribometer (here, a tire) maintaining a constant speed, thus allowing the friction and load force to be measured. The friction coefficient is then determined using the ratio of the friction and load forces.
The second class of tests consists of braking tests which are done by: (i) measuring the stopping distance (ASTM E445) [
11], or (ii) measuring the deceleration rate (ASTM E2101) [
12]. The stopping distance measurement is conducted by displacing a vehicle at 65 km/h on a contaminated road followed by locking of the wheels. The distance d is then measured until the point where the vehicle comes to a complete stop and the friction coefficient is then determined. The greater the distance, the lower the friction coefficient will be. In measuring the deceleration rate, on the other hand, a vehicle is displaced at a speed between 32 and 48 km/h followed by locking of the wheels to determine the deceleration. The friction coefficient is then calculated as a function of the difference between the initial and final speed. The greater the difference, the higher the friction coefficient will be. The application of the two latter classes is aimed at real-life operational cases and may not be considered for a laboratory test.
The third class consists of the contact tests. They are those tests which imply contact with a limited part of the runway. Contrarily to the other two classes, these tests could be easily performed under laboratory conditions, as well as in natural outdoor operational conditions. The main apparatus in this category is the British Pendulum Tester (BPT, ASTM E303) [
13]. The BPT is a dynamic test which works on the principle of the Sharpy test, whereby a rubber slider in contact with the surface allows for skid evaluation. The British Pendulum Tester allows for the evaluation of surface texture. The greater the surface roughness, the greater the difference will be. The result is given as the British Pendulum Number.
More recently, non-contact tests have been proposed to the industry: (i) electro-optic test, and (ii) the circular texture meter (ASTM E2157) [
14]. The electro-optic test measures the pavement texture properties at high-speed, using ultra high-frequency laser triangulation mounted on a car. On the other hand, the circular texture meter is used at a fixed position with a laser-displacement sensor. With this method, the surface macrotexture is determined using the calculated roughness parameters.
Although existing ASTM tests provide relevant information regarding the texture of the runway, which is important for the braking procedure of aircraft, more information is still needed to confirm the nature of contaminants on the surface. Efforts have been made to use weather and flight data to estimate surface conditions at landing using data analysis, machine learning and fusion and model correlation [
15,
16,
17]. A few sensors exist in the market that are mounted in the runway to predict the type of contaminant present [
18,
19,
20].
Hashimoto et al. developed a new sensor which operates using light scattering principles to accurately measure the snow cover properties [
18,
19]. The concept was proven using different snow samples having various grain size distribution, liquid water content, density and thickness. The sensors are still in the development stage and could be adapted to other types of precipitation or contaminants. Marchetti et al. demonstrated that Raman spectroscopy could be used to differentiate the fluids (aircraft and runway products), to identify the evolution of freezing temperatures with water dilution and the concentrations of active compounds in each fluid [
20]. The presented methodology could be mounted with a surface texture sensor to accurately determine the nature of the contaminant and its effect on the runway surface. Despite the existence of such tools being constantly developed and improved, the only recognized method to-date of evaluating surface conditions remains the human eye, as specified in the Global Reporting Format document [
21].
Since November 2021, the International Civil Aviation Organization (ICAO, Montreal, QC, Canada) has implemented the New Global Reporting Format (GRF) for runway surface conditions at all airports. The main idea is to mitigate the risk of runway excursions by enabling a harmonized assessment and reporting of runway surface conditions, and by an improved flight crew assessment of takeoff and landing performance.
Among the work carried out to implement this global standard, Transport Canada published the Advisory Circular (AC, Ottawa, ON, Canada) No. 300-019 [
22]. The GRF principle implies that at any time when water, snow, slush, ice, or frost are present on an operating runway, the airport operator evaluates the runway surface conditions. This evaluation yields a RunWaY Condition Code (RWYCC) and a description of the runway surface, which the flight crew may use to calculate airplane performance. The airport operator’s best evaluation of the runway surface quality is based on this format, which is based on the type, depth, and coverage of contaminants. However, other relevant factors should be considered as well, and the changes in circumstances should be notified as soon as possible.
The Runway Condition Assessment Matrix (RCAM) is the technique by which an airport or aerodrome operator generates a preliminary RWYCC for each runway-third if there is water, snow, slush, ice, or frost present on the runway surface. Descriptions of the winter conditions are included directly in this matrix and allow their reproduction in controlled laboratory conditions. Airport maintenance teams, as well as runway de-icer product manufacturers need procedures to evaluate the impact of RDPs when used in those conditions. The idea is to gather relevant information on the skid conditions of the surface to know whether the product is being used in an anti-icing mode (before the precipitation) or in the de-icing mode (after the precipitation).
The most relevant method used to evaluate the skid resistance of pavements and runways is based on their microtexture, and hence their frictional properties can be assessed using the BPT [
23,
24,
25,
26,
27,
28]. Thanks to its light weight, the BPT is portable and does not necessitate surface preparation or external energy [
23]. The BPT is well-documented and plenty of research proves that this method gives sufficient information to accurately evaluate the state of the surface. Little research has been undertaken to establish a relationship between the British Pendulum Number (BPN) arising from the BPT and the surface coefficient of friction (µ) [
23,
29]. Additionally, the BPT has been used to evaluate road and runway microstructure by several authors. Their main results are presented in the
Table 1.
Eriskin et al. [
24] used the BPT to evaluate the impact of superhydrophobic coatings on different pavements. Their main findings indicated that a superhydrophobic coating may delay ice formation and then enhance surface friction resulting in a higher BPN [
24]. Rainwater et al. [
26] and Sajib et al. [
28] used the BPT to evaluate the performance of chemical de-icers used on roads. Both studies have obtained results during natural field testing campaigns showing that chemical de-icers could lead to effective results by significantly increasing the surface BPN compared to the untreated surface condition. However, since the tests were conducted in natural conditions, it was hard to obtain repeatable results. Rodin et al. [
27] used the BPN to evaluate the skid resistance of previously used concrete slabs subjected to ice. They obtained results showing that in both de-icing mode and anti-icing mode, the de-icer, namely calcium chloride, helped increase the BPN significantly. However, the way the ice was formed on the concrete slab was not representative of how it occurs under natural conditions, since the ice is formed by soaking the concrete substrate completely in water at cold temperatures leading to ice formations in the cavities and not on the top of the substrate. Finally, in the anti-icing mode, the chemical de-icer is applied before exposure to ice which contradicts the literature facts, suggesting that de-icers should be applied after exposure to ice. Based on a recent literature survey on the BPT, there is no work that includes the use of different winter contaminants in conjunction with common runway de-icing products [
25,
26,
27,
28].
With the introduction of the new GRF and the fact that there is a gap in the evaluation of RDPs, the main goal of this study was to reproduce the cited winter conditions in the laboratory and on concrete cement substrates, to present a correlation between the GRF and the BPT, and to then propose a complete testing procedure of liquid RDPs in those conditions. The obtained results will be useful in determining preferable conditions for the use of RDPs.
2. Materials and Methods
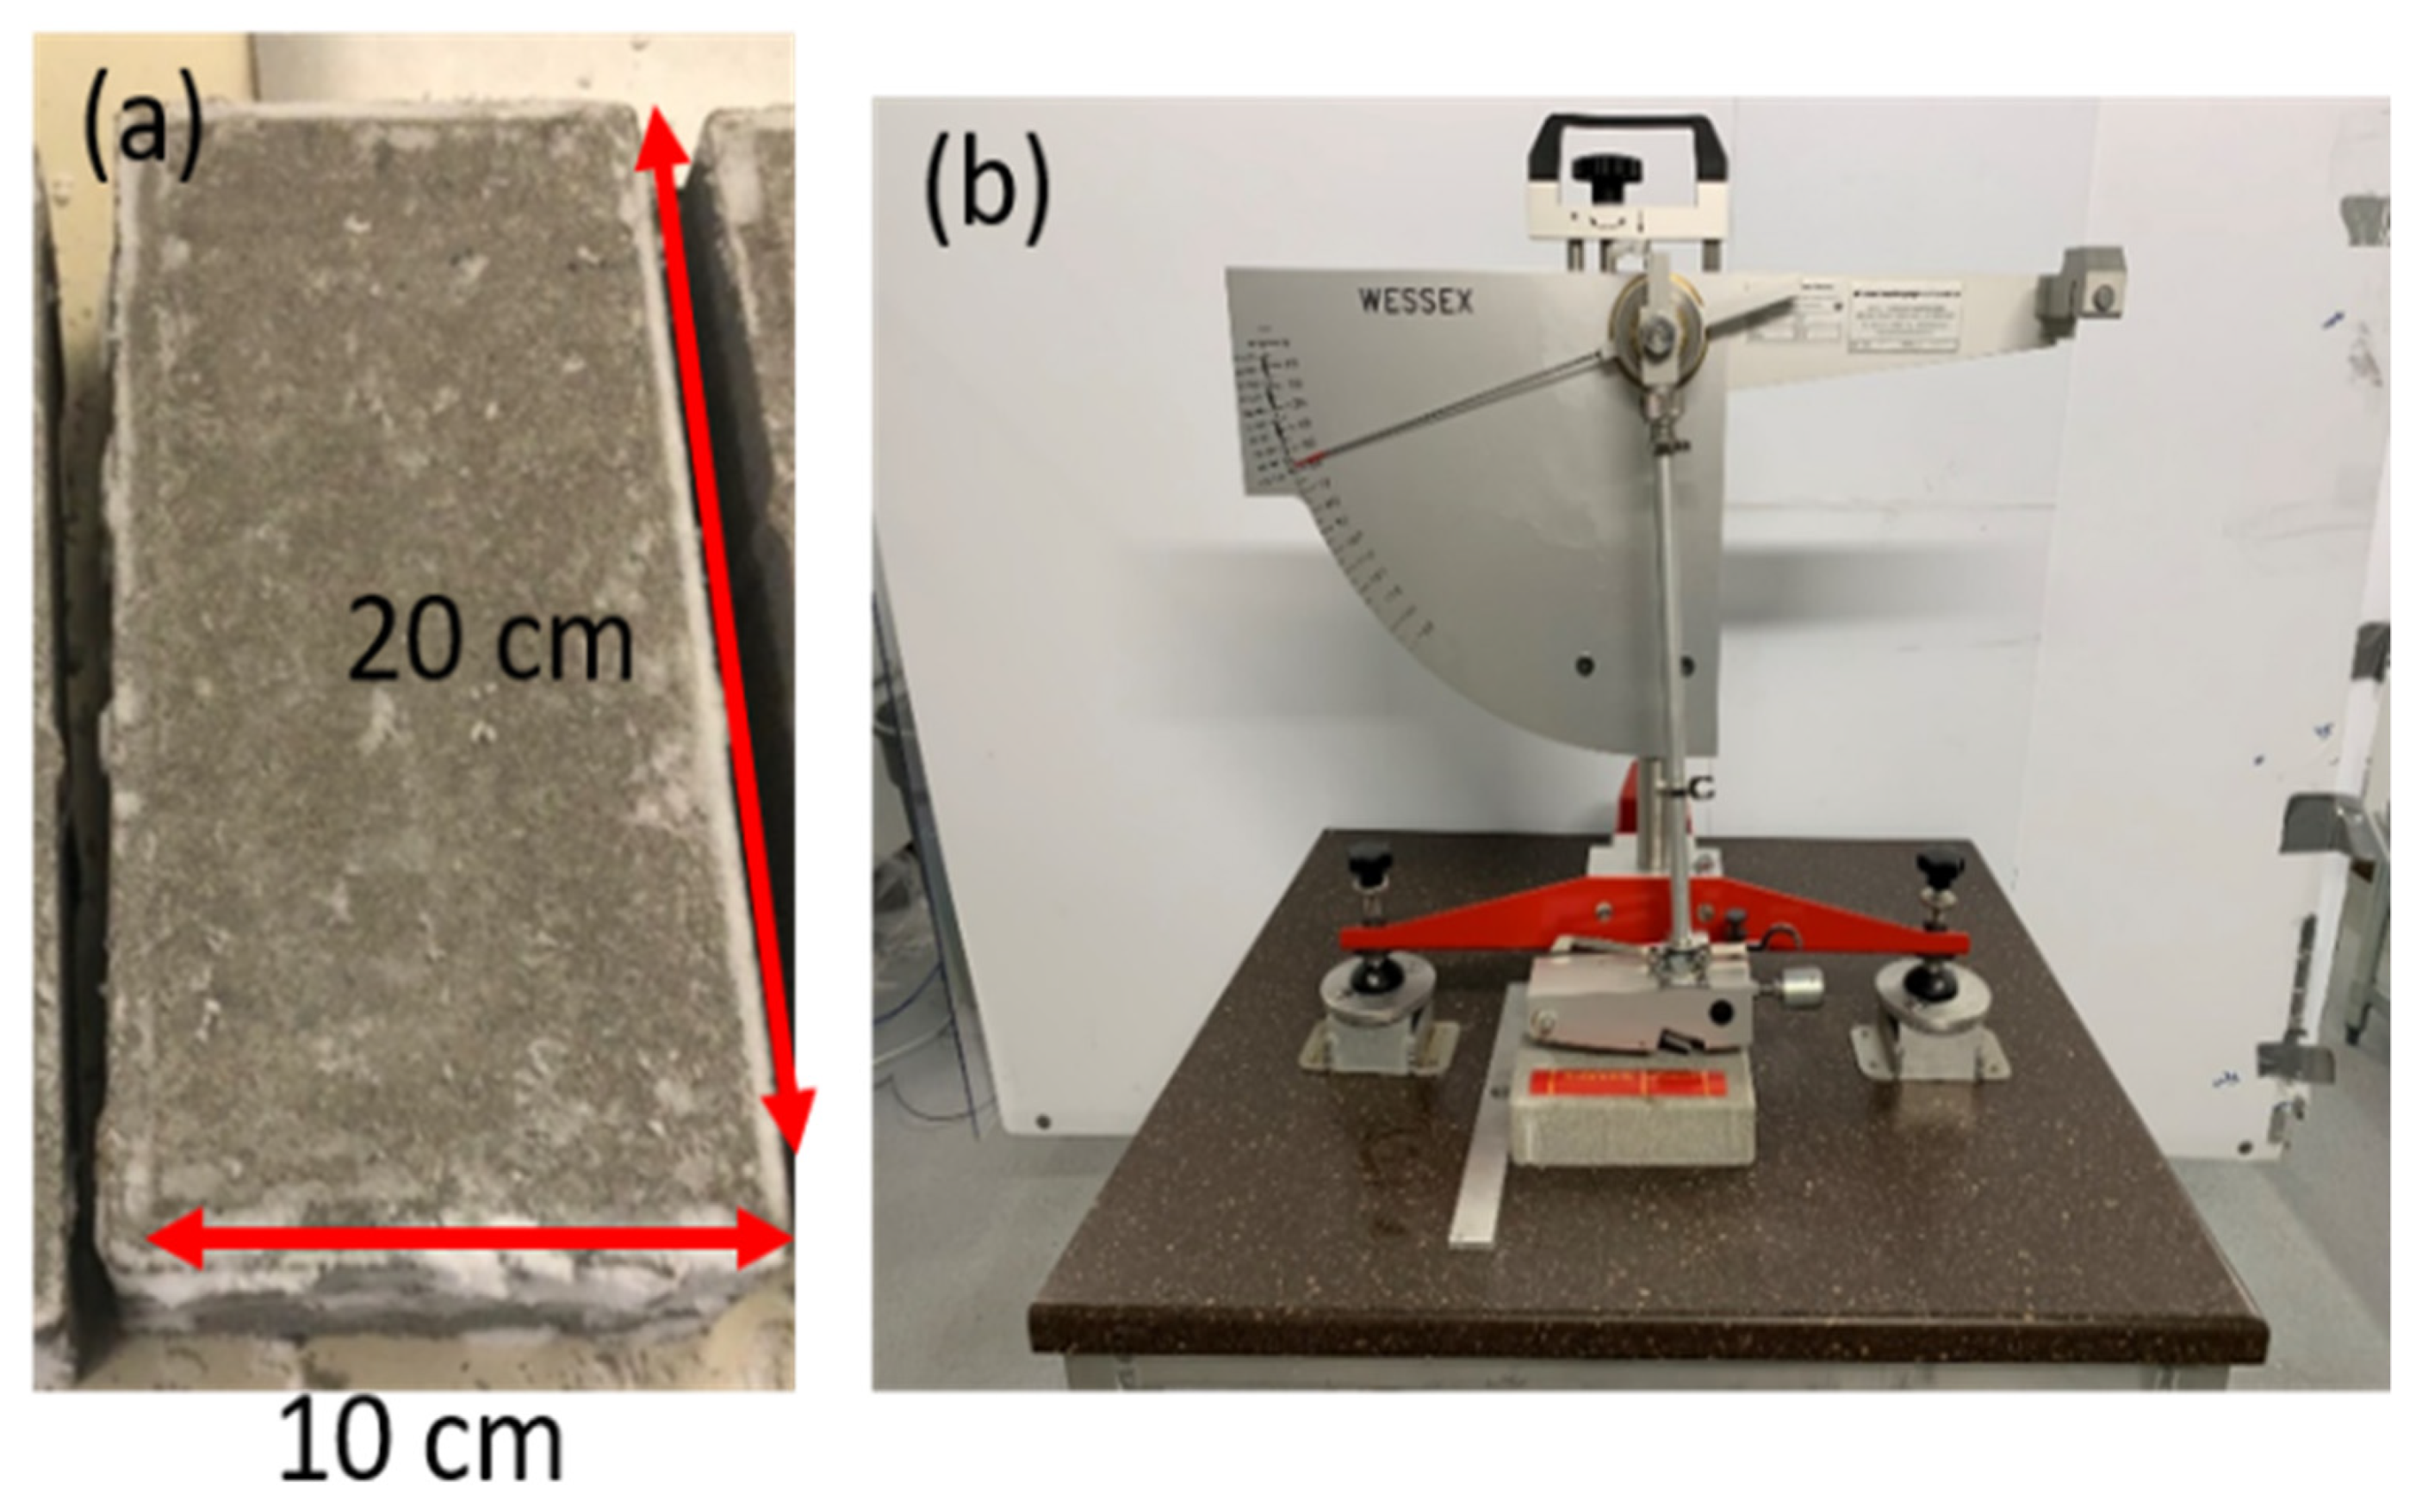
Experiments were carried out to evaluate the impact of winter contaminants on the skid resistance of a runway, as well as the impact of common liquid RDPs used in anti-icing and de-icing modes. All the measurements were conducted under controlled cold conditions in the UQAC’s snow chamber. Concrete cement paving stones of dimensions 10 cm × 20 cm × 5 cm were used as test substrates, as shown in
Figure 1a (Permacon Heritage Universal Paver, Anjou, Canada). These paving stones were selected as substrates since their surface roughness and absorption characteristics correlated well with the actual concrete surfaces found at most Canadian airports. Although the surface roughness is less than that of some airport surfaces, it serves as a point of comparison for the conditions targeted in the study. Each stone was cleaned using tap water and dried at room temperature.
Figure 1b shows the BPT setup with the concrete substrate mounted for test. The pavements and testing apparatus were conditioned at the test temperature in the cold room (−15° to −5 °C) for 24 h prior to testing. The skid measurements were undertaken using the BPT according to ASTME303 [
13], and the BPN was obtained.
The smaller the BPN, the more the surface will slide and is considered risky. Conversely, the bigger the BPN, the less the surface will slide. The BPT is primarily used to assess microtexture. This test is commonly supposed to have a slip speed of 10 km/h, and microtexture is thought to rule in low-speed applications [
30]. Prior to each testing day, the apparatus was levelled and the zero verified. The contact surface was also verified using a ruler to ensure that the slider was in contact with 125.0 ± 1.6 mm [
13].
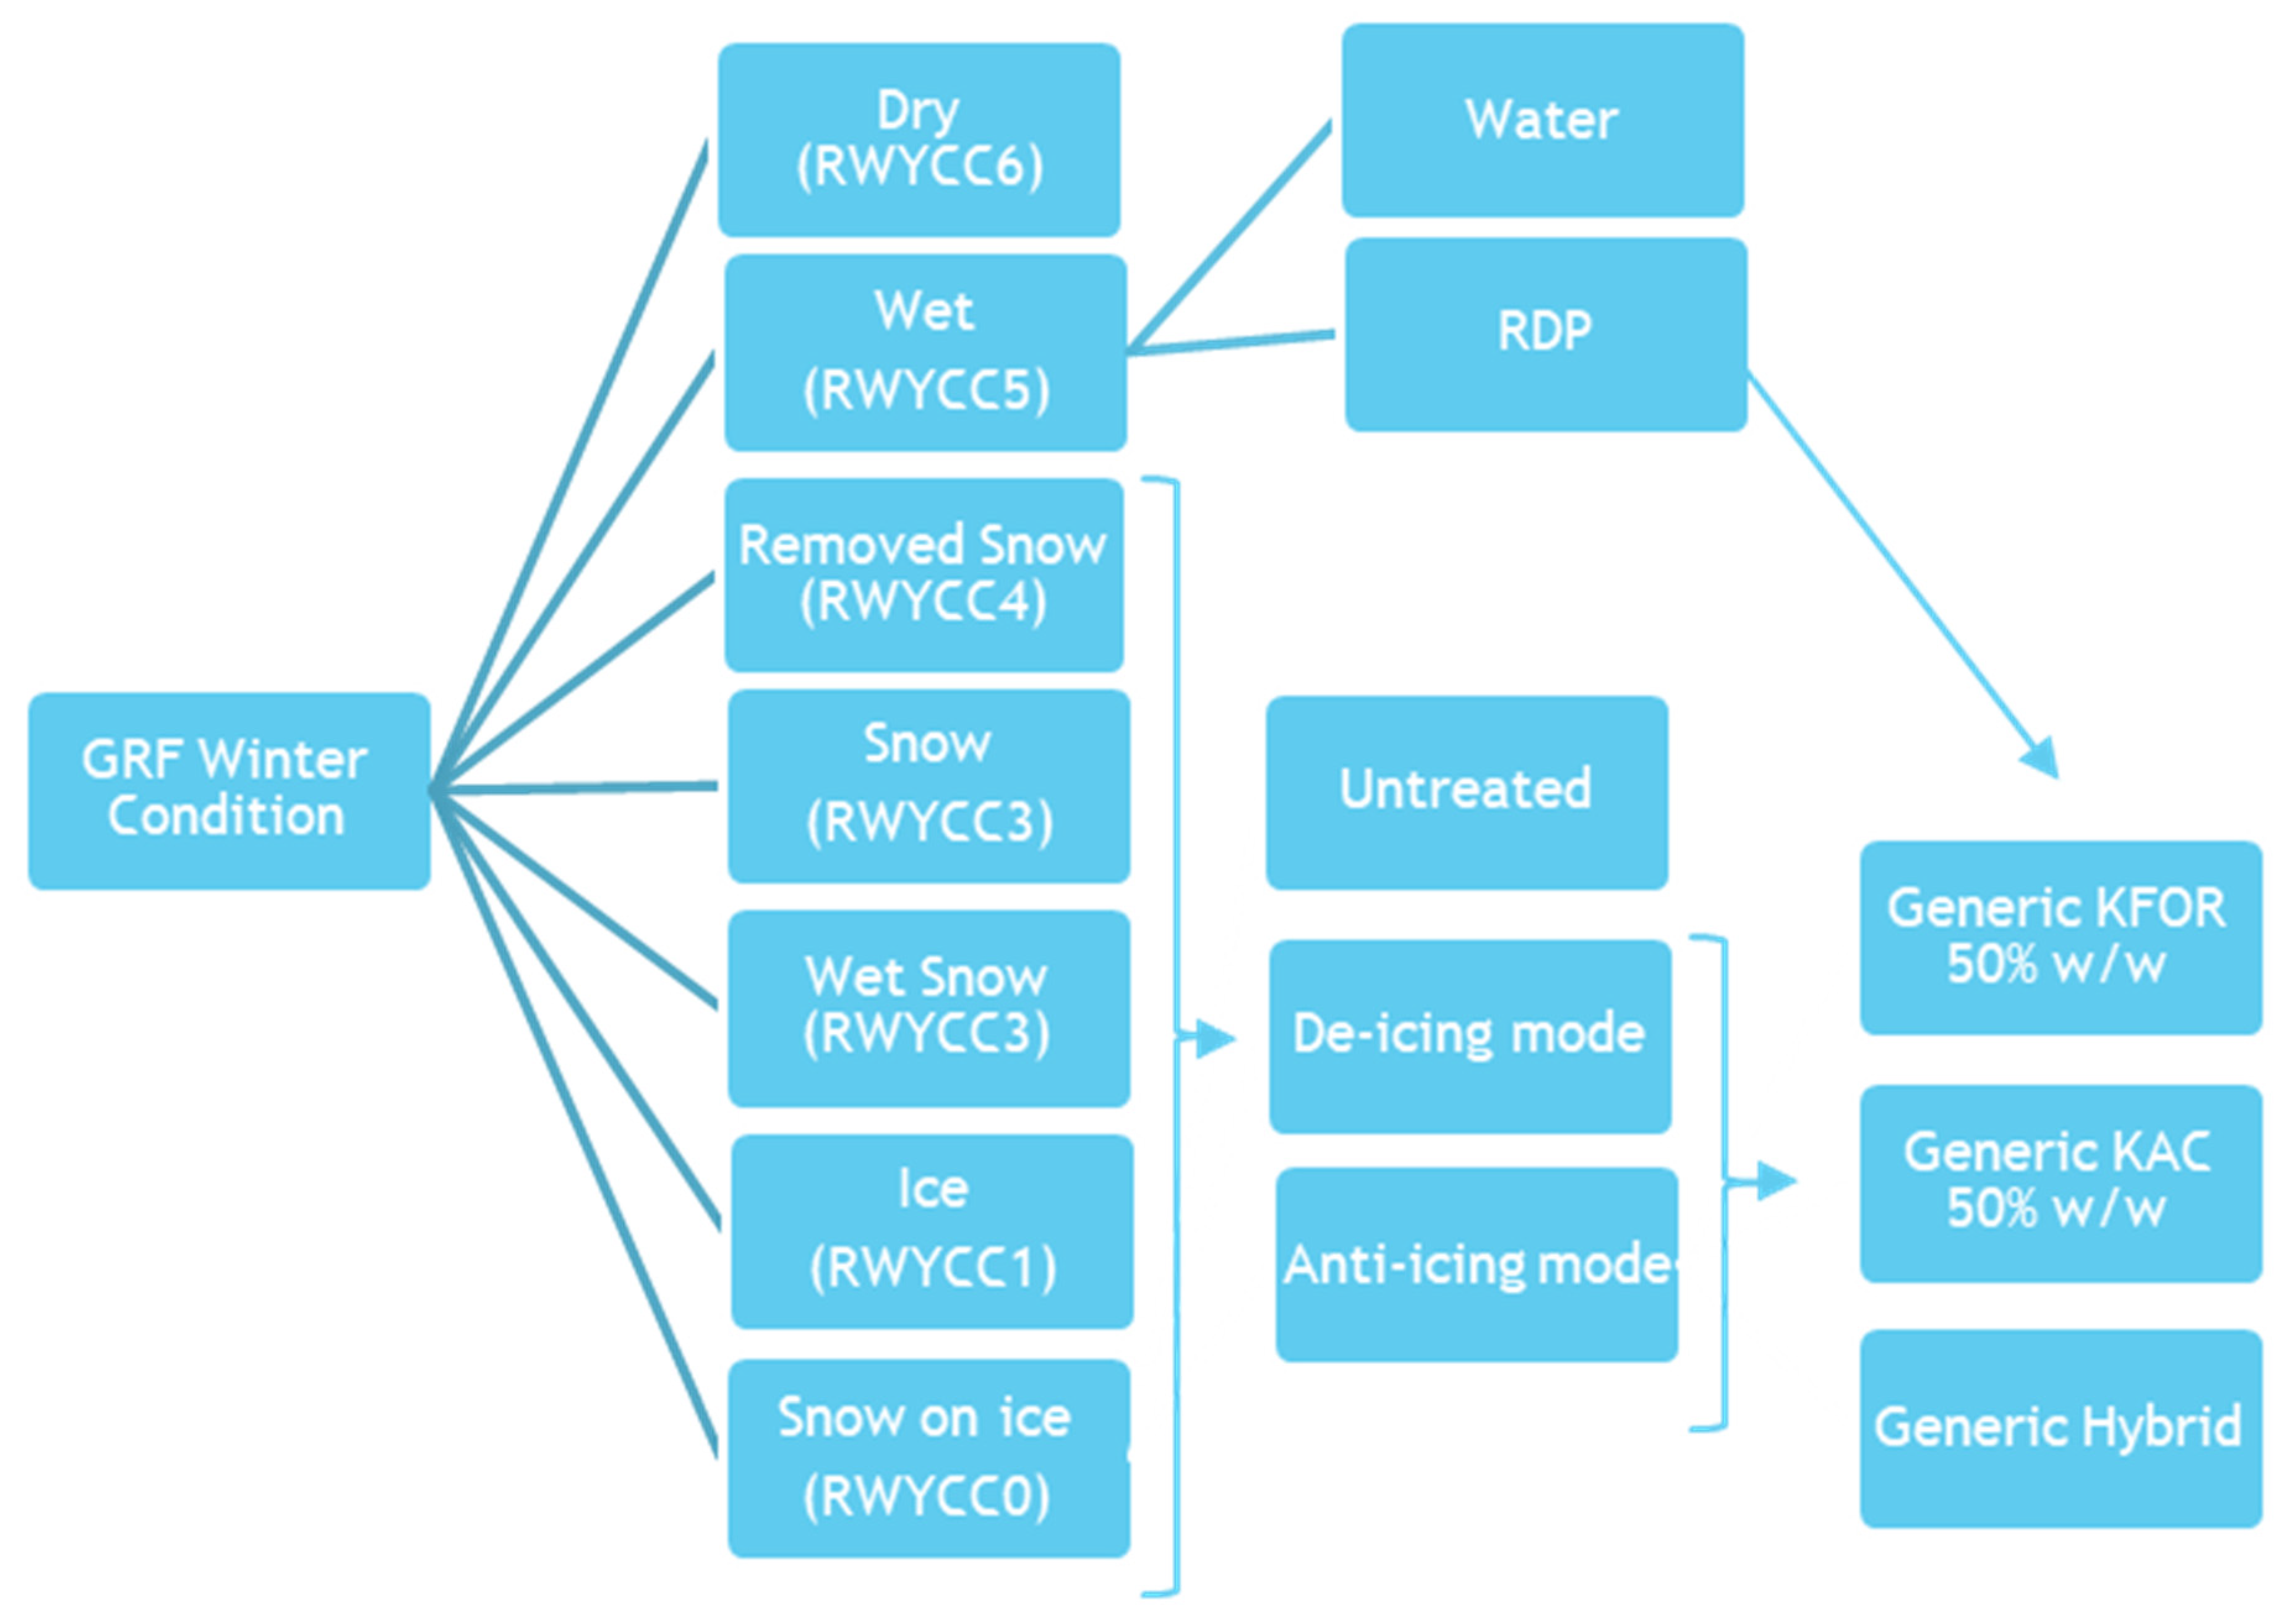
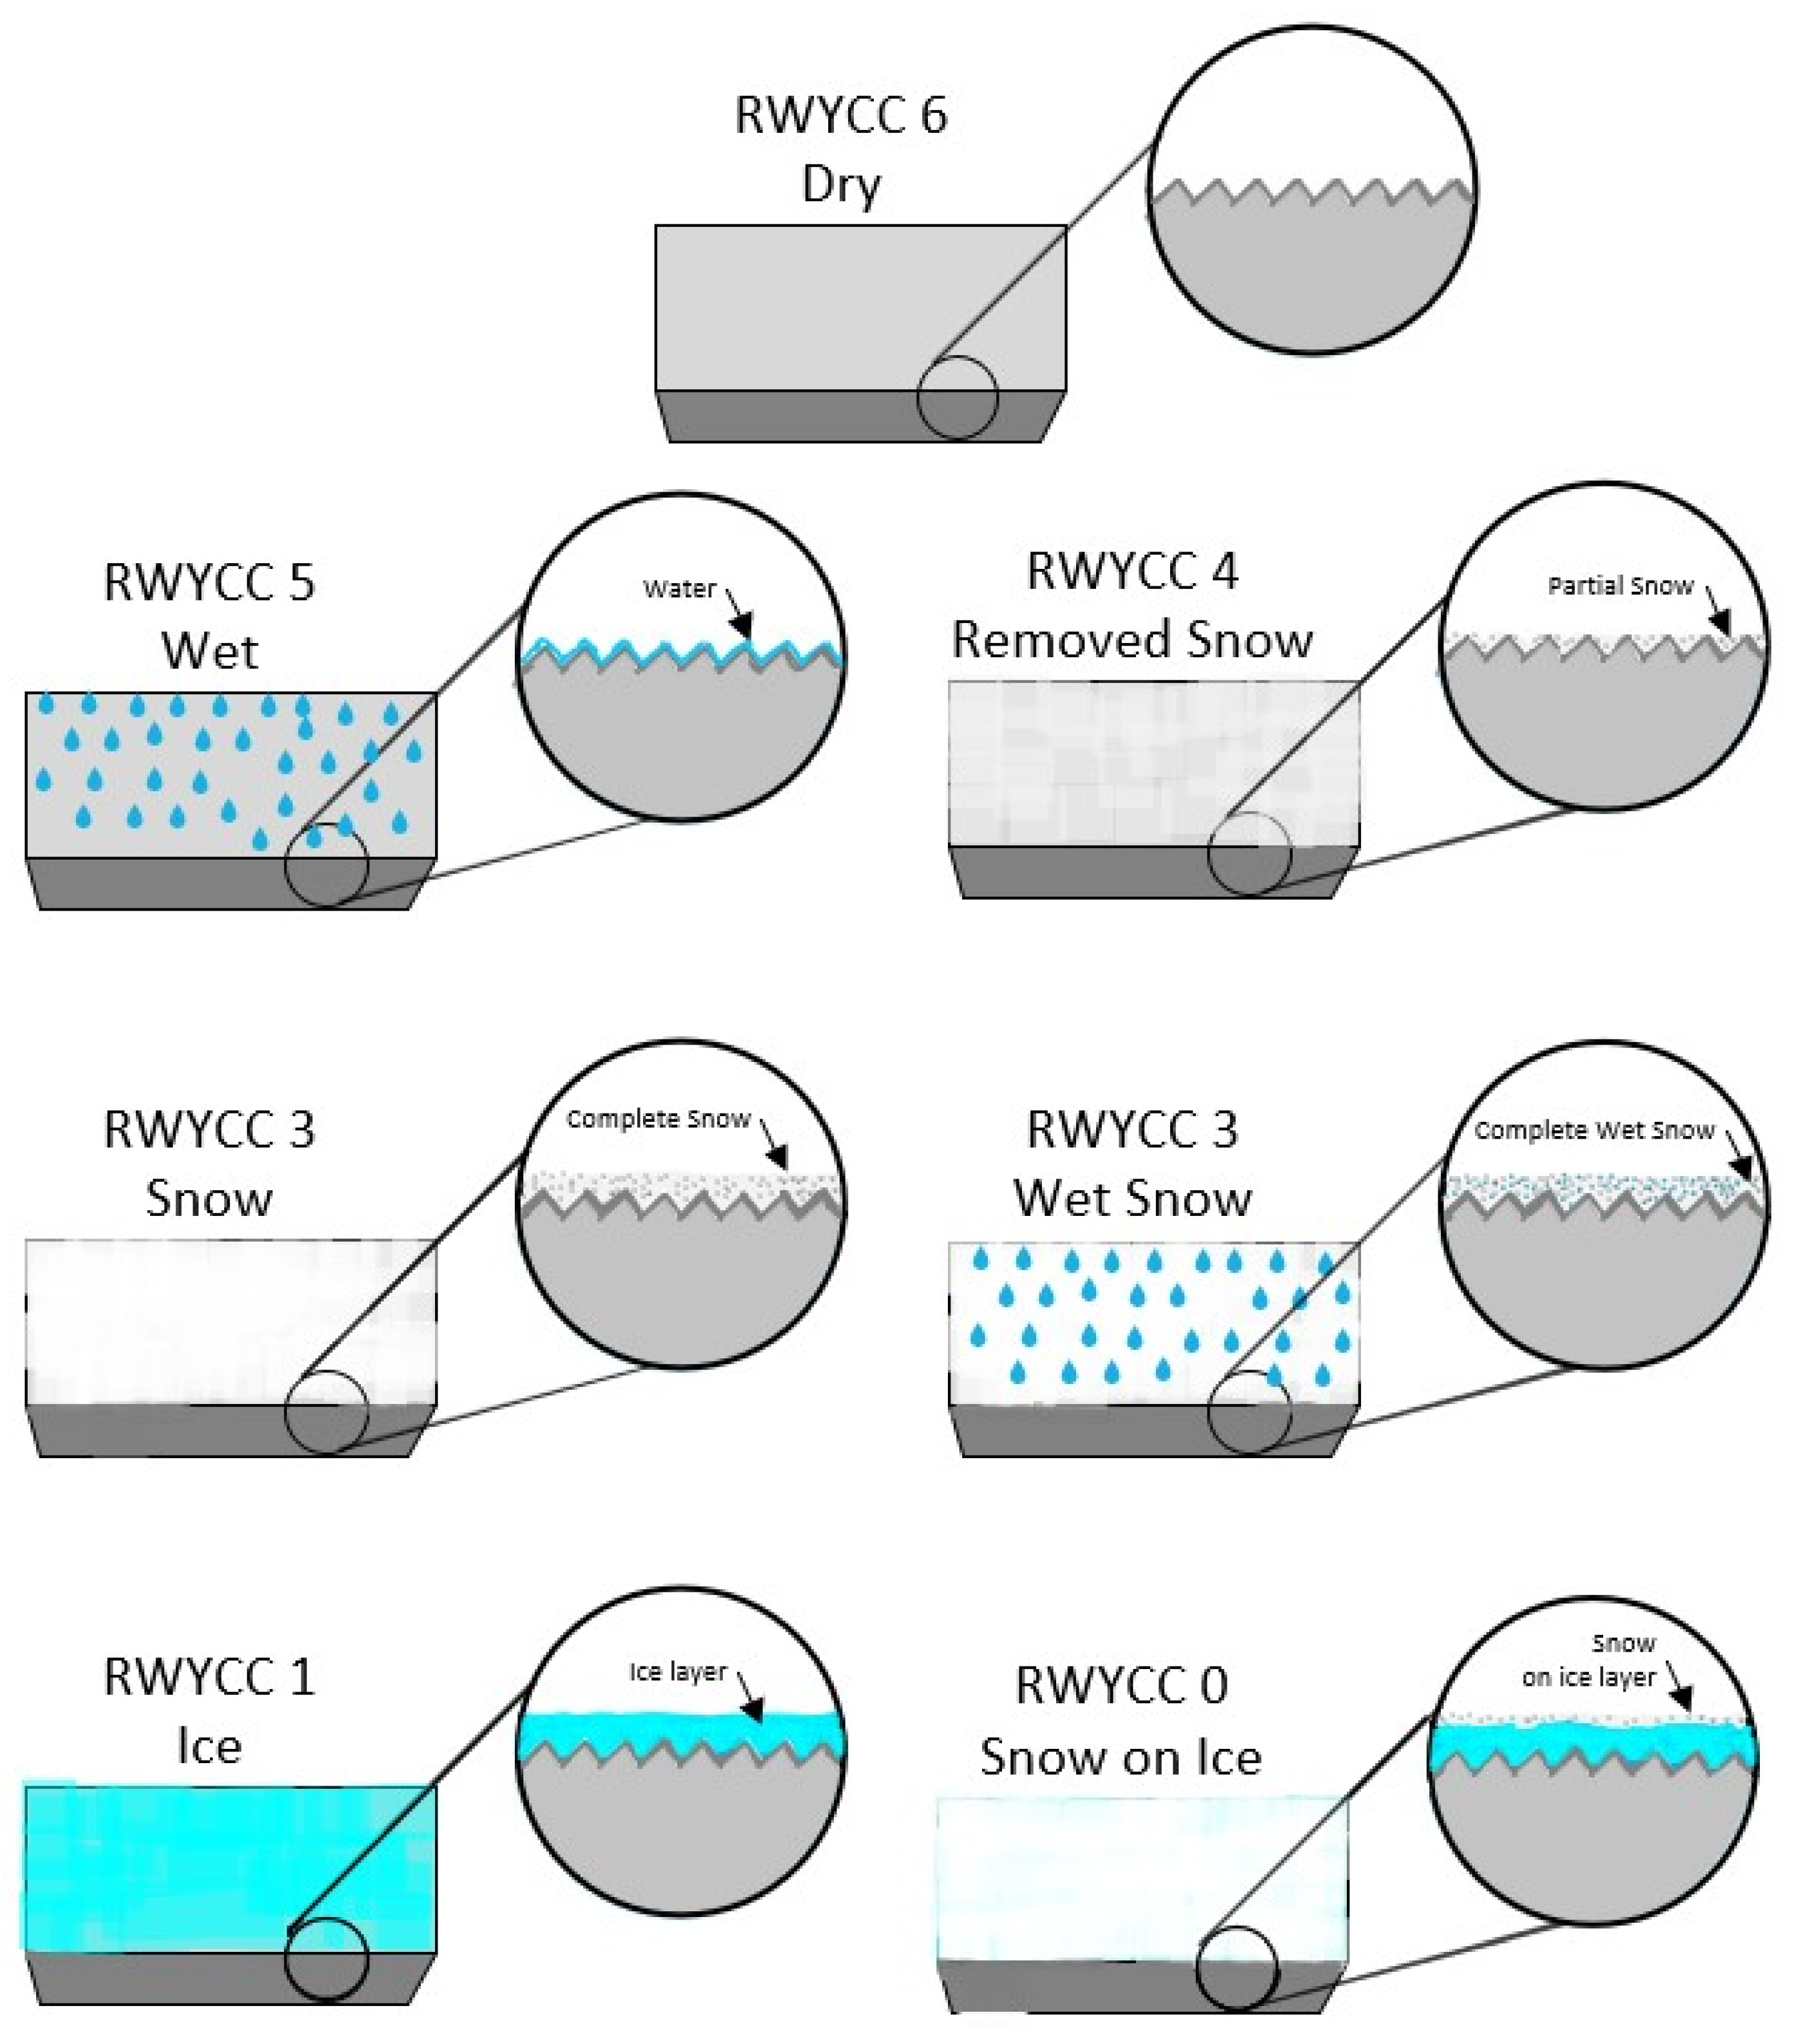
Seven conditions were excerpted from the RCAM and reproduced in the laboratory [
22]. A plan summarizing the tests is presented in
Figure 2, with their schematics shown in
Figure 3.
The first test consisting of the dry “as-is” condition is considered as the reference value, which is equivalent to a RWYCC of 6 (no treatment prior to testing).
The second condition represented the wet condition, where the concrete was fully wetted with water at room temperature, with a RWYCC of 5. The first two conditions were conducted at 20 °C. Following the RCAM, the next conditions were reproduced using lab-harvested natural dry snow particles.
The third test refers to the “removed snow” condition conducted at −15 °C; snow was sifted and compacted on the stone with a low pressure and then removed using a scraper. In this condition, all the pores of the concrete were filled with snow and a thin layer of snow remained on the surface. This reproduced a compacted-snow condition, with an equivalent RWYCC of 4.
The fourth test condition consisted of dry snow which was obtained using a 1 mm sift to deposit approximately 4 mm of snow. The thickness of snow was measured at five different positions using a metallic ruler. The snow was not compacted during the deposition process, so it was easily removed during the passage of the pendulum slider. The equivalent RWYCC is 3.
The same methodology was used to obtain the fifth test condition, wet snow, except that the snow was exposed to a simulated freezing drizzle precipitation for a period of six minutes, drizzled at a targeted intensity of 8.5 g/dm2·h. This condition also corresponds to a RWYCC of 3. The latter two conditions were conducted at −10 °C.
The sixth condition consisted of ice obtained by simulating a freezing drizzle precipitation, with a nozzle of median volumetric diameter of 115 µm (Nozzle #650017) being drizzled at a targeted intensity of 8.5 g/dm2·h at −5 °C for six minutes. After the precipitation, a waiting time of 10 min was required to ensure that the contaminant was completely frozen. In this case, the equivalent RWYCC is 1.
Finally, the seventh test condition consisted of snow on ice, reproduced using the same icing conditions as used in the sixth condition with the addition of 3 mm of sifted snow. The equivalent RWYCC is 0.
Each condition was reproduced six times, and for each substrate the BPN was measured five times, resulting in 30 data results per condition.
Three generic liquid RDPs currently used by airport maintenance teams were tested during the process [
31]. All RDPs were prepared in the laboratory using deionized water and from solid commercial salts. The first RDP consisted of 50%
w/
w potassium formate (KFO, HCOOK). At this dilution, its freezing point is nearly −60 °C. The second RDP consisted of 50%
w/
w potassium acetate (KAC, CH
3COOK), also with the corresponding freezing point of nearly −60 °C. The third product consisted of a hybrid RDP. Its components consisted of 25%
w/
w of liquid propylene glycol (PG, C
3H
8O
2) and 25%
w/
w KAC. The initial freezing point of this RDP is approximately −48 °C. For each de-icing and anti-icing condition, 3 mL of RDP was used, depositing 1 mL using a syringe at three different positions around the centre of the pavement substrate. The testing protocols for de-icing and anti-icing are detailed in
Figure 4. The de-icing conditions consisted of depositing the RDP after the icing/snowing precipitations. The anti-icing conditions consisted of depositing the RDP before the icing/snowing precipitations. In each condition, a waiting time of 20 min ensured that the RDP melted the contaminants before measuring the BPN.
3. Results
Table 2 shows the summary of the BPN results obtained for different test conditions tested in anti-icing and de-icing modes.
Firstly, the main winter conditions prescribed by the GRF were reproduced in the laboratory and the obtained BPN values were correlated with the RWYCC ratings. Since the RWYCC has been established as a function of the state of the runway, by taking into consideration the runway friction index (RFI), it is inherent that the results should correlate. These results are presented in
Figure 5. The first condition is the dry condition, with a RWYCC of 6, while the evaluated BPN is as high as 50 ± 3, indicating that the surface skid is very low. Therefore, this can be considered the safest runway condition. This value is much lower than those available in the literature [
24,
25,
27]. This is explained well by the difference between the surface’s macro- and microtexture. The pavement tested is less coarse than those used in other research [
25,
27].
In the wet condition (RWYCC of 5), the BPN reduced significantly to 38 ± 1. This value corresponded to a reduction of 24% when compared to that obtained with dry conditions. Rodin et al. [
27] and Eriskin et al. [
24] observed the same decrease when the surface was wet, with 30% lower and 25% lower values, respectively. This condition remains secure on the runway. Further, the removed snow condition corresponded to the compacted snow condition as described in the GRF, with a RWYCC of 4 for both, and a measured BPN of 33 ± 3. The snow and wet snow conditions, corresponding to a RWYCC of 3, presented a BPN of 19 ± 2 with wet snow and 23 ± 2 for snow-only, indicating that the wet snow conditions lead to more slippery states. The wet snow condition was close to the slush condition which corresponded to a RWYCC of 2. Slush represents snow supersaturated with water that should be easily evacuated when compressed with the hand. In our case, the water could not be removed from the snow, unless a high pressure was applied, so the condition was considered as wet snow. The next condition corresponded to ice cover, with a RWYCC of 1, which resulted in a BPN of 17 ± 1, indicating that the surface is quite slippery. It corresponded to a reduction of 66% from the reference. Rodin et al. [
27] observed a reduction of approximately 70% in their ice conditions. The BPN is even more reduced when the snow is added to the ice layer, corresponding to a RWYCC of 0, and representing the worst condition to be encountered on the runway. It has been confirmed with a BPN of 11 ± 2, close to the lower limit of the pendulum. In this case, the dry snow acts as a lubricant on ice, rendering the surface even more slippery and hence more dangerous. In order to validate the results, a linear fitting has been added to the graph. Most of the data were slightly over the curves except for the snow and wet snow conditions which were under. The obtained equation is
The intercept was not forced to 0 since at the worst condition, a BPN of 11 was still obtainable. The Pearson correlation coefficient (r) of 0.96 indicates that the relation is strongly positive, validating the results. Finally, the coefficient of determination (R2) of 0.93 also indicated that more than 90% of the data fits with this linear assumption.
It is obvious that most of the laboratory-reproduced conditions resulted in BPN data which correlated well with the RWYCC. By applying Sabey et al.’s formula, it is possible to estimate the value of the coefficient of friction (µ). The empirical relationship is presented in Equation (2) as follows:
The calculated values are presented in the
Table 3.
The CRFI range presented in the GRF document [
22] is also presented in
Table 2. A criterion of <10% of difference at the targeted range has been applied to verify if the measured values are in the range. All values are within range except for snow and wet snow, which are much lower than the targeted range. If the values were considered with a RWYCC of 2, these results could be considered comparable to the range. This may signify that the simulated conditions are more dangerous than the specified values, indicating that the tests will be more conservative than the reality, adding an additional safety factor. However, the Sabey’s equation is based on measurements and may also induce an error greater than 20%. Therefore, the estimated values of µ should be only used as a comparison and not as a direct value of µ.
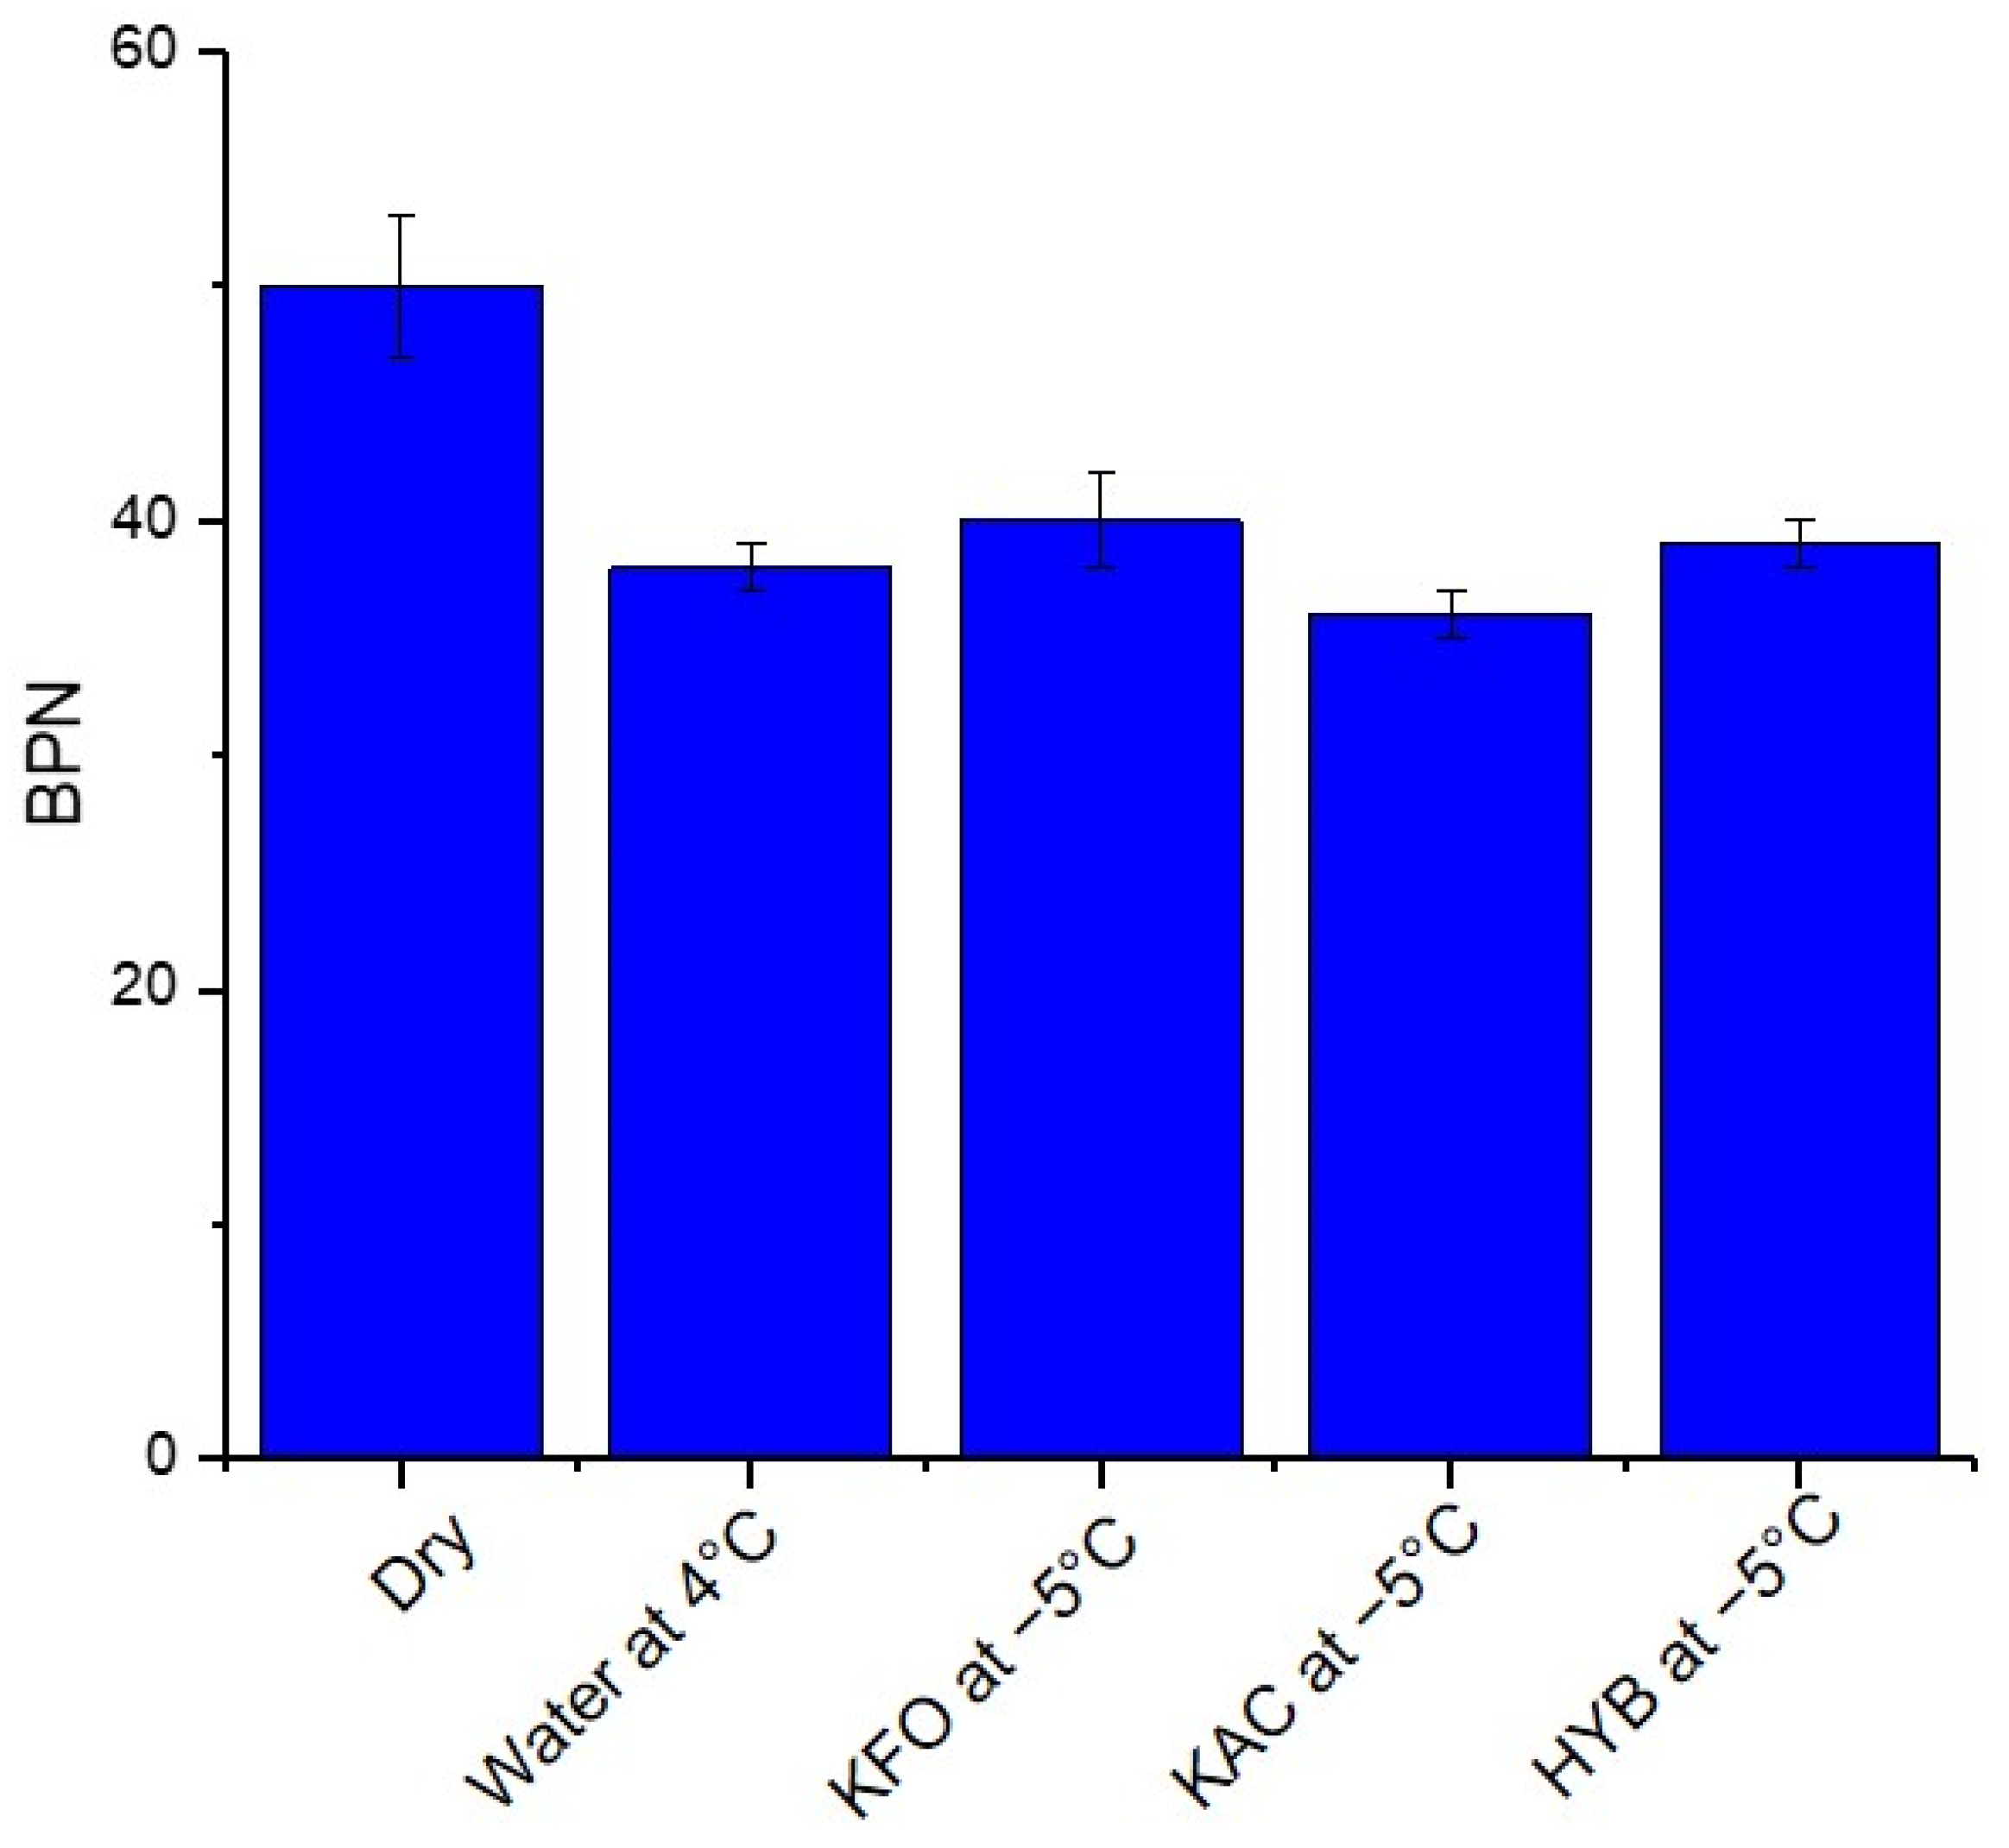
In order to deepen the analysis of this correlation, data were collected in different wet conditions which could be close to those encountered on the runway. Visually, the wet condition should also include the presence of liquid runway de-icing products in their initial concentration and also in their diluted concentration. So, in addition to the wet condition with water at 4 °C, data were collected when the concrete was wetted by KFO, KAC and HYB RDPs at −5 °C. It is not unusual for aircraft to encounter a runway completely wetted by RDPs. It is the case that when the RDP is applied in anti-icing mode, before precipitation, and also when RDPs melt the icy contaminants. The overall results are presented in the
Table 1, as well as in
Figure 6. As discussed above, the corresponding BPN to dry and wet with water conditions are 50 ± 3 and 38 ± 1, respectively. This slight decrease in BPN indicates that water acts as a lubricant. However, the BPN is not further decreased when RDPs are present on the concrete. KFO, KAC and HYB have a BPN of 40 ± 2, 36 ± 1 and 39 ± 1 respectively, all in the range of the wet-with-water conditions, indicating that they can be all treated as wet conditions.
Those dry and wet conditions will then be considered as the good conditions, as stated by the RWYCC. Further analysis using the upper and lower BPN values obtained with those conditions will help to classify the values and to help understand if they are efficient in the GRF winter conditions.
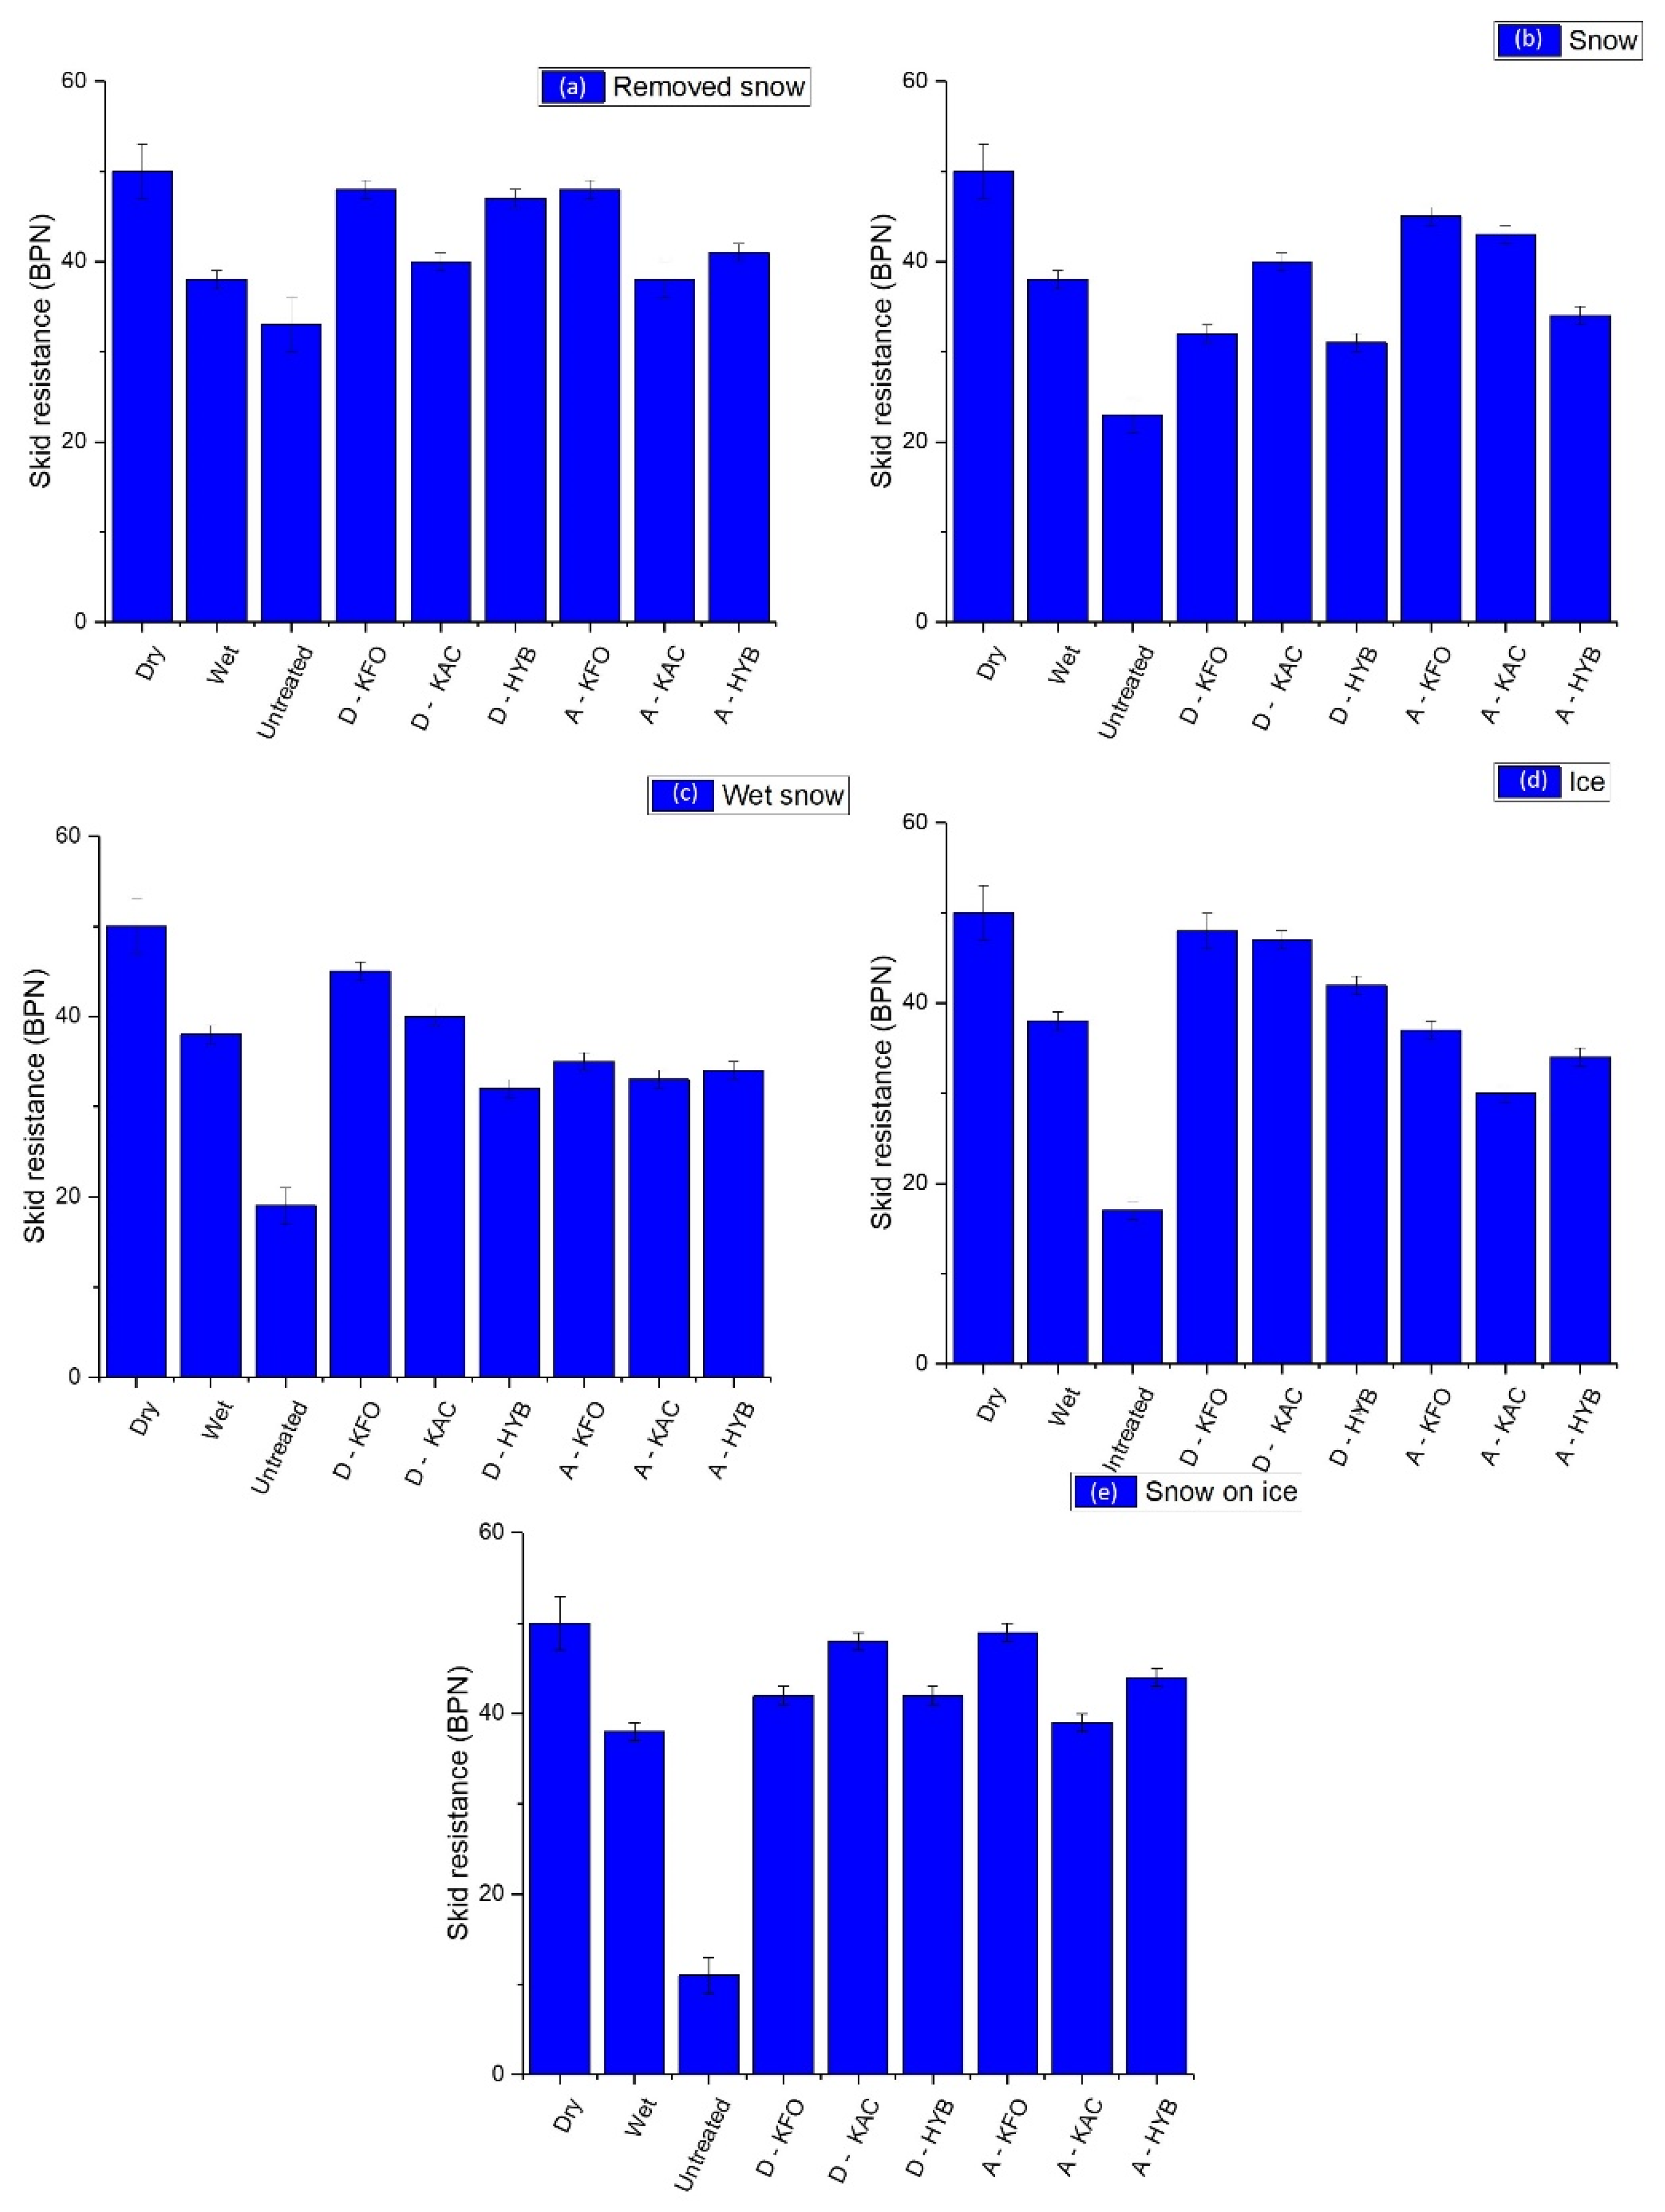
Knowing that the simulated winter conditions correlate well with the GRF RWYCC, they were then reproduced in the same settings described in the previous sections, but using three generic RDPs: KFO, KAC and HYB, in de-icing mode (D) and anti-icing mode (A). The main results are presented in
Table 1, as well as in
Figure 7. In the removed snow conditions presented in
Figure 7a, all the RDPs significantly improved the BPN in both de-icing and anti-icing mode. KFO showed the best improvement, with a BPN of 48 ± 1 in both modes. Hybrid RDP also showed an improvement with a BPN of 47 ± 1. However, in all the presented cases, all the RDPs improved the surface conditions to at least equal or better than the wet conditions, indicating that the conditions are acceptable. In snow conditions, as presented in
Figure 7b, the most efficient RDP is KAC. It allowed for an increase in the BPN from 23 ± 2 on untreated counterparts, to 40 ± 1 and 43 ± 1, in de-icing and anti-icing modes, respectively. In this condition, KFO was more efficient in anti-icing mode than in de-icing mode. It had an increased BPN of 45 ± 1 in anti-icing and only 32 ± 1 in de-icing modes. The worst results were obtained with the HYB, even with a slightly increased BPN. There is a lack of information regarding snow conditions in the literature. However, we can observe that in anti-icing mode, the snow is melted more easily than in de-icing mode. In anti-icing mode, the concrete allowed the RDP to spread, allowing the protection of a larger part of the concrete. In de-icing mode, the RDP penetrated the snow by gravity, partially melting only a small part of the snow.
Under the wet snow conditions, as shown in
Figure 7c, the KFO and KAC are better in de-icing mode than in anti-icing mode. KFO increased the BPN to 45 ± 1 and KAC to 40 ± 1, while the untreated surface is at a BPN of 19 ± 2. The main difference compared to dry snow is due to the presence of a slight proportion of liquid water which could activate melting, while in the dry snow condition the product may pass through the snow without melting it. Conversely, in anti-icing mode, since the RDP is on the concrete, in the snow-only condition, a part of it is melted. However, in wet snow, the water that arises from the snow inhibits the RDP’s short-term efficiency. The HYB remains stable irrespective of the kind of snow or the mode used. Regarding the ice condition presented in
Figure 7d, all three RDPs are efficient in de-icing mode. KFO, KAC and HYB give BPNs of 48 ± 2, 47 ± 1 and 42 ± 1, respectively, all in the range of the wet conditions. By comparing their results to the untreated counterparts, the BPNs are increased to more than 200%. When used in de-icing mode, all three RDPs sufficiently melted the ice at the interface, rendering it rougher and therefore less slippery. However, in anti-icing mode, even if the time of failure is not reached, i.e., the time taken for ice to start forming on the concrete, all three RDPs only increased the BPN to values ranging from 30 to 37. The best RDP in anti-icing mode was KFO, with a BPN of 37 ± 1. The phenomena were not exactly the same in the snow on ice condition presented in
Figure 7e. The BPN increased from 11 ± 2 to 42 ± 1, 48 ± 1 and 42 ± 1, in de-icing mode, and to 49 ± 1, 39 ± 1 and 44 ± 1 in anti-icing mode for KFO, KAC and HYB, respectively. In this particular condition, the addition of snow in de-icing mode promotes better melting of the ice, with this impact even more pronounced in anti-icing mode. HYB showed a better efficiency in icy conditions than in snowy conditions, while the glycol complex is more efficient on snow than on ice. Literature is scarce in this area of study, however, a few researchers have observed similar trends of improvements in the BPN, but with using other RDP molecules such as chlorine-based products [
26] and corn-derived polyols (sorbitol, mannitol, and maltitol) added to traditional salt brine de-icer [
28].
Overall, it is obvious that the use of RDPs in both de-icing and anti-icing modes improves the BPN and consequently, the surface conditions. KFO was the best RDP, especially in anti-icing mode for snow and ice conditions, followed closely by KAC. Once applied to the concrete, KFO and KAC helped the melting of the contaminants and kept the surface wet only.
This study could be extended to solid RDPs to observe their efficiency in both de-icing and anti-icing modes. Further study is in-progress with other non-contact methods to determine the surface macrotexture to ensure the validity of the current apparatus. These results will be published as a follow-up article. The results presented focus on only one type of substrate, namely concrete cement. The results are comparative, however, and allow some conclusions to be drawn about RDPs. Further studies are planned with the use of asphalt concrete as well as other alternative materials.


