Featured Application
Assessing non-destructively the maximum temperature attained by granitic rocks during fires.
Abstract
Wildfires are one of the main threats of natural areas and often fires can affect protected or heritage areas and properties, in which the preservation requirements demand the use of non-destructive techniques (NDTs). The magnetic susceptibility is an NDT that provides information on the mineralogical composition of the materials but has never been applied to the evaluation of fires. Here, we combine laboratory with field analysis to test the applicability of the magnetic susceptibility for the assessment of the impacts of wildfires. The laboratory results showed an increase in the magnetic susceptibility with the temperature, more evident in the samples heated to 600 °C and above. The in situ measures revealed a spatial variation in the magnetic susceptibility, which was related to the behaviour of the fire in the area. The samples were later analysed with other magnetic destructive techniques that were used to confirm the mineralogical processes that occurred in the materials. The increase in the susceptibility values were due to the formation of iron oxides. The destructive analysis also showed the presence of minerals such as hematite and magnetite in the samples. Overall, the study allowed a first approach to test the magnetic susceptibility as a simple and fast way to measure the impacts of wildfires.
1. Introduction
Spain and Portugal are the regions with many fires and burnt surfaces in Europe. In 2019, 83.963 ha burned in Spain out of a total of over 400,000 ha in the European Union; 48% of the burnt land belonged to protected areas within the Natura 2000 network [1]. Wildfires are one of the mayor catastrophic factors of landscape alteration and degradation of natural and Cultural Heritage. They affect particularly archaeological heritage, as this is usually located on rural areas, more susceptible to be affected by these events.
Wildfires are an intrinsic component of the Mediterranean climate. In this region, summers are characterized by high temperatures, long draughts, and an intense decrease in relative humidity and dry winds [2]. These, together with the accumulation of biomass and possible fuels, condition an increase in the probability of wildfires. However, over the years it has been shown that human intervention is a key cause of wildfires in Spain, where 95% have a direct or indirect anthropic origin [2,3]. This is illustrated by the decrease of 30% of burnt areas in Spain in 2020 in relation with the 2010–2019 average [1], likely due to the mobility restrictions during the COVID-19 pandemic.
The intensity of the fires is highly variable, from small latent flames to enormous walls of fire that reach 50 m high [4]. Therefore, the effects on the heritage can be widely variable depending on the intensity and duration. The temperature of a fire, which depends on multiple factors, can reach up to 1000 °C during combustion. In this process, the fuels oxidize and emit to the atmosphere ashes, carbon dioxide, water, and other compounds as well as producing light and heat.
The high frequency of the fires implies that they often affect big areas with singular elements of Cultural Heritage and, particularly, Archaeological Heritage. Cultural Heritage includes all the items (material or immaterial) that represent a physical or spiritual part of the presence and practices of the societies along its development and, therefore, deserve to be conserved for future generations. A large amount of Cultural Heritage is built on stone, and it is susceptible to be altered and destroyed by fires [5,6,7,8]. This deterioration can be defined as the degradation through time of the properties of a material (physical, mechanical, chemical, etc.), as well as its characteristics (mineralogy, texture, etc.), that can derive in its structural failure [9].
Fire damage of heritage will become more frequent due to climate change and increasingly common conflicts in locations with archaeological sites [6,10,11]. The high temperatures generated during fires generate a series of changes in the mineralogy and petrophysical properties of the rocks that can derive instability problems. Consequently, it is important to assess the effects that these problems can generate in the structure of stone buildings and structures [12].
The importance of wildfires as a decay agent of Cultural Heritage is because of the catastrophic damage generated in a short period of time with long-lasting effects [13]. Previous research suggested that the impact on the rock depends on the velocity at which the maximum temperature is reached and the time that the rock is exposed to high temperatures [14]. When a rock is heated during a fire, there is a steep temperature gradient from the surface to the interior. This phenomenon can be highly destructive instantaneously, as the high temperatures generate rapidly a thermal stress that can cause a thermal shock due to the formation of microfractures [15].
Thus, the most visible effects of degradation can be found on the first centimetres of the material. One of the most noticeable effects of high temperatures is the structural damage found at different scales [8]. There are mineralogic changes and different fracture patterns at small scale that control the macroscopical physical and chemical degradation. The alteration of the mineralogy and the porosity, which conditions the amount of water that goes into the rock after the fire, determines how the rock decays in the long term [12,16,17].
Nevertheless, the consequences are not always evident and require a detailed study to assess how it can affect the intrinsic characteristics of the rock. Usually, the methods to assess the mechanical effects of fires require destructive techniques that, due to the preservation requirements, cannot be applied in heritage areas. In those cases, the use of non-destructive techniques (NDTs) is necessary [9,18,19]. These techniques allow the characterization of materials and the assessment of their deterioration, and they can be applied in situ [9]. Therefore, the NDTs provide wide information in a short period of time without affecting Cultural Heritage [18]. There are multiple techniques used for the study of the physical properties of rocks, such as the Ultrasonic Propagation Velocity or the Leeb rebound hardness test. These techniques allow measuring the effects of high temperatures in the internal structure of the rock. However, their use may be limited if the rock attained very high temperatures and the fracturing degree is large. In these cases, an evaluation of mineralogical changes may be used to assess the extent of damage generated in the rocks because of a fire [20].
One technique widely used in the geological study of rocks is the measure of the magnetic susceptibility [21]. However, to date, this technique has never been applied to the evaluation of the effects of the fires on heritage. The magnetic susceptibility is defined as the capacity of a material or substance to be magnetized when exposed to an external magnetic field. A magnetic susceptibility meter is a tool extensively used in outcrops as it allows quick measurements and therefore allows for surveying large areas quickly. As magnetic susceptibility depends on the composition of the rocks, it permits detecting mineralogical changes that are not macroscopically visible without having to sample [21].
According to their magnetic properties, the materials are classified into three different groups with increasing values of susceptibility [22]: diamagnetic (such as quartz and calcite), paramagnetic (such as muscovite and biotite), and ferromagnetic. Specifically, the diamagnetic have a magnetization opposed to the external magnetic field (so their susceptibility value is negative), the paramagnetic susceptibility is positive since the acquired magnetization is in the same direction to the external field and for both, dia- and paramagnetic material, the generated magnetic field disappears when the external magnetic field does. The ferromagnetic minerals present a magnetization even when the external magnetic field is absent, called remanent magnetization, and their magnetic susceptibility is the highest [22].
Other complementary techniques encompassed in the “magnetism of rocks” analyses provide information about the nature and possible coexistence of ferromagnetic minerals. Among them, the “hysteresis cycle” refers to the graphic representation of the magnetic variation by the applied magnetic field and it has a characteristic shape depending on the type of mineral. The thermomagnetic curves represent the variation in a magnetic property with temperature in a heating and cooling cycle. The magnetic property can be the saturation magnetization or the magnetic susceptibility. Although these techniques are destructive, they allow to obtain more information and characterize magnetic minerals more precisely and refine onsite susceptibility measurements.
The main aim of this work is to test the capability of portable magnetic susceptometers to assess, at least qualitatively, the maximum temperature reached during a fire in an archaeological context. To do so, onsite measurements in an archaeological site affected by a wildfire in recent years were combined with more accurate laboratory measurements to perform a calibration curve of maximum temperatures. Thus, onsite measurements in the studied area were compared with laboratory measurements of samples subject in an oven to high temperatures such as those attained during a fire to test a possible correlation between the maximum temperatures reached and the magnetic susceptibility that would allow the further use of this non-destructive technique to characterize the temperatures attained in an area during a fire.
2. Materials and Methods
We selected an archaeological area that was affected by a recent fire. The studied area is El Berrueco, in the border of the regions of Ávila and Salamanca (Spain). This place underwent a fire in 2017, which was active for two days. The area includes several archaeological sites, where six neolithic locations were affected during the fire. This study focused in the largest of all of them (Los Tejares). The methodology combined in situ measurements in outcrops of the area affected by the fire with laboratory tests of samples taken from the site in which the effect of high temperatures was simulated in an oven in controlled conditions.
The in-situ tests consisted of measurements at the archaeological site using the magnetic susceptometer KT-10 Terraplus. This instrument allows for measuring magnetic susceptibility rapidly and with high sensitivity. Seven locations were measured with 10 to 20 measures in each one. In addition, a block of the outcropping rock was taken for the laboratory tests from a close-by area not affected by the fire. The block was cut in 4 cm cubes. Then, 18 cubes were selected, three of them were left as blank samples and 15 were chosen for heating tests in a SNOL 30/1300 oven.
Samples were dried at 40 °C until constant weight was ensured and then introduced in the oven for heating, choosing three samples for each target temperature. Five different target temperatures were chosen (200 °C, 400 °C, 600 °C, 800 °C, and 1000 °C) to recreate the high temperatures produced by fires. This process consisted in three phases: a heating phase to the target temperature, a three-hour isotherm stage and finally a free-cooling phase back to room temperature within the oven. The cubes were again weighed after heating and measured with the susceptometer, one measure per side (and therefore six measures per cube).
Later, the 4 cm cubes were cut into eight smaller cubes of 2 cm cubes to be analysed with a KLY-4 Kappabridge Pick-up Unit along with CS-3 Temperature Control Unit (AGICO Inc. Brno, Czech Republic), to obtain data about the magnetic properties such as the magnetic susceptibility and the variation in the magnetic susceptibility (k) with the temperature (T). These analyses are destructive and therefore, unsuitable for a heritage context, but were used to evaluate the field results obtained with the KT-10 susceptometer. Some cubes were grinded and used to measure the variation in the magnetic susceptibility with the temperature using the KLY4-CS3 and to measure different magnetic parameters in the Ultra-sensitive field translation balance (Petersen Instruments, Mag-Instruments, Munich, Germany) or “Curie balance”. This instrument allows to obtain the hysteresis cycles and the variation in the induced magnetization with the temperature, with a 36.7 mT external field. The hysteresis cycles are plotted using the programme RockMag Analyzer (Leonhardt) VFTBAnalyzer 2.0. The KLY-4 Kappabridge measures are performed using a 0.367 mT external field. These tests permit to determine the presence of ferromagnetic minerals due to the drop of the k value or the induced magnetization of the sample, which are diagnostic for each ferromagnetic mineral [22]. Furthermore, the presence of paramagnetic minerals can be deducted because, at low temperatures, the magnetic susceptibility graphs have a hyperbolic curve in the k-T analysis [21,23,24].
3. Results
3.1. Magnetic Susceptibility Laboratory Measurements
The magnetic susceptibility increases noticeably when the cubes are heated to 600 °C and above, while below this threshold the variation in the magnetic susceptibility is not as remarkable (Figure 1). The results were represented in a box and whisker chart where the last ones represent minimum and maximum values, while the box size represents the value of the 1st and 3rd quartile, the line marks the median and the X the average value. Further detail of the variation in lower temperatures can be found in Appendix A.
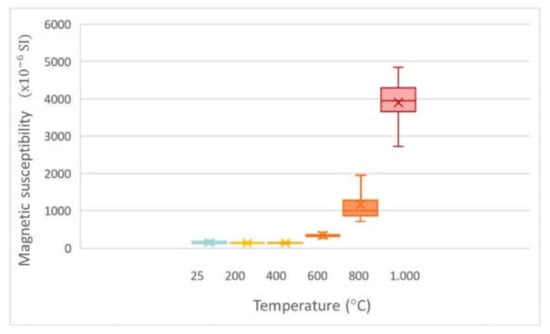
Figure 1.
Variation in the magnetic susceptibility at the different heating temperatures.
3.2. Rock Magnetism
The results (Appendix B) show a pronounced shift in the magnetic properties in the samples heated to 800 °C and above. The thermomagnetic curves obtained with KLY4-CS3 (magnetic susceptibility variation with temperature, k/T curves) are in general not reversible (differ between cooling and heating), which implies mineralogical changes during the process. Sudden drops of the magnetic susceptibility can be observed in the heating curves at ≈570 °C and ≈650 °C (Figure 2a) and more gradual decay with a final drop at 550 °C. These k falls are diagnostic of the presence of ferromagnetic minerals s.l.: the Curie temperature of magnetite is ≈570 °C and the Néel temperature of the hematite is ≈675 °C [22] so the previous 600 °C heated and cooled cube in the SNOL 30/1300 oven implies the presence of both minerals. For the samples previously heated and cooled at higher temperatures in the SNOL 30/1300 oven (800 °C and 1000 °C), the thermomagnetic curves are almost reversible (Figure 2b). In general, there is a gradual decrease in the magnetic property (magnetic susceptibility) from 200 °C until the final decay at ~550 °C.
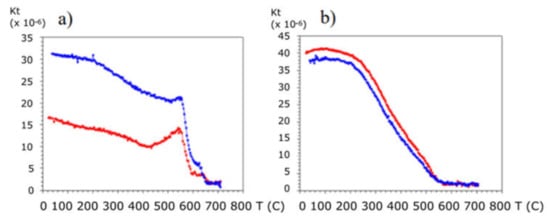
Figure 2.
Thermomagnetic curves (k/T) obtained with KLY4-CS3 for the sample previously heated and cooled up to 600 °C in the SNOL 30/1300 oven, where the drops at 570 and 650 °C are visible (a) and the sample previously heated and cooled up to 1000 °C in the SNOL 30/1300 oven, where the final drop occurs at ~580 °C (b).
The results obtained in the Curie balance relating the hysteresis cycles (Appendix B) shows that there is a linear relation with the external field in the materials previously heated up to 600 °C and cooled down in the SNOL 30/1300 oven (Figure 3a). On the contrary, in the blocks heated up to 1000 °C and cooled down in the SNOL 30/1300 oven, a well-developed hysteresis cycle dominates (Figure 3b), with a “wasp-waisted” form, which means that the cycle narrows when the external applied field is next to 0, due to the presence of different minerals (as they have different coercivity) or different grain size [24].
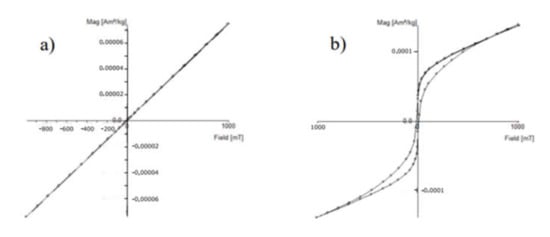
Figure 3.
Hysteresis cycles for samples previously no heated, 25 °C (a) and heated up to 1000 °C and cooled down in the SNOL 30/1300 oven (b).
3.3. Study Area
The rock outcropping in this area is a medium-grained biotitic granodiorite with rounded quartz, fine biotite in isolated crystals, and phenocrysts of potassium feldspar that occasionally have non-defined borders. This granodiorite has a marked orientation of the phenocrysts, which involves a certain anisotropy in the mineral properties.
The landscape consists of a single hill with a maximum altitude of 1355 m. It is formed by an abrupt and granitic elevation, almost inaccessible in the higher points. In the northern and western areas there is a change in the topography with flat meadows and abundant oaks, also influenced by the Tormes river towards the east. The vegetation is typical of the Castilian meadows with abundant species of genus Quercus, mainly Quercus Ilex and Quercus faginea.
The rocks present a variable degree of fracturing, with the southeast points showing higher fracturing and reddening of the rocks (Figure 4). The magnetic susceptibility measurements in the studied area show a spatial gradation with higher values (>200 × 10−6 SI) towards the SE and lower values towards the north (Figure 5). The highest magnetic susceptibility measures coincide with the peripheral area of the fire. The lowest values (<150 × 10−6 SI) of magnetic susceptibility are in the inner part of the wildfire, at the lowest altitude points.
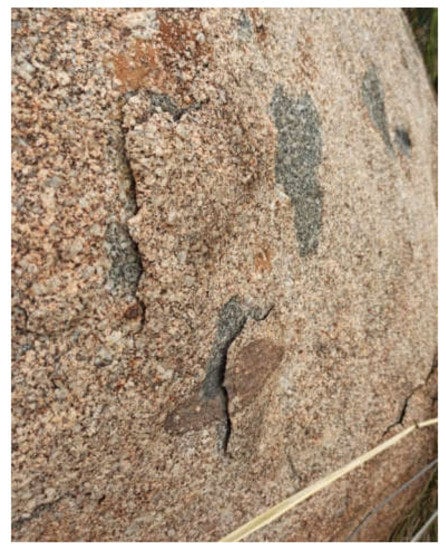
Figure 4.
Field image of the granodiorite showing scaling and reddening as a result of temperature increase.
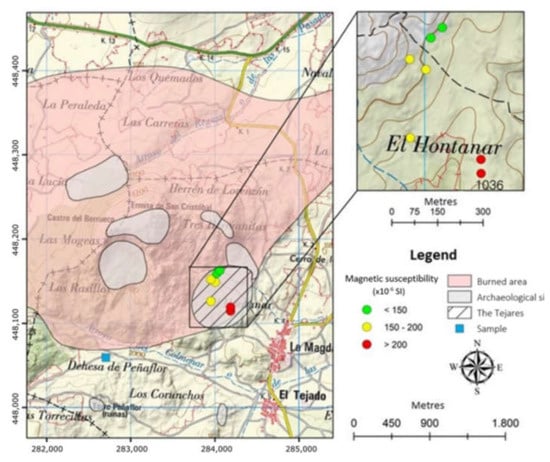
Figure 5.
Map of the studied area including the areas affected by the fire, the location of the archaeological sites and the magnetic susceptibility in the sampling points.
4. Discussion
The increase in the number of fractures with the temperature implies that the samples become more fragile at higher temperatures, which in turn produces a decline in density. The results show that the changes in the magnetic susceptibility values are low in the samples heated below the 400 °C in the oven, compared with the samples subjected to higher temperatures. The measures obtained using KT-10 show a change in the mineralogy of the rock, as the value of the magnetic susceptibility markedly rises, particularly in the samples previously heated to 600 °C or above in the oven. This threshold matches the temperatures where the evaluation with other techniques to measure mechanical properties, such as Ultrasound Propagation Speed or Leeb Rebound Hardness, may be less effective due to large fracturing.
The variations in the magnetic susceptibility are, on one side, due to the formation of new ferromagnetic minerals (iron oxides), which trigger a rise in the magnetic susceptibility. On the other side, there is a transformation of some minerals to others with less magnetic susceptibility (for example, magnetite oxidation to hematite), causing a decline in the magnetic susceptibility value [22,23]. In the studied case, there is an overall increase in the magnetic susceptibility due to the formation of ferromagnetic iron oxides.
The thermomagnetic curves allow deducing the presence of some ferromagnetic minerals (magnetite and hematite) in the samples before heating, along with paramagnetic minerals (due to the hyperbolic type of shape of the k) [23,24] in the samples previously heated up to 400 °C and cooled down in the oven (Figure 3a). This hyperbolic shape disappears as the samples were previously heated to higher temperatures. The shape of the curves changes considerably in the samples previously heated to 800 °C and 1000 °C in the oven. This shift suggests the formation of new ferromagnetic minerals which mask the properties of the present paramagnetic minerals. Similar results have been found in previous studies where the goal is to obtain information about the anisotropy of the magnetic susceptibility [23,24].
The results obtained in the hysteresis cycles allow to confirm the presence of these paramagnetic minerals in the samples previously heated to 400 °C or below in the SNOL 30/1300 oven, as the graphics shows a linear relationship between the external magnetic field and the magnetization induced in the sample. However, the hysteresis cycles in the samples previously heated at 1000 °C in the oven show typical properties of ferromagnetic minerals, such as the saturation magnetization, remanence, and coercivity from the hysteresis cycles of ferromagnetic minerals s.l. Moreover, these have the wasp-waist shape, related to the presence of different ferromagnetic minerals, or minerals with different grain size [24].
The magnetic susceptibility variation with temperature curves and the hysteresis cycles for the samples previously heated to 800 °C and 1000 °C in the SNOL 30/1300 oven are equivalent to the ones obtained by López-Sánchez et al. [25] for the material denominated High Coercivity Thermally Stable Low Temperature (HCSLT) defined by McIntosh et al. [26] (Figure 6). This rare mineral (commonly named “epsilon iron oxide”) was found in archaeological materials which were exposed to very high temperatures and are characterized by a high coercivity and low unblocking temperature (<200 °C). This is the temperature from which the magnetic susceptibility starts declining. In Figure 6b, the hysteresis cycles are corrected so the programme VFTBAnalyzer 2.0 excludes the paramagnetic minerals, showing only the influence of the ferromagnetic minerals. The similarity between the magnetic characteristics and the graphics in this study may suggest the presence of “epsilon iron oxide” in the samples previously heated at higher temperatures (800 °C y 1000 °C) in the oven.
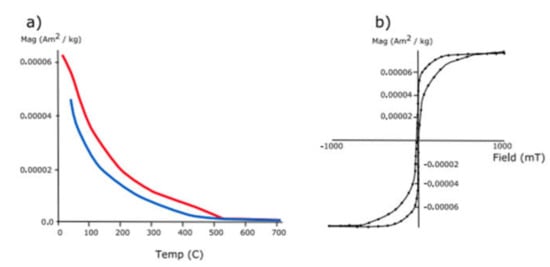
Figure 6.
Graphics obtained for induced magnetization (a) and the hysteresis cycles (b) in the samples previously heated to 1000 °C in the SNOL 30/1300 oven. These graphics are equivalent to the ones obtained by López–Sánchez et al., (2017) for the mineral HCSLT (see Figure 1 in that paper).
The study area in the archaeological site of Los Tejares in El Berrueco shows a gradient of the magnetic susceptibility, which confirms the relationship between the maximum temperatures reached and the magnetic susceptibility. One of the most remarkable effects related to the consequences of fire is the reddening of the rocks, which implies that the temperatures went above 300 °C due to thermal oxidation [8]. However, the higher susceptibility values (linked to the higher temperatures) can be found in the peripheral area of the fire. This might be because differences in the amount of fuel, air circulation, and the amount of time that the fire was active determine the maximum temperatures [27,28].
The behaviour of a fire is conditioned by topography, meteorology, and fuel. Among the topography, it is mainly influenced by factors such as slope and elevation, the meteorology marks the velocity and dryness of the vegetation, and the fuel affects the intensity of the fire depending on the circumstances (moisture, spatial distribution, composition, etc.). Specifically, this fire originated in Medinilla, Ávila, located 4 km to the west from El Berrueco and spread eastwards due to the topography and the wind.
The vegetation surrounding El Berrueco (Quercus and Cytisus mainly) has a high heat capacity, along with the presence of degraded vegetation due to the abandonment of the crops [29] causing an increase in vegetation that would work as fuel. Moreover, the fire happened at the end of August, when the high temperature and winds cause a drought in the vegetation due to the lack of humidity in the environment.
The area has very steep hillsides which boost the propagation velocity of the fire. Specifically, there are high slope variations between the sampling locations, where the higher points are in the northwest (where the magnetic susceptibility is lower), and the lower points are located southeast (where the magnetic susceptibility is higher) (Figure 5). Therefore, the abundant dry vegetation and the high temperatures caused a strong fire propagation and the loss of the vegetation, that practically disappeared in its whole [29]. Moreover, in the bordering area there is a firewall that avoided the propagation of the fire in this direction. This can mean that the vegetation burned more intense in the lower area, probably because the propagation velocity decreased when it reached less sloped areas and because of the firewall, allowing the fire to burn more time in the bordering zone. However, as seen in the photographs, the vegetation affected were mainly bushes, which implies that the temperatures reached were not too high.
5. Conclusions
This paper presents for the first time the use of the magnetic susceptibility to evaluate the impacts of wildfires on archaeological areas. Portable susceptometers allow for measuring quickly and non-destructively the magnetic susceptibility in a large number of sampling points. Thus, this technique is suitable for protected areas or heritage assets in which destructive tests cannot be performed.
Laboratory measurements of the rock outcropping in the studied area showed that this technique is capable of providing information about the maximum temperatures reached by rocks in past fires. Besides other applications, knowing the maximum temperature reached by rocks during a fire in an archaeological setting is essential to assess the possible existing damage suffered from these events as the result of mineralogical and physical changes. It also facilitates planning preventive conservation for long-term effects favoured by fire damage.
The results in this paper show that measurements obtained with portable susceptometers allow establishing zones with different magnetic susceptibility in regions that underwent fires and, therefore, have the capability of characterising qualitatively the areas that were more intensely affected by temperature increase without further tests.
Previous studies have used different techniques, such as Ultrasound Pulse Velocity or Leeb Hardness to assess the intensity of fire damage. However, these techniques are quite ineffective in plutonic rocks that underwent temperatures higher than the α to β-quartz transition (573 °C) due to the intense fracturing this transition causes in the material. Our results show that magnetic susceptibility changes are particularly noticeable above 600 °C. Therefore, magnetic susceptibility is especially useful above that threshold in which other existing techniques used to characterize the effects of fires on rocks are more difficult to use.
Further research in this area is needed to widen the database of relationship between magnetic susceptibility and the temperatures reached in different rock types. However, the results in the field study performed in this paper allowed us to prove the usefulness of the use this tool in areas affected by wildfires. More studies in different areas, with different fire temperatures and rock types will enable a better understanding of how magnetic susceptibility of rocks changes with fires, improving the usage of this technique to assess fire damage of Cultural Heritage.
Author Contributions
Conceptualization, B.O.-U. and M.G.-H.; methodology, B.O.-U.; software, A.S.-R.; validation, A.S.-R. and B.O; formal analysis, A.S.-R.; investigation, A.S.-R., B.O.-U. and M.G.-H.; resources, M.G.-H.; writing—original draft preparation, A.S.-R.; writing—review and editing, B.O.-U. and M.G.-H.; visualization, A.S.-R., B.O.-U. and M.G.-H.; supervision, B.O.-U. and M.G.-H.; project administration, M.G.-H.; funding acquisition, M.G.-H. All authors have read and agreed to the published version of the manuscript.
Funding
This research was funded by “Top Heritage (P2018/NMT-4372) programme from the Regional Government of Madrid (Spain)” and “Grants PIC2020-116896RB-C21”, “PIC2020-116896RB-C22” funded by MCIN/AEI/10.13039/501100011033.
Informed Consent Statement
Not applicable.
Data Availability Statement
Data available on request to authors.
Acknowledgments
The authors thank to the Dirección General de Patrimonio de la Consejería de Cultura de la Junta de Castilla y León for providing technical reports on the fire of El Berrueco and the permissions granted to work in the archaeological areas. The authors also thank Juan José Villalaín Santamaría, Head of the Paleomagnetism Laboratory of the Universidad de Burgos, for the allowing the use of the Laboratory free of cost and the fruitful discussions on the results obtained.
Conflicts of Interest
The authors declare no conflict of interest. The funders had no role in the design of the study; in the collection, analyses, or interpretation of data; in the writing of the manuscript, or in the decision to publish the results.
Appendix A. Variation in Magnetic Susceptibility at Lower Temperatures

Appendix B. Thermomagnetic Curves

Figure A1.
Thermomagnetic curve of samples at 25 °C (without heating). The red line represents the heating curve to the maximum temperature and the blue line the cooling curve. Vertical axis represents magnetic susceptibility in 10 × −6 SI.
Figure A1.
Thermomagnetic curve of samples at 25 °C (without heating). The red line represents the heating curve to the maximum temperature and the blue line the cooling curve. Vertical axis represents magnetic susceptibility in 10 × −6 SI.


Figure A2.
Thermomagnetic curve of samples heated to 200 °C. The red line represents the heating curve to the maximum temperature and the blue line the cooling curve. Vertical axis represents magnetic susceptibility in 10 × −6 SI.
Figure A2.
Thermomagnetic curve of samples heated to 200 °C. The red line represents the heating curve to the maximum temperature and the blue line the cooling curve. Vertical axis represents magnetic susceptibility in 10 × −6 SI.


Figure A3.
Thermomagnetic curve of samples heated to 400 °C. The red line represents the heating curve till the maximum temperature and the blue line the cooling curve. Vertical axis magnetic susceptibility in 10 × −6 SI.
Figure A3.
Thermomagnetic curve of samples heated to 400 °C. The red line represents the heating curve till the maximum temperature and the blue line the cooling curve. Vertical axis magnetic susceptibility in 10 × −6 SI.


Figure A4.
Thermomagnetic curve of samples heated to 600 °C. The red line represents the heating curve till the maximum temperature and the blue line the cooling curve. Vertical axis magnetic susceptibility in 10 × −6 SI.
Figure A4.
Thermomagnetic curve of samples heated to 600 °C. The red line represents the heating curve till the maximum temperature and the blue line the cooling curve. Vertical axis magnetic susceptibility in 10 × −6 SI.


Figure A5.
Thermomagnetic curve of samples heated to 800 °C. The red line represents the heating curve till the maximum temperature and the blue line the cooling curve. Vertical axis magnetic susceptibility in 10 × −6 SI.
Figure A5.
Thermomagnetic curve of samples heated to 800 °C. The red line represents the heating curve till the maximum temperature and the blue line the cooling curve. Vertical axis magnetic susceptibility in 10 × −6 SI.


Figure A6.
Thermomagnetic curve of samples heated to 1000 °C. The red line represents the heating curve till the maximum temperature and the blue line the cooling curve. Vertical axis magnetic susceptibility in 10 × −6 SI.
Figure A6.
Thermomagnetic curve of samples heated to 1000 °C. The red line represents the heating curve till the maximum temperature and the blue line the cooling curve. Vertical axis magnetic susceptibility in 10 × −6 SI.

Appendix C. Hysteresis Cycles

Figure A7.
Hysteresis cycle of samples at 25 °C.
Figure A7.
Hysteresis cycle of samples at 25 °C.


Figure A8.
Hysteresis cycle of samples heated to 200 °C.
Figure A8.
Hysteresis cycle of samples heated to 200 °C.


Figure A9.
Hysteresis cycle of samples heated to 800 °C.
Figure A9.
Hysteresis cycle of samples heated to 800 °C.


Figure A10.
Hysteresis cycle of samples heated to 1000 °C.
Figure A10.
Hysteresis cycle of samples heated to 1000 °C.

References
- San-Miguel-Ayanz, J.; Durrant, T.; Boca, R.; Maianti, P.; Libertà, G.; Artés-Vivancos, T.; Oorn, D.; Branco, A.; De Rigo, D.; Ferrari, D.; et al. Forest Fires in Europe, Middle East and North Africa 2020 EUR 30862 EN; Publications Office of the European Union: Luxembourg, 2020. [Google Scholar]
- Verdú, F.; Salas, J. Caracterización de Variables Biofísicas En Los Incendios Forestales Mayores de 25 Ha de La España Peninsular (1991–2005). Boletín Asoc. Geógrafos Españoles 2011, 57, 79–100. [Google Scholar]
- López Santalla, A.; López García, M. Los Incendios Forestales En España. Decenio 2006–2015; Ministerio de Agricultura, Pesca y Alimentación: Madrid, Spain, 2019. [Google Scholar]
- Ryan, K.C.; Jones, A.T.; Koerner, C.L.; Lee, K.M. Wildland Fire in Ecosystems: Effects of Fire on Cultural Resources and Archaeology. In Effects of Fire on Cultural Resources and Archaeology; Department of Agriculture Forest Service, Rocky Mountain Research Station: Washington, DC, USA, 2012; Volume 3. [Google Scholar]
- Koca, M.Y.; Ozden, G.; Yavuz, A.B.; Kincal, C.; Onargan, T.; Kucuk, K. Changes in the Engineering Properties of Marble in Fire-Exposed Columns. Int. J. Rock Mech. Min. Sci. 2006, 43, 520–530. [Google Scholar] [CrossRef]
- Sanjurjo-Sánchez, J.; Gomez-Heras, M.; Fort, R.; Alvarez de Buergo, M.; Izquierdo Benito, R.; Bru, M.A. Dating Fires and Estimating the Temperature Attained on Stone Surfaces. The Case of Ciudad de Vascos (Spain). Microchem. J. 2016, 127, 247–255. [Google Scholar] [CrossRef]
- Vazquez, P.; Acuña, M.; Benavente, D.; Gibeaux, S.; Navarro, I.; Gomez-Heras, M. Evolution of Surface Properties of Ornamental Granitoids Exposed to High Temperatures. Constr. Build. Mater. 2016, 104, 263–275. [Google Scholar] [CrossRef]
- Gomez-Heras, M.; McCabe, S.; Smith, B.J.; Fort, R. Impacts of Fire on Stone-Built Heritage. J. Archit. Conserv. 2009, 2, 47–58. [Google Scholar] [CrossRef]
- Moropoulou, A.; Labropoulos, K.C.; Delegou, E.T.; Karoglou, M.; Bakolas, A. Non-Destructive Techniques as a Tool for the Protection of Built Cultural Heritage. Constr. Build. Mater. 2013, 48, 1222–1239. [Google Scholar] [CrossRef]
- Mol, L.; Gomez-Heras, M. Bullet Impacts and Built Heritage Damage 1640–1939. Herit. Sci. 2018, 6. [Google Scholar] [CrossRef]
- Mol, L.; Gomez-Heras, M.; Brassey, C.; Green, O.; Blenkinsop, T. The Benefit of a Tough Skin: Bullet Holes, Weathering and the Preservation of Heritage. R. Soc. Open Sci. 2017, 4. [Google Scholar] [CrossRef]
- Ozguven, A.; Ozcelik, Y. Effects of High Temperature on Physico-Mechanical Properties of Turkish Natural Building Stones. Eng. Geol. 2014, 183, 127–136. [Google Scholar] [CrossRef]
- McCabe, S.; Smith, B.J.; Warke, P.A. Exploitation of Inherited Weakness in Fire-Damaged Building Sandstone: The “fatiguing” of “Shocked” Stone. Eng. Geol. 2010, 115, 217–225. [Google Scholar] [CrossRef]
- Goudie, A.S.; Allison, R.J.; Mclaren, S.J. The Relations between Modulus of Elasticity and Temperature in the Context of the Experimental Simulation of Rock Weathering by Fire. Earth Surf. Processes Landorms 1992, 7, 605–615. [Google Scholar] [CrossRef]
- Ozguven, A.; Ozcelik, Y. Investigation of Some Property Changes of Natural Building Stones Exposed to Fire and High Heat. Constr. Build. Mater. 2013, 38, 813–821. [Google Scholar] [CrossRef]
- Darot, M.; Reuschle, T.R. Acoustic Wave Velocity and Permeability Evolution during Pressure Cycles on a Thermally Cracked Granite. Int. J. Rock Mech. Min. Sci. 2000, 37, 1019–1026. [Google Scholar] [CrossRef]
- Yavuz, H.; Demirdag, S.; Caran, S. Thermal Effect on the Physical Properties of Carbonate Rocks. Int. J. Rock Mech. Min. Sci. 2010, 47, 94–103. [Google Scholar] [CrossRef]
- Moropoulou, A.; Koui, M.; Tsiourva, T.H.; Kourteli, C.H.; Papasotiriou, D. Macro and Micro-Non Destrutive Test for Environmental Impact Assesment on Architectural Surfaces. MRS Online Proc. Libr. (OPL) 1996, 462. [Google Scholar] [CrossRef]
- Vigroux, M.; Eslami, J.; Beaucour, A.L.; Bourgès, A.; Noumowé, A. High Temperature Behaviour of Various Natural Building Stones. Constr. Build. Mater. 2021, 272. [Google Scholar] [CrossRef]
- Vazquez, P.; Benavente, D.; Montiel, D.; Gomez-Heras, M. Mineralogical Transformations in Granitoids during Heating at Fire-Related Temperatures. Appl. Sci. 2022, 12, 188. [Google Scholar] [CrossRef]
- Hrouda, F.; Chlupáčová, M.; Chadima, M. The Use of Magnetic Susceptibility of Rocks in Geological Exploration (Case Histories Study). Terraplus—Geophys. Equip. Supplier 2009. Available online: https://www.geomatrix.co.uk/cms/resources/downloads/the-use-of-magnetic-susceptibility-of-rocks-in-geological-exploration-v1-1.pdf (accessed on 29 September 2022).
- Tarling, D.H.; Hrouda, F. The Magnetic Anisotropy of Rocks; Chapman & Hall: London, UK, 1993; ISBN 0412498804. [Google Scholar]
- Ihmlé, P.F.; Hirt, A.M.; Lowrie, W.; Dietrich, D. Inverse Magnetic Fabric in Deformed Limestones of the Morcles Nappe, Switzerland. Geophys. Res. Lett 1989, 16, 1383–1386. [Google Scholar] [CrossRef]
- Tauxe, L.; Banerjee, S.K.; Butler, R.F.; van der Voo, R. Essentials of Paleomagnetism: Third Web Edition, 5th ed.; Scripps Institution of Oceanography: La Jolla, CA, USA, 2018. [Google Scholar]
- López-Sánchez, J.; McIntosh, G.; Osete, M.L.; del Campo, A.; Villalaín, J.J.; Pérez, L.; Kovacheva, M.; Rodríguez de la Fuente, O. Epsilon Iron Oxide: Origin of the High Coercivity Stable Low Curie Temperature Magnetic Phase Found in Heated Archeological Materials. Geochem. Geophys. Geosyst. 2017, 18, 2646–2656. [Google Scholar] [CrossRef]
- McIntosh, G.; Kovacheva, M.; Catanzariti, G.; Osete, M.L.; Casas, L. Widespread Occurrence of a Novel High Coercivity, Thermally Stable, Low Unblocking Temperature Magnetic Phase in Heated Archeological Material. Geophys. Res. Lett. 2007, 34. [Google Scholar] [CrossRef]
- Krawchuk, M.A.; Moritz, M.A.; Parisien, M.A.; van Dorn, J.; Hayhoe, K. Global Pyrogeography: The Current and Future Distribution of Wildfire. PLoS ONE 2009, 4. [Google Scholar] [CrossRef] [PubMed]
- Holsinger, L.; Parks, S.A.; Miller, C. Weather, Fuels, and Topography Impede Wildland Fire Spread in Western US Landscapes. For. Ecol. Manag. 2016, 380, 59–69. [Google Scholar] [CrossRef]
- Jiménez González, M.C. Informe Técnico de La Prospección Arqueológica de El Berrueco. Dir. Gen. Patrim. Cult. Junta Castilla Y León 2017. [Google Scholar]


Publisher’s Note: MDPI stays neutral with regard to jurisdictional claims in published maps and institutional affiliations. |
© 2022 by the authors. Licensee MDPI, Basel, Switzerland. This article is an open access article distributed under the terms and conditions of the Creative Commons Attribution (CC BY) license (https://creativecommons.org/licenses/by/4.0/).