Article

Study of the Ciprofloxacin Adsorption of Activated Carbon Prepared from Mangosteen Peel

1
Chemistry Faculty, Thai Nguyen University of Education, Thai Nguyen 250000, Vietnam
2
International School, Thai Nguyen University, Thai Nguyen 250000, Vietnam
3
Chemistry Faculty, Ho Chi Minh University of Education, Ho Chi Minh 720000, Vietnam
4
Institute of Environmental Technology and Sustainable Development, Nguyen Tat Thanh University, Ho Chi Minh 700000, Vietnam
5
Faculty of Food and Environmental Engineering, Nguyen Tat Thanh University, Ho Chi Minh 700000, Vietnam
*
Authors to whom correspondence should be addressed.
Appl. Sci. 2022, 12(17), 8770; https://doi.org/10.3390/app12178770
Submission received: 11 August 2022 / Revised: 27 August 2022 / Accepted: 29 August 2022 / Published: 31 August 2022

Abstract

:
In this study, activated carbon derived from mangosteen peel (abbreviated as ACMP) was successfully fabricated. This as-prepared ACMP possessed graphite and had a porous structure with a specific surface area of 419.8554 m2/g. Investigations of the influencing factors on the ciprofloxacin (CIP) adsorption capability of the ACMP based on the static adsorption method showed that: adsorption equilibrium can be achieved in 60 min, the optimal pH for CIP adsorption was a pH of 6, and the optimal ratio between the material mass and solution volume was 3 g/L. The CIP adsorption process of the ACMP follows the Langmuir, Freundlich, Tempkin, Elovich, and Redlich–Peterson isotherm adsorption models. The maximum adsorption capacity calculated according to the Langmuir isothermal adsorption model for the CIP of the ACMP was (qmax = 29.76 mg/g). The CIP adsorption process of the ACMP followed the apparent quadratic kinetic equation, as well as spontaneous, endothermic, physical, and chemical adsorption. The adsorption rate was governed by membrane diffusion.

1. Introduction

Ciprofloxacin (CIP) is a fluoroquinolone antibiotic which has been widely employed in the treatment of infections in humans and animals in recent decades. Chemically, CIP is a 1-cyclopropyl 6-fluoro-4-oxo-7-piperazine-1-yl-quinolone-3-carboxylic acid, which has an extended aromatic region and functional groups suitable for hydrogen binding. CIP can possibly enter an aqueous environment via either the incomplete metabolism of the body or wastewater from drug manufacturers [1]. The concentrations of CIP can be detected in wastewater and surface water at concentrations of one-hundred ng/L to μg/L [2]. The presence of CIP in wastewater and surface waters, even at trace concentrations, can still have negative effects on environmental ecology and human health [3].
Thus, various chemical reagents and physical and chemical methods have been developed to remove CIP from wastewater, such as adsorption [4,5,6,7,8,9,10,11,12,13,14,15,16], photocatalysis [17,18,19,20,21], internal electrolysis [22], ozonation, oxidation [2], flocculation [23], and microbial treatment [24]. Among these methods, adsorption has been proven to be an effective approach because of its ease of operation, low cost, and high efficiency.
Activated carbon is an adsorbent commonly used in practical applications due to its well-developed pore size, the reactivity of its surface functional groups, and its large surface area, which provides more binding sites for adsorption [25]. Currently, the research direction for manufacturing activated carbon from agricultural by-products is of great interest to many scientists because of the available, abundant, and cost-effective raw materials. Mangosteen, scientifically known as Garcinia mangostana L., is a plant belongs to the Clusiaceae family. Mangosteen is primarily grown in Southeast Asia, Sri Lanka, and India. In addition, this fruit also appears in some tropical South American countries, for example, Colombia and Puerto Rico. Vietnam is also has probable land for cultivating mangosteen. However, mangosteen only grows well in the South Central, Southeast, and Southwest regions of Asia. Particularly, the Southwest region (the Mekong River Delta) has the largest growing area of mangosteen, approximately 4.9 thousand hectares, with an output of approximately 4.5 thousand tons. Mangosteen peel is the discarded part of mangosteen fruit, containing lignin and hemicellulose compounds, which are primary materials for fabricating activated carbon. Therefore, activated carbon derived from mangosteen peel (ACMP) has been synthesized and applied as a material to treat aqueous environments contaminated with metal ions and dyes by many scientists [26,27,28,29,30,31,32,33,34,35]; nonetheless, no studies in the literature have ever reported CIP adsorption via mangosteen peel derived activated carbon.
When making activated carbon from mangosteen peel, the authors used chemical agents such as K2CO3 [30], KOH [31], H3PO4 and KOH [34], and H3PO4 [35] combined with physical agents such as temperature (500–900 °C [30,31,34,35]) and CO2 [29].
Up to now, no author has studied CIP adsorption on activated carbon materials derived from mangosteen peel. According to previous research papers, the adsorption of CIP on biological activated carbon materials is usually physical adsorption, and the adsorption process is endothermic [7]. No author has studied the Elovich isotherm adsorption model and calculated the activation energy of CIP adsorption on biological activated carbon [7].
Therefore, in this work, we introduce a method to make activated carbon from mangosteen peel through thermal activation at 500 °C for 2 h, followed by chemicall activated by ZnCl2. We studied the adsorption isotherm models of Langmuir, Freundlich, Tempkin, Elovich, and Redlich–Peterson, as well as the kinetics, chemical thermodynamics, and activation energy of CIP adsorption processes using the as-fabricated activated carbon.

2. Materials and Methods

2.1. Materials

2.1.1. Fabrication Procedure of Activated Carbon Derived from Mangosteen Peel

Mangosteen peel was collected, washed thoroughly with tap water and distilled water several times to remove all dirt particles, dried, crushed, and placed in a furnace (Carbolite Sheffield, UK, LMF4) at 500 °C for 2 h, with a ramping rate of 10 °C/min. Under such anoxic conditions, the material was thermally decomposed into porous carbon materials and hydrocarbon compounds. The sample was then taken out, cooled at room temperature, and washed with distilled water until its pH was 7. The sample was then dried at 105 °C to constant mass, ground, and sieved to a size of d = 1 mm. The resulting product is then denoted as MP.
The as-prepared MP was subsequently mixed with solid ZnCl2 with a mass ratio of MP:ZnCl2 as 2:1 by grounding in an agate mortar, and then it was transferred to a 50 mL porcelain crucible with a lid. A small amount of distilled water was added to make a paste, and then it was stirred for 1 h. Subsequently, the samples were calcined to 500 °C for 180 min. After chemical activation, the products were neutralized with a 0.5 M HCl solution. Then, the samples were washed several times with distilled water until their filtrate reached neutral medium, and then they were dried at 110 °C for 24 h. Finally, the activated carbon sample, now abbreviated as ACMP, was crushed and stored in glass vials for further use.

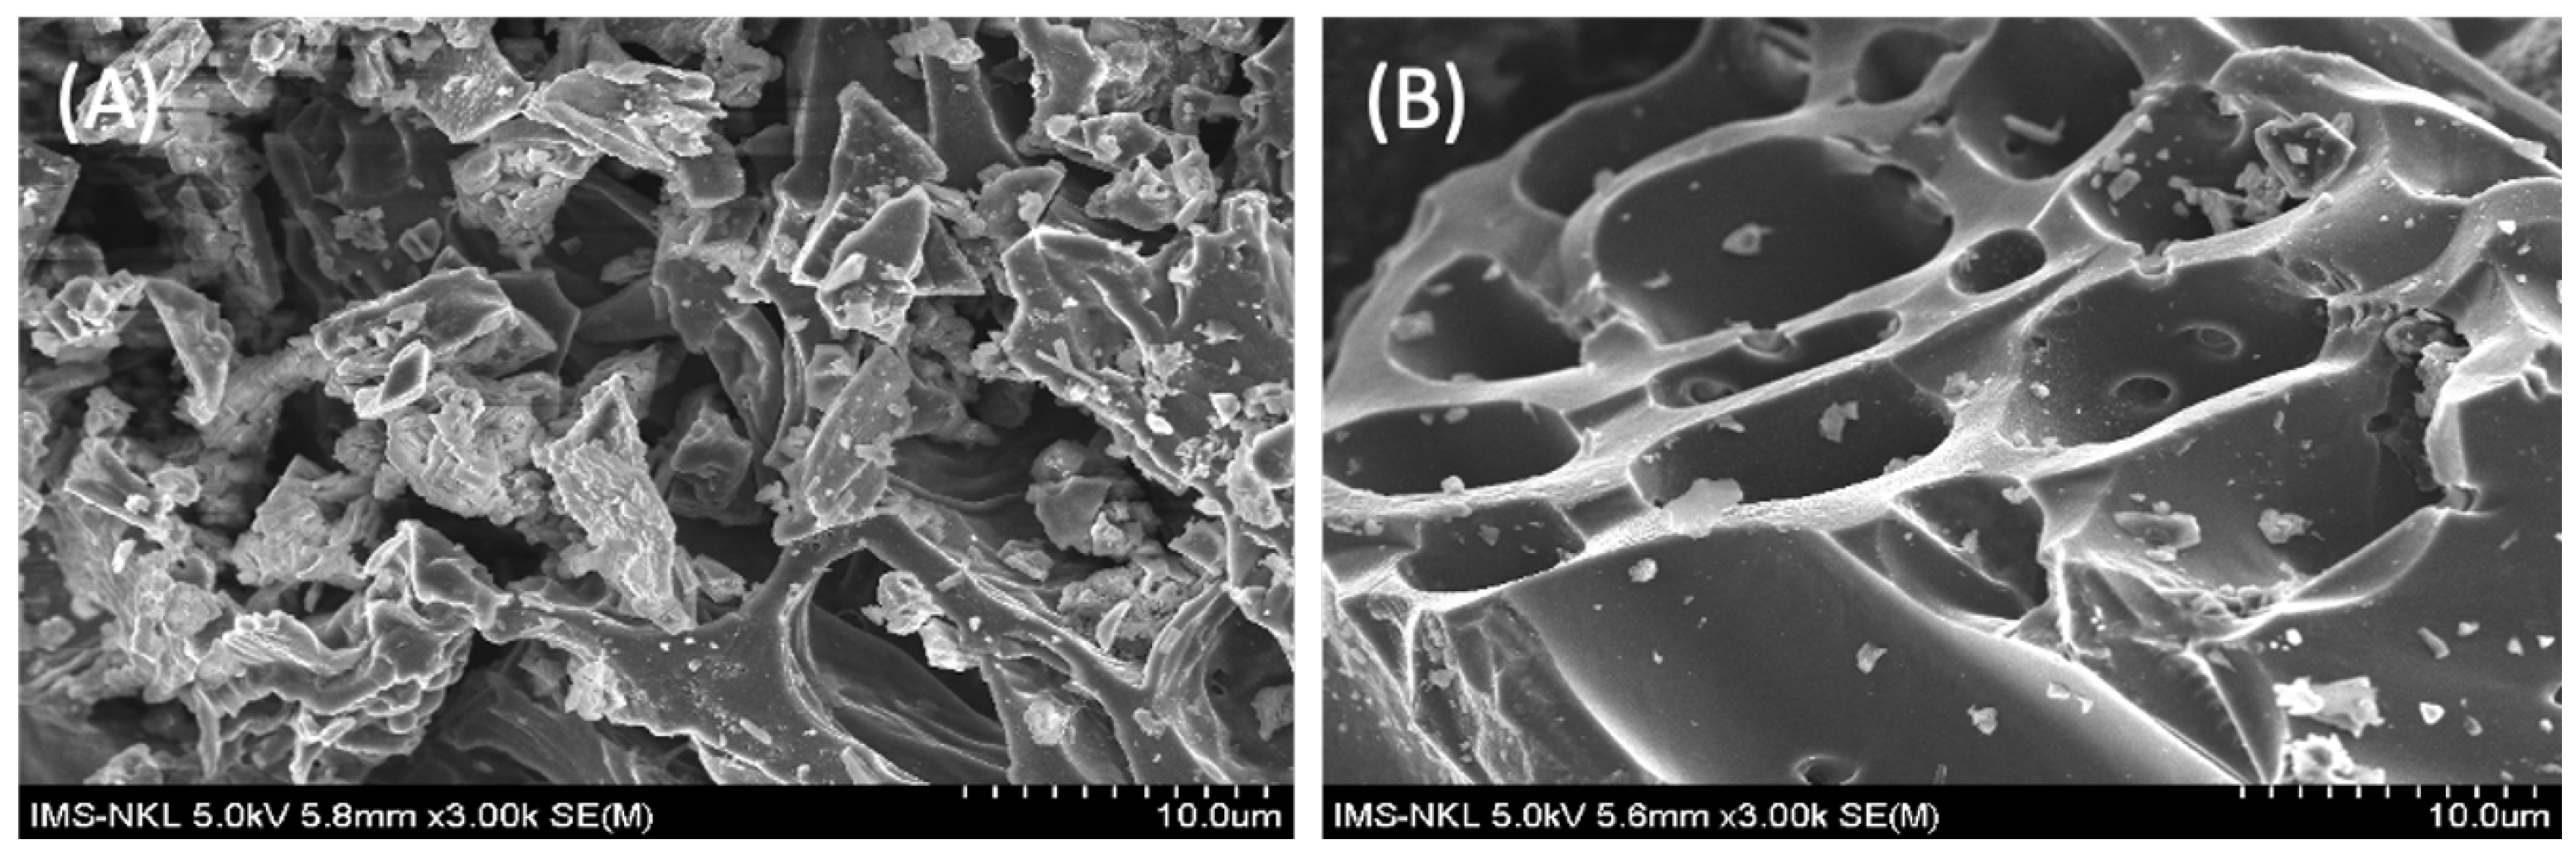
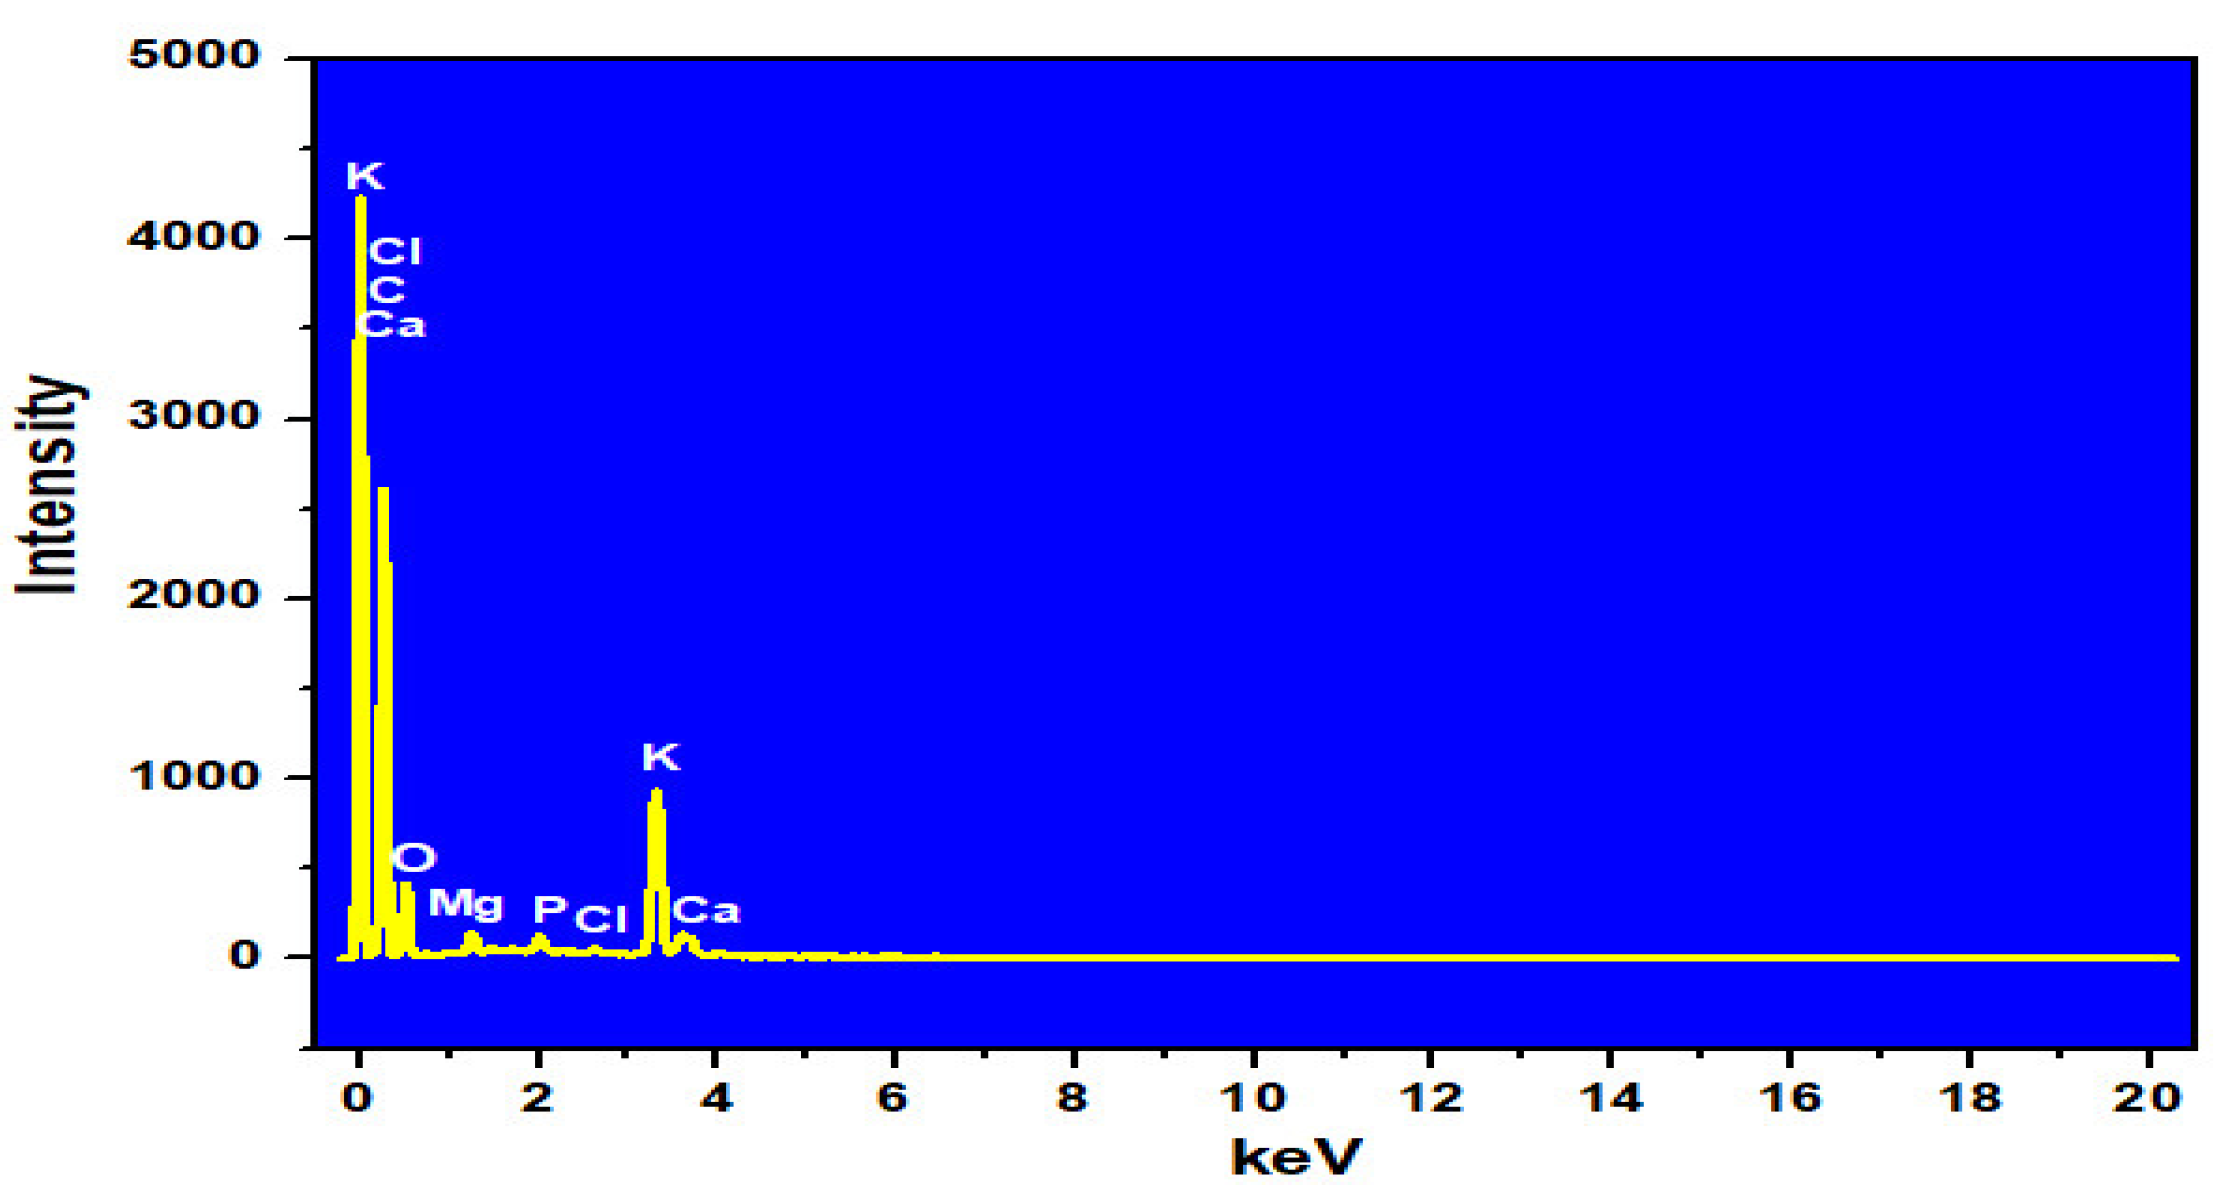
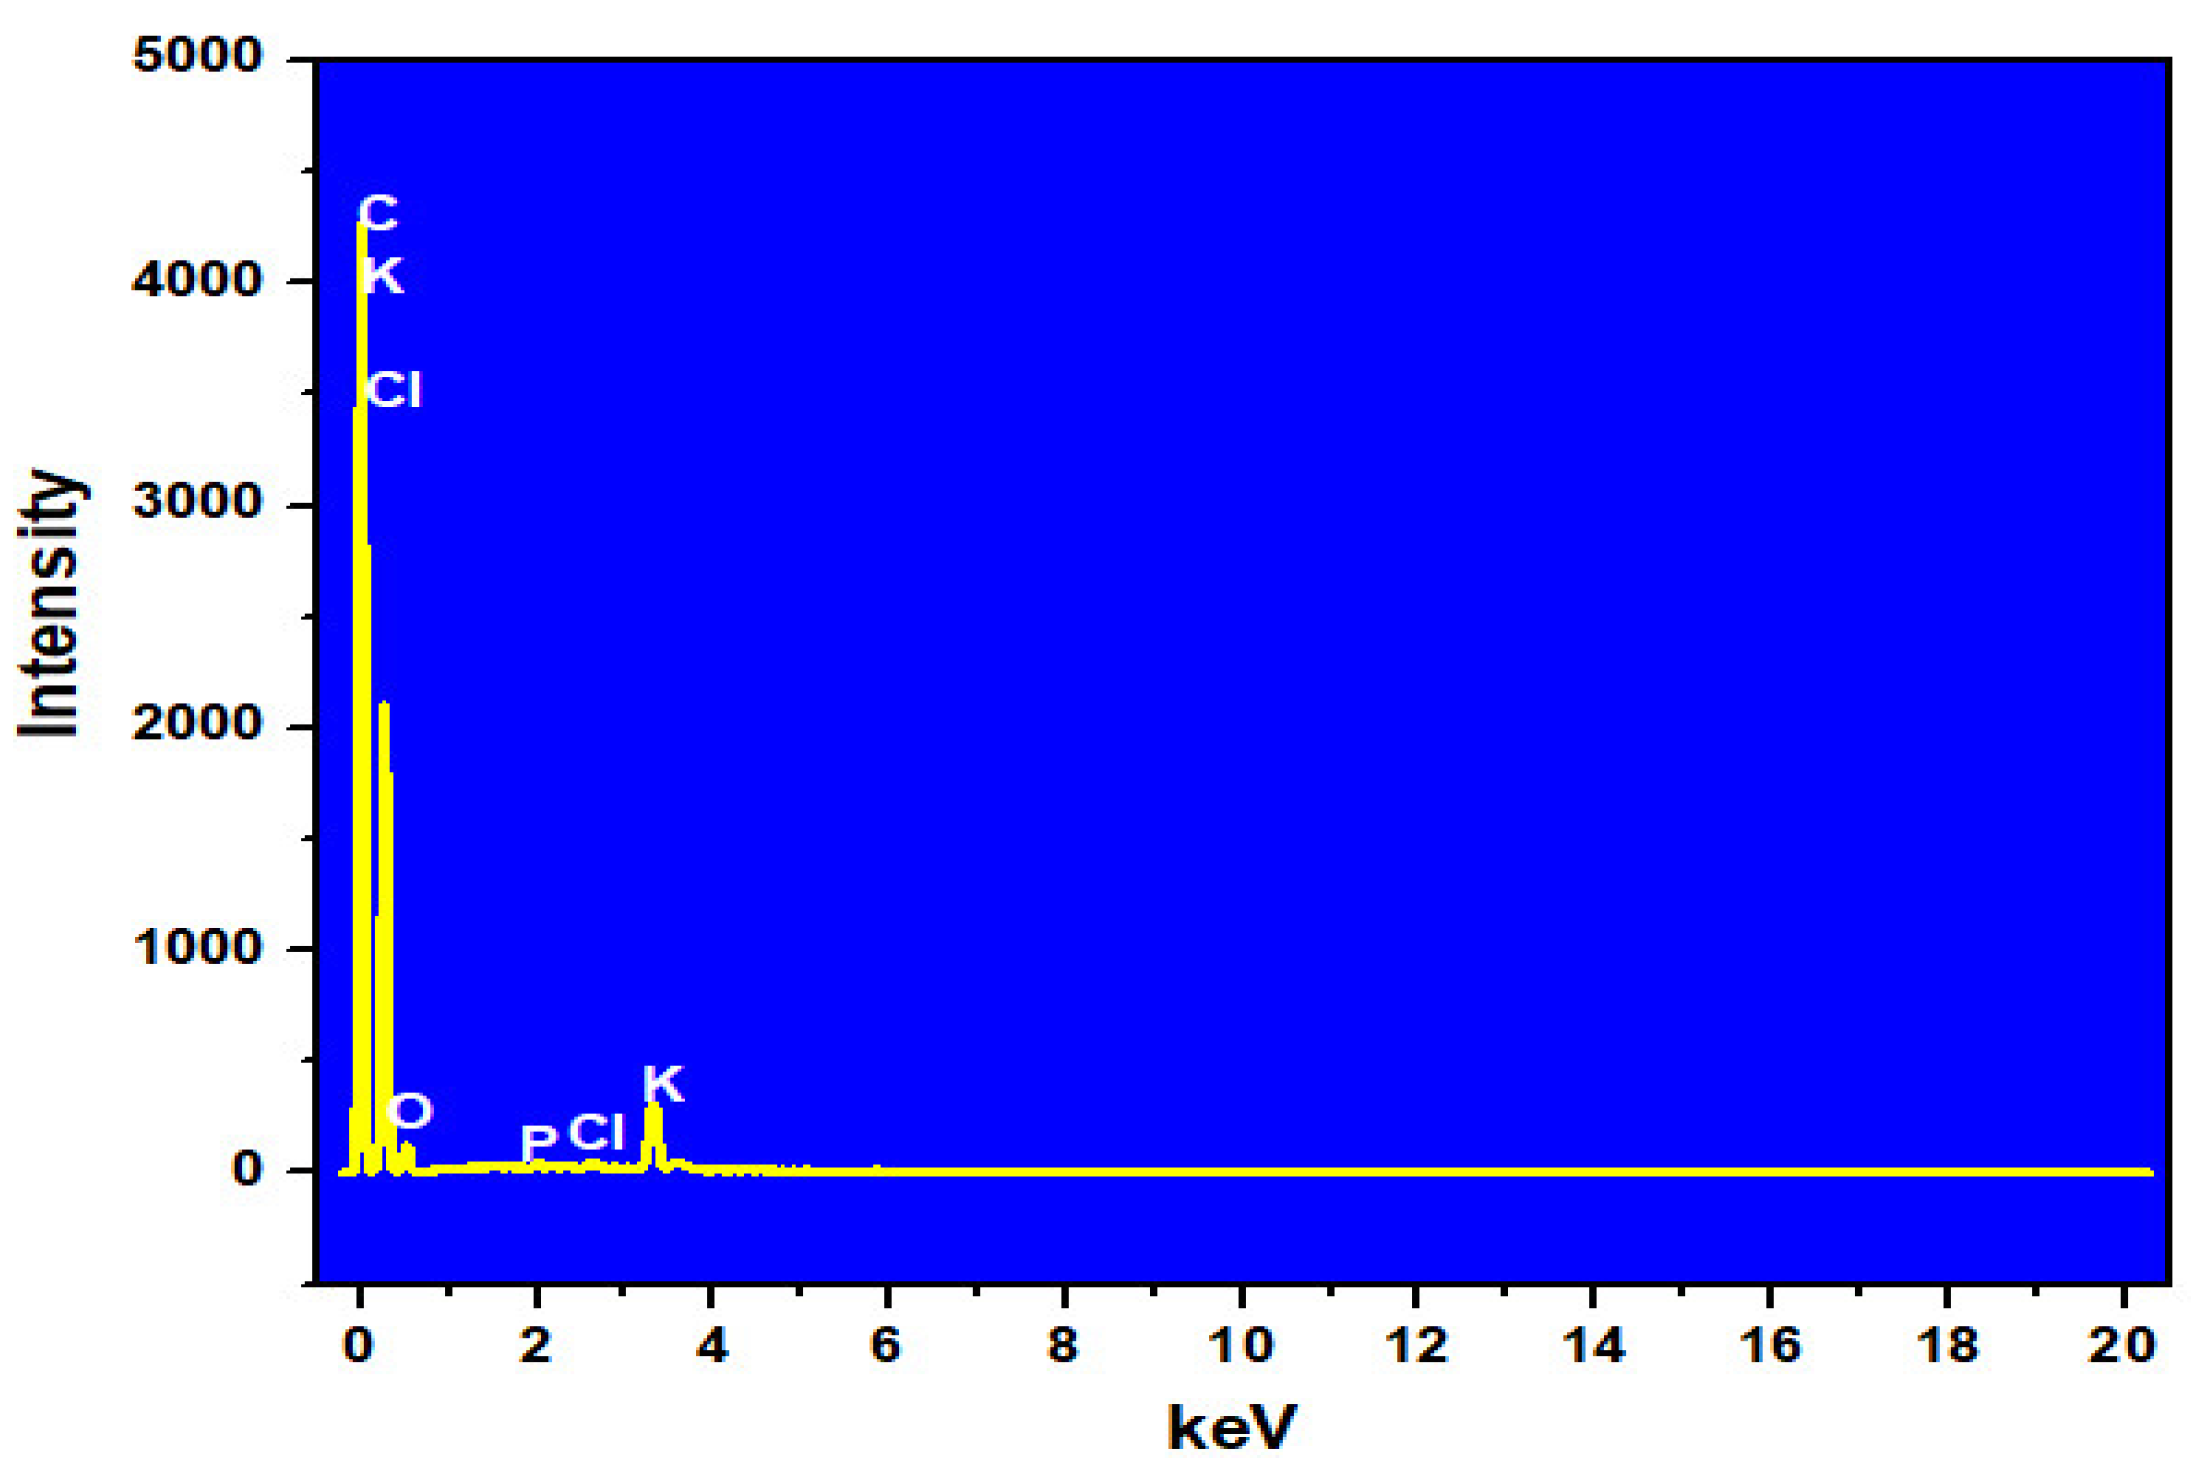
2.1.2. Investigations on the Physical Properties and Surface Characteristics of Activated Carbon MP and ACMP

The morphologies of the MP and ACMP were examined using scanning electron microscopy (SEM) on a JSM-6510LV unit (Jeol, Tokyo, Japan), and the chemical compositions of the MP ACMP were determined by energy dispersive X-ray spectroscopy (EDS) on the same JSM-6510LV unit (Jeol, Tokyo, Japan). In addition, the surface functional groups of the ACMP were characterized by Fourier transform infrared spectroscopy (FT-IR) on a Neus 670 (Nicolet, Brighton, MO, USA). The crystalline structure of the ACMP was further verified using X-ray diffraction (XRD) on an Equinox 5000 (Thermo Scientific, Paris, France). The specific surface area of the ACMP was determined by the BET method on a Micromeritics-3030 USA. The SEM, EDS, XRD, and BET were conducted at the Institute of Materials, Vietnam Academy of Science and Technology. The FT-IR infrared spectroscopy was measured at the Department of Chemistry, University of Natural Sciences, Vietnam National University, Hanoi.

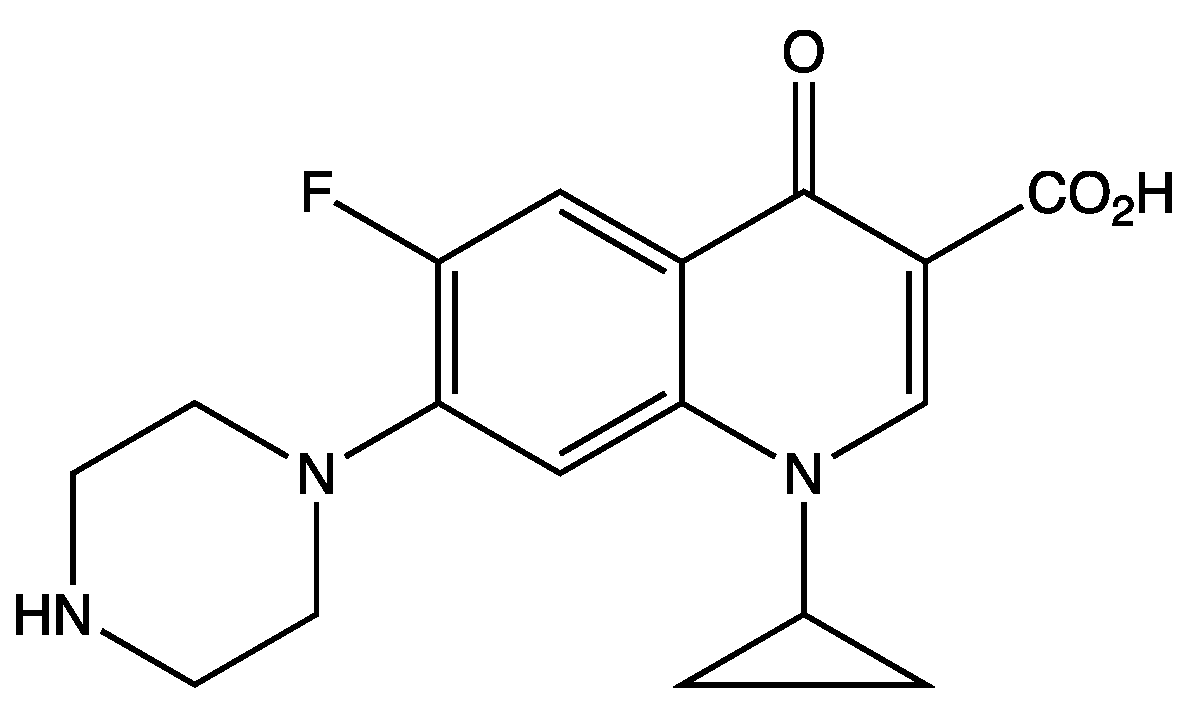
2.2. Antibiotic Ciprofloxacin

Ciprofloxacin (CIP) is an antibiotic of the fourth quinolone group belonging to the second generation fluoroquinolone antibiotic system. Its molecular formula is C17H18FN3O3 and its molar mass is 331.346 g. Figure 1 is the structural formula of CIP.

2.3. CIP Adsorption Experiments

Experimental factors on CIP elimination, including solution pH, reaction time, mass of the ACMP, initial CIP concentrations, and temperatures, were investigated. To ensure repeatability, each experiment was performed at least 3 times under the same conditions. The results were the average of the 3 experiments. Briefly, a certain amount of ACMP was introduced into each 100 mL Erlenmeyer flask, followed by an additional amount of CIP. A total of 1 mol/L NaOH and 0.1 mol/L HCl were used to adjust the pH of the CIP solution. The flasks were shaken on a shaker with conditions varying according to the experiment (Table 1).
The CIP adsorption efficiency of the ACMP was calculated via the following equation:
H = C 0 Ce C 0 × 100 %
where H is the adsorption efficiency, C0 is the initial concentration (mg/L), and Ce is the concentration at adsorption equilibrium (mg/L).
All chemicals (ZnCl2, CIP, NaOH, and HCl) used in the experiment were obtained from Merck and were pure (>99%).
The CIP concentration before and after adsorption was measured on a 02-beam UV-Vis molecular absorption spectrometer, model UH5300, Hitachi, Tokyo, Japan, 2016. The CIP concentration was measured with wavelengths ranging from 190–1100 nm, a scanning speed of 10–6000 nm/s, a wavelength accuracy of ±0.3 nm, and a noise of <0.0001 nm.

2.4. Physical Parameters of the Activated Carbon

2.4.1. Moisture Determination

We took 10 g of the ACMP and dried it at 105 °C for approximately 4 h to a constant weight, then weighed and determined its moisture content. The final result was the average of the 3 determinations [26]. The moisture content was calculated using the following equation [27]:
  %   Moisture   content = m o m m o × 100
where mo is the initial mass of the AMCP and m is the mass of the AMCP after drying.

2.4.2. Ash Ratio Determination

First, a porcelain cup was heated in a drying oven until its mass was unchanged. Then, it was cooled down and the weight of the cup was measured (m1). Next, 1.00 g of the AMCP (dried at 80 °C for 24 h) was added into the cup, and we measured the cup containing the AMCP (m2). The samples were calcined in a furnace at 600 °C for 4 h. Then, the samples were cooled down to room temperature and weighed again (m3). The ash content of the ACMP was calculated as follows [27]:
%   Ash   content = m 3 m 1 m 2   m 1 × 100

2.4.3. Density Determination

We weighed 10 g (m) of the ACMP (dried at 100 °C for 4 h) and filled a cylinder with water to the correct 200 mL mark. Then, we put the ACMP into the cylinder and determined the change in the water volume (V) as follows:
Density   of   activated   carbon = m V  

2.5. Iodine Index of the Coal

We prepared 7 × 250-mL conical flasks. We added to each flask 0.05 g of the ACMP and 50 mL of an iodine solution with different concentrations and shook it carefully for 1 min, and then we filtered and titrated the remaining amounts of iodine with a 0.01 N Na2S2O3 solution, with starch as an indicator. The experiments were conducted at room temperature (25 ± 1 °C).
The amount of iodine in the solution was calculated using the following equation [27]:
iodine   number   ( mg · g ) = V 1 N 1 V 2 N 2 W 126.93 f g
where V1 is the analyzed iodine volume (mL), V2 is the volume of Na2S2O3 used (mL), W is the activated carbon’s weight (g), N1 and N2 are the iodine and Na2S2O3 normality (N), respectively, fp is the dilution factor, and 126.93 is the iodine amount corresponding to 1 mL of the Na2S2O3 solution.

2.6. Determination of the Isoelectric Point of the ACMP

We prepared solutions of 0.1 M NaCl with the initial pH ( pH i ) is increasingly adjusted from 0.94 to 8.35. We took 9 conical flasks of 100 mL capacity and added 0.05 g of the ACMP to each flask. Then, we consecutively added 100 mL of the solution with increasing pH (prepared as described above) to the conical flasks. We let the flasks stand for 48 h, then filtered the solutions and determined their pH ( pH f ) again. We calculated the difference between the initial pH ( pH i ) and the equilibrium pH ( pH f ) ( Δ pH = pH i     pH f ), then plotted a graph showing the dependence of Δ pH on pH i , and the intersection point of the curve with the coordinate at the value Δ pH = 0 provided us with the isoelectric point to be determined.

3. Results and Discussion

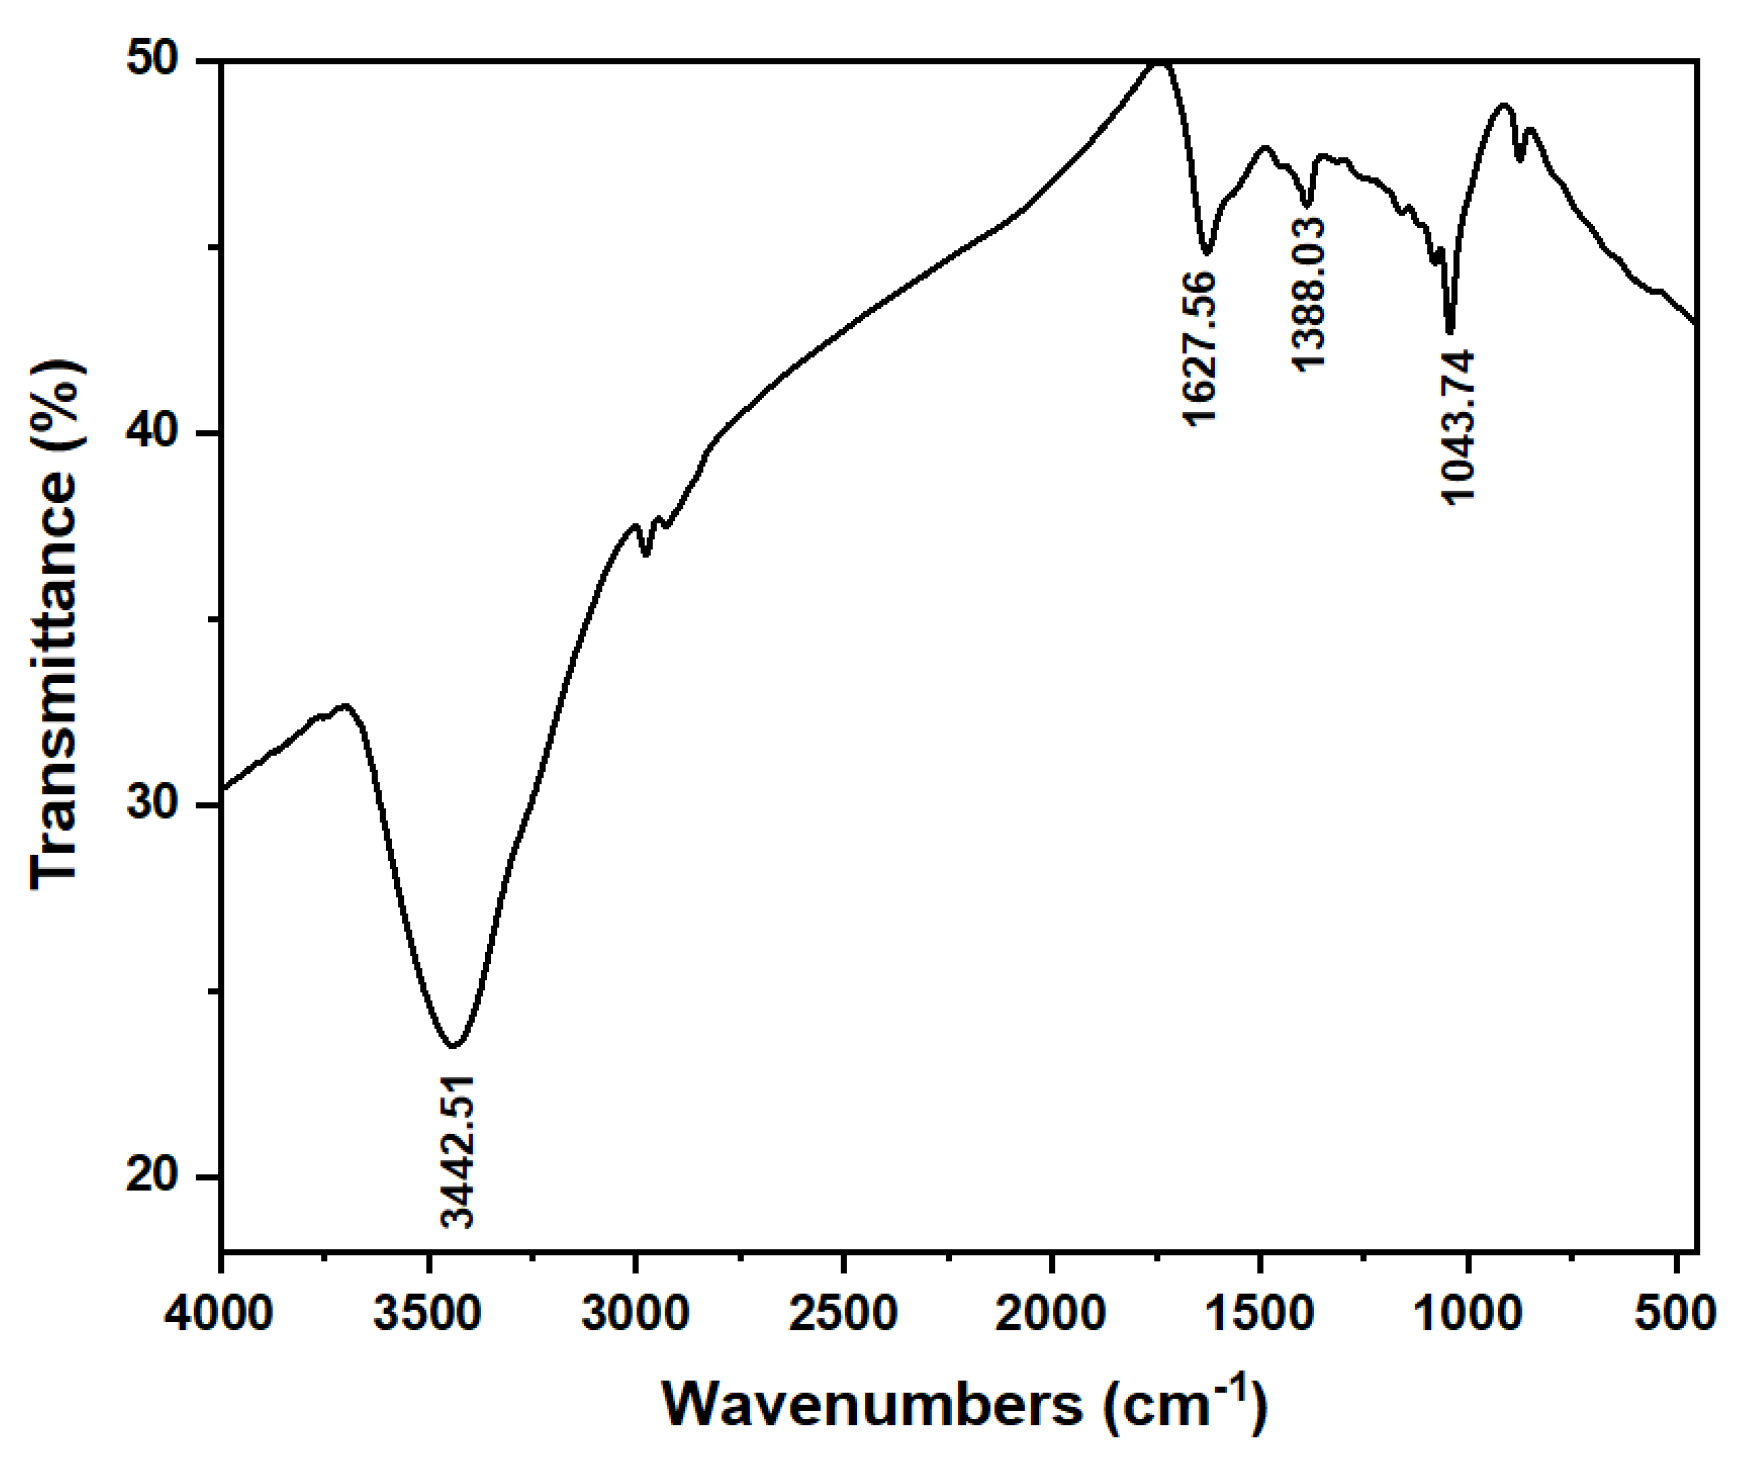
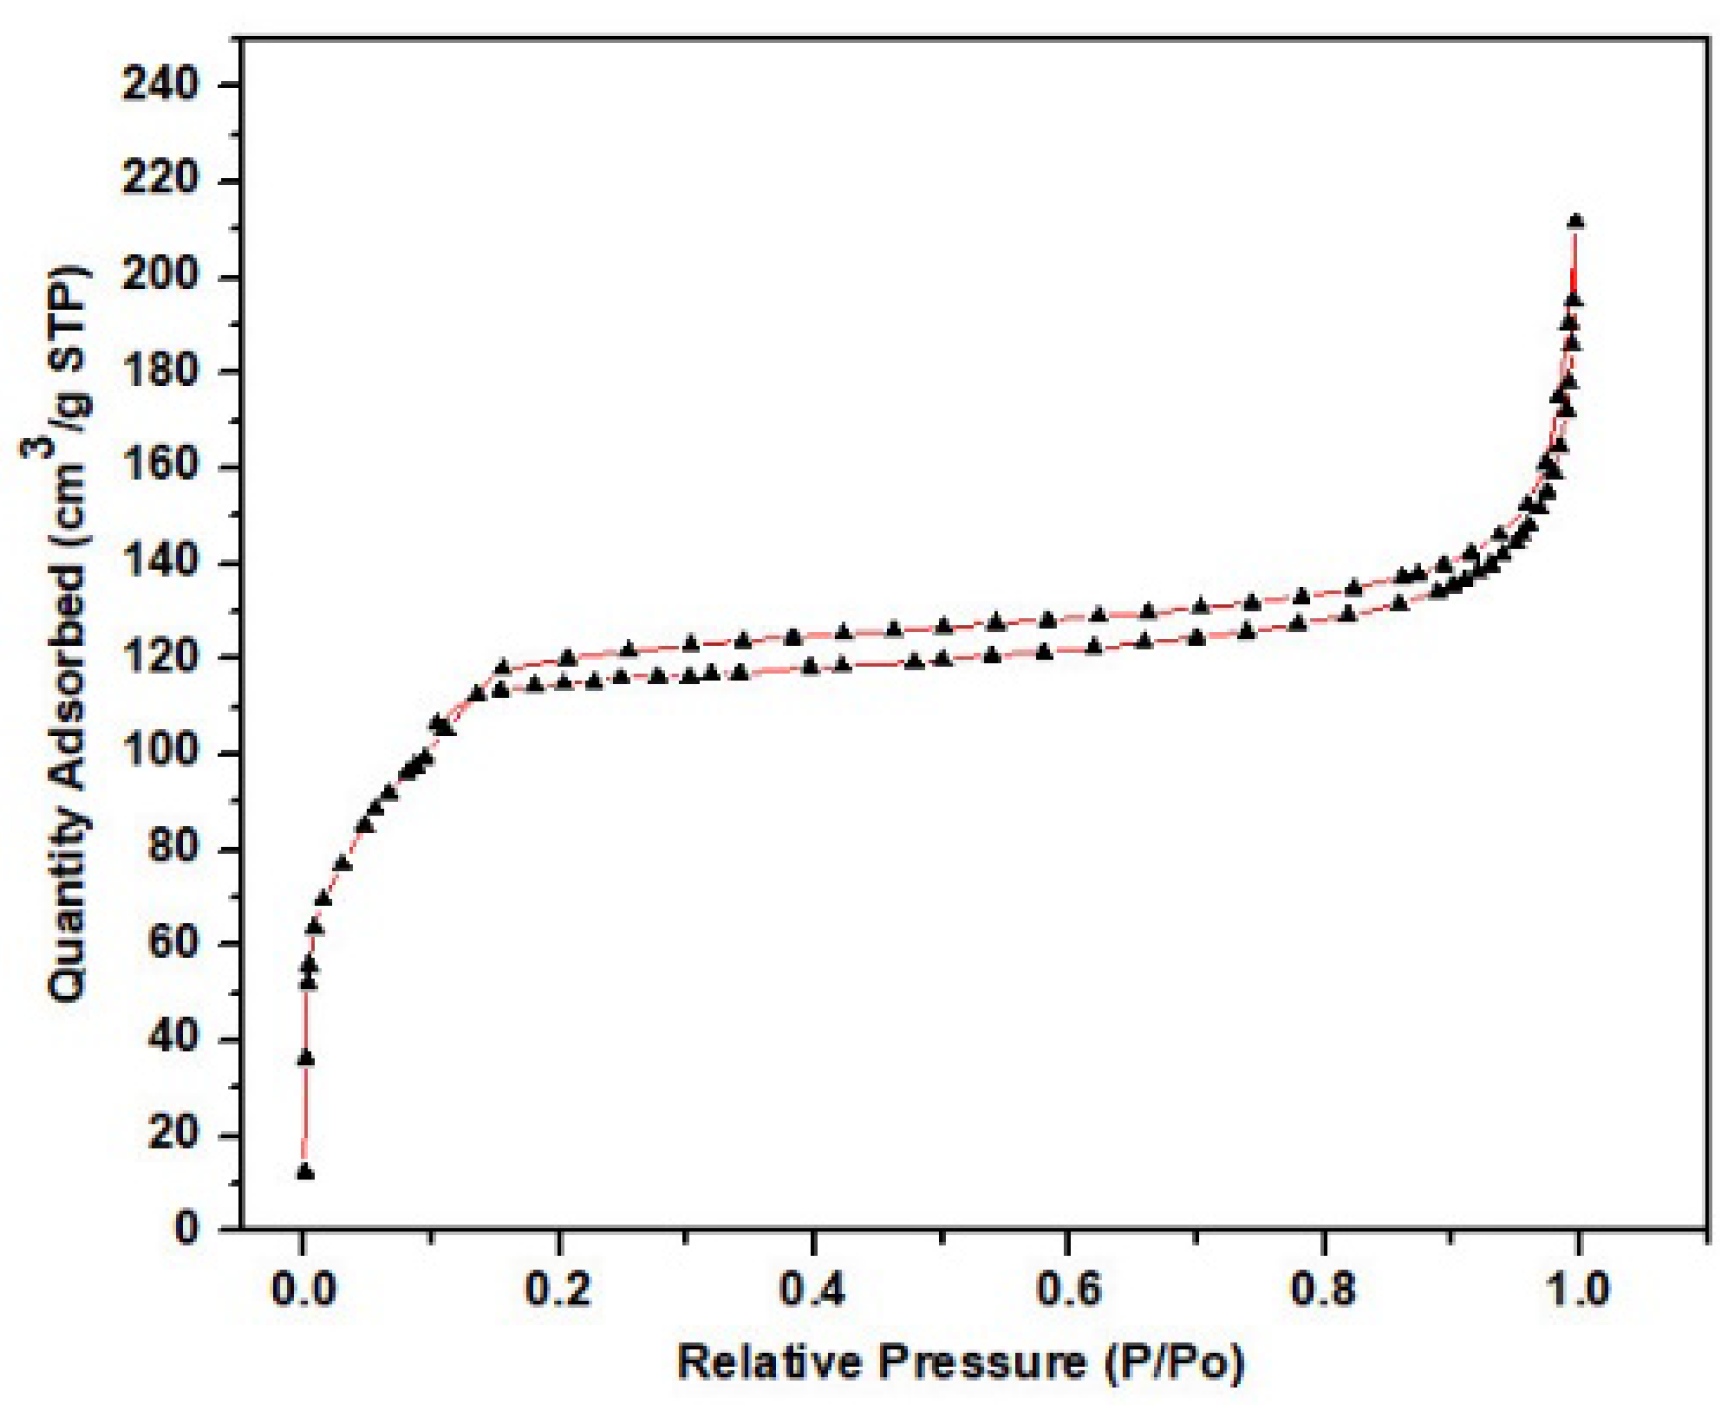
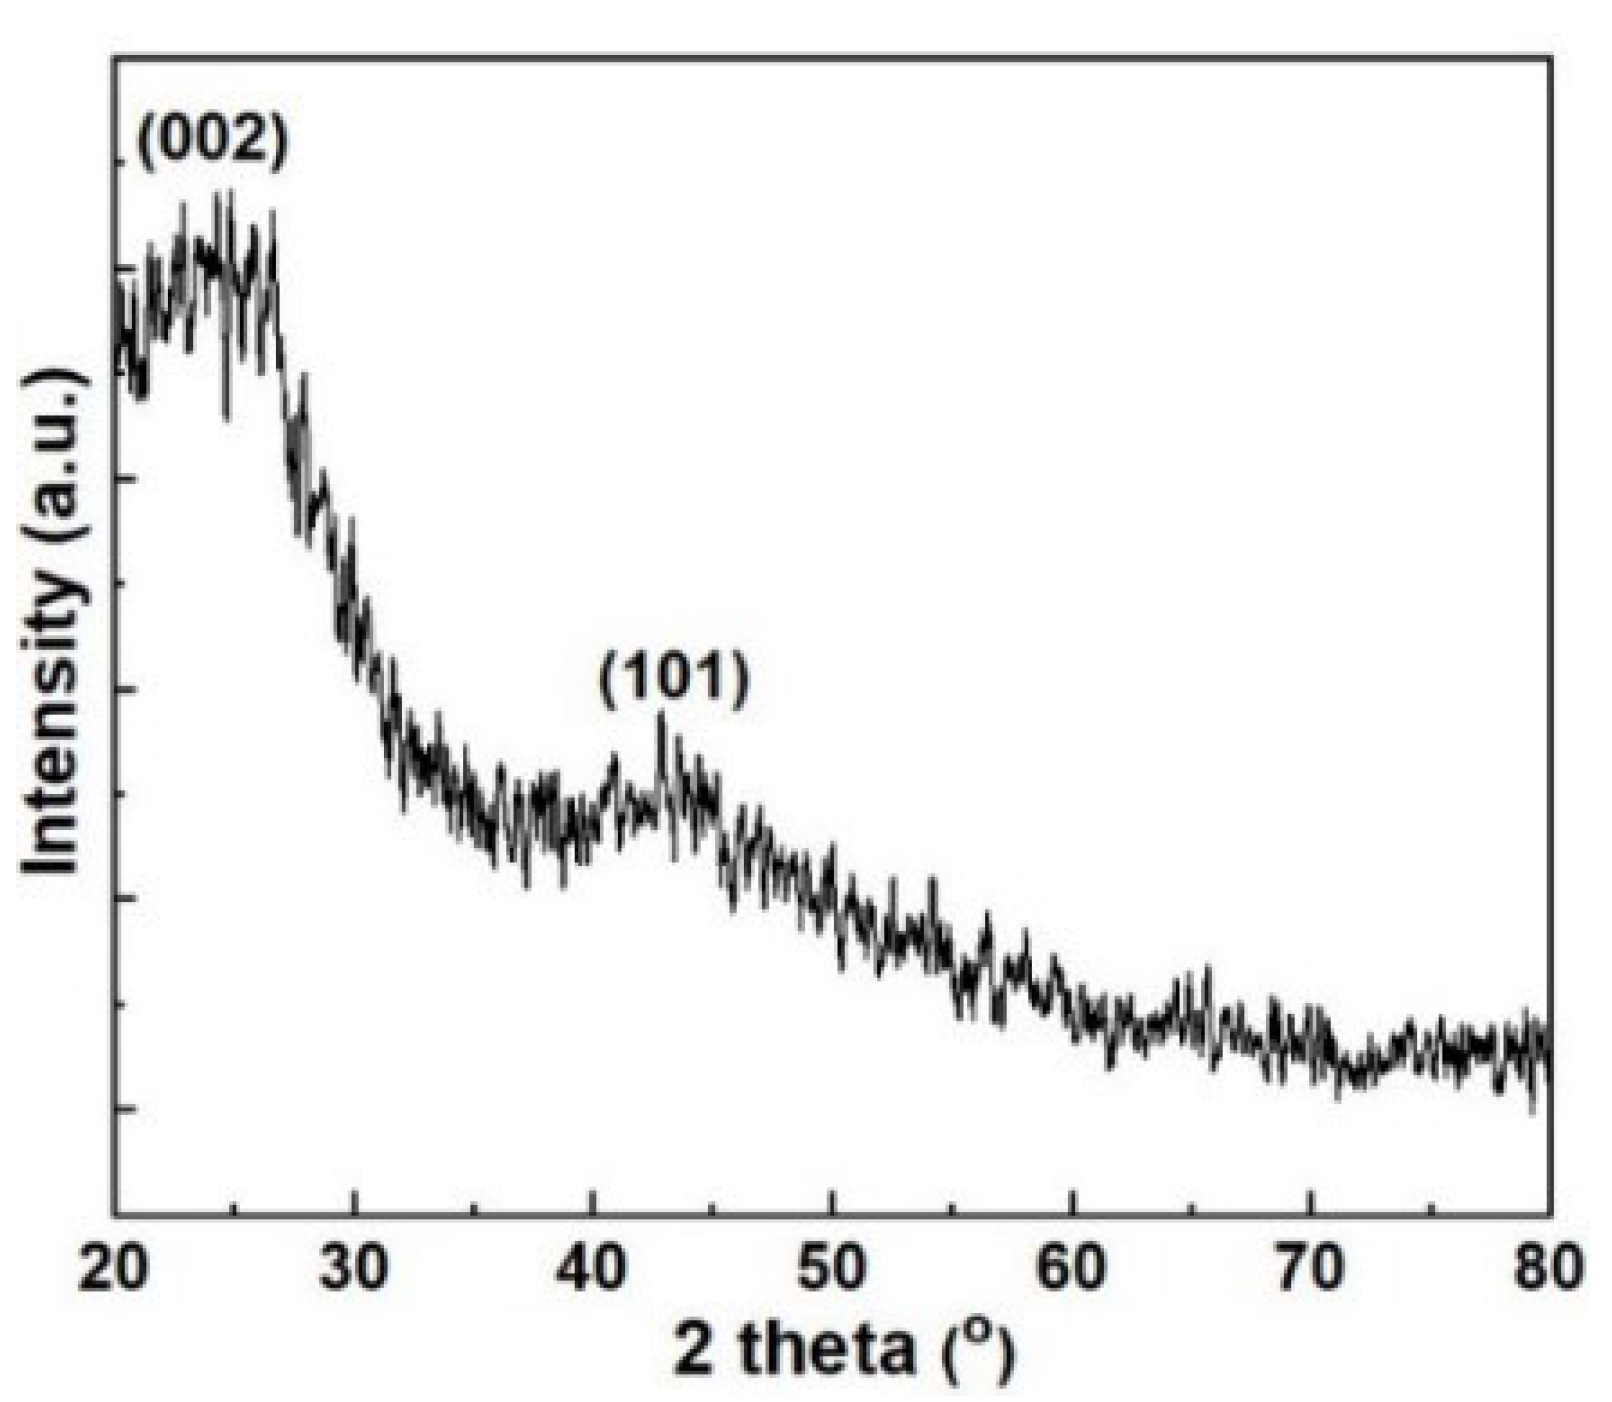
3.1. Investigations on the Physical Propertie, and Surface Characteristics of the MP and ACMP

SEM images of the MP and ACMP are displayed in Figure 2.
It can be observed in Figure 2 that mangosteen peel, after being activated by temperature and ZnCl2, showed remarkable surface morphology changes compared with the unactivated sample. Specifically, once being activated by ZnCl2 (Figure 2), tubular capillaries were formed, creating many voids, increasing surface porosity, and enhancing adsorption efficiency.
The EDS analysis results of the MP and ACMP are summarized in Table 2 and Table 3 and Figure 3 and Figure 4. The results show that the ACMP possessed a carbon content mass of 81.45% and 86.54% by atom and an oxygen mass of 15.39% and 12.27% by atom. Meanwhile, the MP sample contained a carbon content mass of 68.81% and 76.86% by atom and an oxygen mass of 24.73% and 20.74% by atom. The increase in the carbon content (approximately 10%) and the decrease in the oxygen content showed that the MP material was successfully activated by the ZnCl2. This result is similar with the activated carbon derived from moringa leaves and activated by H2SO4 [36].
The functional groups on the surface of the ACMP were examined through FT-IR infrared spectroscopy, as shown in Figure 5. Particularly, there was a broad-spectrum pattern at 3442.51 cm−1 attributed to the -OH group. Another spectrum pattern at 1627.56 cm−1 was ascribed to the valence vibration of the carbonyl group C=O (carboxylic). The infrared absorption of the symmetric CH group was shown at the peak spectrum positioned at 1388.03 cm−1. The absorption spectrum located at 1096.24 cm−1 can be attributed to the oscillation of the C–O [36].
The surface properties and capillary structure of the ACMP were then studied by an N2 adsorption–desorption method on a Micromeritics-3030 USA machine, as shown in Figure 6. It can be seen that the ACMP exhibited a type IV sorption isotherm curve with an H4 hysteresis loop. Type IV isotherms are common in porous adsorbents where capillary condensation occurs. Furthermore, H4 hysteresis loops are commonly found in adsorbents with particle sizes ranging from micropores to medium-sized pores. Figure 6 shows that the volume of the N2 gas was adsorbed at the relative pressure P/P0 (0–0.2), indicating the presence of micropore-sized material. The existence of material with a medium pore size is shown at the relative pressure P/P0 in the range of 0.2–0.9. Furthermore, a small tail at the relative pressure P/P0, closer to 1.0 (>0.9), indicates the presence of a large pore-sized material. Therefore, the ACMP contains mainly medium-sized pores. This result is similar to the study published by Zhang et al. [35], where they authors made activated carbon from mangosteen peel and activated it with H3PO4. On the other hand, from the BET measurement results, the average capillary volume was 0.279465 cm3/g and the average pore diameter was 2.66249 nm, which is consistent with the results of the nitrogen adsorption–desorption isotherms of the ACMP. The specific surface area of the ACMP was then measured as 419.8554 m2/g.
The XRD pattern of the ACMP is presented in Figure 7, showing two particular diffraction peaks in the range of 2θ = 200–300 and 2θ = 400–500. The presence of these peaks could be attributed to the lattice planes of 002 and 100 of the activated carbon. Therefore, the as-prepared ACMP possessed a graphite structure. This finding is consistent with the study on activated carbon’s structure published by Zhang et al. [35].

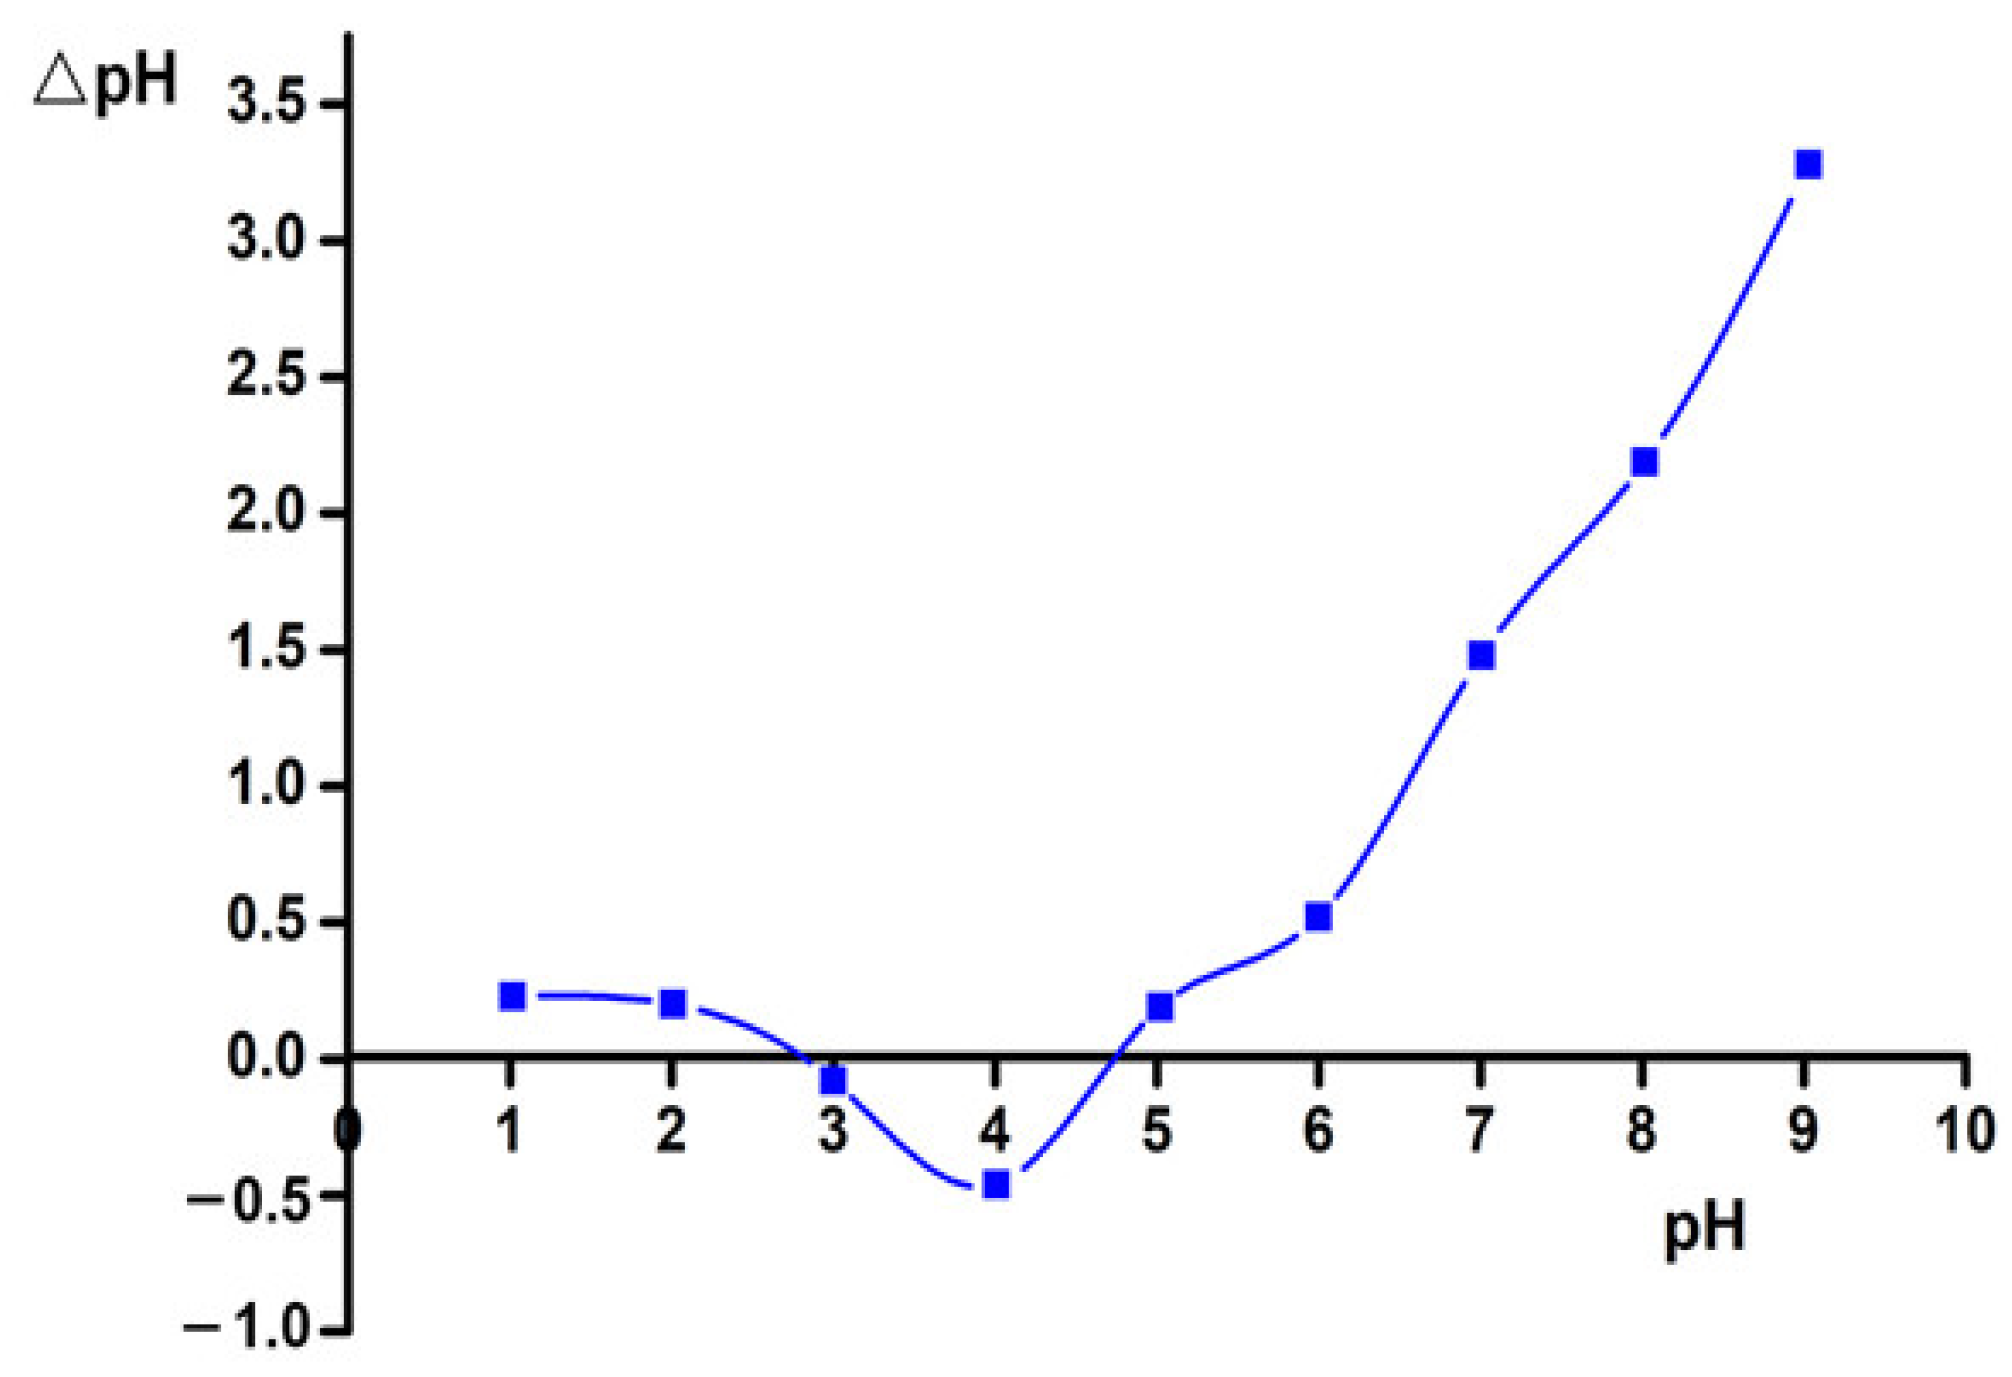
3.2. Isoelectric Point of the ACMP

The results of determining the isoelectric point of the ACMP are shown in Figure 8.
From Figure 8, the point of zero charge ( pH pzc ) of the ACMP was pH pzc = 5.34. This verifies that the surface charge of the ACMP was positive when the pH was < pH pzc , and it became negatively charged when the pH was > pH pzc .

3.3. Physical Parameters and Iodine Index of the ACMP

The physical parameters of the ACMP are shown in Table 4.
The ACMP has a low moisture content and density. In terms of mechanical properties, this would be favorable for the ACMP because a higher the moisture content is worse for the thermal engineering properties, reducing the strength and durability of the coal. The iodine index of the ACMP was 825 mg/g. The iodine index shows the adsorption capacity, as well as the porosity, of the fabricated activated carbon. This result was also within the range of the activated carbon that is suitable for practical applications in environmental treatments (500–1200 mg/g).

3.4. Investigations of the Influencing Effects on the CIP Adsorption Capability of the ACMP
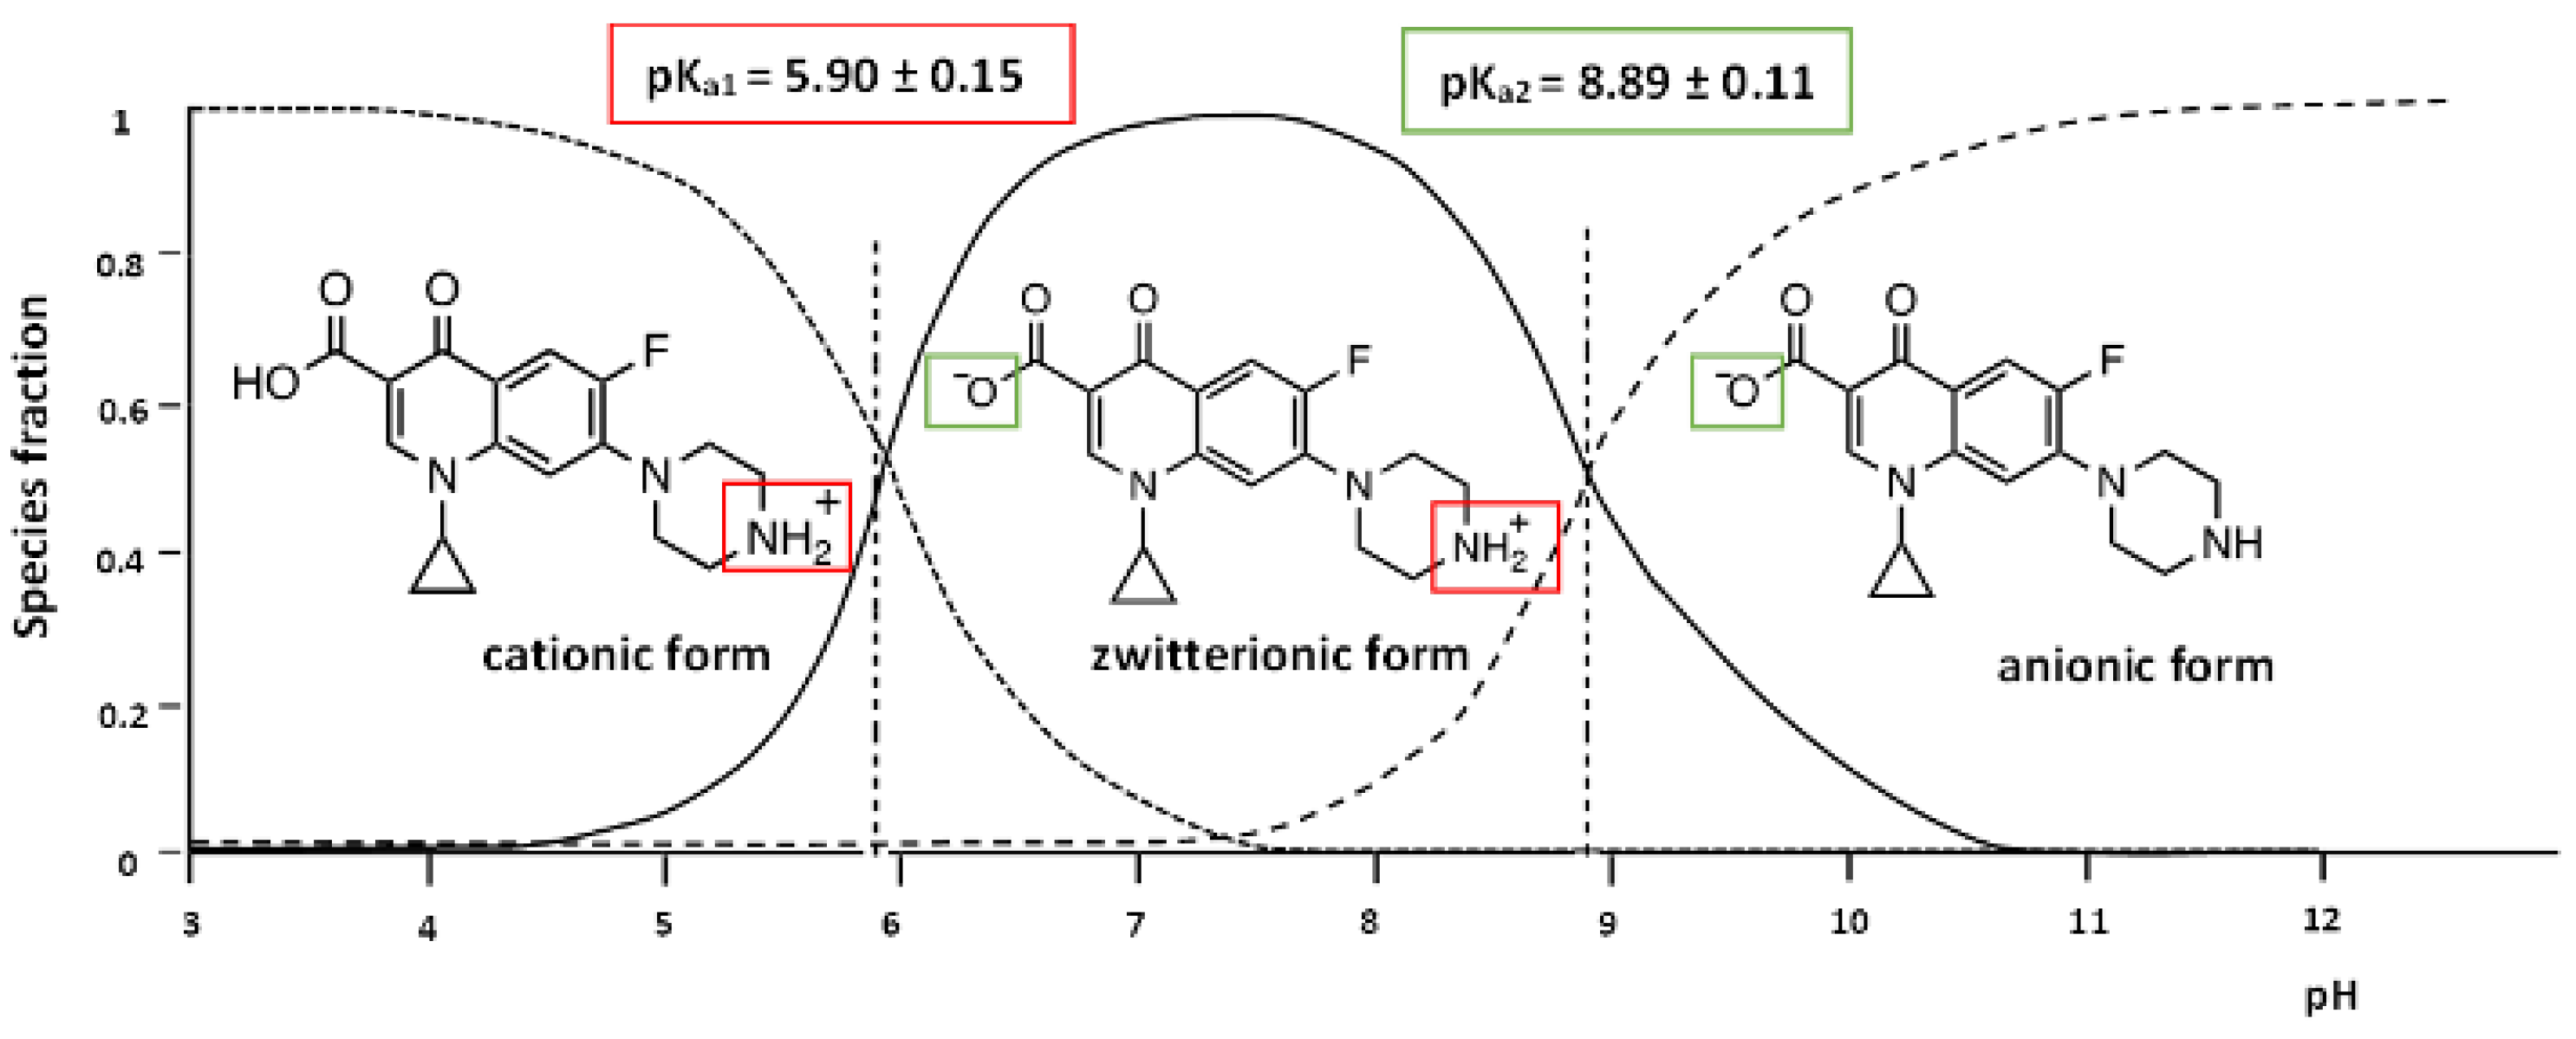
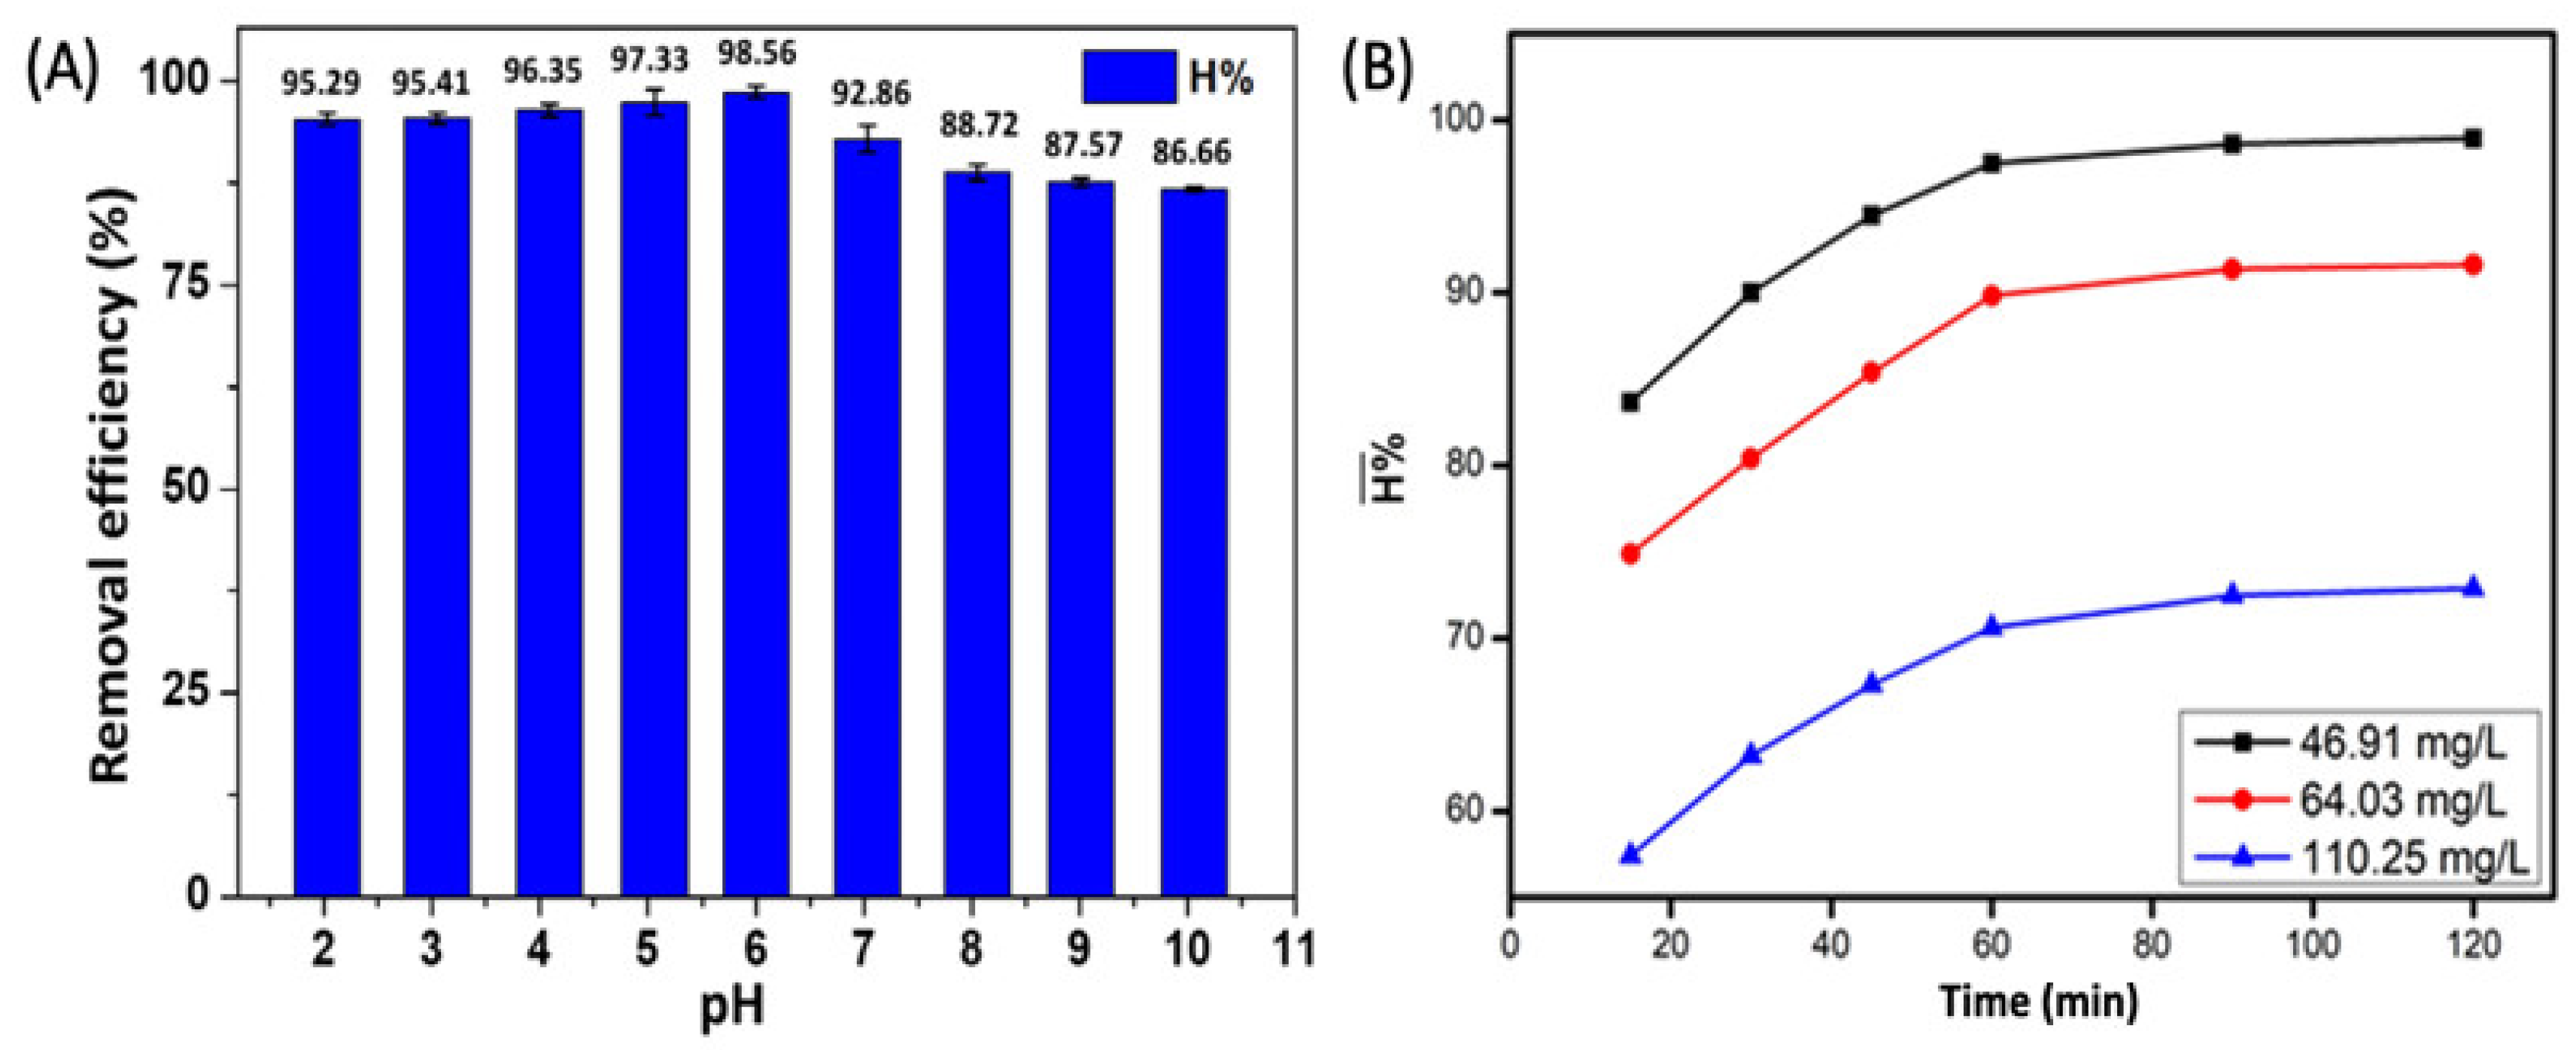
3.4.1. Effect of pH

Determining a certain pH range for a certain process to achieve the highest efficiency is indispensable. As CIP is an antibiotic, it exists in a cationic form (CIP+) due to the protonation of the amine group to below pH 5.9. When the pH is greater than 8.9, the CIP exists in an anionic form (CIP) because of the ionization of the carboxylic acid (Figure 9). In addition, the CIP can exist in a dipole form in the pH range of 5.9–8.9 (Figure 9). The dependence of the initial pH value on the CIP adsorption efficiency is shown in Figure 10A. Figure 10A also shows that the CIP adsorption efficiency of the ACMP materials gradually increased from the pH value of 2 to 6, and then gradually decreased from 6 to 10, with an especially rapid decline at the pH value of 7. This can be explained by the electrostatic interaction between the surface charge of the ACMP and the charge of the CIP. At a pH value of 6 (greater than the isoelectric point), the ACMP surface is negatively charged, and so there is strong cation adsorption (CIP+) on the negative surface of the ACMP. The rapid decline after pH 7 can be explained by the repulsive interaction between the negatively charged surface of the ACMP and the CIP. Gulen et al. [6] conducted a study on CIP adsorption in aqueous mediums using montmorillonite clay and found that this material exhibited its best CIP adsorption performance when the pH was equal to 7. Wang et al. [12] studied the adsorption of CIP in aqueous environments using activated carbon derived from bamboo, and they also noticed that the CIP adsorption efficiency could be prominently achieved at a pH value of 5.5. Thus, in this study, a pH of 6 was intentionally selected as the optimal adsorption condition for the CIP.

3.4.2. Effect of Reaction Time on Adsorption Equilibrium

As presented in Figure 10B, the graph lines show the dependence of the CIP adsorption efficiency on the reaction time at different CIP concentrations, and they both exhibited the same graph trend. Specifically, in the period from 15 to 120 min, the adsorption efficiency increased relatively quickly from 15 to 60 min, and it increased almost linearly. Then, it gradually stabilized in the period of 60 to 120 min because, initially, adsorption was fast due to the vacant adsorption sites on the adsorbent surface. After 120 min, adsorption slowed down due to the reduction in the number of available adsorption sites [9]. Therefore, adsorption equilibrium can be achieved in 60 min.

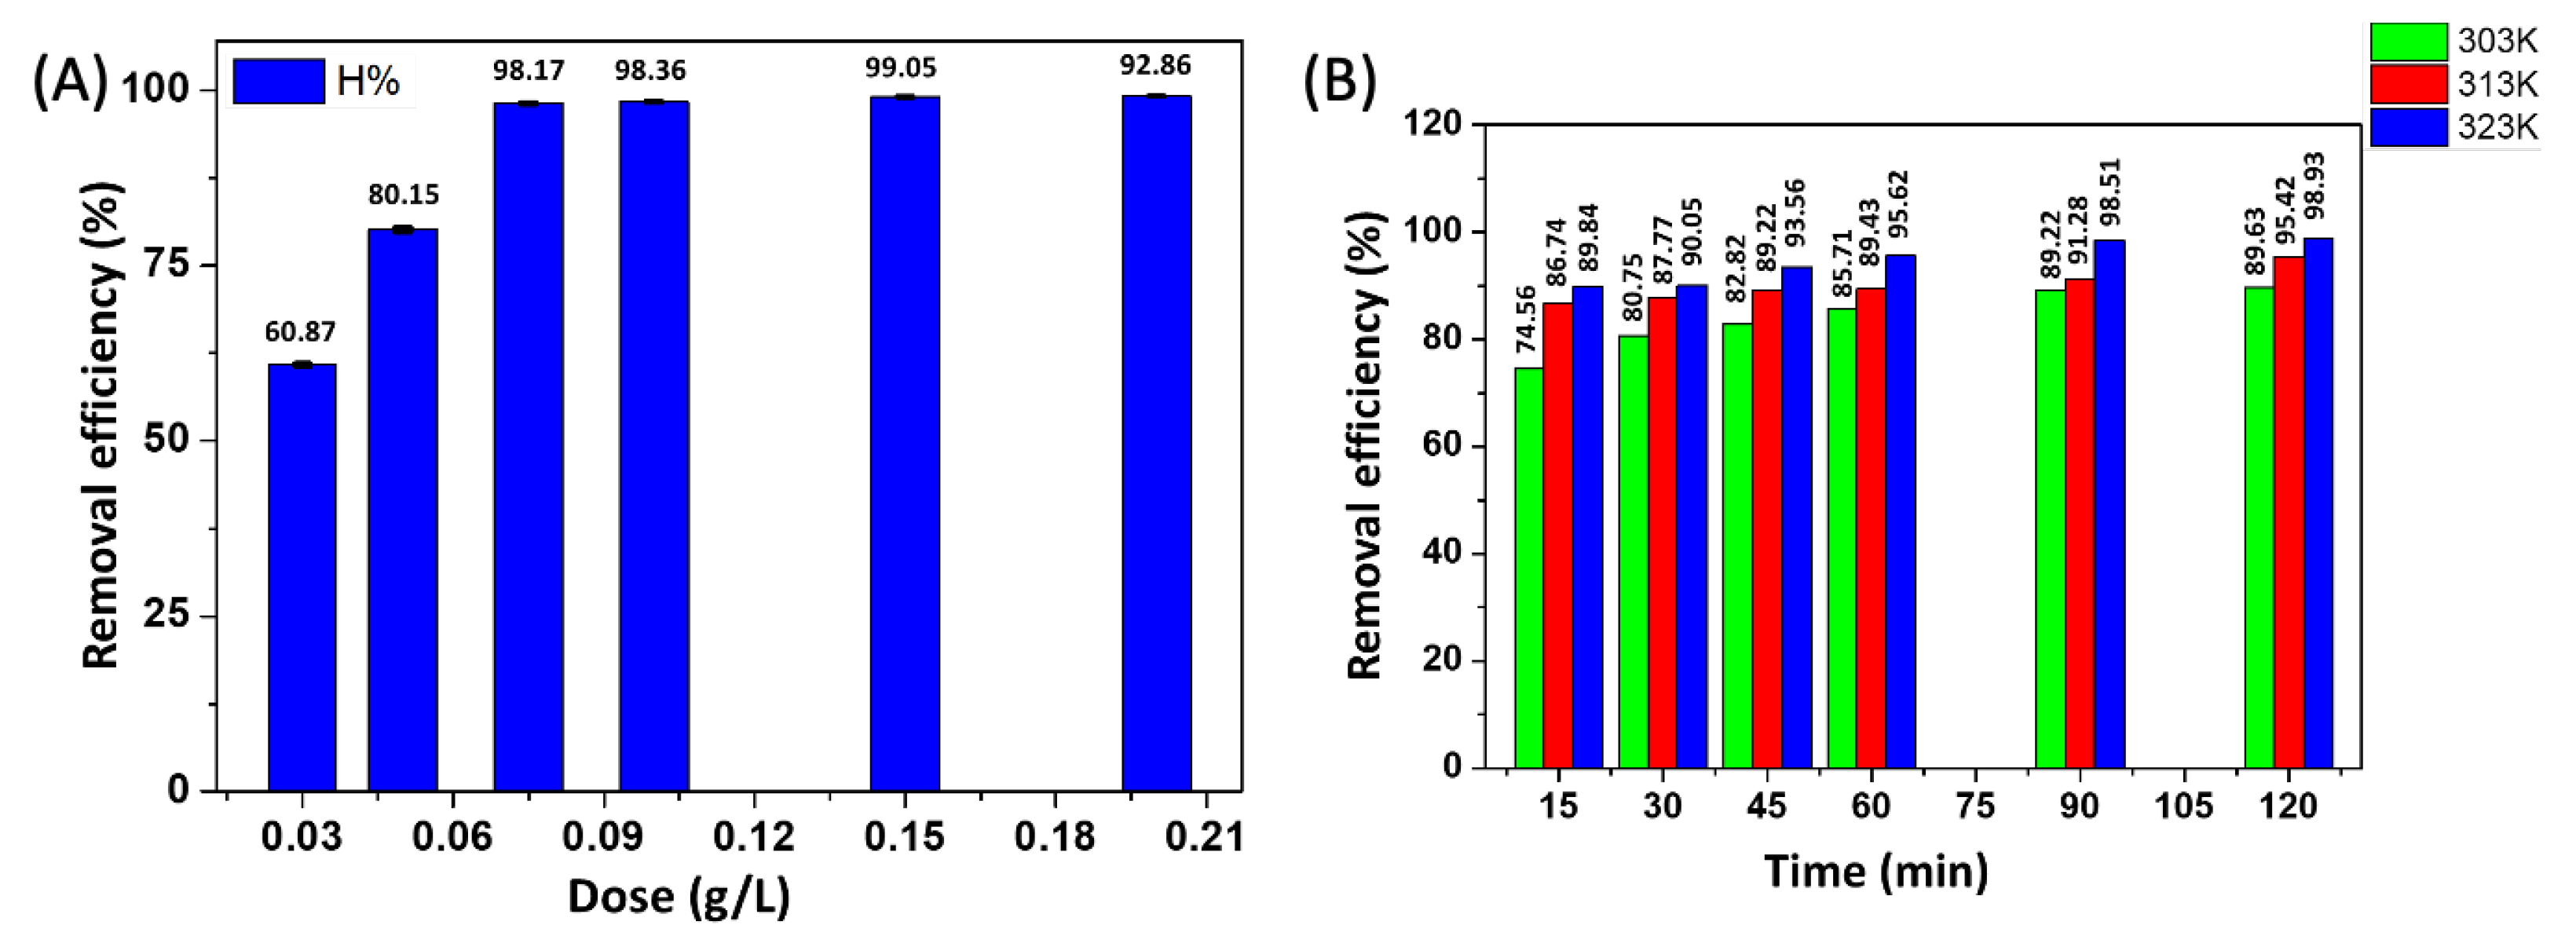
3.4.3. Effect of the ACMP Dosages on the CIP Adsorption Efficiency

It can be seen in Figure 11A that the CIP adsorption efficiency increases along with the increase in ACMP dosages, and this increase is linear in the range of the adsorbed ACMP dosages. This can be explained by the larger surface area and the increase in the number of adsorption sites. However, the adsorption capacity decreased because the adsorption capacity was inversely proportional to the adsorbent dosage. However, as the range of the ACMP dosage increased from 0.075–0.125 g, the adsorption efficiency merely increased (from 94.95–97.22%). This is possibly due to the larger surface area and that more surface functional groups were available at higher concentrations of the adsorbent [37,38]. The decrease in adsorption capacity can be explained with the reduction in effective surface area of the adsorbent [39]. Therefore, we choose the ACMP dosage of 0.075 g (or the adsorption dosage/solution volume of 3 g/L) for further investigations.

3.4.4. Effect of Temperatures

From Figure 11B, it can be seen that when the temperature increased, the adsorption efficiency and the adsorption capacity both increased. This can be explained as follows: the adsorption of CIP on the ACMP was endothermic, and when the temperature was increased, the adsorption equilibrium shifted in a forward direction, which reduced the concentration of the adsorbent in the solution and led to an increase in the efficiency and adsorption capacity of the adsorption process. When studying CIP adsorption on adsorbent and onto activated bio-sorbents, Igwegbea et al. [8] found that the CIP adsorption process was thermodynamically favorable and was endothermic.

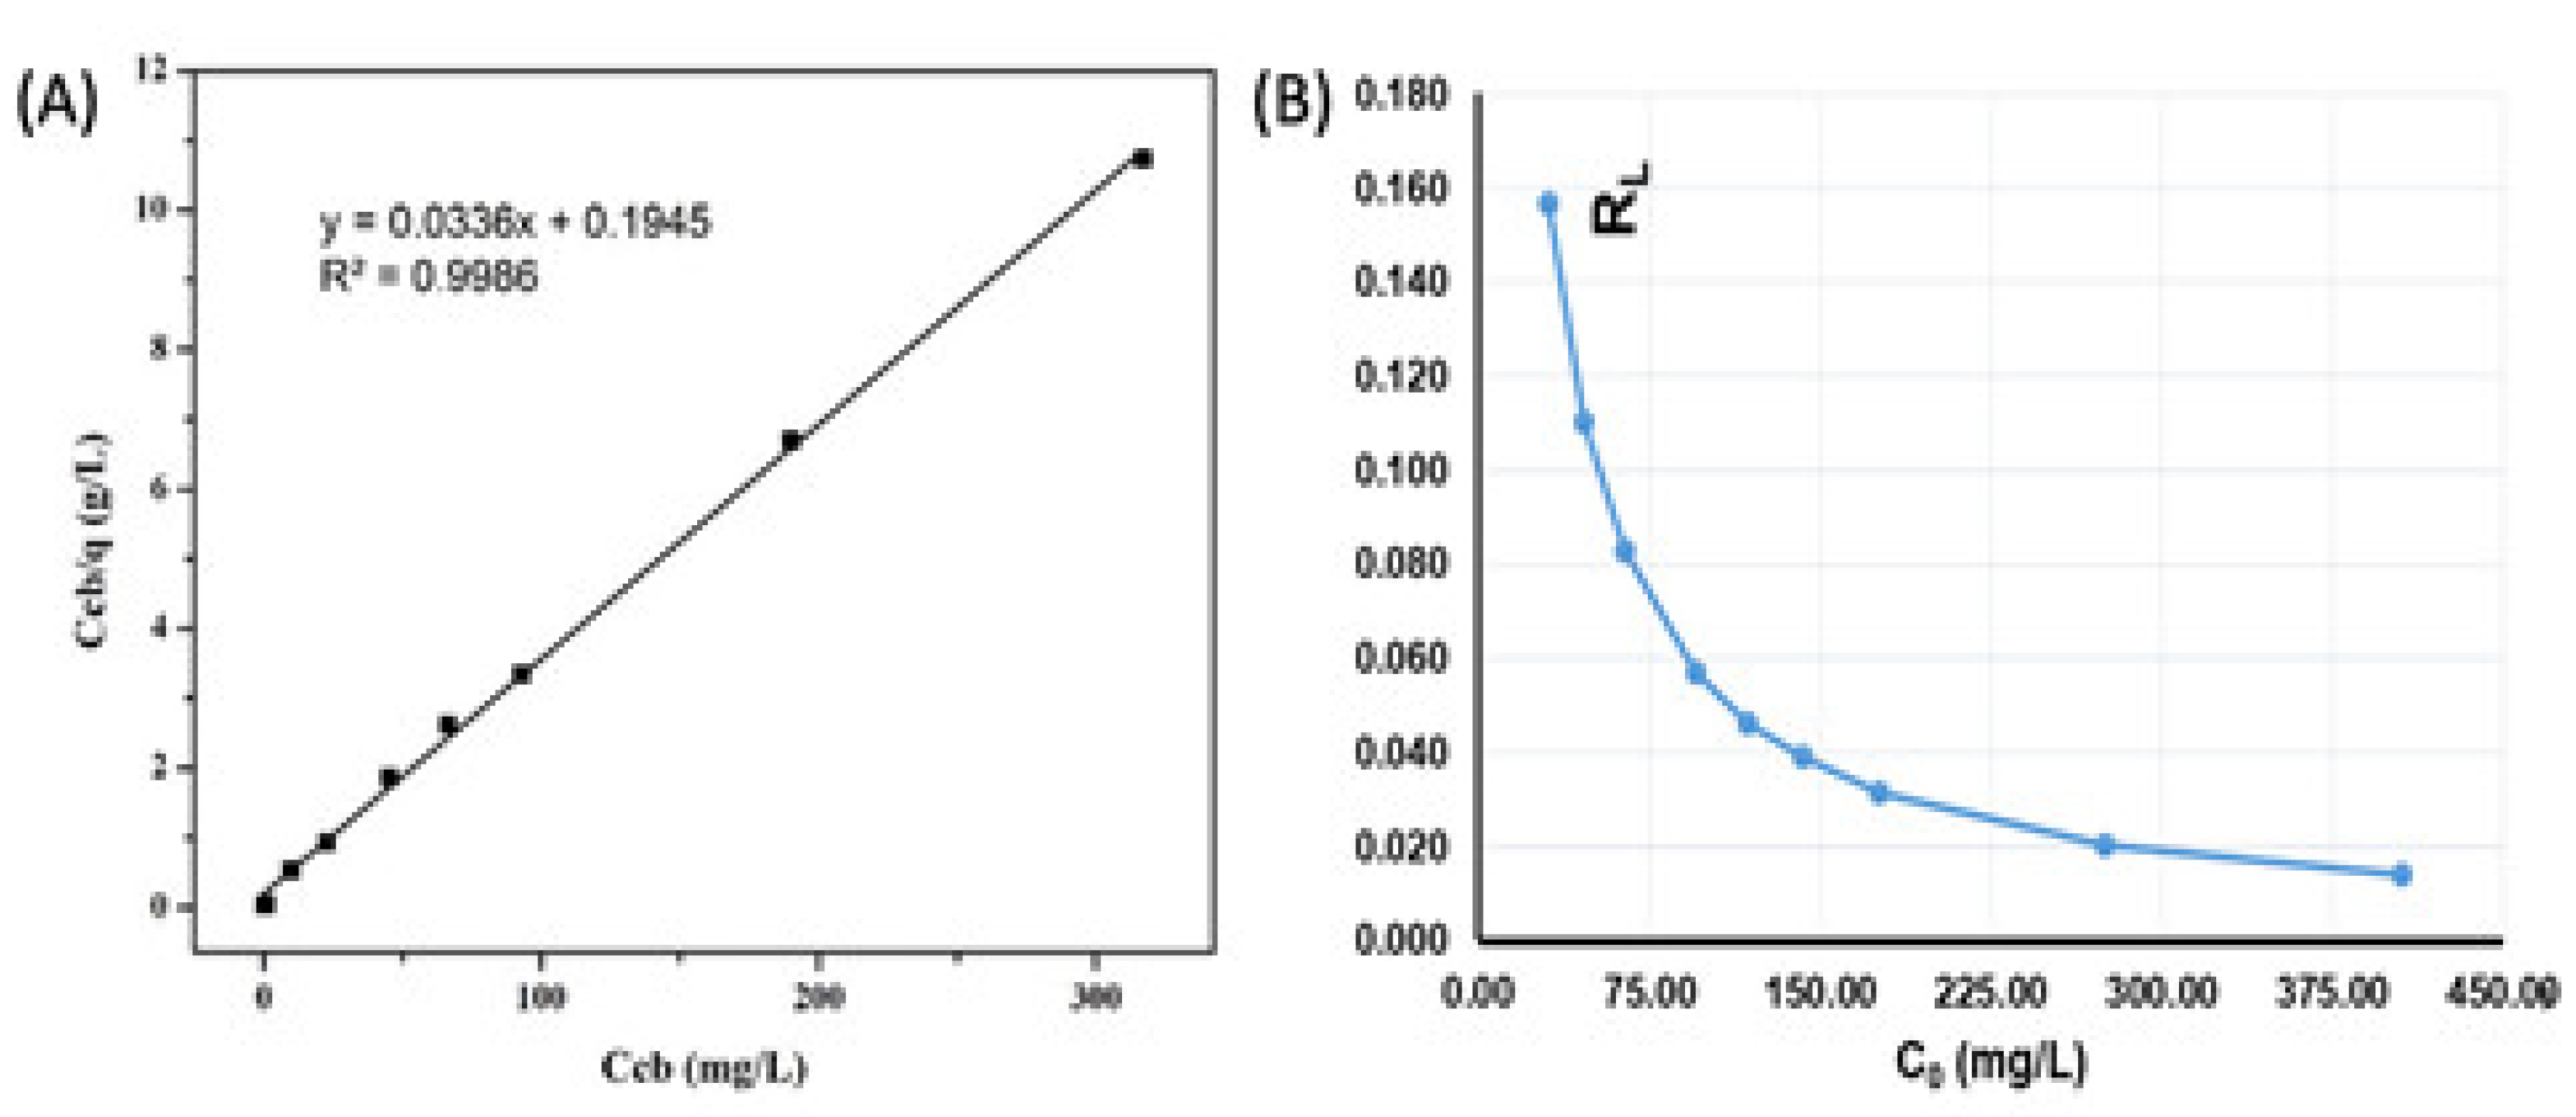
3.5. Isotherm Adsorption Model

3.5.1. Langmuir Isotherm Adsorption Model

To study isotherm adsorption models, experiments on the effect of the initial CIP concentration to the adsorption capacity of the ACMP were performed in the concentration range of 50 to 400 ppm (Table 1).
Langmuir adsorption, which was primarily designed to describe gas–solid phase adsorption, is also used to quantify and contrast the adsorptive capacity of various adsorbents. The Langmuir isotherm accounts for the surface coverage by balancing the relative rates of adsorption and desorption (dynamic equilibrium). Adsorption is proportional to the fraction of the surface of the adsorbent that is open, while desorption is proportional to the fraction of the adsorbent surface that is covered [39]. The Langmuir equation can be written in the following linear form:
C 0 q e = 1 q max b + C e q max
where qe and qmax are the equilibrium adsorption capacity and the maximum adsorption capacity (mg/g), respectively, and b is the Langmuir constant. A Langmuir equation is characterized by the parameter RL:RL = 1/(1 + b·C0). If 0 < RL < 1, then the adsorption is favorable, but if RL > 1, then the adsorption is not favorable. If RL = 1, then the adsorption is linear.
As seen in Figure 12A, the maximum adsorption capacity was determined as qmax = 29.76 mg/g, with a constant b = 0.173 (L/g). The CIP adsorption of the ACMP is well described according to the Langmuir isotherm adsorption model. This is expressed through the regression coefficient of the equation (R2 = 0.9886).
The results of comparing the CIP adsorption capacity on different adsorbent materials (Table 5) show that the maximum adsorption capacity (qmax) of the ACMP for the CIP is relatively high. From the calculated parameter RL value presented in the graph of Figure 12B, we can see that the values in the range of 0.154 to 0.014 are all less than 1, validating that the Langmuir isotherm adsorption model is appropriate with the CIP adsorption of the ACMP.

3.5.2. Freundlich Isotherm Adsorption Model

The Freundlich isotherm is applicable to adsorption processes that occur on heterogonous surfaces. This isotherm gives an expression which defines the surface heterogeneity and the exponential distribution of active sites and their energies.
The Freundlich isotherm adsorption equation has the form:
ln q e = ln K F + 1 n · ln C e
where KF is the Freundlich adsorption constant and n is a constant that is always greater than 1.
Figure 13A describes the CIP adsorption process on the ACMP according to the Freundlich isotherm model. The Freundlich adsorption constant was measured as KF = 13.57 (mg/g) (L/mg) 1/n, with a constant value of n = 6.73. The correlation coefficient is R2 = 0.9421. The large values of KF and n indicate the good adsorption capacity of the material, and they show that there is an adsorption bond between the adsorbent and the adsorbate.

3.5.3. Tempkin Isotherm Adsorption Model

The Temkin isotherm adsorption model is based on the assumption that the heat of adsorption is due to the adsorbent–adsorbent interaction (Temkin and Pyzhev, 1940), which has also been investigated. This isothermal adsorption model is applicable to chemisorption on a solid adsorbent and a liquid adsorbent. The Tempkin adsorption isotherm is represented by the following equation [39]:
qe = BlnKT + BlnCe
where B = RT/bT and KT is the Tempkin constant.
As seen in Figure 13B, the coefficient of determination R2 was calculated as 0.9653. Therefore, the CIP adsorption process of the ACMP is propitious with the Tempkin isotherm adsorption model.

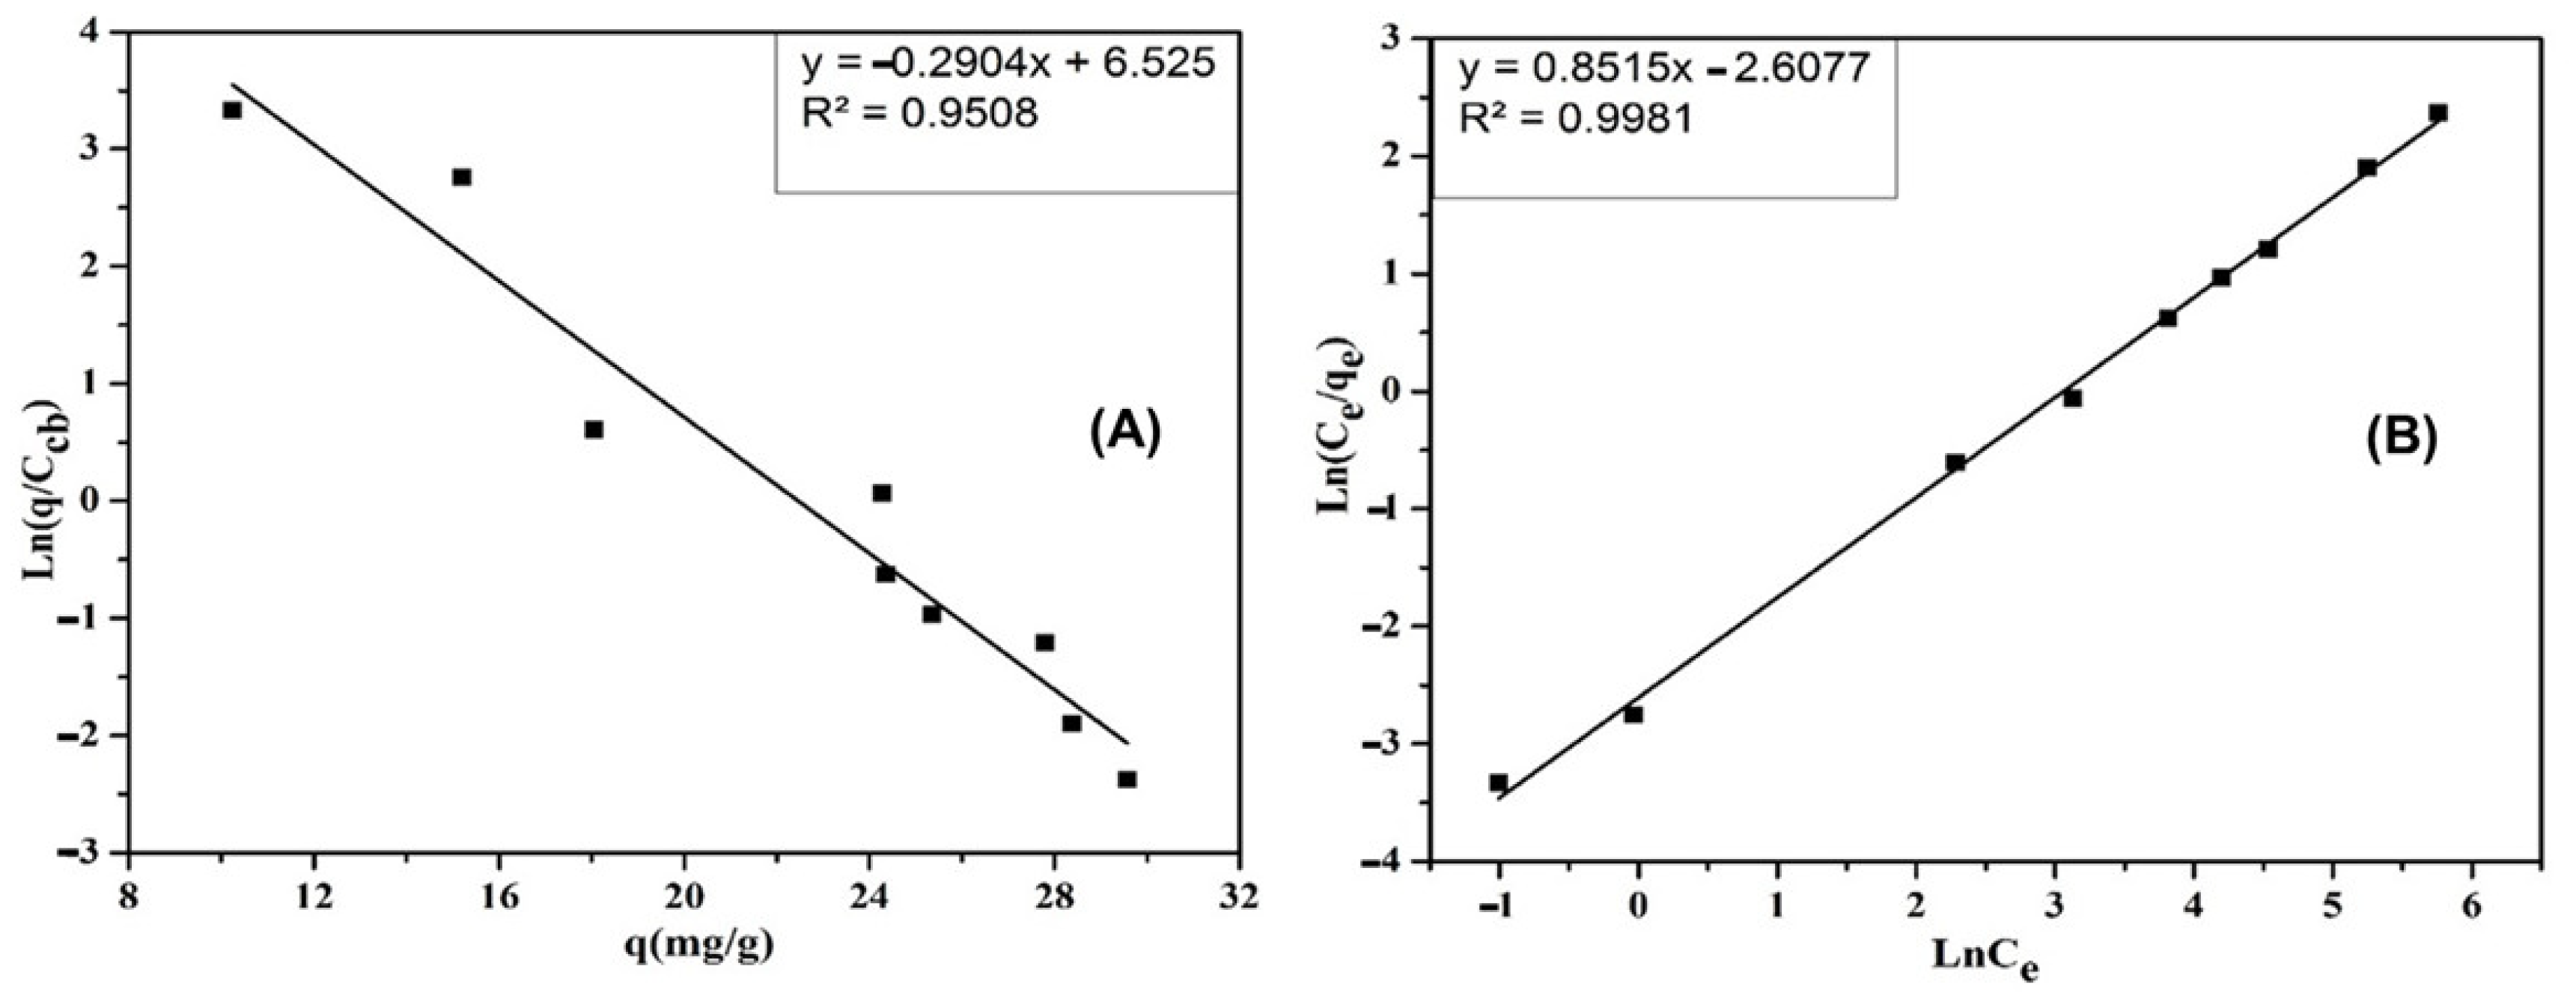
3.5.4. Elovich Isotherm Adsorption Model

The Elovich isotherm model is applied to the multilayer adsorption process. The Elovich adsorption isotherm model is expressed as [39]:
ln q e C e = lnK e q m q e
where Ke is the Elovich constant and qm is the Elovich maximum adsorption capacity.
The experimental results are presented in Figure 13A. As we can see in Figure 13A, there is a maximum adsorption capacity of qmax = 3.44 mg/g and Ke = 198.25.
As seen in Figure 14B, the coefficient of determination R2 of the Elovich isotherm adsorption model was determined to be 0.9508. Therefore, it is suitable for the CIP adsorption process of the ACMP.

3.5.5. Redlich–Peterson Isotherm Adsorption Model

The Redlich–Peterson isotherm model is a combination of the Langmuir and Freundlich isotherm models [38].
This isotherm model is an experimental isotherm model that integrates three parameters. It combines elements from both the Langmuir and Freundlich isotherm equations; therefore, the mechanism of adsorption is mixed and excludes monolayer adsorption [39].
The formula of this model is shown below:
q e = AC e 1 + BC e β
where A is the Redlich–Peterson isothermal constant (Lg−1), B is a constant (Lmg−1), β is the exponent between 0 and 1, Ce is the equilibrium concentration of the adsorbent (mg L−1), and qe is the equilibrium capacity of the adsorbent on the adsorbent (mg g−1).
The linear form of the Redlich–Peterson isotherm is shown as:
ln   C e q e =   β lnC e lnA
We plotted a graph with ln (Ce/qe) and with ln Ce to determine the β and A constants. The results are shown in Figure 13B. From the results in Figure 14B, the coefficient of determination R2 of the Redlich–Peterson isotherm adsorption model is 0.9981. Therefore, it is suitable for the CIP adsorption process of the ACMP.
The values of constants calculated from the Langmuir, Freundlich, Tempkin, Elovich, and Redlich–Peterson isotherm adsorption models for the ACMP materials are shown in Table 6.
As seen in the results shown in Table 6, the coefficients of determination R2 of the models—Freundlich, Elovich, Tempkin, and Redlich–Peterson—are 0.9986, 0.9421, 0.9653, 0.9508, and 0.9981, respectively.
The CIP adsorption on the ACMP follows the Langmuir > Redlich–Peterson > Elovich > Tempkin > Freundlich isotherm adsorption models. Therefore, it can be concluded that the CIP adsorption process of the ACMP is a monolayer and multilayer adsorption, on the conditions that the surface of the material is not uniform and that there is an interaction between the adsorbate and the adsorbent.

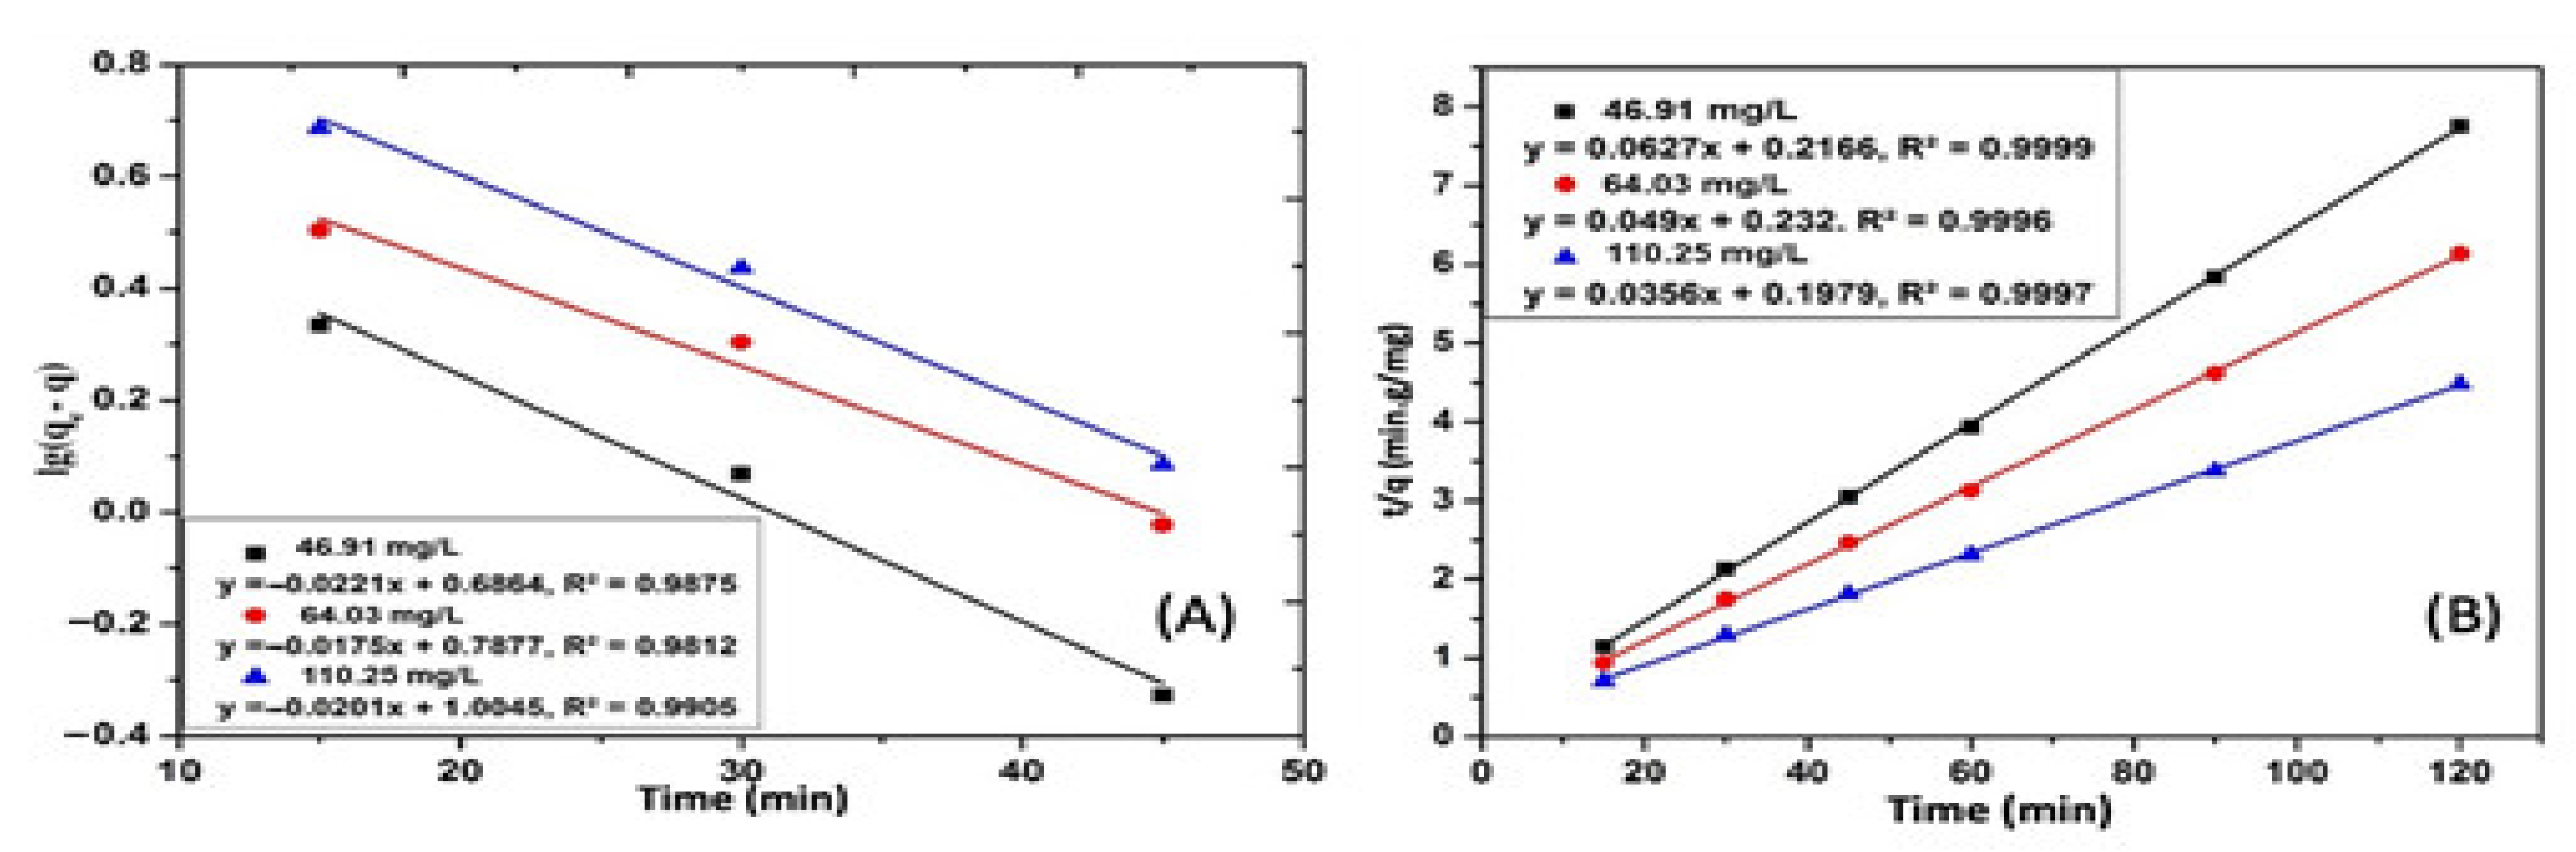
3.6. CIP Adsorption Kinetics of the ACMP

Lagergren’s apparent first-order adsorption kinetics equation has the form:
lg q e q t = lgq e k 1 2303 t
Lagergren’s apparent second-order adsorption kinetics equation has the form:
t q t = 1 k 2 q e 2 + 1 q e t
where qe and qt are the adsorption capacities at the time of reaching equilibrium and at time t (mg/g), respectively; and k1 and k2 are the apparent first-order (time−1) and second-order (g·mg−1. time−1) adsorption rate constants.
From the values of the parameters of the first-order kinematics equation in Table 7, the coefficient of determination R2 ranges from 0.9812 to 0.9905. However, the equilibrium adsorption capacity values calculated from the kinetics equations are different from the experimental values. Therefore, the first-order kinetics equation is not suitable for the CIP adsorption by the ACMP (Figure 15).
In addition to the R2 constant, the accuracy of the quadratic kinematics equation is also determined through the standard deviation % Δ q . The accuracy of the equation is determined by the standard deviation % Δ q   as the following equation:
% Δ q = 100 × ( q t , exp   q t , cal ) / q t , exp 2 n 1
where n is the number of data points, qt,exp is the experimental adsorption capacity at time t, and qt,cal is the adsorption capacity at time t according to the kinetic equation.
From the values in Table 8, the coefficients of determination (R2) are all 0.99. Further, the equilibrium adsorption capacity values calculated from the kinetics equations are very close to the experimental values, and the k2 values are also approximately the same. The calculation results of the %Δq value in the table are low. Therefore, it can be concluded that the CIP adsorption process of the ACMP follows Lagergren’s apparent quadratic kinetics equation. Therefore, the uptake of the CIP by the ACMP depends on the concentration of the CIP in the aqueous medium and the number of active sites on the adsorbent surface.
This result is similar to that of Chinenye Adaobi Igwegbea [8], who studied the adsorption of ciprofloxacin from water and found that most of the CIP adsorption on materials obeyed the apparent quadratic kinetic equation of Lagergren, and only a few studies were first-order kinetics or obeyed the Elovich kinetic and Avrami fractional equations.

3.7. Activation Energy

To determine the activation energy (E) according to adsorption kinetics, we must firstly determine the value of h using the formula:
h = 1   b
where b is the coefficient of the second-order kinetics equation and k is the rate constant of the second-order reaction. Then, the activation energy can be calculated using the following equation:
E = RT(lnh − lnk)
where R is the gas constant (R = 8.314 × 10⁻³ kJ/mol·K) and T is the reaction temperature in Kelvin (K).
The activation energy calculated from the CIP adsorption process of the ACMP is displayed in Table 9. It can be seen that E < 25 KJ/mol, and so the CIP adsorption of the ACMP is dominated by external diffusion. This result is similar to the result when conducting the adsorption of methylene blue using activated carbon made from moringa leaves [36].

3.8. CIP Adsorption Thermodynamics of the ACMP

The isometric potential variation (∆G0), enthalpy (∆H0), and entropy (∆S0) of the adsorption process were calculated using the following equations:
  K D = q e C cb
∆G0 = −RTlnKD
  lnK D   = Δ G 0 RT = Δ H 0 RT + Δ S 0 R
where KD is the equilibrium constant.
The results of thermodynamic calculation on the CIP adsorption process of the ACMP are presented in Table 10.
It can be seen in Table 10 that the free energy variation value (∆G0) was determined as −0.845 to −5.329 kJ/mol and the entropy variation (∆S0) was 0.223 kJ/mol, proving that the CIP adsorption of the ACMP was a spontaneous process. The enthalpy variation (∆H0) was measured as 66,957 kJ/mol, verifying that the adsorption process was endothermic.
During adsorption process, ΔH0 < 25 kJ·mol−1, and the van der Waals forces are majorly responsible for physical adsorption. If ΔH0 = 40–200 kJ·mol−1, the chemical bonding mainly leads to chemisorption [40]. The results of studying the CIP adsorption process of the ACMP follow the apparent second-order kinetics equation and the adsorption isotherm models of Tempkin, Elovich, and Redlich–Peterson, indicating that the adsorption of the CIP on the ACMP can be dominated by chemisorption, which is in agreement with the calculation results of ∆H0 = 66.957 of the CIP adsorption on the ACMP. The results of the thermodynamic calculation from the CIP adsorption process by the ACMP are similar to those reported by Zhe Zhang et al. [35], wherein the adsorption process of methylene blue in the environment on activated carbon materials made from mangosteen peel also exhibited an endothermic, spontaneous process which is governed by chemisorption. However, this is a different result from the results achieved by the authors when studying the CIP adsorption on biological activated carbon materials where they found that the adsorption process was a physical adsorption [7].

4. Conclusions

In this study, activated carbon derived from mangosteen peel (abbreviated as ACMP) was successfully fabricated via physical activation, followed by chemical activation with ZnCl2, with a mass ratio of MP:ZnCl2 as 2:1, an activation temperature of 500 °C, and an activation time of 180 min. This as-prepared ACMP possessed a graphite and porous structure, with a specific surface area of 419.8554 m2/g, an iodine index of 825 mg/g, and an isoelectric point equal to 5.34. A total of 98% CIP adsorption was achieved at the initial concentration of 50 ppm. In addition, the CIP adsorption process of the ACMP followed the Langmuir, Freundlich, Tempkin, Elovich, and Redlich–Peterson isotherm adsorption models, which determined that the maximum CIP adsorption capacity on the ACMP was qmax = 29.78 mg/g. The CIP adsorption process of the ACMP followed the apparent quadratic kinetics and spontaneous, endothermic, physical, and chemical adsorption. The adsorption rate was governed by membrane diffusion. Therefore, the ACMP activated with ZnCl2 could be a promising material for antibiotic treatment. It is an inexpensive and viable material for removing antibiotics from contaminated wastewater.

Author Contributions

Writing—original draft preparation, T.H.D. and Q.T.T.; data curation, Q.T.T. and X.L.H.; conceptualization, X.L.H. and H.P.N.; methodology, H.P.N. and A.T.N.; formal analysis, A.T.N. and T.C.Q.N.; writing—review and editing, T.H.D. and H.D.C. All authors have read and agreed to the published version of the manuscript.

Funding

This work was completed with the financial support of the University of Education, Thai Nguyen University, under the project TNUE-2022-07.

Institutional Review Board Statement

Not applicable.

Informed Consent Statement

Not applicable.

Data Availability Statement

All the data are available within the manuscript.

Conflicts of Interest

The authors declare no conflict of interest.

References

  1. Daughton, C.G.; Ternes, T.A. Pharmaceuticals and Personal Care Products in the Environment: Agents of Subtle Change? Environ. Health Perspect. 1999, 107, 32. [Google Scholar] [CrossRef] [PubMed]
  2. De Witte, B.; Dewulf, J.; Demeestere, K.; Van Langenhove, H. Ozonation and Advanced Oxidation by the Peroxone Process of Ciprofloxacin in Water. J. Hazard. Mater. 2009, 161, 701–708. [Google Scholar] [CrossRef]
  3. Ghosh, G.C.; Okuda, T.; Yamashita, N.; Tanaka, H. Occurrence and Elimination of Antibiotics at Four Sewage Treatment Plants in Japan and Their Effects on Bacterial Ammonia Oxidation. Water Sci. Technol. 2009, 59, 779–786. [Google Scholar] [CrossRef]
  4. Yilmaz, M.; Al-Musawi, T.J.; Saloot, M.k.; Khatibi, A.D.; Baniasadi, M.; Balarak, D. Synthesis of Activated Carbon from Lemna Minor Plant and Magnetized with Iron (III) Oxide Magnetic Nanoparticles and Its Application in Removal of Ciprofloxacin. Biomass Conv. Bioref. 2022. [Google Scholar] [CrossRef]
  5. Lin, C.-C.; Lee, C.-Y. Adsorption of Ciprofloxacin in Water Using Fe3O4 Nanoparticles Formed at Low Temperature and High Reactant Concentrations in a Rotating Packed Bed with Co-Precipitation. Mater. Chem. Phys. 2020, 240, 122049. [Google Scholar] [CrossRef]
  6. Gulen, B.; Demircivi, P. Adsorption Properties of Flouroquinolone Type Antibiotic Ciprofloxacin into 2:1 Dioctahedral Clay Structure: Box-Behnken Experimental Design. J. Mol. Struct. 2020, 1206, 127659. [Google Scholar] [CrossRef]
  7. Igwegbe, C.A.; Oba, S.N.; Aniagor, C.O.; Adeniyi, A.G.; Ighalo, J.O. Adsorption of Ciprofloxacin from Water: A Comprehensive Review. J. Ind. Eng. Chem. 2021, 93, 57–77. [Google Scholar] [CrossRef]
  8. Avcı, A.; İnci, İ.; Baylan, N. Adsorption of Ciprofloxacin Hydrochloride on Multiwall Carbon Nanotube. J. Mol. Struct. 2020, 1206, 127711. [Google Scholar] [CrossRef]
  9. Wang, M.; Li, G.; Huang, L.; Xue, J.; Liu, Q.; Bao, N.; Huang, J. Study of Ciprofloxacin Adsorption and Regeneration of Activated Carbon Prepared from Enteromorpha Prolifera Impregnated with H3PO4 and Sodium Benzenesulfonate. Ecotoxicol. Environ. Saf. 2017, 139, 36–42. [Google Scholar] [CrossRef] [PubMed]
  10. Li, R.; Wang, Z.; Guo, J.; Li, Y.; Zhang, H.; Zhu, J.; Xie, X. Enhanced Adsorption of Ciprofloxacin by KOH Modified Biochar Derived from Potato Stems and Leaves. Water Sci. Technol. 2018, 77, 1127–1136. [Google Scholar] [CrossRef] [Green Version]
  11. Liu, X.; Lu, S.; Liu, Y.; Meng, W.; Zheng, B. Adsorption of Sulfamethoxazole (SMZ) and Ciprofloxacin (CIP) by Humic Acid (HA): Characteristics and Mechanism. RSC Adv. 2017, 7, 50449–50458. [Google Scholar] [CrossRef]
  12. Wang, L.; Chen, G.; Ling, C.; Zhang, J.; Szerlag, K. Adsorption of Ciprofloxacin on to Bamboo Charcoal: Effects of PH, Salinity, Cations, and Phosphate. Environ. Prog. Sustain. Energy 2017, 36, 1108–1115. [Google Scholar] [CrossRef]
  13. Yin, D.; Xu, Z.; Shi, J.; Shen, L.; He, Z. Adsorption Characteristics of Ciprofloxacin on the Schorl: Kinetics, Thermodynamics, Effect of Metal Ion and Mechanisms. J. Water Reuse Desalination 2018, 8, 350–359. [Google Scholar] [CrossRef]
  14. Li, X.; Chen, S.; Fan, X.; Quan, X.; Tan, F.; Zhang, Y.; Gao, J. Adsorption of Ciprofloxacin, Bisphenol and 2-Chlorophenol on Electrospun Carbon Nanofibers: In Comparison with Powder Activated Carbon. J. Colloid Interface Sci. 2015, 447, 120–127. [Google Scholar] [CrossRef] [PubMed]
  15. Zhuang, Y.; Yu, F.; Ma, J.; Chen, J. Adsorption of Ciprofloxacin onto Graphene–Soy Protein Biocomposites. New J. Chem. 2015, 39, 3333–3336. [Google Scholar] [CrossRef]
  16. Carabineiro, S.A.C.; Thavorn-Amornsri, T.; Pereira, M.F.R.; Figueiredo, J.L. Adsorption of Ciprofloxacin on Surface-Modified Carbon Materials. Water Res. 2011, 45, 4583–4591. [Google Scholar] [CrossRef] [PubMed]
  17. González Labrada, K.; Alcorta Cuello, D.R.; Saborit Sánchez, I.; García Batle, M.; Manero, M.-H.; Barthe, L.; Jáuregui-Haza, U.J. Optimization of Ciprofloxacin Degradation in Wastewater by Homogeneous Sono-Fenton Process at High Frequency. J. Environ. Sci. Health Part A 2018, 53, 1139–1148. [Google Scholar] [CrossRef]
  18. Basaleh, A.S.; Shawky, A.; Zaki, Z.I. Visible Light-Driven Photodegradation of Ciprofloxacin over Sol-Gel Prepared Bi2O3-Modified La-Doped NaTaO3 Nanostructures. Ceram. Int. 2021, 47, 19205–19212. [Google Scholar] [CrossRef]
  19. Mukherjee, I.; Cilamkoti, V.; Dutta, R.K. Sunlight-Driven Photocatalytic Degradation of Ciprofloxacin by Carbon Dots Embedded in ZnO Nanostructures. ACS Appl. Nano Mater. 2021, 4, 7686–7697. [Google Scholar] [CrossRef]
  20. Das, S.; Ghosh, S.; Misra, A.; Tamhankar, A.; Mishra, A.; Lundborg, C.; Tripathy, S. Sunlight Assisted Photocatalytic Degradation of Ciprofloxacin in Water Using Fe Doped ZnO Nanoparticles for Potential Public Health Applications. Int. J. Environ. Res. Public Health 2018, 15, 2440. [Google Scholar] [CrossRef] [Green Version]
  21. Ulyankina, A.; Molodtsova, T.; Gorshenkov, M.; Leontyev, I.; Zhigunov, D.; Konstantinova, E.; Lastovina, T.; Tolasz, J.; Henych, J.; Licciardello, N.; et al. Photocatalytic degradation of ciprofloxacin in water at nano-ZnO prepared by pulse alternating current electrochemical synthesis. J. Water Process Eng. 2021, 40, 101809. [Google Scholar] [CrossRef]
  22. Do, T.H.; Ha, X.L.; Duong, T.T.A.; Nguyen, P.C.; Hoang, N.B.; Tran, T.K.N. Optimization, Kinetics, Thermodynamic and Arrhenius Model of the Removal of Ciprofloxacin by Internal Electrolysis with Fe-Cu and Fe-C Materials. Processes 2021, 9, 2110. [Google Scholar] [CrossRef]
  23. Jiang, J.-Q.; Zhou, Z.; Pahl, O. Preliminary Study of Ciprofloxacin (CIP29) Removal by Potassium Ferrate(VI). Sep. Purif. Technol. 2012, 88, 95–98. [Google Scholar] [CrossRef]
  24. Li, L.; Liu, J.; Zeng, J.; Li, J.; Liu, Y.; Sun, X.; Xu, L.; Li, L. Complete Degradation and Detoxification of Ciprofloxacin by a Micro-/Nanostructured Biogenic Mn Oxide Composite from a Highly Active Mn2+-Oxidizing Pseudomonas Strain. Nanomaterials 2021, 11, 1660. [Google Scholar] [CrossRef] [PubMed]
  25. Sayğılı, H.; Güzel, F.; Önal, Y. Conversion of Grape Industrial Processing Waste to Activated Carbon Sorbent and Its Performance in Cationic and Anionic Dyes Adsorption. J. Clean. Prod. 2015, 93, 84–93. [Google Scholar] [CrossRef]
  26. Iradukunda, Y.; Wang, G.; Li, X.; Shi, G.; Hu, Y.; Luo, F.; Yi, K.; Albashir, A.I.M.; Niu, X.; Wu, Z. High Performance of Activated Carbons Prepared from Mangosteen (Garcinia Mangostana) Peels Using the Hydrothermal Process. J. Energy Storage 2021, 39, 102577. [Google Scholar] [CrossRef]
  27. Kongsune, P.; Rattanapan, S.; Chanajaree, R. The Removal of Pb2+ from Aqueous Solution Using Mangosteen Peel Activated Carbon: Isotherm, Kinetic, Thermodynamic and Binding Energy Calculation. Groundw. Sustain. Dev. 2021, 12, 100524. [Google Scholar] [CrossRef]
  28. Ahmad, M.A.; Alrozi, R. Optimization of Preparation Conditions for Mangosteen Peel-Based Activated Carbons for the Removal of Remazol Brilliant Blue R Using Response Surface Methodology. Chem. Eng. J. 2010, 165, 883–890. [Google Scholar] [CrossRef]
  29. Chen, Y.; Huang, B.; Huang, M.; Cai, B. On the Preparation and Characterization of Activated Carbon from Mangosteen Shell. J. Taiwan Inst. Chem. Eng. 2011, 42, 837–842. [Google Scholar] [CrossRef]
  30. Foo, K.Y.; Hameed, B.H. Factors Affecting the Carbon Yield and Adsorption Capability of the Mangosteen Peel Activated Carbon Prepared by Microwave Assisted K2CO3 Activation. Chem. Eng. J. 2012, 180, 66–74. [Google Scholar] [CrossRef]
  31. Pangsupa, W.; Hunsom, M. Preparation of Mangosteen Shell-Derived Activated Carbon Via KOH Activation for Adsorptive Refining of Crude Biodiesel. J. Am. Oil Chem. Soc. 2016, 93, 1697–1708. [Google Scholar] [CrossRef]
  32. Nasrullah, A.; Saad, B.; Bhat, A.H.; Khan, A.S.; Danish, M.; Isa, M.H.; Naeem, A. Mangosteen Peel Waste as a Sustainable Precursor for High Surface Area Mesoporous Activated Carbon: Characterization and Application for Methylene Blue Removal. J. Clean. Prod. 2019, 211, 1190–1200. [Google Scholar] [CrossRef]
  33. Xue, M.; Chen, C.; Tan, Y.; Ren, Z.; Li, B.; Zhang, C. Mangosteen Peel-Derived Porous Carbon: Synthesis and Its Application in the Sulfur Cathode for Lithium Sulfur Battery. J. Mater. Sci. 2018, 53, 11062–11077. [Google Scholar] [CrossRef]
  34. Giraldo, L.; Moreno-Piraján, J.C. CO2 Adsorption on Activated Carbon Prepared from Mangosteen Peel: Study by Adsorption Calorimetry. J. Therm. Anal. Calorim. 2018, 133, 337–354. [Google Scholar] [CrossRef]
  35. Zhang, Z.; Xu, L.; Liu, Y.; Feng, R.; Zou, T.; Zhang, Y.; Kang, Y.; Zhou, P. Efficient Removal of Methylene Blue Using the Mesoporous Activated Carbon Obtained from Mangosteen Peel Wastes: Kinetic, Equilibrium, and Thermodynamic Studies. Microporous Mesoporous Mater. 2021, 315, 110904. [Google Scholar] [CrossRef]
  36. Do, T.H.; Nguyen, V.T.; Dung, N.Q.; Chu, M.N.; Van Kiet, D.; Ngan, T.T.K.; Van Tan, L. Study on Methylene Blue Adsorption of Activated Carbon Made from Moringa Oleifera Leaf. Mater. Today Proc. 2021, 38, 3405–3413. [Google Scholar] [CrossRef]
  37. Kam, S.-K.; Lee, M.-G. Response Surface Modeling for the Adsorption of Dye Eosin Y by Activated Carbon Prepared from Waste Citrus Peel. Appl. Chem. Eng. 2018, 29, 270–277. [Google Scholar] [CrossRef]
  38. Balarak, D.; Bazrafshan, E.; Mahdavi, Y.; Lalhmunsiama, L.; Lee, S.-M. Kinetic, Isotherms and Thermodynamic Studies in the Removal of 2-Chlorophenol from Aqueous Solution Using Modified Rice Straw. DWT 2017, 63, 203–211. [Google Scholar] [CrossRef]
  39. Ayawei, N.; Ebelegi, A.N.; Wankasi, D. Modelling and Interpretation of Adsorption Isotherms. J. Chem. 2017, 2017, 3039817. [Google Scholar] [CrossRef]
  40. Abramian, L.; El-Rassy, H. Adsorption Kinetics and Thermodynamics of Azo-Dye Orange II onto Highly Porous Titania Aerogel. Chem. Eng. J. 2009, 150, 403–410. [Google Scholar] [CrossRef]
Figure 1. Structural formula of CIP.
Applsci 12 08770 g001
Figure 2. SEM image of the MP (A) and ACMP (B).
Applsci 12 08770 g002
Figure 3. EDX spectrum of the MP.
Applsci 12 08770 g003
Figure 4. EDX spectrum of the ACMP.
Applsci 12 08770 g004
Figure 5. FT-IR analysis of the ACMP.
Applsci 12 08770 g005
Figure 6. N2 adsorption–desorption isotherms of the ACMP.
Applsci 12 08770 g006
Figure 7. XRD pattern of the ACMP.
Applsci 12 08770 g007
Figure 8. Graph of determining the isoelectric point of the ACMP.
Applsci 12 08770 g008
Figure 9. Existence forms of the CIP in solution [8].
Applsci 12 08770 g009
Figure 10. The effect of pH on the CIP adsorption of the ACMP (A) and of the reaction time on the CIP adsorption efficiency (B).
Applsci 12 08770 g010
Figure 11. Effect of the adsorbent dosages (A) and temperatures (B) on the CIP adsorption efficiency.
Applsci 12 08770 g011
Figure 12. The dependence of Ccb/q on Ccb to the CIP adsorption parameter value RL (A) versus C0 (B).
Applsci 12 08770 g012
Figure 13. The dependence of Ln q ¯ on Ln C cb ¯ to the CIP adsorption based on the Freundlich isotherm (A) adsorption model, and of Ln q ¯ on ℇ2 based on the Tempkin isotherm (B) adsorption model.
Applsci 12 08770 g013
Figure 14. The dependence of ln ( q ¯ / C c b ¯ ) on q ¯ , based on the Elovich isotherm (A), and of ln (Ce/qe) on ln Ce, based on the Redlich–Peterson isotherm (B) adsorption model.
Applsci 12 08770 g014
Figure 15. Graph of the first-order kinetics (A) and second-order kinetics (B) for the CIP.
Applsci 12 08770 g015
Table 1. Parameters of the experiments.
Experiment/ParameterspHTime (min)Material Mass (g)CIP Initial Concentration (mg/L)Temperature (K)
Effect of pH3 to 10600.07550298
Effect of time615–1200.07550298
Effect of mass of initial materials6600.03–0.250298
Effect of CIP initial concentration6600.07550–400298
Effect of temperature6600.075100303, 313, and 323
Table 2. EDX analysis of the MP.
Element% Weight% Atomic
C68.8176.86
O24.7320.74
Mg0.700.39
P0.380.16
Cl0.130.05
K4.761.63
Ca0.500.17
Total100.00100.00
Table 3. EDX analysis of the ACMP.
Element% Weight% Atomic
C81.5786.74
O15.3112.22
P0.200.08
Cl0.220.08
K2.700.88
Total100.00100.00
Table 4. Results of the physical parameters and iodine index of the ACMP.
Ash content (%)55.56 ± 1
Moisture content (%)4.54 ± 0.03
Density (g/cm3)0.85 ± 0.05
Iodine index825 ± 0.05
Table 5. The maximum CIP adsorption capacity (qmax) of the ACMP and other adsorbent materials.
No.AdsorbentsAdsorption Capacity (mg/g)Reference
1Activated carbon from Lemna minor plant25.00[4]
2Nano Fe3O424.00[5]
3Montmorillonite clay128.00[6]
4Potato stems and leaves23.36[10]
5Humic acid13.64[11]
6Bamboo charcoal36.02[12]
7Porous graphene–soy protein160.00[15]
8ACMP29.76This work
Table 6. Values of the constants calculated from the Langmuir, Freundlich, Tempkin, Elovich, and Redlich–Peterson isotherm adsorption models for the ACMP materials.
Isotherm ModelsParameters
Langmuirb (L/mg)0.173
qmax (mg/g)29.76
R20.9986
FreundlichKF (mg/g)·(mg/L)1/n13.57
N6.73
R20.9421
TempkinKT138.49
bT (kJ·mol)0.88
R20.9653
Elovichqmax (mg/g)3.44
Ke198.25
R20.9508
Redlich–Petersonβ0.8515
A (mg·L−1)13.57
R20.9982
Table 7. Values of the parameters from the first-order adsorption kinetics equation.
CIP Concentration
(mg/L)
qt,exp Experiment
(mg/g)
qt,cal Calculation
(mg/g)
Constant k1
(min−1)
R2
46.9115.244.860.05090.9875
64.0319.176.130.04030.9812
110.2525.9610.100.04630.9905
Table 8. Values of the parameters from the second-order adsorption kinetics equation.
CIP Concentration (mg/L)qt,exp Experiment (mg/g)qt,cal Calculation (mg/g)Constant k2 (min−1 L·mg−1)R2%∆q
46.9115.2415.950.01220.99991.04
64.0319.1720.410.01030.99963.02
110.2525.9628.090.00940.99973.73
Table 9. Activation energy parameters.
Concentration CIP (mg/L)Second-Order Kinetics EquationConstant k2 (g/mg min)hE (kJ/moL)
46.91t/qt = 0.0627·t + 0.21660.01824.6213.72
64.03t/qt = 0.049·t + 0.2320.01034.3114.96
110.25t/qt = 0.0356·t + 0.19790.00645.0516.53
Table 10. Thermodynamic parameters for the CIP adsorption.
T(K)∆G0 (kJ/mol)∆H0 (kJ/mol)∆S0(kJ/mol·K)
303−0.84566.9570.223
313−2.696
323−5.329
Publisher’s Note: MDPI stays neutral with regard to jurisdictional claims in published maps and institutional affiliations.

