
Baby Food Jars as a Dietary Source of Essential (K, Na, Ca, Mg, Fe, Zn, Cu, Co, Mo, Mn) and Toxic Elements (Al, Cd, Pb, B, Ba, V, Sr, Li, Ni)


 ,
,  , ,
, ,  ,
, 

Abstract
1. Introduction
2. Material and Methods
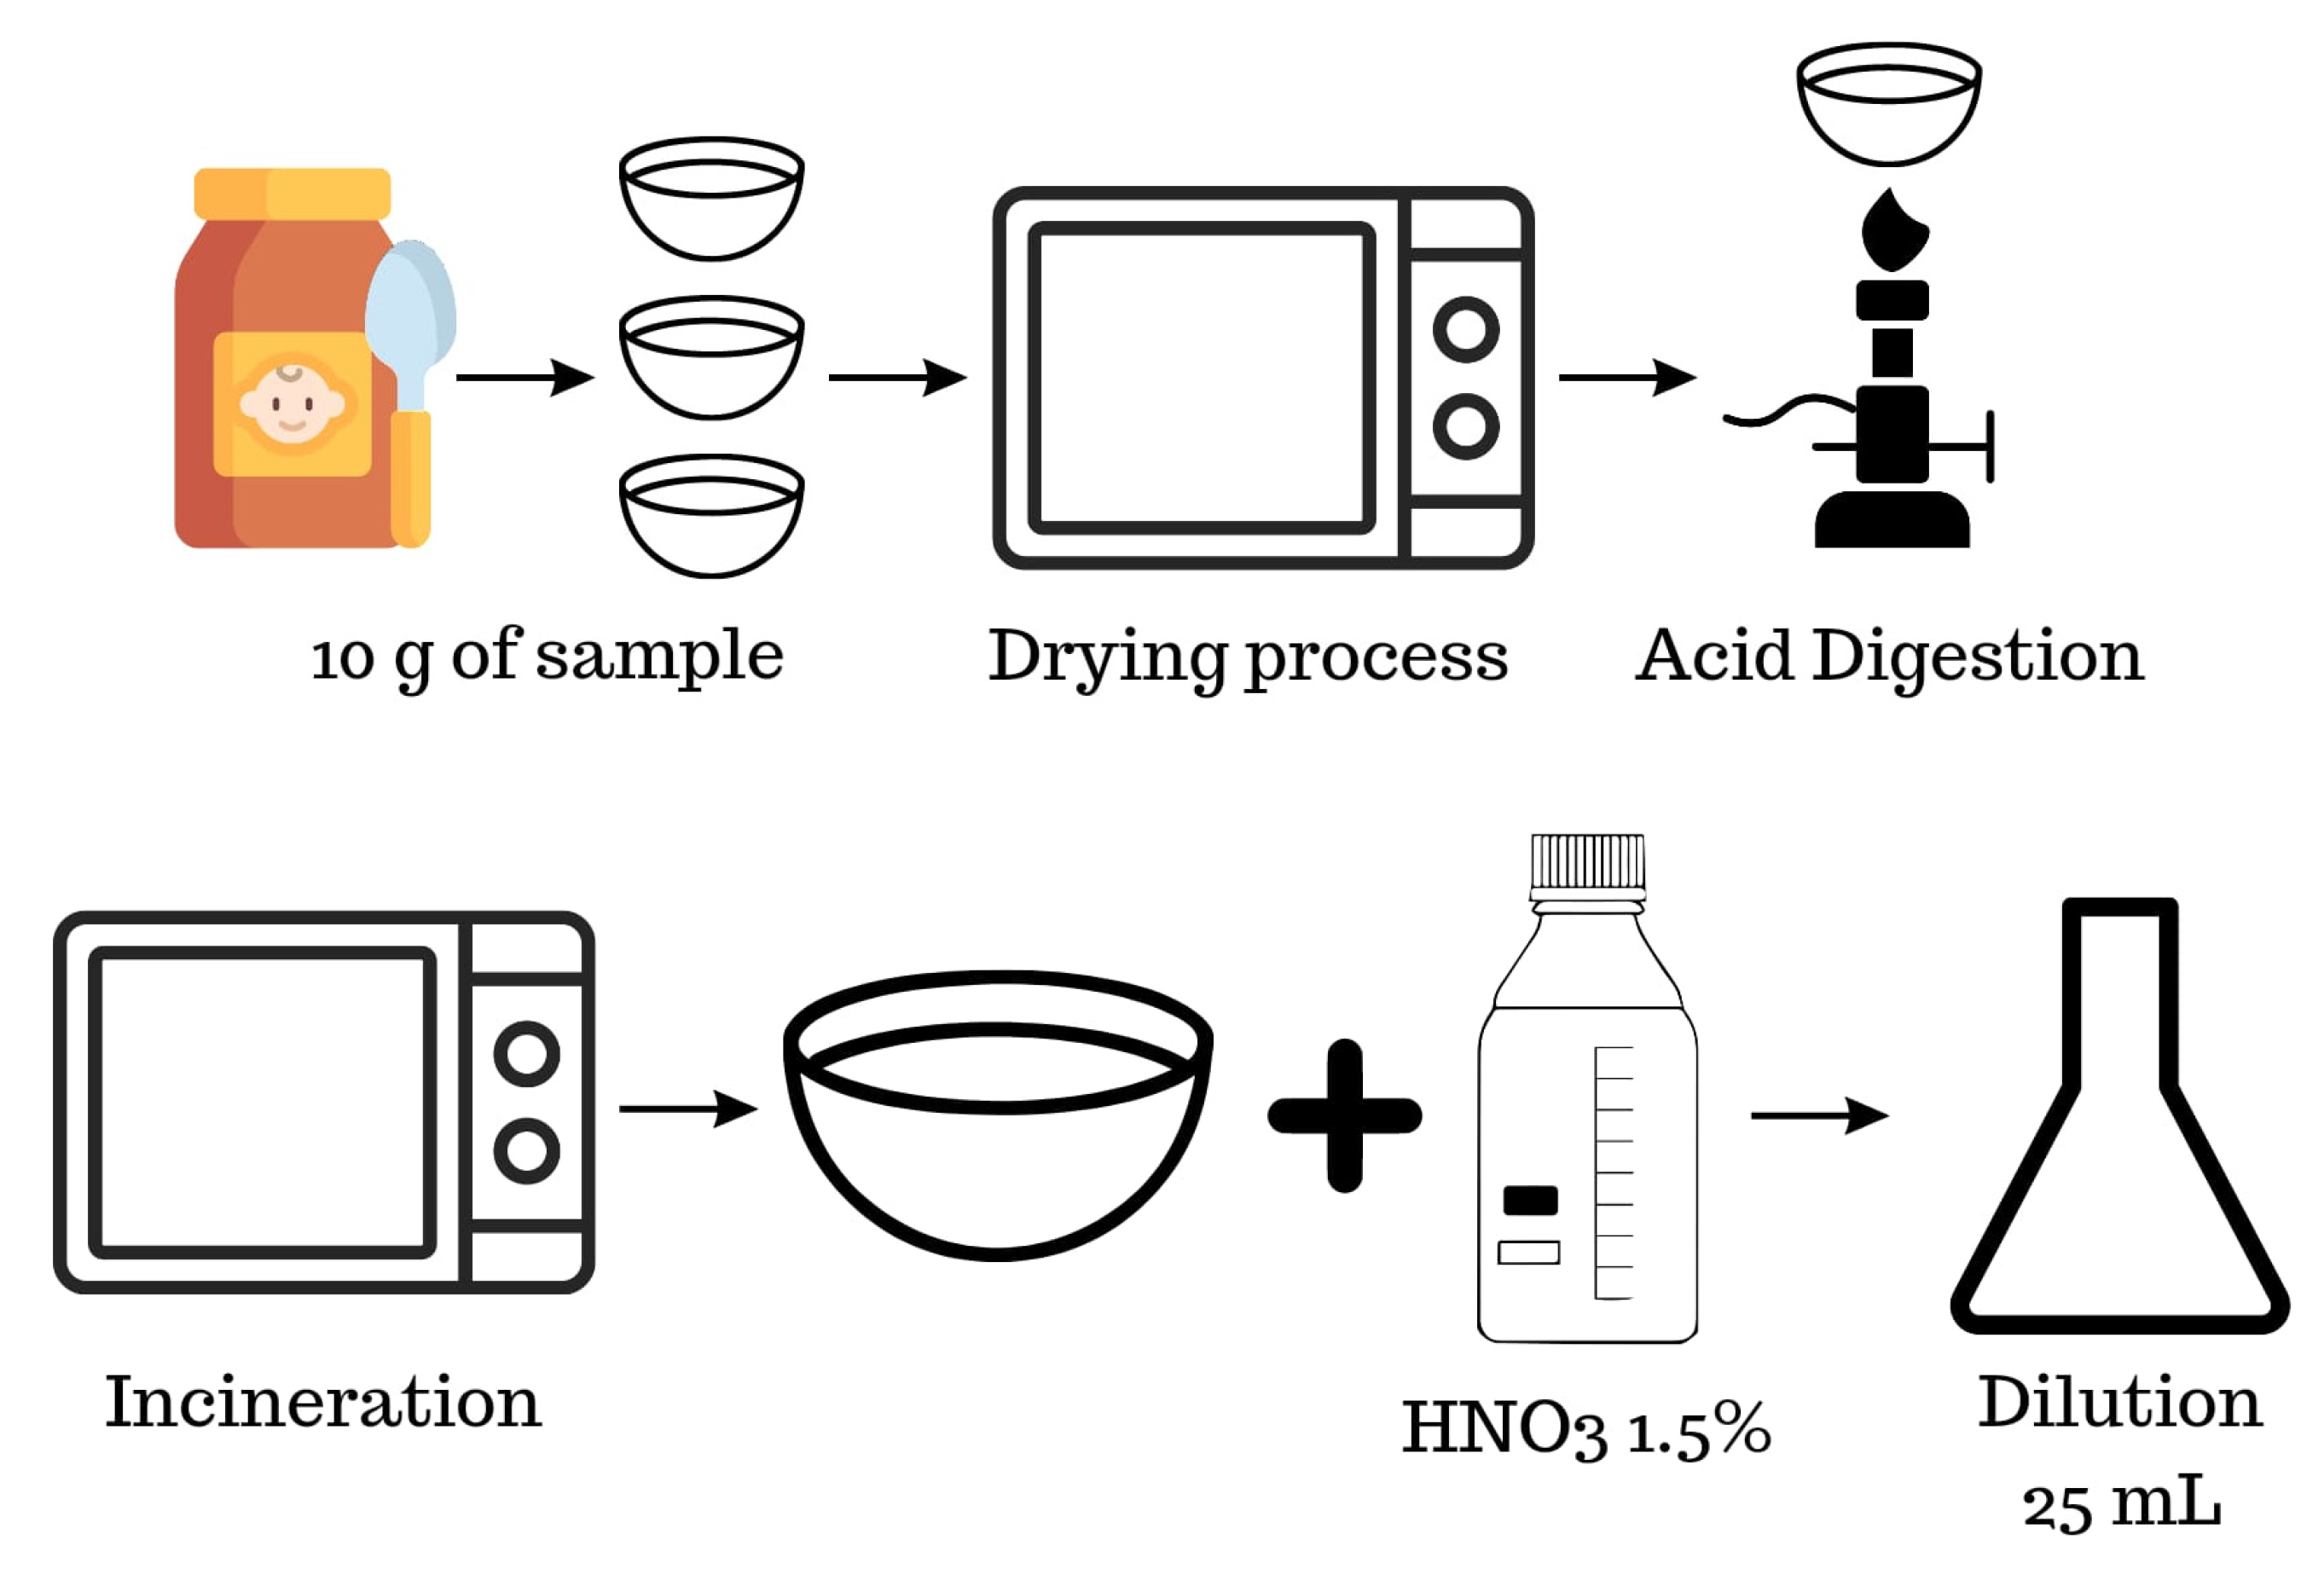
2.1. Samples and Treatment
2.2. Analytical Method and Quality Control
- The sensitivity of the calibration line: this was carried out with the response of the lowest standard of the calibration lines for each of the metals, setting as an acceptance criterion a response 3 times higher than the response of the blank (1.5% HNO3 solution).
- The linearity of the calibration line: this was established by applying the relative calibration errors, setting as acceptance criteria a maximum of 15% of this error for all metals in the lowest standards of each line and 10% in the rest of the points of the calibration lines.
- The repeatability precision of the method: it was established with samples analyzed in duplicate, setting as acceptance criterion the following formula: r = 2√2·Sr, where Sr is the repeatability standard deviation.
2.3. Statistical Analysis
2.4. Dietary Intake Calculations
3. Results and Discussion
3.1. Essential and Toxic Elements Concentrations in Baby Food in Jars
3.2. Comparison with Other Authors
3.3. Dietary Exposure Assessment
4. Consumption Recommendations
5. Conclusions
Author Contributions
Funding
Institutional Review Board Statement
Informed Consent Statement
Data Availability Statement
Conflicts of Interest
References
- García-López, R. Composición e inmunología de la leche humana. Acta Pediátrica Méx. 2011, 32, 223–230. Available online: https://www.redalyc.org/articulo.oa?id=423640330006 (accessed on 6 June 2022).
- WHO. Infant and Young Child Nutrition; World Health Organization: Geneva, Switzerland, 2002.
- Beaton, G.H. Nutritional needs during the first year of life. Some concepts and perspectives. Pediatr. Clin. N. Am. 1985, 32, 275–288. [Google Scholar] [CrossRef]
- Aguado-Ballabriga, Á.; Carrascosa, A. Nutrición en La Infancia y Adolescencia; Ergón Creación, S.A.: Majadahonda, Spain, 1998. [Google Scholar]
- Gil Hernández, Á. Tratado de Nutrición; Acción Médica: Madrid, Spain, 2005. [Google Scholar]
- Sánchez, C.; Johnston, S.; Sanchez, S.; Barriga, C.; Cubero, J.; Rivero, M.; Rodríguez, A. Valoración Nutricional en Lactantes de Entre 8 a 12 Meses de Vida. Enfermería Glob. 2010, 9, 1–7. Available online: https://www.redalyc.org/articulo.oa?id=365834754003 (accessed on 6 June 2022). [CrossRef]
- Kiani, A.; Arabameri, M.; Moazzen, M.; Shariatifar, N.; Aeenehvand, S.; Khaniki, G.J.; Abdel-Wahhab, M.; Shahsavari, S. Probabilistic Health Risk Assessment of Trace Elements in Baby Food and Milk Powder Using ICP-OES Method. Biol. Trace Elem. Res. 2022, 200, 2486–2497. [Google Scholar] [CrossRef] [PubMed]
- Chekri, R.; Le Calvez, E.; Zinck, J.; Leblanc, J.; Sirot, V.; Hulin, M.; Noël, L.; Guérin, T. Trace element contents in foods from the first French total diet study on infants and toddlers. J. Food Compos. Anal. 2019, 78, 108–120. Available online: https://www.sciencedirect.com/science/article/pii/S0889157518301868 (accessed on 9 June 2022). [CrossRef]
- Blanco, A. Química Biológica; El Ateneo: Madrid, Spain, 2006. [Google Scholar]
- Davis, N.W.; Standen, N.B.; Stanfield, P.R. ATP-dependent potassium channels of muscle cells: Their properties, regulation, and possible functions. J. Bioenerg. Biomembr. 1991, 23, 509–535, 101007/BF00785809. [Google Scholar] [CrossRef] [PubMed]
- Yan, Y.; Shapiro, J.I. The physiological and clinical importance of sodium potassium ATPase in cardiovascular diseases. Curr. Opin. Pharmacol. 2016, 27, 43–49. [Google Scholar] [CrossRef]
- Carafoli, E. Intracellular calcium homeostasis. Annu. Rev. Biochem. 1987, 56, 395–433. [Google Scholar] [CrossRef] [PubMed]
- Weaver, C.M.; Heaney, R.P.; Raisz, L.G. Calcium in Human Health; Humana Press: Totowa, NJ, USA, 2006. [Google Scholar]
- Institute of Medicine (US) Panel on Micronutrients. Dietary Reference Intakes for Vitamin A, Vitamin K, Arsenic, Boron, Chromium, Copper, Iodine, Iron, Manganese, Molybdenum, Nickel, Silicon, Vanadium, and Zinc; National Academies Press (US): Cambridge, MA, USA, 2001. [Google Scholar]
- EFSA Panel on Dietetic Products, Nutrition and Allergies, (NDA). Scientific Opinion on the substantiation of health claims related to magnesium and electrolyte balance (ID 238), energy-yielding metabolism (ID 240, 247, 248), neurotransmission and muscle contraction including heart muscle (ID 241, 242), cell division (ID 365), maintenance of bone (ID 239), maintenance of teeth (ID 239), blood coagulation (ID 357) and protein synthesis (ID 364) pursuant to Article 13(1) of Regulation (EC) No 1924/2006. EFSA J. 2009, 7, 1216. [Google Scholar] [CrossRef]
- Gurzau, E.S.; Neagu, C.; Gurzau, A.E. Essential metals—Case study on iron. Ecotoxicol. Environ. Saf. 2003, 56, 190–200. [Google Scholar] [CrossRef]
- Papanikolaou, G.; Pantopoulos, K. Iron metabolism and toxicity. Toxicol. Appl. Pharmacol. 2005, 202, 199–211. [Google Scholar] [CrossRef]
- Moll, R.; Davis, B. Iron, vitamin B12 and folate. Medicine 2017, 45, 198–203. Available online: https://www.sciencedirect.com/science/article/pii/S135730391730021X (accessed on 9 June 2022). [CrossRef]
- Tapiero, H.; Tew, K.D. Trace elements in human physiology and pathology: Zinc and metallothioneins. Biomed. Pharmacother. 2003, 57, 399–411. [Google Scholar] [CrossRef]
- EFSA Panel on Dietetic Products, Nutrition and Allergies, (NDA). Scientific Opinion on Dietary Reference Values for zinc. EFSA J. 2014, 12, 3844. [Google Scholar] [CrossRef]
- Krężel, A.; Maret, W. The biological inorganic chemistry of zinc ions. Arch. Biochem. Biophys. 2016, 611, 3–19. Available online: https://www.sciencedirect.com/science/article/pii/S0003986116301308 (accessed on 7 June 2022). [CrossRef]
- Jamieson-Hanes, J.; Shrimpton, H.K.; Veeramani, H.; Ptacek, C.J.; Lanzirotti, A.; Newville, M.; Blowes, D.W. Evaluating zinc isotope fractionation under sulfate reducing conditions using a flow-through cell and in situ XAS analysis. Geochim. Cosmochim. Acta 2017, 203, 1–14. Available online: https://www.sciencedirect.com/science/article/pii/S0016703716307438 (accessed on 7 June 2022). [CrossRef]
- Ibs, K.H.; Rink, L. Zinc-altered immune function. J. Nutr. 2003, 133, 1452S–1456S. [Google Scholar] [CrossRef]
- Schrauzer, G.N. New developments in the field of vitamin B12: Reactions of the cobalt atom in corrins and in vitamin B12 model compounds. Angew. Chem. Int. Engl. 1976, 15, 417–426. [Google Scholar] [CrossRef]
- Healton, E.B.; Savage, D.G.; Brust, J.C.; Garrett, T.J.; Lindenbaum, J. Neurologic aspects of cobalamin deficiency. Medicine 1991, 70, 229–245. [Google Scholar] [CrossRef]
- Mertz, W.; Underwood, E.J. Trace Elements in Human and Animal Nutrition; Academic Press: Cambridge, MA, USA, 1987. [Google Scholar]
- EFSA Panel on Dietetic Products, Nutrition, and Allergies,(NDA). Scientific Opinion on Dietary Reference Values for molybdenum. EFSA J. 2013, 11, 3333. [Google Scholar] [CrossRef]
- Guérin, T.; Le Calvez, E.; Zinck, J.; Bemrah, N.; Sirot, V.; Leblanc, J.C.; Chekri, R.; Hulin, M.; Noël, L. Levels of lead in foods from the first French total diet study on infants and toddlers. Food Chem. 2017, 237, 849–856. [Google Scholar] [CrossRef]
- Jean, J.; Sirot, V.; Hulin, M.; Le Calvez, E.; Zinck, J.; Noël, L.; Vasseur, P.; Nesslany, F.; Gorecki, S.; Guérin, T.; et al. Dietary exposure to cadmium and health risk assessment in children—Results of the French infant total diet study. Food Chem. Toxicol. 2018, 115, 358–364. Available online: https://www.sciencedirect.com/science/article/pii/S0278691518301807 (accessed on 9 June 2022). [CrossRef] [PubMed]
- Arvand, M.; Kermanian, M. Potentiometric Determination of Aluminum in Foods, Pharmaceuticals, and Alloys by AlMCM-41-Modified Carbon Paste Electrode. Food Anal. Methods 2013, 6, 578–586. [Google Scholar] [CrossRef]
- Rubio, C.; Martínez, C.; Paz, S.; Gutiérrez, A.J.; González-Weller, D.; Revert, C.; Burgos, A.; Hardisson, A. Trace element and toxic metal intake from the consumption of canned mushrooms marketed in Spain. Environ. Monit. Assess 2018, 190, 237–246. [Google Scholar] [CrossRef]
- Nordberg, G.F.; Fowler, B.A.; Nordberg, M.; Friberg, L.T. Handbook on the Toxicology of Metals; Elsevier B.V.: Houston, TX, USA, 2014. [Google Scholar]
- Krewski, D.; Yokel, R.A.; Nieboer, E.; Borchelt, D.; Cohen, J.; Harry, J.; Kacew, S.; Lindsay, J.; Mahfouz, A.M.; Rondeau, V. Human health risk assessment for aluminium, aluminium oxide, and aluminium hydroxide. J. Toxicol. Environ. Health B Crit. Rev. 2007, 10 (Suppl. 1), 1–269. [Google Scholar] [CrossRef]
- Godt, J.; Scheidig, F.; Grosse-Siestrup, C.; Esche, V.; Brandenburg, P.; Reich, A.; Groneberg, D.A. The toxicity of cadmium and resulting hazards for human health. J. Occup. Med. Toxicol. 2006, 1, 22. [Google Scholar] [CrossRef] [PubMed]
- Liu, J.; Qu, W.; Kadiiska, M.B. Role of oxidative stress in cadmium toxicity and carcinogenesis. Toxicol. Appl. Pharmacol. 2009, 238, 209–214. [Google Scholar] [CrossRef]
- Fowler, B.A. Monitoring of human populations for early markers of cadmium toxicity: A review. Toxicol. Appl. Pharmacol. 2009, 238, 294–300. [Google Scholar] [CrossRef]
- Mahaffey, K.R. Relation between quantities of lead ingested and health effects of lead in humans. Pediatrics 1977, 59, 448–455. [Google Scholar] [CrossRef]
- Rabinowitz, M.B.; Kopple, J.D.; Wetherill, G.W. Effect of food intake and fasting on gastrointestinal lead absorption in humans. Am. J. Clin. Nutr. 1980, 33, 1784–1788. [Google Scholar] [CrossRef]
- Carpenter, D.O. Effects of metals on the nervous system of humans and animals. Int. J. Occup. Med. Environ. Health 2001, 14, 209–218. [Google Scholar]
- Rubio, C.; Lozano, G.; Hardisson, A.; Gutiérrez, A.; Martín, R.; Revert, C. El plomo como contaminante alimentario. Rev. Toxicol. 2004, 21, 72–80. Available online: https://www.redalyc.org/articulo.oa?id=91921303 (accessed on 21 June 2022).
- Scher, C.E. Directorate-General for Health, and Consumers Assessment of the Tolerable Daily Intake of Barium; European Commission: Brussels, Belgium, 2013. [Google Scholar]
- International Programme on Chemical Safety. Inter-Organization Programme for the Sound Management of Chemicals Strontium and Strontium Compounds; WHO: Geneva, Switzerland, 2010. [Google Scholar]
- Dominguez Ortega, L.; Medina Ortiz, O.; Cabrera Garcia-Armenter, S. Intoxicación con litio. An. Med. Interna 2006, 23, 441–445. Available online: https://scielo.isciii.es/scielo.php?script=sci_abstract&pid=S0212-71992006000900010 (accessed on 15 June 2022). [CrossRef]
- AESAN, Agencia Española de Seguridad Alimentaria y Nutrición Revista del Comité Científico de AESA nº4. Revista del Comité Cientifico de AESAN. 2006. Available online: https://www.aesan.gob.es/AECOSAN/docs/documentos/publicaciones/revistas_comite_cientifico/comite_cientifico_4.pdf (accessed on 15 June 2022).
- EFSA Panel on Contaminants in the Food Chain, (CONTAM). Scientific Opinion on the risks to animal and public health and the environment related to the presence of nickel in feed. EFSA J. 2015, 13, 4074. [Google Scholar] [CrossRef]
- EFSA Panel on Dietetic Products, Nutrition and Allergies,(NDA). Scientific Opinion on Dietary Reference Values for calcium. EFSA J. 2015, 13, 4101. [Google Scholar] [CrossRef]
- EFSA Panel on Dietetic Products, Nutrition and Allergies,(NDA). Scientific Opinion on Dietary Reference Values for copper. EFSA J. 2015, 13, 4253. [Google Scholar] [CrossRef]
- Turck, D.; Bresson, J.; Burlingame, B.; Dean, T.; Fairweather-Tait, S.; Heinonen, M.; Hirsch-Ernst, K.; Mangelsdorf, I.; McArdle, H.; EFSA Panel on Dietetic Products, Nutrition and Allergies,(NDA); et al. Dietary reference values for potassium. EFSA J. 2016, 14, e04592. [Google Scholar] [CrossRef]
- EFSA Panel on Dietetic Products, Nutrition and Allergies,(NDA). Scientific Opinion on Dietary Reference Values for magnesium. EFSA J. 2015, 13, 4186. [Google Scholar] [CrossRef]
- EFSA Panel on Dietetic Products, Nutrition and Allergies,(NDA). Scientific Opinion on Dietary Reference Values for manganese. EFSA J. 2013, 11, 3419. [Google Scholar] [CrossRef]
- Turck, D.; Castenmiller, J.; de Henauw, S.; Hirsch-Ernst, K.; Kearney, J.; Knutsen, H.K.; Maciuk, A.; Mangelsdorf, I.; McArdle, H.J.; EFSA Panel on Nutrition, Novel Foods and Food Allergens, (NDA); et al. Dietary reference values for sodium. EFSA J. 2019, 17, e05778. [Google Scholar] [CrossRef]
- EFSA Panel on Dietetic Products, Nutrition and Allergies,(NDA). Scientific Opinion on Dietary Reference Values for iron. EFSA J. 2015, 13, 4254. [Google Scholar] [CrossRef]
- European Food, S.A. Statement of EFSA on the Evaluation of a new study related to the bioavailability of aluminium in food. EFSA J. 2022, 9, 2157. [Google Scholar] [CrossRef]
- European Food Safety Authority, (EFSA). Opinion of the Scientific Panel on Dietetic products, nutrition and allergies [NDA] related to the Tolerable Upper Intake Level of Boron (Sodium Borate and Boric Acid). EFSA J. 2004, 2, 80. [Google Scholar] [CrossRef]
- EFSA Panel on Contaminants in the Food Chain, (CONTAM). Statement on tolerable weekly intake for cadmium. EFSA J. 2022, 9, 1975. [Google Scholar] [CrossRef]
- EFSA Panel on Contaminants in the Food Chain, (CONTAM). Scientific Opinion on Lead in Food. EFSA J. 2010, 8, 1570. [Google Scholar] [CrossRef]
- Rubio, C.; Napoleone, G.; Luis-González, G.; Gutiérrez, A.J.; González-Weller, D.; Hardisson, A.; Revert, C. Metals in edible seaweed. Chemosphere 2017, 173, 572–579. [Google Scholar] [CrossRef] [PubMed]
- Runge, J.; Heringer, O.A.; Ribeiro, J.S.; Biazati, L.B. Multi-element rice grains analysis by ICP OES and classification by processing types. Food Chem. 2019, 271, 419–424. Available online: https://www.sciencedirect.com/science/article/pii/S0308814618313190 (accessed on 1 August 2022). [CrossRef] [PubMed]
- Song, O.Y.; Islam, M.A.; Son, J.H.; Jeong, J.Y.; Kim, H.E.; Yeon, L.S.; Khan, N.; Jamila, N.; Kim, K.S. Elemental composition of pork meat from conventional and animal welfare farms by inductively coupled plasma-optical emission spectrometry (ICP-OES) and ICP-mass spectrometry (ICP-MS) and their authentication via multivariate chemometric analysis. Meat Sci. 2021, 172, 108344. Available online: https://www.sciencedirect.com/science/article/pii/S0309174020307762 (accessed on 1 August 2022). [CrossRef]
- Planeta, K.; Kubala-Kukus, A.; Drozdz, A.; Matusiak, K.; Setkowicz, Z.; Chwiej, J. The assessment of the usability of selected instrumental techniques for the elemental analysis of biomedical samples. Sci. Rep. 2021, 11, 3704. [Google Scholar] [CrossRef]
- Padrón, P.; Paz, S.; Rubio, C.; Gutiérrez, Á.J.; González-Weller, D.; Hardisson, A. Trace Element Levels in Vegetable Sausages and Burgers Determined by ICP-OES. Biol. Trace Elem. Res. 2020, 194, 616–626. [Google Scholar] [CrossRef] [PubMed]
- Currie, L.A. Nomenclature in evaluation of analytical methods including detection and quantification capabilities (IUPAC Recommendations 1995). Pure Appl. Chem. 1995, 67, 1699–1723. [Google Scholar] [CrossRef]
- Mohd Razali, N.; Yap, B. Power Comparisons of Shapiro-Wilk, Kolmogorov-Smirnov, Lilliefors and Anderson-Darling Tests. J. Stat. Modeling Anal. 2011, 2, 21–33. [Google Scholar]
- Zhang, B.; Zhang, Y. Mann-Whitney U test and Kruskal-Wallis test should be used for comparisons of differences in medians, not means: Comment on the article by van der Helm-van Mil et al. Arthritis Rheum. 2009, 60, 1565. [Google Scholar] [CrossRef] [PubMed]
- EFSA Scientific Committee. Statement on the applicability of the Margin of Exposure approach for the safety assessment of impurities which are both genotoxic and carcinogenic in substances added to food/feed. EFSA J. 2012, 10, 2578. [Google Scholar] [CrossRef]
- Hardisson, A.; Revert, C.; González-Weller, D.; Gutiérrez, A.; Paz, S.; Rubio, C. Aluminium Exposure through the Diet. HSOA J. Food Sci. Nutr. 2017, 3, 1–10. [Google Scholar] [CrossRef]
- European Commission Commission Regulation (EU). 2021/1317 of 9 August 2021 Amending Regulation (EC) No 1881/2006 as Regards Maximum Levels of Lead in Certain Foodstuffs; European Commission: Brussels, Belgium, 2021. [Google Scholar]
- European Commission Commission Regulation (EU). 2021/1323 of 10 August 2021 amending Regulation (EC) No 1881/2006 as Regards Maximum Levels of Cadmium in Certain Foodstuffs; European Commission: Brussels, Belgium, 2021. [Google Scholar]
- Shaheen, N.; Irfan, N.M.; Khan, I.N.; Islam, S.; Islam, M.S.; Ahmed, M.K. Presence of heavy metals in fruits and vegetables: Health risk implications in Bangladesh. Chemosphere 2016, 152, 431–438. [Google Scholar] [CrossRef] [PubMed]
- Khalili Sadrabad, E.; Moshtaghi Boroujeni, H.; Heydari, A. Heavy Metal Accumulation in Soybeans Cultivated in Iran, 2015–2016. J. Nutr. Food Secur. 2018, 3, 27–32. Available online: http://jnfs.ssu.ac.ir/article-1-126-en.html (accessed on 10 June 2022).
- García-Vaquero, M.; Miranda, M.; Benedito, J.L.; Blanco-Penedo, I.; López-Alonso, M. Effect of type of muscle and Cu supplementation on trace element concentrations in cattle meat. Food Chem. Toxicol. 2011, 49, 1443–1449. [Google Scholar] [CrossRef] [PubMed]
- Ihedioha, J.N.; Okoye, C.O. Dietary intake and health risk assessment of lead and cadmium via consumption of cow meat for an urban population in Enugu State, Nigeria. Ecotoxicol. Environ. Saf. 2013, 93, 101–106. [Google Scholar] [CrossRef]
- Anetta, L.; Jozef, G. Lead in Meat and Meat Products Consumed by the Population in Slovakia. Am. J. Anim. Vet. Sci. 2014, 9, 263–268. [Google Scholar] [CrossRef][Green Version]
- Cupit, M.; Larsson, O.; de Meeûs, C.; Eduljee, G.H.; Hutton, M. Assessment and management of risks arising from exposure to cadmium in fertilisers—II. Sci. Total Environ. 2002, 291, 189–206. Available online: https://www.sciencedirect.com/science/article/pii/S0048969701010993 (accessed on 17 June 2022). [CrossRef]
- De Meeûs, C.; Eduljee, G.H.; Hutton, M. Assessment and management of risks arising from exposure to cadmium in fertilisers. I. Sci. Total Environ. 2002, 291, 167–187. Available online: https://www.sciencedirect.com/science/article/pii/S0048969701010981 (accessed on 17 June 2022). [CrossRef]
- Baranowska, I.; Barchańska, H.; Pyrsz, A. Distribution of pesticides and heavy metals in trophic chain. Chemosphere 2005, 60, 1590–1599. Available online: https://www.sciencedirect.com/science/article/pii/S0045653505003255 (accessed on 17 June 2022). [CrossRef] [PubMed]
- Baize, D.; Bellanger, L.; Tomassone, R. Relationships between concentrations of trace metals in wheat grains and soil. Agron. Sustain. Dev. 2009, 29, 297–312. [Google Scholar] [CrossRef]
- Six, L.; Smolders, E. Future trends in soil cadmium concentration under current cadmium fluxes to European agricultural soils. Sci. Total Environ. 2014, 485–486, 319–328. Available online: https://www.sciencedirect.com/science/article/pii/S0048969714004495 (accessed on 17 June 2022). [CrossRef]
- Naila, A.; Meerdink, G.; Jayasena, V.; Sulaiman, A.Z.; Ajit, A.B.; Berta, G. A review on global metal accumulators—mechanism, enhancement, commercial application, and research trend. Environ. Sci. Pollut. Res. 2019, 26, 26449–26471. [Google Scholar] [CrossRef] [PubMed]
- Sun, R.; Yang, J.; Xia, P.; Wu, S.; Lin, T.; Yi, Y. Contamination features and ecological risks of heavy metals in the farmland along shoreline of Caohai plateau wetland, China. Chemosphere 2020, 254, 126828. Available online: https://www.sciencedirect.com/science/article/pii/S0045653520310213 (accessed on 20 June 2022). [CrossRef]
- Li, Y.; Zhang, B.; Liu, Z.; Wang, S.; Yao, J.; Borthwick, A.G.L. Vanadium contamination and associated health risk of farmland soil near smelters throughout China. Environ. Pollut. 2020, 263, 114540. Available online: https://www.sciencedirect.com/science/article/pii/S0269749120306667 (accessed on 20 June 2022). [CrossRef]
- Qin, G.; Niu, Z.; Yu, J.; Li, Z.; Ma, J.; Xiang, P. Soil heavy metal pollution and food safety in China: Effects, sources and removing technology. Chemosphere 2021, 267, 129205. Available online: https://www.sciencedirect.com/science/article/pii/S0045653520334020 (accessed on 20 June 2022). [CrossRef]
- EFSA Panel on Contaminants in the Food Chain, (CONTAM). Scientific Opinion on the risks to public health related to the presence of nickel in food and drinking water. EFSA J. 2022, 13, 4002. [Google Scholar] [CrossRef]
- EFSA, S.C. Guidance on selected default values to be used by the EFSA Scientific Committee, Scientific Panels and Units in the absence of actual measured data. EFSA J. 2012, 10, 2579. [Google Scholar] [CrossRef]
- WHO. Manganese in Drinking-Water: Background Document for Development of WHO Guidelines for Drinking-Water Quality; WHO: Geneva, Switzerland, 2004. [Google Scholar]
- AESAN, Agencia Española de Seguridad Alimentaria y Nutrición Informe del Comité Científico de la Agencia Española de Seguridad Alimentaria y Nutrición (AESAN) en Relación a Criterios de Estimación de Concentraciones Para la Discusión de Propuestas de Límites de Migración de Determinados Metales Pesados y Otros Elementos de Objetos de Cerámica Destinados a Entrar en Contacto Con Los Alimentos. Revista del Comité Cientifico de AESAN. 2012. Available online: https://www.aesan.gob.es/AECOSAN/docs/documentos/seguridad_alimentaria/evaluacion_riesgos/informes_comite/MATERIALES_CONTACTO_ALIMENTOS_.pdf (accessed on 27 June 2022).


| Elements | Guideline Values | Reference | |
|---|---|---|---|
| Ca | AI | 280 mg/day | [46] |
| Cu | 0.4 mg/day | [47] | |
| K | 750 mg/day | [48] | |
| Mg | 80/mg/day | [49] | |
| Mn | 0.02–0.05 mg/day | [50] | |
| Mo | 10 µg/day | [27] | |
| Na | 0.2 g/day | [51] | |
| Zn | PRI | 2.9 mg/day | [20] |
| Fe | 11 mg/day | [52] | |
| Al | TWI | 1 mg/kg body weight/week | [53] |
| B | UL | 0.16 mg/kg body weight/day | [54] |
| Ba | TDI | 0.2 mg/kg body weight/week | [41] |
| Cd | TWI | 2.5 µg/kg body weight/week | [55] |
| Ni | TDI | 2.8 µg/kg body weight/day | [45] |
| Pb | BMDL | 0.5 µg/kg body weight/day | [56] |
| Sr | UL | 0.13 µg/kg body weight/day | [42] |
| V | 1.8 mg/day | [14] | |
| Baby Food Jar Types | Number of Samples | Package | |
|---|---|---|---|
| Fruits | Mixed fruits | 5 | Glass jar |
| Apple | 5 | ||
| Banana | 5 | ||
| Meat | Chicken stew | 10 | |
| Vegetables | Mixed vegetables boiled | 10 | |
| Mixed | Gardener-style tender veal | 10 | |
| Elements | Instrumental Wavelengths (nm) | LOQ (mg/L) |
|---|---|---|
| Al | 167.0 | 0.012 |
| B | 249.7 | 0.012 |
| Ba | 455.4 | 0.005 |
| Ca | 317.9 | 1.995 |
| Cd | 226.5 | 0.001 |
| Co | 228.6 | 0.002 |
| Cu | 327.3 | 0.012 |
| Fe | 259.9 | 0.009 |
| K | 769.9 | 1.884 |
| Li | 670.8 | 0.013 |
| Mg | 279.1 | 1.943 |
| Mn | 257.6 | 0.008 |
| Mo | 202.0 | 0.002 |
| Na | 589.6 | 3.655 |
| Ni | 231.6 | 0.003 |
| Pb | 220.3 | 0.001 |
| Sr | 407.7 | 0.003 |
| V | 310.2 | 0.005 |
| Zn | 206.2 | 0.007 |
| Metal | Material | Concentration Found (mg/kg) | Certified Concentration (mg/kg) | R (%) |
|---|---|---|---|---|
| Na | SRM 1577b Bovine Liver | 0.242 ± 0.006 | 0.238 ± 0.010 | 98.3 |
| K | 0.994 ± 0.002 | 0.936 ± 0.007 | 94.2 | |
| Ca | 116 ± 4 | 111.1 ± 8.5 | 95.8 | |
| Mg | 601 ± 28 | 559.5 ± 46 | 93.1 | |
| Al | SRM 1515 Apple Leaves | 286 ± 9 | 285.1 ± 26 | 99.7 |
| B | 27.0 ± 2.0 | 27.0 ± 1.5 | 99.9 | |
| Mo | 0.09 ± 0.01 | 0.09 ± 0.02 | 99.4 | |
| Sr | 25.0 ± 2.0 | 24.6 ± 4.0 | 98.3 | |
| Ba | SRM 1548a Typical Diet | 1.10 ± 0.10 | 1.13 ± 0.09 | 102.5 |
| Ni | 0.37 ± 0.02 | 0.38 ± 0.04 | 102.3 | |
| Pb | 0.044 ± 0.000 | 0.044 ± 0.013 | 98.9 | |
| Cd | SRM 1567a Wheat Flour | 0.026 ± 0.002 | 0.026 ± 0.008 | 98.4 |
| Co | 0.006 ± 0.00 | 0.006 ± 0.002 | 102.4 | |
| Cu | 2.1 ± 0.2 | 2.09 ± 0.4 | 99.7 | |
| Fe | 14.1 ± 0.5 | 13.9 ± 0.3 | 98.9 | |
| Mn | 9.4 ± 0.9 | 9.6 ± 1.5 | 102.4 | |
| V | 0.011 ± 0.00 | 0.011 ± 0.00 | 99.4 | |
| Zn | 11.6 ± 0.4 | 11.9 ± 0.2 | 102.7 | |
| Li | Standard Addition Method | 0.2 ± 0.02 | 0.19 ± 0.03 | 95.0 |
| Element | Concentration (mg/kg Wet Weight) ± SD | |||
|---|---|---|---|---|
| Fruits | Vegetables | Meat | Mixed | |
| Ca | 221 ± 78.2 | 456 ± 38.1 | 798 ± 151 | 921 ± 62.7 |
| K | 3882 ± 1178 | 3686 ± 363 | 4213 ± 548 | 4066 ± 1000 |
| Na | 425 ± 170 | 752 ± 184 | 1943 ± 740 | 2464 ± 106 |
| Mg | 307 ± 97.3 | 319 ± 47.9 | 302 ± 96.0 | 316 ± 47.5 |
| Al | 8.14 ± 5.56 | 8.22 ± 8.97 | 5.89 ± 6.83 | 5.46 ± 4.32 |
| Cd | 0.01 ± 0.002 | 0.03 ± 0.004 | 0.03 ± 0.006 | 0.02 ± 0.004 |
| Pb | 0.11 ± 0.04 | 0.14 ± 0.04 | 0.17 ± 0.05 | 0.16 ± 0.03 |
| Ba | 1.09 ± 0.42 | 1.75 ± 0.39 | 1.14 ± 0.29 | 1.61 ± 0.62 |
| B | 5.37 ± 2.13 | 2.40 ± 1.06 | 1.73 ± 0.80 | 1.91 ± 0.78 |
| Co | 0.02 ± 0.0004 | 0.02 ± 0.0005 | 0.02 ± 0.02 | 0.02 ± 0.003 |
| Cu | 2.70 ± 0.77 | 1.71 ± 0.49 | 1.74 ± 0.58 | 1.40 ± 0.34 |
| Sr | 3.55 ± 3.39 | 4.34 ± 0.43 | 2.64 ± 0.42 | 4.10 ± 1.46 |
| Fe | 5.42 ± 1.24 | 8.40 ± 0.83 | 7.83 ± 1.79 | 10.5 ± 0.76 |
| Li | 307 ± 97.3 | 319 ± 48.0 | 302 ± 96.0 | 316 ± 47.5 |
| Mn | 3.20 ± 1.97 | 2.93 ± 0.36 | 2.28 ± 0.69 | 2.28 ± 0.27 |
| Mo | 0.06 ± 0.01 | 0.18 ± 0.05 | 0.15 ± 0.02 | 0.12 ± 0.01 |
| Ni | 0.13 ± 0.04 | 0.87 ± 0.07 | 0.17 ± 0.03 | 0.17 ± 0.02 |
| V | 0.16 ± 0.07 | 0.19 ± 0.08 | 0.14 ± 0.08 | 0.13 ± 0.08 |
| Zn | 2.90 ± 0.49 | 6.15 ± 1.02 | 12.5 ± 1.54 | 18.6 ± 1.84 |
| Reference | Type | Element Concentration (mg/kg ww) | |||||||
|---|---|---|---|---|---|---|---|---|---|
| Al | Ba | Cd | Co | Ni | Pb | Sr | V | ||
| Present study, 2022 | Fruits | 8.14 ± 5.56 | 1.09 ± 0.42 | 0.01 ± 0.002 | 0.02 ± 0.0004 | 0.13 ± 0.04 | 0.11 ± 0.04 | 3.55 ± 3.39 | 0.16 ± 0.07 |
| [8] | 0.556 ± 0.254 | 0.184 ± 0.057 | 0.00066 ± 0.00049 | 0.00287 ± 0.00104 | 0.0547 ± 0.0267 | - | 0.273 ± 0.150 | 0.00140 ± 0.00081 | |
| [29] | - | 0.00049 ± 0.00062 | - | ||||||
| [28] | - | 0.00215 ± 0.00208 | - | ||||||
| Present study, 2022 | Meat | 5.89 ± 6.83 | 1.14 ± 0.29 | 0.03 ± 0.006 | 0.02 ± 0.02 | 0.17 ± 0.03 | 0.17 ± 0.05 | 2.64 ± 0.42 | 0.14 ± 0.08 |
| [8] | Meat/Fish | 0.597 ± 0.436 | 0.286 ± 0.141 | 0.00931 ± 0.00433 | 0.00382 ± 0.00132 | 0.0757 ± 0.0257 | - | 0.580 ± 0.203 | 0.00256 ± 0.00132 |
| [29] | - | 0.00926 ± 0.00448 | - | ||||||
| [28] | - | 0.00313 ± 0.00289 | - | ||||||
| Present study, 2022 | Vegetables | 8.22 ± 8.97 | 1.75 ± 0.39 | 0.03 ± 0.004 | 0.02 ± 0.0005 | 0.87 ± 0.07 | 0.14 ± 0.04 | 4.34 ± 0.43 | 0.19 ± 0.08 |
| [8] | 0.575 ± 0.511 | 0.337 ± 0.316 | 0.00926 ± 0.00448 | 0.00369 ± 0.00267 | 0.0715 ± 0.028 | - | 0.568 ± 0.157 | 0.00219 ± 0.00127 | |
| [29] | - | 0.00931 ± 0.00433 | - | ||||||
| [28] | - | 0.00343 ± 0.00201 | - | ||||||
| Guideline Values [20,27,46,47,48,49,50,51,52] | Fruits | Vegetables | Meat | Mixed | |||||||||||||
|---|---|---|---|---|---|---|---|---|---|---|---|---|---|---|---|---|---|
| EDI (mg/Day) | % AI | EDI (mg/Day) | % AI | EDI (mg/Day) | % AI | EDI (mg/Day) | % AI | ||||||||||
| 130 g/Day | 250 g/Day | 130 g/Day | 250 g/Day | 130 g/Day | 250 g/Day | 130 g/Day | 250 g/Day | 130 g/Day | 250 g/Day | 130 g/Day | 250 g/Day | 130 g/Day | 250 g/Day | 130 g/Day | 250 g/Day | ||
| Ca | 280 mg/day | 28.7 | 55.3 | 10.3 | 19.8 | 59.3 | 114 | 21.2 | 40.7 | 104 | 200 | 37.1 | 71.4 | 120 | 230 | 42.9 | 82.1 |
| Cu | 0.4 mg/day | 0.35 | 0.68 | 87.5 | 170 | 0.22 | 0.43 | 55.0 | 108 | 0.23 | 0.44 | 57.5 | 110 | 0.18 | 0.35 | 45.0 | 87.5 |
| Fe | 11 mg/day | 0.71 | 1.36 | 6.45 | 12.4 | 1.09 | 2.10 | 9.91 | 19.1 | 1.02 | 1.96 | 9.27 | 17.8 | 1.37 | 2.63 | 12.5 | 23.9 |
| K | 750 mg/day | 505 | 971 | 67.3 | 130 | 479 | 922 | 63.9 | 123 | 548 | 1053 | 73.1 | 140 | 529 | 1017 | 70.5 | 136 |
| Mg | 80 mg/day | 40.0 | 76.8 | 50.0 | 96.0 | 41.5 | 79.8 | 51.9 | 99.8 | 39.3 | 75.5 | 49.1 | 94.4 | 41.1 | 79.0 | 51.4 | 98.8 |
| Mn | 0.02–0.5 mg/day | 0.42 | 0.80 | 2100–84.0 | 4000–160 | 0.38 | 0.73 | 1900–76 | 3650–146 | 0.30 | 0.57 | 1500–60 | 2850–114 | 0.30 | 0.57 | 1500–60 | 2850–114 |
| Mo | 10 μg/day | 0.008 | 0.02 | 80 | 200 | 0.02 | 0.05 | 230 | 500 | 0.02 | 0.04 | 200 | 400 | 0.02 | 0.03 | 200 | 300 |
| Na | Not established | - | |||||||||||||||
| Zn | 2.9 mg/day | 0.38 | 0.73 | 13.1 | 25.0 | 0.80 | 1.54 | 27.6 | 53.1 | 1.63 | 3.13 | 56.2 | 108 | 2.42 | 4.65 | 83.4 | 160 |
| Guideline Values | Parameter | Fruits | Vegetables | Meat | Mixed | |||||||||||||
|---|---|---|---|---|---|---|---|---|---|---|---|---|---|---|---|---|---|---|
| EDI (Mg/Day) | % TWI, TDI or UL | EDI (Mg/Day) | % TWI, TDI or UL | EDI (Mg/Day) | % TWI, TDI or UL | EDI (Mg/Day) | % TWI, TDI or UL | |||||||||||
| 130 g/Day | 250 g/Day | 130 g/Day | 250 g/Day | 130 g/Day | 250 g/Day | 130 g/Day | 250 g/Day | 130 g/Day | 250 g/Day | 130 g/Day | 250 g/Day | 130 g/Day | 250 g/Day | 130 g/Day | 250 g/Day | |||
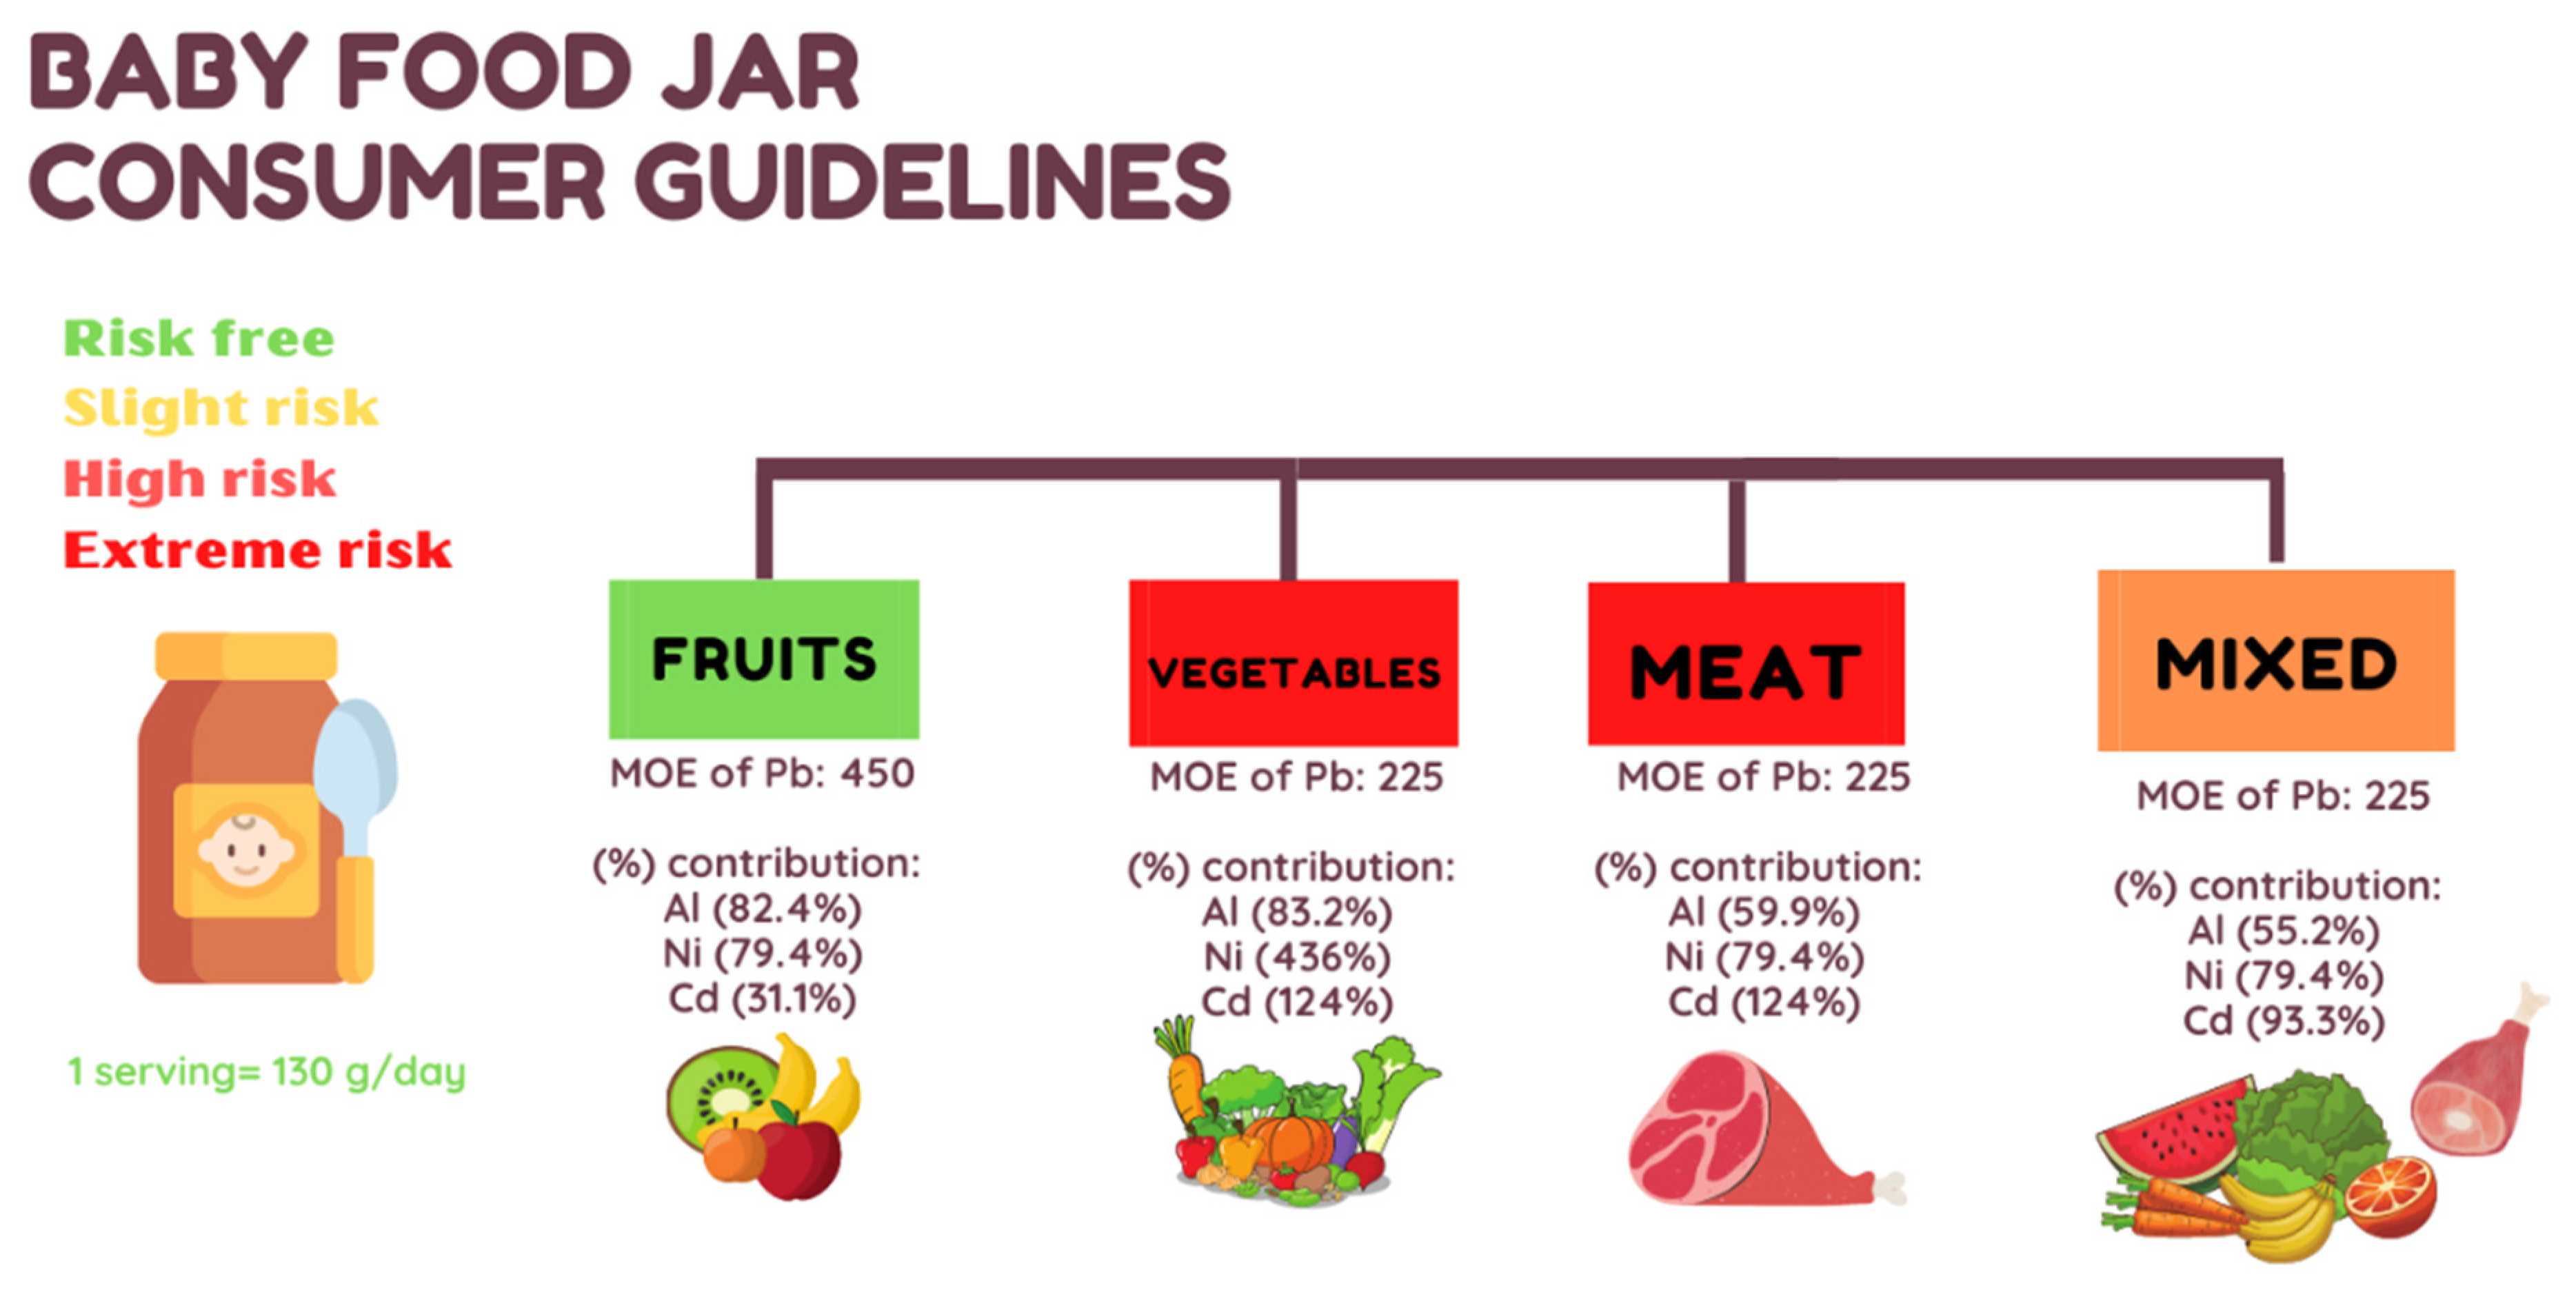
| Al | 1 mg/kg body weight/week [53] | TWI | 1.06 | 2.04 | 82.4 | 160 | 1.07 | 2.06 | 83.2 | 160 | 0.77 | 1.47 | 59.9 | 114 | 0.71 | 1.37 | 55.2 | 107 |
| B | 0.16 mg/kg body weight/day [54] | UL | 0.70 | 1.34 | 48.48 | 93.23 | 0.31 | 0.60 | 21.67 | 41.67 | 0.22 | 0.43 | 15.62 | 30.03 | 0.25 | 0.48 | 17.24 | 33.16 |
| Ba | 0.2 mg/kg bw/day [41] | TDI | 0.14 | 0.27 | 7.78 | 15.0 | 0.23 | 0.44 | 12.8 | 24.4 | 0.15 | 0.29 | 8.33 | 16.1 | 0.21 | 0.40 | 11.7 | 22.2 |
| Cd | 2.5 µg/kg bw/week [55] | TWI | 0.001 | 0.003 | 31.1 | 93.3 | 0.004 | 0.008 | 124 | 250 | 0.004 | 0.008 | 124 | 250 | 0.003 | 0.005 | 93.3 | 156 |
| Ni | 2.8 µg/kg bw/day [83] | TDI | 0.02 | 0.03 | 79.4 | 119 | 0.11 | 0.22 | 436 | 873 | 0.02 | 0.04 | 79.4 | 159 | 0.02 | 0.04 | 79.4 | 159 |
| Sr | 0.13 mg/kg bw/day [42] | 0.46 | 0.89 | 39.3 | 76.1 | 0.56 | 1.09 | 47.9 | 93.2 | 0.34 | 0.66 | 29.1 | 56.4 | 0.53 | 1.03 | 45.3 | 88.0 | |
| V | 1.8 mg/day [14] | UL | 0.02 | 0.04 | 1.16 | 2.22 | 0.02 | 0.05 | 1.37 | 2.64 | 0.02 | 0.04 | 1.01 | 1.94 | 0.02 | 0.03 | 0.94 | 1.81 |
| Guideline Values | Parameter | EDI | MOE | EDI | MOE | EDI | MOE | EDI | MOE | |||||||||
| 130 g/day | 250 g/day | 130 g/day | 250 g/day | 130 g/day | 250 g/day | 130 g/day | 250 g/day | 130 g/day | 250 g/day | 130 g/day | 250 g/day | 130 g/day | 250 g/day | 130 g/day | 250 g/day | |||
| Pb | 0.5 µg/kg bw/day [56] | BMDL | 0.01 | 0.03 | 450 | 150 | 0.02 | 0.04 | 225 | 112.5 | 0.02 | 0.04 | 225 | 112.5 | 0.02 | 0.04 | 225 | 112.5 |
Publisher’s Note: MDPI stays neutral with regard to jurisdictional claims in published maps and institutional affiliations. |
© 2022 by the authors. Licensee MDPI, Basel, Switzerland. This article is an open access article distributed under the terms and conditions of the Creative Commons Attribution (CC BY) license (https://creativecommons.org/licenses/by/4.0/).
Share and Cite
González-Suárez, S.; Paz-Montelongo, S.; Niebla-Canelo, D.; Alejandro-Vega, S.; González-Weller, D.; Rubio-Armendáriz, C.; Hardisson, A.; Gutiérrez-Fernández, Á.J. Baby Food Jars as a Dietary Source of Essential (K, Na, Ca, Mg, Fe, Zn, Cu, Co, Mo, Mn) and Toxic Elements (Al, Cd, Pb, B, Ba, V, Sr, Li, Ni). Appl. Sci. 2022, 12, 8044. https://doi.org/10.3390/app12168044
González-Suárez S, Paz-Montelongo S, Niebla-Canelo D, Alejandro-Vega S, González-Weller D, Rubio-Armendáriz C, Hardisson A, Gutiérrez-Fernández ÁJ. Baby Food Jars as a Dietary Source of Essential (K, Na, Ca, Mg, Fe, Zn, Cu, Co, Mo, Mn) and Toxic Elements (Al, Cd, Pb, B, Ba, V, Sr, Li, Ni). Applied Sciences. 2022; 12(16):8044. https://doi.org/10.3390/app12168044
Chicago/Turabian StyleGonzález-Suárez, Santiago, Soraya Paz-Montelongo, Daniel Niebla-Canelo, Samuel Alejandro-Vega, Dailos González-Weller, Carmen Rubio-Armendáriz, Arturo Hardisson, and Ángel J. Gutiérrez-Fernández. 2022. "Baby Food Jars as a Dietary Source of Essential (K, Na, Ca, Mg, Fe, Zn, Cu, Co, Mo, Mn) and Toxic Elements (Al, Cd, Pb, B, Ba, V, Sr, Li, Ni)" Applied Sciences 12, no. 16: 8044. https://doi.org/10.3390/app12168044
APA StyleGonzález-Suárez, S., Paz-Montelongo, S., Niebla-Canelo, D., Alejandro-Vega, S., González-Weller, D., Rubio-Armendáriz, C., Hardisson, A., & Gutiérrez-Fernández, Á. J. (2022). Baby Food Jars as a Dietary Source of Essential (K, Na, Ca, Mg, Fe, Zn, Cu, Co, Mo, Mn) and Toxic Elements (Al, Cd, Pb, B, Ba, V, Sr, Li, Ni). Applied Sciences, 12(16), 8044. https://doi.org/10.3390/app12168044