Editorial

Remote Sensing and GIS in Environmental Monitoring

Instituto de Investigación para la Gestión Integrada de Zonas Costeras, Universitat Politècnica de València, 46022 Valencia, Spain
Appl. Sci. 2022, 12(16), 8045; https://doi.org/10.3390/app12168045
Submission received: 1 August 2022 / Accepted: 8 August 2022 / Published: 11 August 2022
(This article belongs to the Section Environmental Sciences)

1. Introduction

In recent decades, remote sensing and geographic information systems (GIS) have become valuable environmental monitoring tools. Figure 1 summarizes the published papers on remote sensing for environmental monitoring and on GIS for environmental monitoring in the last two decades based on data from worldwidescience.org (last access on 26 July 2022) [1]. From Figure 1, we can see that GIS and remote sensing for environmental monitoring grew in population almost equally. Considering the past few years, we can see that both topics are gaining interest according to the increase in published papers. Due to their multiple applications in different fields such as water [2], air [3], soil [4], agriculture [5], marine and terrestrial ecosystems [6,7], and urban monitoring [8], their use is continuing to grow.

2. General Uses of Remote Sensing and GIS in Environmental Monitoring

One of the significant advantages of remote sensing is the possibility of accessing an extensive open database that contains information from decades ago. This allows for the analysis of images obtained in different moments, which can be used to analyze the changes in the surface. In Figure 2a,b, we show and focus on the most studied topics in the last decade (2013 to 2022) for both remote sensing and GIS. Then, in Figure 3a,b, the most studied topics and subtopics are shown in depth for the last three years. Analyzing those figures, we find several similitudes and synergies between GIS and remote sensing research on environmental monitoring. We can see that in the last three years, topics such as climate change increased in published papers about GIS and remote sensing. Energy is another topic that is growing in published papers, but only in GIS publications. Regarding water quality, it is increasing in popularity in remote sensing publications but decreased in GIS publications.
Focusing on subtopics, the most important ones in the last three years were remote sensing images, water, and vegetation in remote sensing research. Meanwhile, for GIS publications, the most relevant subtopics were water resources, environment, land cover, land, visualization of results, and soil. According to [9], it is evident that remote sensing can be applied in almost every single aspect of our development. The authors showed how remote sensing could be used to evaluate the Sustainable Development Goals (SDG). They concluded that remote sensing can be applied to 13 of 17 SDGs. The ones in which remote sensing cannot be helpful are 4, 8, 10, and 16. Nonetheless, applying GIS to those SDGs would be possible to identify weak regions or study some differences in areas with similar characteristics.
Focusing on the use of the GIS for environmental monitoring, in most cases, it is necessary to include information about remote sensing in the analyses. Although remote sensing data are not entirely needed in some cases, their use might help the experts interpret the results, enhancing the visual aspects of data presentation [10].

3. Remote Sensing Image Sources

Regarding remote sensing, most published papers use satellites as image sources. In recent years, the use of automatic unmanned vehicles (UAVs) has increased. Although UAVs offer higher spatial resolution and much higher flexibility in terms of temporal resolution [11], their low spectral resolution, different regulations restricting the ground sample distance (GSD), and the cost of UAVs are slowing down their application in remote sensing. In [11], the authors also pointed out the limitations of UAVs in terms of meteorological factors (wind and rain), since similar meteorological conditions might limit the use of remote sensing (clouds); however, we consider this to not make a big difference. In fact, in regions characterized by high cloud coverage with low rain, the UAVs might be helpful for gathering information.
Concerning the remote sensing images obtained from satellite sources, there is huge variability in their characteristics according to the selected satellite. A recent survey analyzed the satellite sources for remote sensing applications in coastal and marine areas [12]. According to their results, the most used ones are the Landsat, followed by MODIS, Sentinel 1, and SPOT 5. Nonetheless, the studied field affects the highly used satellite classification. Landsat, MODIS, and Sentinel 2 are the most used in grassland monitoring, according to [13]. Furthermore, the studied area also affects the selected satellites. According to [14], a review of remote sensing use carried out in China that includes several monitored elements indicated that the most used satellite is Landsat, followed by MODIS, but other satellites not even included in previous surveys appear in a relatively high position, such as ASTER and Gaofen. Some satellites offer an extraordinary historical record since they provide years of uninterrupted global data, such as MODIS and Landsat [15].
To provide more accurate data about the most used satellites, a search on [1] included the words remote sensing + environmental monitoring and the three most used satellites according to [13]. We selected both Landsat 8 and Sentinel since they provide similar data in terms of spatial resolution (with the resolution of Sentinel 2 being 10 m, which is better than Landsat 8, 30 m) and quite identical spectral resolution (11 bands for Landsat 8 and 12 bands for Sentinel 2). The temporal resolution is better for Sentinel 2 (the revisit time is equal to 8 days for Landsat 16 and only 2.3 days for Sentinel 2). Landsat 8 and Sentinel 2 are recent satellites launched in 2013 and 2015, respectively. In the period from 2002 to July 2022, we found 1320 results (published papers on [1]) which included Landsat. For the same period, the number of papers using Sentinel was 1335. The numbers in terms of usage are very similar. Nonetheless, the differences are more evident if we focus the search on the last three years, from January 2020 to July 2022. We found a total of 406 papers for Landsat 8 and 490 for Sentinel 2. If we pay attention to the topics linked to the papers using Landsat 8, Sentinel 2 appears in the first position. Nevertheless, for the results related to Sentinel 2 images, Landsat 8 appears as the fifth topic. This might suggest that several researchers using Landsat images might be using Sentinel 2 to combine or compare information, but it is not evident when Sentinel 2 images are being used. Another search was performed for the papers focused on MODIS. The total number of publications from 2002 to July 2022 was 1680, which is considerably more than for Sentinel 2 or Landsat 8. This can be explained due to MODIS being launched earlier. If we focus on the period January 2020 to July 2022, the number of papers using MODIS was 399, which is notably lower than for Landsat 8 or Sentinel 2. Thus, we can conclude that the ranking of remote sensing satellites providing multispectral images in terms of usage since 2020 has Sentinel 2 as the most used, followed by Landsat 8 and MODIS.

4. Included Application Cases

In this Special Issue, we have collected ten papers representing the diversity of GIS and remote sensing research in environmental monitoring. The papers included in the Special Issue cover a wide range of GIS and remote sensing applications in different areas, such as onshore and offshore applications. They use the remote sensing information in different ways, such as including time series analyses, combining bands to create indexes, or detecting variations and merging information from different sources to generate new information.
L. Lin et al. [16] presented the use of Google Earth Engine (GEE) to explore the changes in land cover classification and its spatial pattern from 1990 to 2019 on Haitan Island (China). The authors selected an island to evaluate this option due to its high susceptibility to climate change and human activities. They used the Landsat missions as the information sources, including images from Landsat 5, Landsat 7, and Landsat 8. The included images contained the bands, vegetation indexes, and the tasseled cap transformation. Six land cover classes were defined by the authors. Their results were characterized by user and producer accuracies higher than 80%, and the kappa coefficient values ranged from 0.86 to 0.90. In the studied area, forest and built-up land were the two land cover classes that increased by 30.94% and 16.20% in the area, respectively. These changes were mainly explained by the modifications in the reforestation strategy of China and China’s policy for boosting the economy and social development, which accelerated the island’s development. Y. Li et al. [17] described the effect of declining precipitation on the grasslands in the Inner Mongolian plateau. As a metric, the authors used the normalized difference vegetation index (NDVI) from 1982 to 2010. The authors used the MODIS satellite as the image source. The data period selected was one image every two weeks. Precipitation and temperature were the climatologic variables included. Their results indicate that the NDVI was more greatly affected by the precipitation than the temperature. The precipitation can explain 35.47% of the variability of NDVI data, whereas the temperature only explains 0.56%. Regarding the spatial differences of this effect, in the dry areas, the climate has a higher impact on the NDVI than in the wet regions. Another option available, thanks to having large datasets of data from different years, is the possibility of forecasting the future values of a studied variable. In this sense, F. Carreño-Conde et al. [18] modeled the vegetation based on vegetation indexes and climatic data. In their paper, the authors included data from February 2013 to December 2017 of different crops (maize and olive) in a region of Comunidad de Madrid, Spain. As the image source, the authors selected the MODIS satellite. Meanwhile, the SiAR network weather station was selected for obtaining the agroclimatic data. Their forecast model predicted the NDVI values for the different crops. Their results indicate the positive influence of some of the studied weather parameters, such as temperature, precipitation, humidity, and solar radiation.
Another opportunity offered by remote sensing is the possibility of analyzing large portions of the earth’s surface. In some cases, measuring a parameter over large areas might be challenging due to the extension of the area or the high spatial variability of the studied parameter.
Soil moisture is a parameter with high spatial variability in complex environments where irrigated and rainfed crops coexist with urban and natural areas. In [19], P. V. Mauri et al. studied the possibility of using in situ sensors to obtain a model that can be applied to large areas to estimate soil moisture. They used a total of nine sensors located in areas characterized by different soil and different vegetation. The authors selected the Sentinel 2 satellites as an image source due to the need for high spatial resolution. The bands with 10 m and 20 m spatial resolution were included in the analysis. The authors analyzed the correlations between the selected bands and the data from the sensors. Their results indicate that bands 4 and 12 are the ones with the best correlation. A mathematical model to estimate soil moisture based on both bands was proposed and verified using images for other days. The proposed model’s mean absolute error (MAE) was 8.4%. Another example is shown in [20], a study by F. Domazetovic et al., in which the authors proposed a tool for automated coastline extraction. In this case, the authors used the WorldView-2 multispectral imagery, with a single multispectral, 2 m spatial resolution and panchromatic, 0.5 m spatial resolution image combined with a stereo-pair-derived digital surface model. The images were acquired on 28th October 2016 from the Iž-Rava island group. With the acquired images, indexes were calculated and, using established thresholds, the coastline was extracted. On the other hand, based on the stereo-pair-derived digital surface model, the coastline was extracted according to the elevation. The extracted coastlines were compared with other accurate methods such as UAVs with a centimeter-level accuracy reference. The average deviation of the coastline extraction was 0.73 m.
We found more papers that use remote sensing in the marine area. Even though remote sensing is majorly applied onshore, mainly since light reflection in offshore areas is limited and most bands cannot provide useful information, there are still several examples of remote sensing in marine areas, such as [20]. H. Yao et al. [21] used remote sensing to study a variable, chlorophyll-a concentrations, with high spatial variability in a large area. In this case, the selected satellite was the Landsat 8 OLI. The authors proposed the use of a machine learning approach called the gradient-boosting decision tree to predict the chlorophyll-a concentrations in coastal waters. Data from 2013 to 2020 were used. The data from the chlorophyll-a concentrations were obtained from 13 automatic monitoring stations. Bands 1 to 7 from the satellite were included in the analyses. The model with better performance has as input features B4, B3 + B4, B3, B1 − B4, B2 + B4, B1 + B4, and B2 − B4. The R2 of the model is higher than 0.77, and the MAE is below 1 µg/L. Another example of remote sensing applied in the coastal area is found in [22]. In this paper, A. Fortelli et al. analyzed the effect of an extreme sea storm event on the Golf of Naples, Italy. They focused on the event of the 28th of December, 2020, in which the coastal seawall, road edges, and touristic structures suffered damage due to the waves. Climatologic data from seven weather stations were included in their study, comprising onshore and offshore stations. Meteorological maps from EUMETSAT from the 26th of December to 28th of December were used in their study. Their results suggested that the sole option for having an integrated approach that has the correct base of information is to include all the physical and anthropic components of the coastal system.
The application of remote sensing in urban areas can also provide useful tools and approaches. Remote sensing and GIS in the urban area can be applied to different problems, such as monitoring the variation in a specific land cover or even for planning where to build new structures. Regarding monitoring changes in an urban area, A. Agapiou [23] evaluated the vegetation cover in the vicinity of archaeological sites. The authors selected Sentinel 1 and Sentinel 2 as image sources. Crowdsourced OpenStreetMap geodata supplemented the images from the satellites. The authors calculated the normalized difference vegetation index (NDVI) and the radar vegetation index (RVI) from the Sentinel images. The results of the NDVI, RVI, and their combination for the analyzed area were compared with the Google Earth red-green-blue free high-resolution optical images. The results indicate that the differences between the estimated vegetation-covered areas from Sentinel and the results based on high-resolution images from Google Earth are low. The use of GIS in urban areas to identify the best location to build a new hospital was presented by K. Y. Almansi et al. in [24]. The authors focused their work on the Gaza Strip. They proposed using a model to evaluate the hospital site’s suitability area based on 14 conditioning factors and the location of current hospitals. Most of the conditioning factors were geoinformation variables such as slope, topographic wetness index, or road distance. For the models, the authors included support vector machine (SVM), multilayer perceptron (MLP), and linear regression (LR) models to evaluate the suitability of the area. The results indicate that twelve conditioning factors (including slope degree, plan curvature, distance from the residential area, and population density, among others) were suitable for use. Their results were characterized by R2 values of 0.94, 0. 93, and 0.75 for the SVM, MLP, and LR models.
A final potential use of remote sensing or GIS systems is to exploit the UAVs used for image gathering for additional use, such as by providing a connection to land-based devices as a mobile gateway. This possibility was shown by L. Garcia et al. in [25], in which a drone used for crop monitoring was able to collect the data of land-based nodes. The authors analyzed that if given a flying height and flying velocity, selected according to the crop being monitored, the drone can be used as a mobile gateway for a different density of land-based nodes. The authors included in their proposal different WiFi configurations and different antennas. The drone operation algorithms and the nodes and message exchange were proposed. The results indicate that this solution might be used by adjusting the antenna coverage for flying heights that are less than 100 m for different flying velocities (from 1 to 20 m/s) for different tested node densities. Nonetheless, this solution can only be applied to dense scenarios (1 node every 60 m2) if the drone’s flying velocity is 1 m/s and the flying height is less than 24 m.

5. Current Challenges and Future Trends

These submissions show the wide variety of applications for remote sensing and GIS in environmental monitoring. In this section, we show the expected future trends and challenges of this topic.
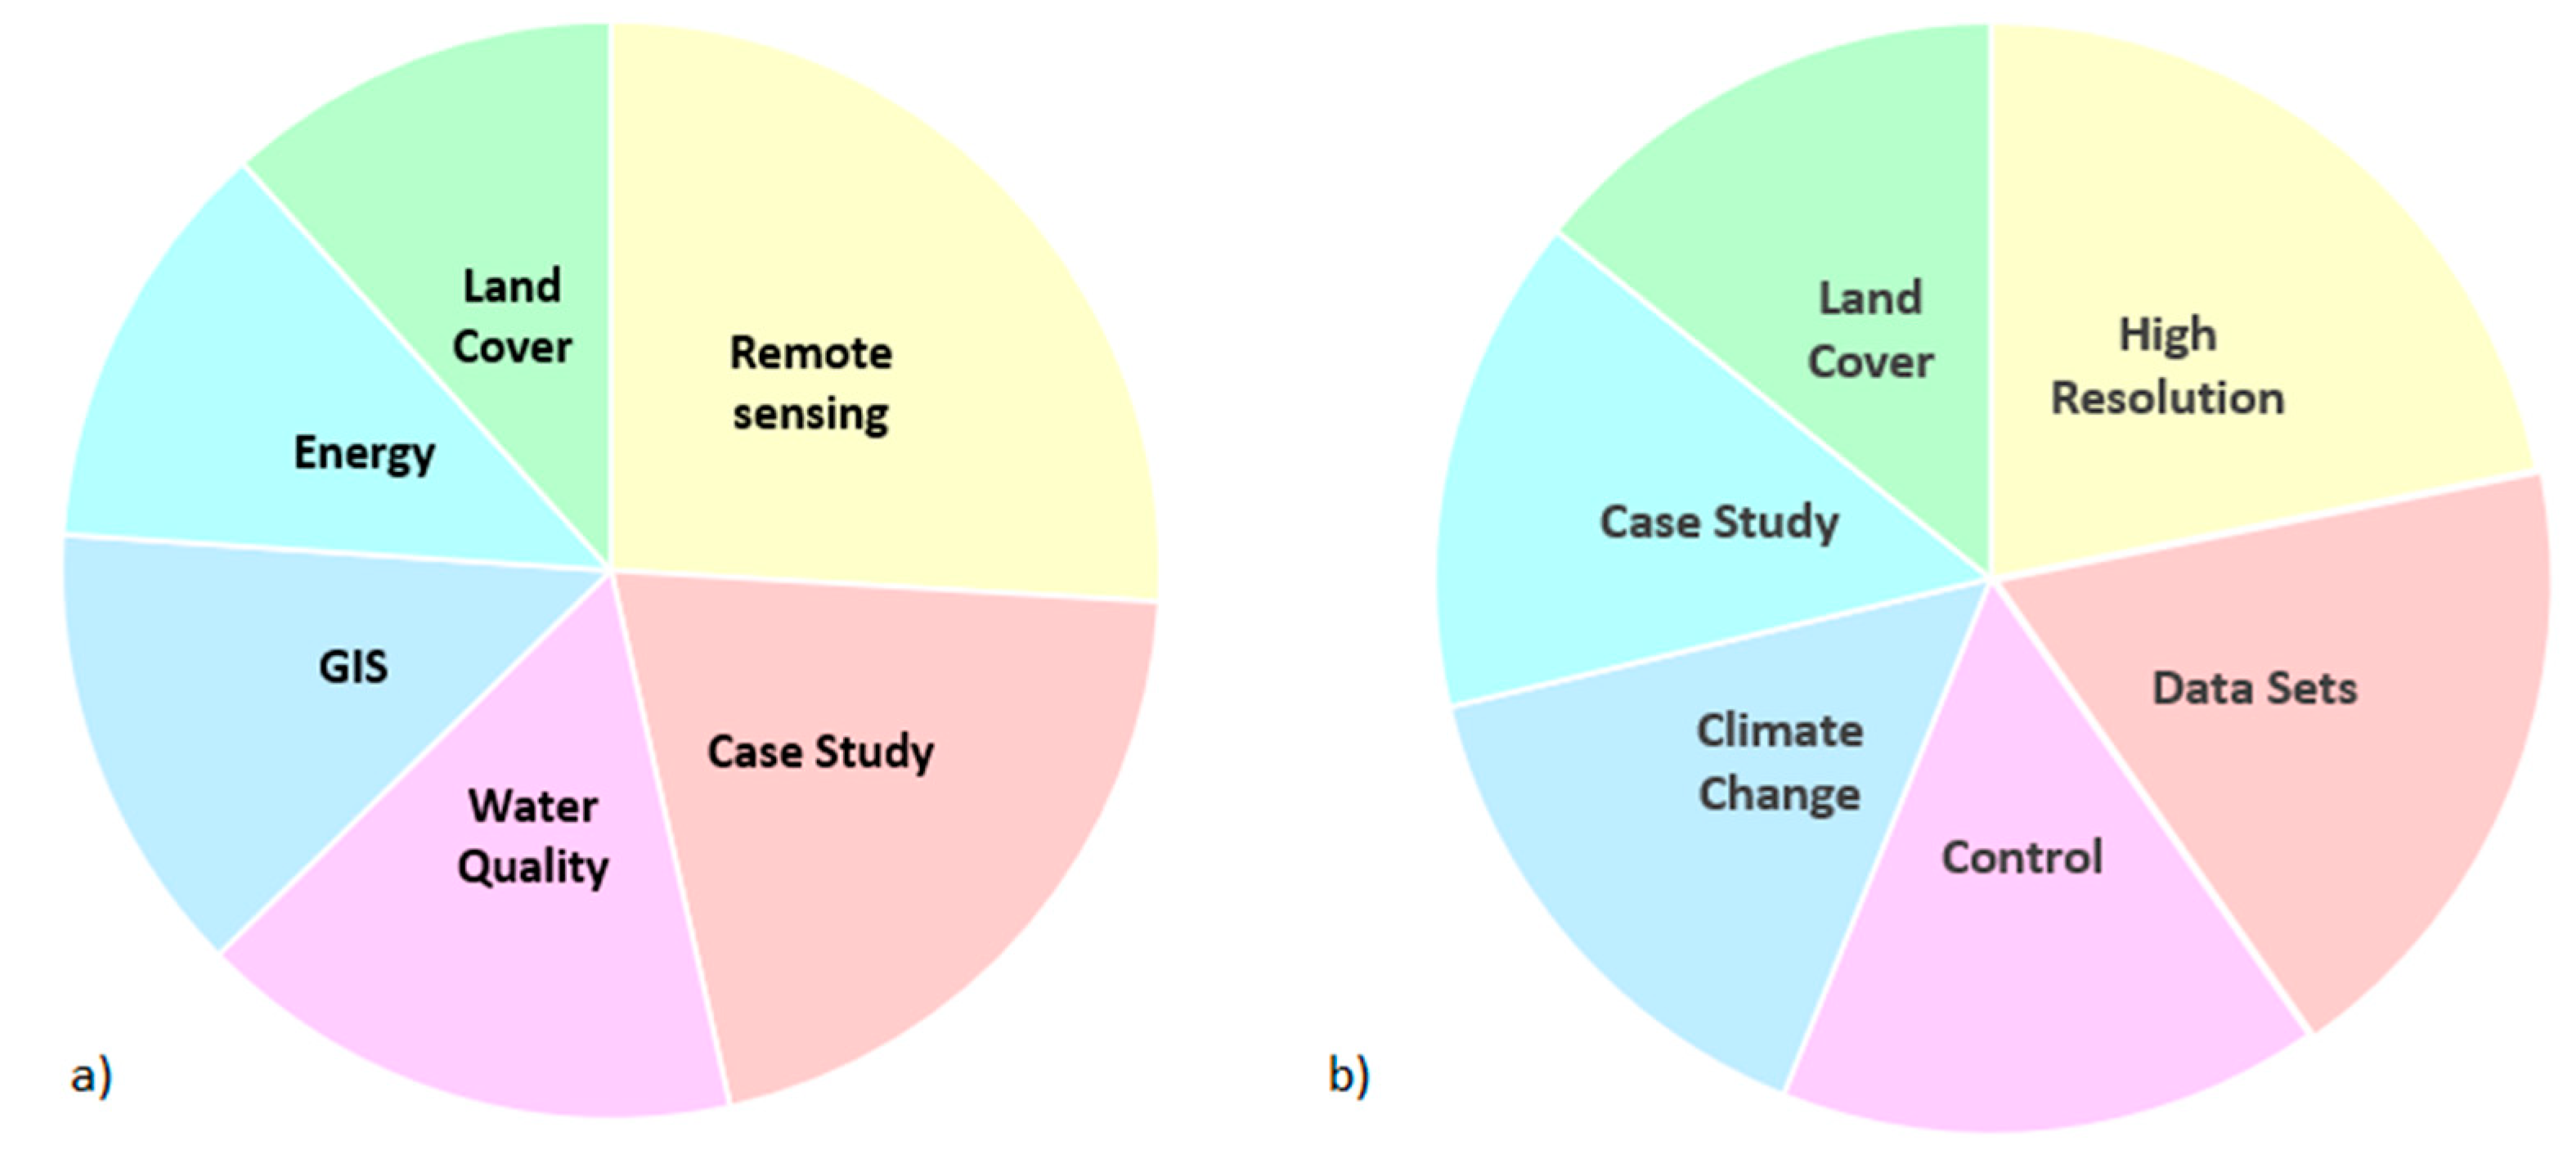
  • Current problems related to the low use of UAVs: In this Special Issue, we encountered that most of the papers are based on satellite image sources. Nonetheless, we expect that in the near future, drones will have an even more relevant role in remote sensing and the digitalization of different environmental aspects. In fact, UAVs have appeared as a relevant subtopic in remote sensing and environmental monitoring papers in the last three years, as seen in Figure 3. The inclusion of multispectral or hyperspectral cameras in the drones will allow better environmental monitoring. Similar to the inclusion of multispectral cameras, the inclusion of other capabilities such as light detection and ranging (LiDAR) or radar sensing systems might be included in UAVs in the next few years. The last limitation identified through the review of the literature is the low battery time of these devices, especially of the smallest and cheapest ones. Since the efficiency of existing energy harvesting systems does not allow for their inclusion in the UAVs to expand their battery life, new options should probably be studied. The topic of energy limitation on drones was recently studied in [26], in which the authors conclude that drone-to-drone charging or fuel-based drones might be some of the possible solutions.
  • Future challenges linked to the higher use of UAVs: One of the major problems related to UAV use is that due to the great variability of environmental conditions, constraints, and variables, the proposed solutions might only be applied in other cases. Thus, it is almost impossible to develop operation algorithms which can be applied universally under all scenarios [27]. Nonetheless, it is important to follow a systematic approach in order to find the best practices to be applied in other use cases. Combining images from satellites or drones with on-land or underground sensors such as Internet of Things devices will create diverse and heterogeneous networks that will provide data for different uses. The data we will have in the future, characterized by higher resolutions and the joining together of different data sources, will be used for new applications which are currently unexploited. Since we cannot foresee the characteristics or requirements for future applications, identifying the best practices and continuing systematic approaches to the current case studies is essential. Nonetheless, some examples include how remote sensing and on-ground sensors are used for detecting and verifying wildfires [28].
  • The storage problem and its relationship with energy: One of the future challenges that we will need to face in this area, particularly linked to the use of UAVs, will be the storage requirements needed to save all the generated data. The storage and operational requirements for analyzing vast volumes of monitoring data were already mentioned for GIS systems in [29] in 2016. The use of multispectral cameras in combination with land-based sensors and LiDAR will exacerbate the problems related to storage requirements. It must be noted that storing, processing, and particularly, sending data are activities with high energy consumption. Recently, some scientists have included their carbon footprint in data management [30]. Therefore, we can expect certain sorts of limitations in the future regarding data storage. Minimizing the stored and analyzed data without reducing the information contained in the data will be essential. Some efforts in this area can be seen in [31].
  • GIS and data visualization: The way in which data is presented to the end-users and the stakeholders is very important. To maximize the impact of the research about remote sensing and GIS on society, the visualization of data in the correct environment is very important. Most of the current software used to analyze the data is not optimal for data visualization. Some efforts are made in several papers to try and create user-friendly and flexible computing environments, such as [32].
  • Intelligent UAVs and real-time data analyses: Another aspect that will modify how remote sensing and GIS are used for environmental monitoring is the inclusion of adaptative and intelligent operation algorithms in the UAVs. Nowadays, most UAVs are being operated remotely by a person. The advances in autonomous vehicles will soon impact the autonomous flying of UAVs. Including this artificial intelligence will enhance the monitoring capabilities of these devices. They will be able to adjust their operation (flying velocity or flying height) according to the results of the gathered images. To do so, we will need powerful computational capability nodes in the UAVs that can analyze the gathered images in real time to decide if they need to modify their operational algorithm.

Funding

This research received no external funding.

Conflicts of Interest

The author declares no conflict of interest.

References

  1. World Wide Science Website. Available online: https://worldwidescience.org/ (accessed on 26 July 2022).
  2. Chawla, I.; Karthikeyan, L.; Mishra, A.K. A review of remote sensing applications for water security: Quantity, quality, and extremes. J. Hydrol. 2020, 585, 124826. [Google Scholar] [CrossRef]
  3. Wei, X.; Chang, N.B.; Bai, K.; Gao, W. Satellite remote sensing of aerosol optical depth: Advances, challenges, and perspectives. Crit. Rev. Environ. Sci. Technol. 2020, 50, 1640–1725. [Google Scholar] [CrossRef]
  4. Babaeian, E.; Sadeghi, M.; Jones, S.B.; Montzka, C.; Vereecken, H.; Tuller, M. Ground, proximal, and satellite remote sensing of soil moisture. Rev. Geophys. 2019, 57, 530–616. [Google Scholar] [CrossRef]
  5. Sishodia, R.P.; Ray, R.L.; Singh, S.K. Applications of remote sensing in precision agriculture: A review. Remote Sens. 2020, 12, 3136. [Google Scholar] [CrossRef]
  6. Pérez-Castro, M.Á.; Schubert, N.; De Oca, G.A.M.; Leyte-Morales, G.E.; Eyal, G.; Hinojosa-Arango, G. Mesophotic Coral Ecosystems in the Eastern Tropical Pacific: The current state of knowledge and the spatial variability of their depth boundaries. Sci. Total Environ. 2022, 806, 150576. [Google Scholar]
  7. Lechner, A.M.; Foody, G.M.; Boyd, D.S. Applications in remote sensing to forest ecology and management. One Earth 2020, 2, 405–412. [Google Scholar] [CrossRef]
  8. Noor, N.M.; Abdullah, A.; Hashim, M. Remote sensing UAV/drones and its applications for urban areas: A review. In IOP Conference Series: Earth and Environmental Science; No. 1; IOP Publishing: Bristol, UK, 2018; Volume 169, p. 012003. [Google Scholar]
  9. Estoque, R.C. A review of the sustainability concept and the state of SDG monitoring using remote sensing. Remote Sens. 2020, 12, 1770. [Google Scholar] [CrossRef]
  10. Trofymchuk, O.; Klymenko, V.; Anpilova, Y.; Sheviakina, N.; Zagorodnia, S. The aspects of using GIS in monitoring of environmental components. Int. Multidiscip. Sci. GeoConf. SGEM 2020, 20, 581–588. [Google Scholar]
  11. Manfreda, S.; McCabe, M.F.; Miller, P.E.; Lucas, R.; Pajuelo Madrigal, V.; Mallinis, G.; Toth, B. On the use of unmanned aerial systems for environmental monitoring. Remote Sens. 2018, 10, 641. [Google Scholar] [CrossRef]
  12. El Mahrad, B.; Newton, A.; Icely, J.D.; Kacimi, I.; Abalansa, S.; Snoussi, M. Contribution of remote sensing technologies to a holistic coastal and marine environmental management framework: A review. Remote Sens. 2020, 12, 2313. [Google Scholar] [CrossRef]
  13. Reinermann, S.; Asam, S.; Kuenzer, C. Remote sensing of grassland production and management—A review. Remote Sens. 2020, 12, 1949. [Google Scholar] [CrossRef]
  14. Li, J.; Pei, Y.; Zhao, S.; Xiao, R.; Sang, X.; Zhang, C. A review of remote sensing for environmental monitoring in China. Remote Sens. 2020, 12, 1130. [Google Scholar] [CrossRef]
  15. Colpaert, A. Satellite and UAV platforms, remote sensing for geographic information systems. Sensors 2022, 22, 4564. [Google Scholar] [CrossRef] [PubMed]
  16. Lin, L.; Hao, Z.; Post, C.J.; Mikhailova, E.A.; Yu, K.; Yang, L.; Liu, J. Monitoring land cover change on a rapidly urbanizing island using Google Earth Engine. Appl. Sci. 2020, 10, 7336. [Google Scholar] [CrossRef]
  17. Li, Y.; Wu, D.; Yang, L.; Zhou, T. Declining Effect of Precipitation on the Normalized Difference Vegetation Index of Grasslands in the Inner Mongolian Plateau, 1982–2010. Appl. Sci. 2021, 11, 8766. [Google Scholar] [CrossRef]
  18. Carreño-Conde, F.; Sipols, A.E.; de Blas, C.S.; Mostaza-Colado, D. A forecast model applied to monitor crops dynamics using vegetation indices (Ndvi). Appl. Sci. 2021, 11, 1859. [Google Scholar] [CrossRef]
  19. Mauri, P.V.; Parra, L.; Mostaza-Colado, D.; Garcia, L.; Lloret, J.; Marin, J.F. The Combined Use of Remote Sensing and Wireless Sensor Network to Estimate Soil Moisture in Golf Course. Appl. Sci. 2021, 11, 11769. [Google Scholar] [CrossRef]
  20. Domazetović, F.; Šiljeg, A.; Marić, I.; Faričić, J.; Vassilakis, E.; Panđa, L. Automated Coastline Extraction Using the Very High Resolution WorldView (WV) Satellite Imagery and Developed Coastline Extraction Tool (CET). Appl. Sci. 2021, 11, 9482. [Google Scholar] [CrossRef]
  21. Yao, H.; Huang, Y.; Wei, Y.; Zhong, W.; Wen, K. Retrieval of Chlorophyll-a Concentrations in the Coastal Waters of the Beibu Gulf in Guangxi Using a Gradient-Boosting Decision Tree Model. Appl. Sci. 2021, 11, 7855. [Google Scholar] [CrossRef]
  22. Fortelli, A.; Fedele, A.; De Natale, G.; Matano, F.; Sacchi, M.; Troise, C.; Somma, R. Analysis of sea storm events in the Mediterranean sea: The case study of December 28th 2020 sea storm in the Gulf of Naples, Italy. Appl. Sci. 2021, 11, 11460. [Google Scholar] [CrossRef]
  23. Agapiou, A. Estimating proportion of vegetation cover at the vicinity of archaeological sites using sentinel-1 and-2 data, supplemented by crowdsourced openstreetmap geodata. Appl. Sci. 2020, 10, 4764. [Google Scholar] [CrossRef]
  24. Almansi, K.Y.; Shariff, A.R.M.; Abdullah, A.F.; Syed Ismail, S.N. Hospital site suitability assessment using three machine learning approaches: Evidence from the gaza strip in Palestine. Appl. Sci. 2021, 11, 11054. [Google Scholar] [CrossRef]
  25. García, L.; Parra, L.; Jimenez, J.M.; Lloret, J.; Mauri, P.V.; Lorenz, P. DronAway: A proposal on the use of remote sensing drones as mobile gateway for WSN in precision agriculture. Appl. Sci. 2020, 10, 6668. [Google Scholar] [CrossRef]
  26. Mohsan, S.A.H.; Othman, N.Q.H.; Khan, M.A.; Amjad, H.; Żywiołek, J. A Comprehensive Review of Micro UAV Charging Techniques. Micromachines 2022, 13, 977. [Google Scholar] [CrossRef] [PubMed]
  27. Tmušić, G.; Manfreda, S.; Aasen, H.; James, M.R.; Gonçalves, G.; Ben-Dor, E.; McCabe, M.F. Current practices in UAS-based environmental monitoring. Remote Sens. 2020, 12, 1001. [Google Scholar] [CrossRef]
  28. Lloret, J.; Garcia, M.; Bri, D.; Sendra, S. A wireless sensor network deployment for rural and forest fire detection and verification. Sensors 2009, 9, 8722–8747. [Google Scholar] [CrossRef]
  29. Cheremisina, E.N. New Gis-Technologies for Environmental Monitoring and Nature-Use Problems. Исследoвания Пo Геoинфoрматике: Труды Геoфизическoгo Центра Ран 2016, 2, 4. [Google Scholar]
  30. Agarwal, A.; Agarwal, K.; Misra, G. Is internet becoming a major contributor for global warming-the online carbon footprint. J. Inf. Technol. Digit. World 2020, 2, 217–220. [Google Scholar] [CrossRef]
  31. Parra, L.; Mostaza-Colado, D.; Yousfi, S.; Marin, J.F.; Mauri, P.V.; Lloret, J. Drone RGB images as a reliable information source to determine legumes establishment success. Drones 2021, 5, 79. [Google Scholar] [CrossRef]
  32. Yue, P.; Zhang, M.; Tan, Z. A geoprocessing workflow system for environmental monitoring and integrated modelling. Environ. Model. Softw. 2015, 69, 128–140. [Google Scholar] [CrossRef]
Figure 1. Published papers on the topics included over the last two decades. Note that the number of papers in 2022 was obtained at the end of July 2022.
Applsci 12 08045 g001
Figure 2. Most repeated topics of papers published for (a) GIS + environmental monitoring and (b) remote sensing + environmental monitoring in the last decade according to [1].
Applsci 12 08045 g002
Figure 3. Most repeated topics and subtopics of papers published for (a) GIS + environmental monitoring and (b) remote sensing + environmental monitoring in the last three years according to [1].
Applsci 12 08045 g003
Publisher’s Note: MDPI stays neutral with regard to jurisdictional claims in published maps and institutional affiliations.

