1. Introduction
The current construction industry has made great progress through the accumulation of various computer programs and construction data, including computer aided design (CAD) [
1]. However, compared with the manufacturing sector, labor productivity is low, except in the construction industry [
1,
2]. Artificial intelligence (AI) must be used to improve areas of architecture that are considered human aspects by intelligent computer systems to increase productivity. However, the level of AI research and technology development in the field of architectural design is only at the level of research for optimizing and streamlining tasks in the design-construction phase or automation of some simple architectural designs. The development of artificial related technologies based on design uniqueness is insufficient [
3].
In this study, we determined that large scale façade datasets can be constructed with considerably less effort than any other methods by applying AI. One of the most important causes of the low level of research AI in the field of architecture is the lack of quantified constructed datasets, which are essential components of artificial neural network learning [
4]. Currently, the data in the field of architectural design are mixed in various data formats such as drawings, images, and texts. Most of the available design information accumulated in the existing field of architectural planning is qualitative and depends on the expert knowledge of construction workers [
5]. Therefore, in order to use construction datasets for AI research, it is essential to quantify the design knowledge and express it in a form that can be recognized by a computer. Advanced research on AI-based construction technology requires the quantitative construction of architectural construction datasets as the initial step.
Building information modeling (BIM) technology, which is an architectural information management platform, is an important vehicle for connecting distributed construction data to digital models. BIM building information can be managed in a form that can be recognized by a computer. However, BIM models are limited in their utilization to the BIM process [
6]. However, unlike special processes such as BIM, there is a way to build and utilize large amounts of data without investing a lot of time and capital through machine learning and by using public data released by governments in various countries [
7]. An example of a machine-learning-based technology is Urbanbase, which automatically converts 2D drawings to 3D models [
8]. In this study, we determined that large scale façade datasets can be constructed with considerably less effort than any other methods by applying deep learning technology and utilizing non-quantified street façade images existing in road-view images generated from web portals such as Google Street View [
9] and Naver Street View [
10].
By utilizing the constructed datasets, a façade database can be constructed to identify the characteristics of the façade designs of buildings on a selected street, and the façade design information can be extracted directly from this database. Additionally, the constructed database can be used in various related fields. The façade data were directly collected through road-view images and automatically labeled using deep learning. Through this process, a method for efficiently constructing façade datasets was proposed. Simultaneously, we examined the applicability of the façade datasets in calculating the amount of data required by the façade database to determine the design characteristics of the streets in Dongseong-ro, Daegu Metropolitan City.
2. Background and Related Work
For a computer to be able to recognize visual information at the same level as humans, it is necessary to construct and learn the same amount of data that humans have accumulated over the years through their eyes. To this end, Fei-Fei (2009) built an image dataset called the ImageNet project, which has labeled approximately 1 billion images in 167 countries with 50,000 people. Therefore, the computer was able to provide a basis for recognizing visual information [
11]. However, the ImageNet project had a vast array of general objects and information but was limited in the number of architectural objects and information; therefore, it is difficult to apply it in the construction field. The construction of a construction-specialized image dataset that labels construction information in relation to construction-related objects is an essential early step in this process. Hence, it is necessary to build big data from various mixed data formats, such as drawings, images, and text, in the construction field and convert these into a construction dataset to utilize in construction AI research. Accordingly, this section examines construction dataset cases and studies related to façade labeling, and describes the research gap between previous studies and this study.
2.1. Construction Datasets
Park (2006) built a building façade database manually to manage and provide the color of the façade. Using this, the information of the façade was calculated and the color characteristics of each façade composition type were summarized and analyzed.
Park (2007) manually built a building façade database to provide quantified data. Using this, the information of the façade was calculated to interpret the characteristics of the current color range of the existing street side building façade and the color range for each street was presented through the setting of the color evaluation model.
As described above, to understand the characteristics of the façade, the existing research in
Table 1 mainly needs to collect the façade image of the building by directly photographing it with a camera, calculating information through manual operation, and collecting data to establish a database. However, this method is considered costly and time-consuming given the need to construct a building façade database of more than block units; therefore, it is necessary to reduce the effort of a part or all of the existing database construction process through automation. Therefore, we examine research related to façade labeling, a method to reduce the existing database construction process.
2.2. Façade Labeling Related Research
As such, previous studies on architectural elements using computer vision technology were mainly conducted to construct spatial information indoors and outdoors. In the case of building façade automatic labeling research, the main area of study in the field of computer vision was the automatic generation of 3D modeling based on the façade or improvement of façade labeling performance, and it is difficult to find a data collection for architectural design research. It was confirmed that studies No. 5 and 6 in
Table 2 used the CMP database as training data, and these two studies recorded the highest performance. This shows that the CMP database satisfies an accurate and large amount of training data, a prerequisite for improving the building façade automatic labeling performance.
Image processing methods include image classification, localization/detection, and image segmentation, as shown in
Table 3 [
17].
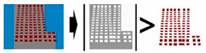
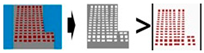
In calculating the façade information, the prediction of multiple labels and the width of the object are necessary. As shown in
Figure 1, semantic segmentation is most suitable for the automatic label of the façade image that requires information such as the area and number of the same class. Semantic segmentation classifies each pixel according to a specified class and does not distinguish objects of the same class, whereas instance segmentation distinguishes each object when the labels are distinguished.
2.3. Research Gap
Previous studies mainly collected façade images through camera photography to construct databases, but in this study, a significant part of the database construction process was shortened through automation. In the case of façade automatic image labeling studies, the façade-based automatic 3D modeling has been mainly studied, but it is difficult to find a study to extract data for façade design research.
3. Research Methodology
3.1. Research Direction
In this study, we attempted to automatically label façade images to quickly generate large-scale façade datasets with much less effort than by the existing research methods. Therefore, the main direction of this study is to utilize deep learning technology to accurately auto-label non-quantified street façade images existing in road-view images generated from web portals such as Google Street View [
9] and Naver Street View [
10]. It is also necessary to verify that the required data can be obtained using the façade database to identify the characteristics of the building design on the street.
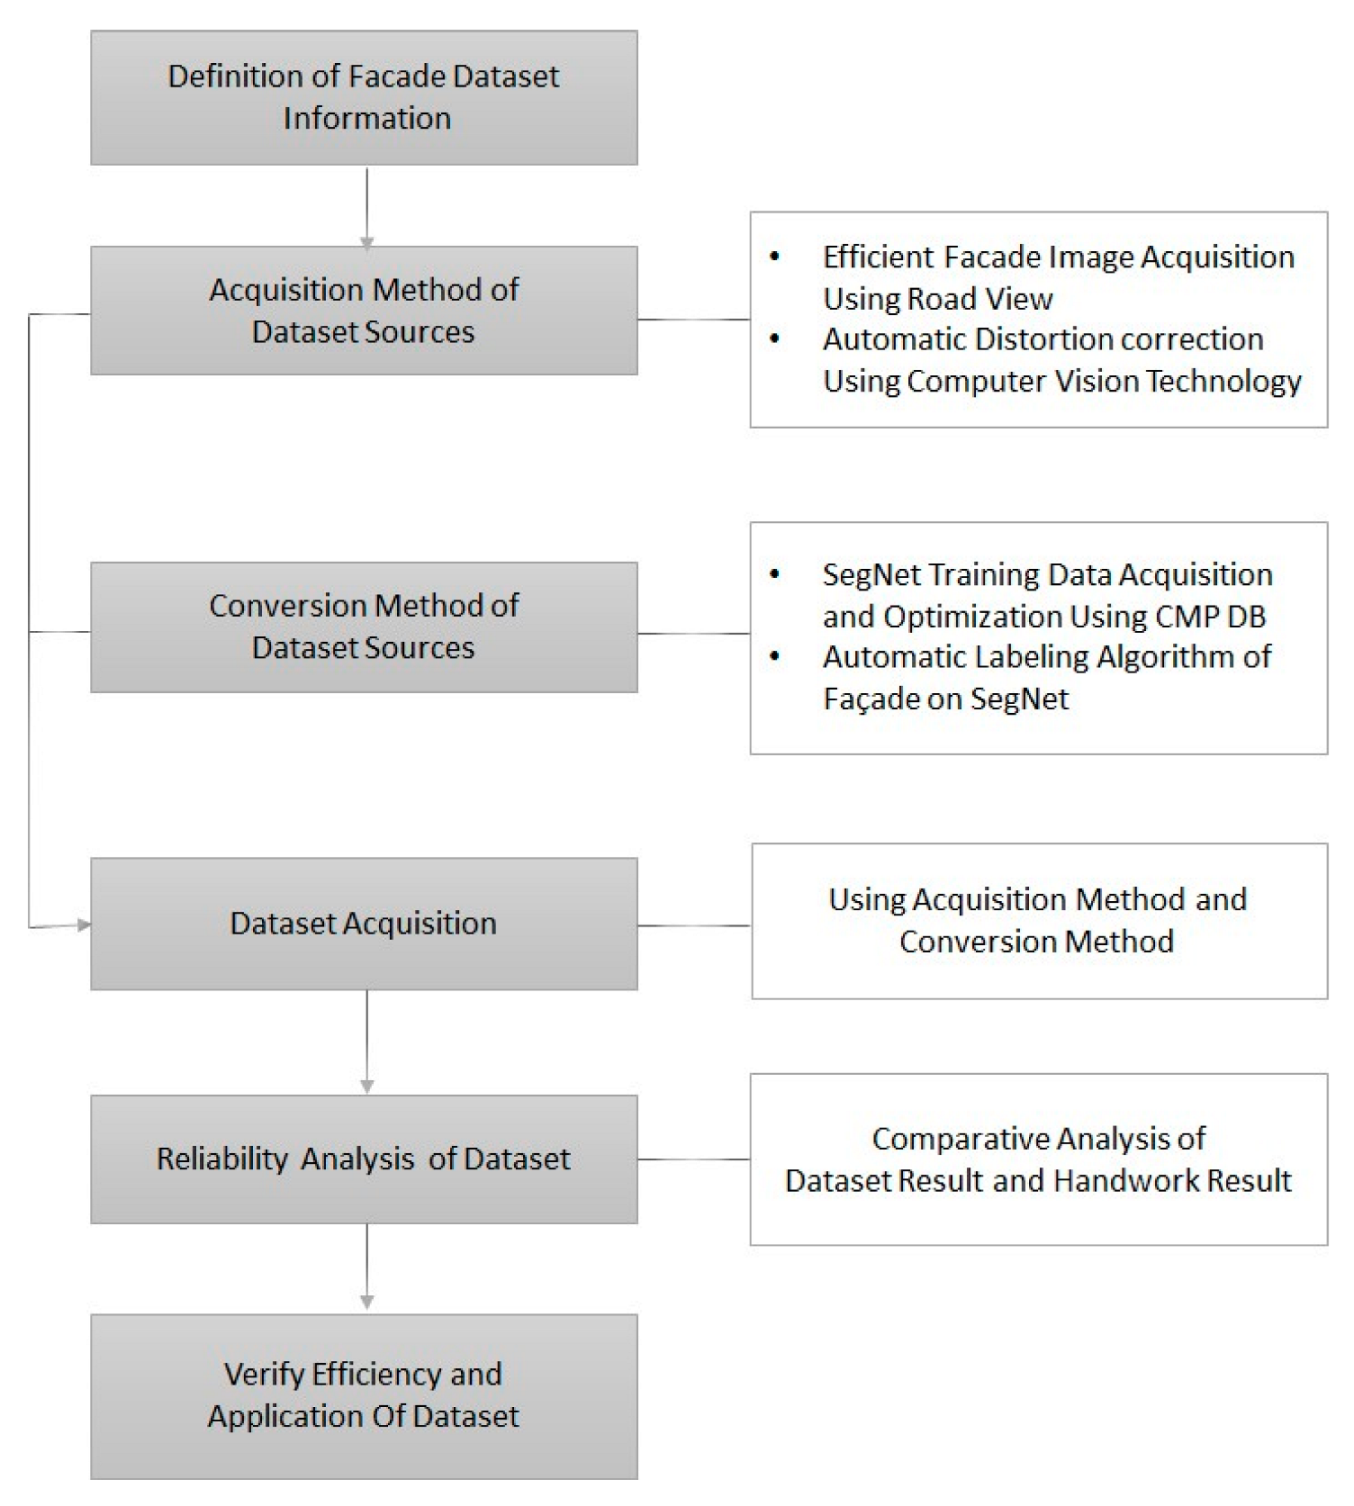
The direction of this research, shown in
Figure 2, was as follows:
Definition of Façade Dataset Information
Defining the required information in a dataset based on the existing characteristics of the façade.
Acquisition Method of Dataset Sources
Selection of the source of the dataset from road-view images and image distortion correction technology.
Conversion Method of Dataset Sources
For the selection of converted datasets using deep learning model-based automatic labeling technology, the road-view images were corrected using image distortion technology, which was converted into computer-recognizable datasets. The deep learning method included the SegNet model training data acquisition using the CMP database [
18], training data optimization, and securing a façade automatic labeling algorithm based on the SegNet model [
19].
Dataset Acquisition
Dataset was secured according to the conversion and acquisition methods
Reliability Analysis of Dataset
A reliability analysis was conducted by comparing the façade information obtained with ground truth on the four categories (Dominant color, Secondary Color, Number of Floors, Number of Buildings) of façade information that can be calculated through the datasets.
Verify Efficiency and Application of Dataset
Dataset efficiency verification and utilization involved validation of façade dataset efficiency based on reliability analysis and derivation of a means to utilize the information, which can be calculated from the datasets.
3.2. SegNet Model
Vijay Badrinarayanan, Alex Kendall, and Roberto Cipolla investigated the deep learning-based image automatic labeling method using semantic segmentation and concluded that among other models, the SegNet model [
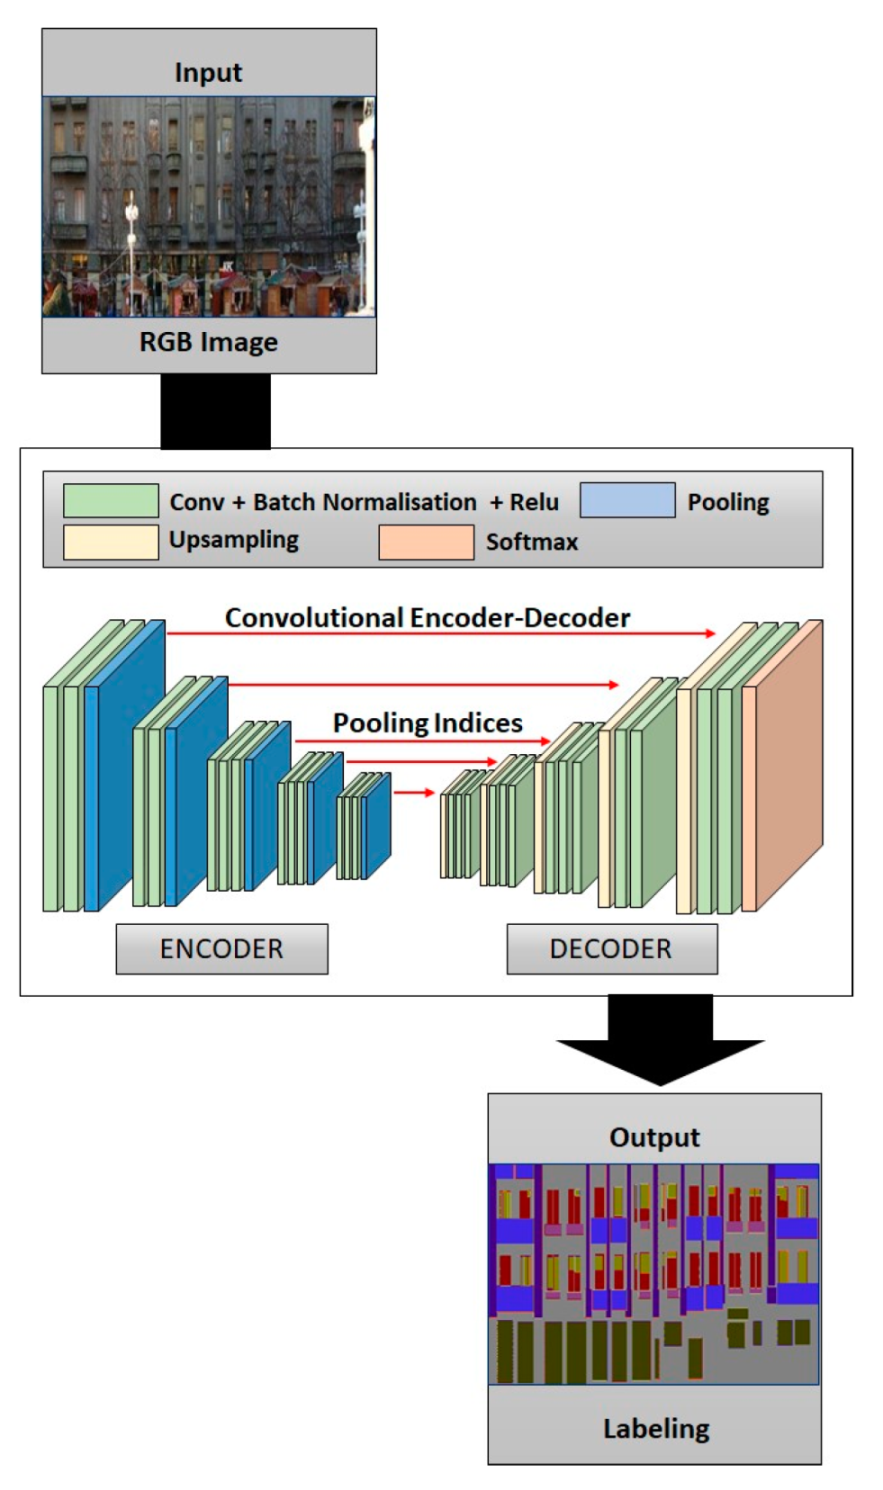
19] had a higher performance in terms of accuracy. Models primarily used for classification, such as VGG and AlexNet, maintain a layer that reduces the number and dimension of parameters and consequently loses some location information. However, the SegNet model efficiently preserves the location information using the encoder and decoder structure. As shown in
Figure 3, the encoder and decoder structures output the image compressed through the encoder and are labeled with each pixel according to the designated class [
19].
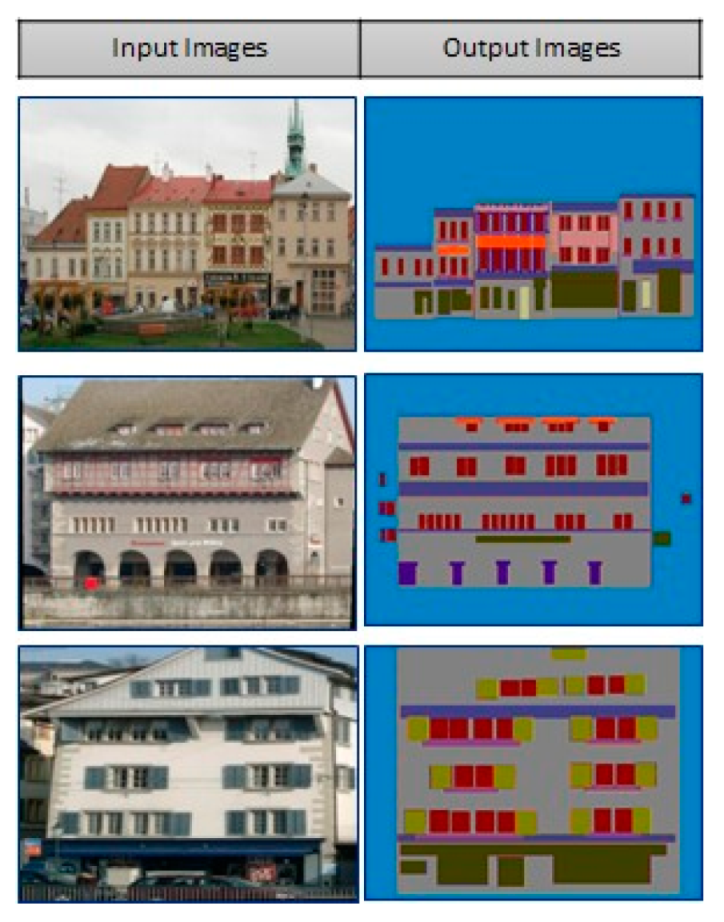
Figure 4 shows the input and output labels according to the specified class.
To implement automatic labeling of images based on the SegNet model, a high level of programming knowledge is required, but various frameworks, such as Tensorflow, Pytorchzky, and Caffe, are available to make this easier. Among these, TensorFlow is the most often-used framework in image processing.
In this study, we implemented an automatic image-labeling algorithm based on the SegNet model using TensorFlow.
3.3. CMP Database
The higher the amount of correctly labeled data, the greater are learning results. According to previous studies, as shown in
Table 2. Automatic labeling of the façade based on machine learning showed that the CMP database, which is considered to possess a relatively large amount of data and contains information on façades, was used as training data. Therefore, we used the CMP database as training data to obtain an accurate and large number of datasets in this study.
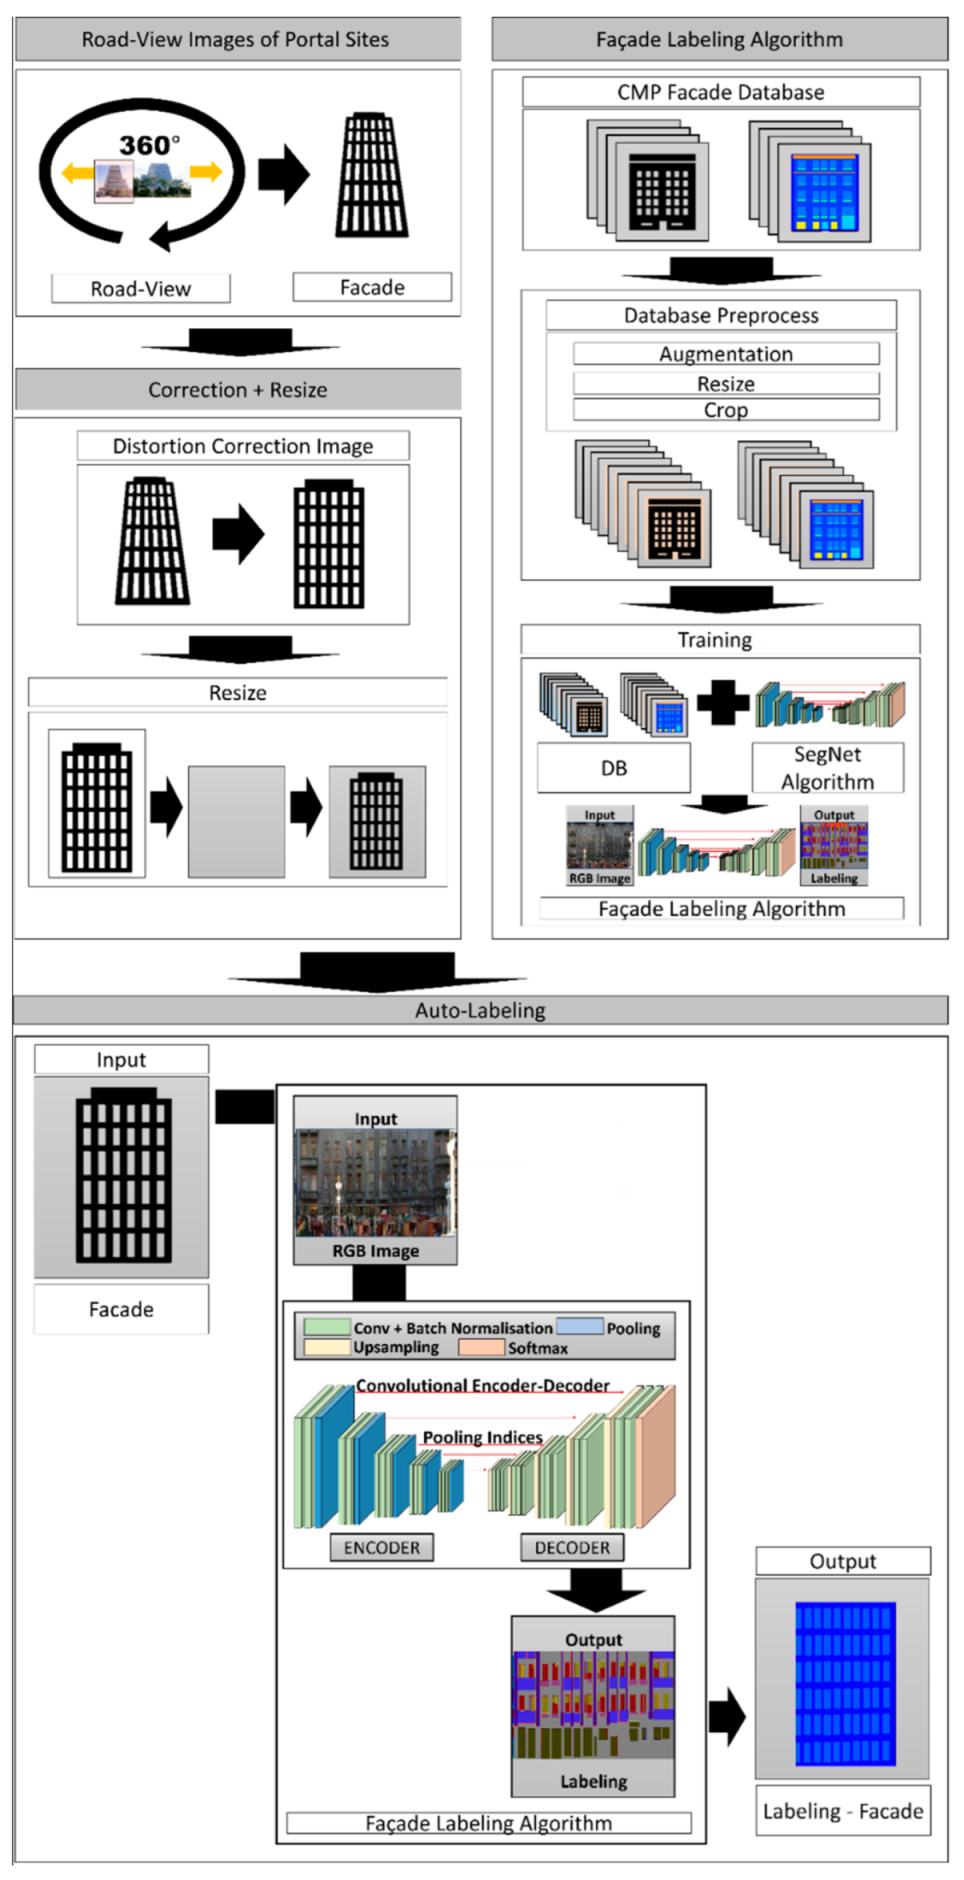
4. Framework
The ultimate purpose of this study was to propose a construction method that vastly reduces the build-up period for the construction of façade datasets by applying artificial intelligence technologies such as deep learning. The framework of the proposed construction method is presented in
Figure 5 and consists of five modules.
4.1. Module 1: Raw Data Collection
In this study, façade images extracted from road-view images were used as raw data for the construction of the datasets. This is because images of buildings worldwide, including domestic ones, are being updated regularly, and most façade images overlooking the street can be secured. However, because the road-view images were obtained through a 360° camera, perspective distortion occurred, as shown in
Figure 6 and
Figure 7. A correction method must therefore be devised [
9,
10].
4.2. Module 2: Image Distortion Correction
To use the portal site road view as the façade data for buildings, there are two methods: labeling after performing distortion correction, as shown in
Figure 6, and labeling directly in a distorted image state. In the latter case, there is the advantage of not having to go through the process of photo distortion correction, but there are disadvantages, such as the degree of distortion of the façade image being different from the road-view images. Hence, the amount of training data needs to be increased. In this study, as a result of testing the labeling accuracy of both methods, the accuracy of the former was higher. Therefore, the former method of undergoing a distortion correction process was used [
10].
Image distortion correction requires an understanding of image processing and the overall camera system, but various tools have been provided to make it easier to process images.
Adobe’s Lightroom [
21] is the most commonly used tool for correcting image distortion. In addition, an automatic distortion-correction function is provided that reduces the processing time. In this study, the image distortion correction process was performed using Lightroom.
4.3. Module 3: Image Distortion Correction
In this study, a database containing both façade information and the corresponding labeling image was used as training data. As shown in
Table 4, the façade information of the building was limited to the dominant color, secondary color, number of floors, and number of buildings [
22].
The CMP database [
23] consists of the 12 most basic (Wall, Molding, Cornice, Pillar, Window, Door, Sill, Blind, Balcony, Shop, Deco, and Background) classes of façades with approximately 600 labeled data inputs. In this study, among the 12 classes, except for the class with little influence on calculating the façade information, similar classes were combined and re-designated into four classes. The redesigned classes are shown in
Table 5 [
18].
4.4. Module 4: Training Data Optimization
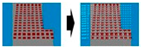
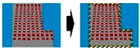
CMP databases with re-designated classes require preprocessing to ensure optimal learning in the SegNet model. Pre-processing operations consist of resizing operations to meet the input value conditions of the SegNet model, as shown in
Figure 8, crop operations to remove elements that impair the quality of the image to make the image similar to the actual environment, and augmentation operations to increase the effectiveness of learning by increasing training data by horizontally reversing the image or adjusting the gamma value [
19].
4.5. Module 5: Test Data Selection
In this study, a part of Dongseong-ro, Daegu Metropolitan City, which is a central commercial street, was used as the test data. The building façade information was limited to buildings with low noise, such as street trees. Elements such as trees that generated a high level of noise were excluded.
The selected building images were collected according to the raw data collection method, and the collected images were distorted and corrected to obtain test data. Because the test data were also needed to calculate the optimal information from the automatic façade image labeling algorithm based on the SegNet model, the resize and crop task was performed during the preprocessing operation conducted on the training data. In addition, a ground truth labeling image was required to measure the labeling accuracy of the test image and labeling.
5. Results
5.1. Façade Information Calculation Criteria
Using the labeling image obtained in the test data selection, the building façade information was calculated as follows in
Table 6:
Dominant color: Combines the area of the label of the same class to calculate the color of the corresponding façade image of the largest class as the dominant color.
Secondary color: The area of those labels of the same class is combined to calculate the color of the corresponding façade image of the second largest class as the secondary color.
Number of floors (building height): The entrance class is recognized as the ground floor and the level of the window class is recognized as each floor to calculate the number of floors.
Number of buildings: The number of buildings was divided by the number of wall classes divided by the background class.
5.2. Training Data Output and Analysis
In the CMP database, the SegNet model-based automatic façade image-labeling algorithm was tested on images that were not used for learning.
Table 7 shows the labeling image and output.
Table 8,
Table 9 and
Table 10 show the test results.
A total of 185 labeling tests were conducted using 37 test images and the results were analyzed. The time required for automatic labeling of the 37 images was 85.47 s, with each image being labeled in 2.31 s.
The mIoU in
Table 4 is an index indicating the accuracy of labeling for each class by comparing the ground truth image and the extracted labeling image, and was indicated as 1 when the accuracy was 100%.
Therefore, the reliability of the number and location of objects in each class can be checked, and the walls and backgrounds were most successfully labeled with a mIoU of 0.70 or higher.
In the case of windows, mIoU 0.66 showed relatively compliant accuracy. However, in the case of entries, mIoU 0.51 showed a relatively low accuracy compared to the labeling accuracy of other classes. The average mIoU for all classes was 0.63.
The pixel accuracy listed in
Table 5 is an index showing similarity between the two images by comparing all pixels of the ground truth image and the extracted labeling image. Thus, the reliability of the entire area of the extracted labeling image can be confirmed.
The accuracy of the façade information listed in
Table 10 is an index indicating the accuracy of the calculated information of the output labeled image by comparing the output labeling image and the ground truth image. The façade information accuracy was 0.84, which was higher than the pixel accuracy and mIoU of the CMP database. This is because the class mIoU of the walls and windows, which occupy an overwhelming proportion, was high among the classes produced by the dominant and secondary colors.
5.3. Test Data Output and Analysis
The test was conducted on the façade image (raw data) extracted from the road-view images and the results were analyzed. The test data were intended to determine if the pixel accuracy, mIoU, and façade information could be maintained and how it could be improved through distortion correction, even for characteristics that differed from the training data. Thirty façade images (referred to as original data) extracted from the original road views and 30 façade images (referred to as distortion correction data) extracted from the distortion-corrected road views were used as test data.
As shown in
Table 11 and
Table 12, when the original data and distortion correction data were compared, the average mIoU and pixel accuracy values of the distortion correction data were higher by an average of 0.05 and 0.09, respectively. In addition, as shown in
Table 13, the accuracy of the façade information was also 0.07 higher than that of the original. The results show that the distorted and corrected data can be effectively labeled using the CMP database compared with the original data.
In this study, we compared the CMP database and the distortion correction data by viewing the distortion correction data showing higher accuracy of the façade information as a representative image of the façade image extracted from road views. As shown in
Table 14 and
Table 15, the average mIoU and pixel accuracy values of the distortion correction data were lower than the CMP database by 0.09 and 0.02, respectively.
Table 16 shows the accuracy of the façade information obtained by the output and ground truth images. The accuracy of the façade information of the distorted and corrected data was lower than that of the CMP database by 0.09, but it was higher by 0.07, 0.04, and 0.09 in the secondary color, number of floors, respectively, and the number of buildings was 0.03 higher in the accuracy of the average façade information. This is a marginally different result from the mIoU and pixel accuracy values and is assumed to be the result of the façade characteristics of Dongsung-ro being tested. The façade characteristics of Dongseong-ro are as follows.
The accuracy of the secondary color calculation was high because the ratio of the area of the window class, which has a relatively high mIoU, is high and the color of the window is often calculated as a secondary color because it is included in the façade.
Compared to the CMP database, the shape of the window is clear and designed for each floor; therefore, the number of floors calculation accuracy of the building is high.
The boundaries between buildings were ambiguous in the CMP database, but the test data were clear. Therefore, despite the higher mIoU of the wall and background classes in the CMP database, the number of buildings calculation accuracy of the buildings in the test data was higher.
6. Discussion
6.1. Discussion of the Results
The resulting value of the revised version was higher than the original value for all indicators. This means that if there is distortion in the raw data image, the accuracy of the façade information can be improved through distortion correction. Conversely, it is clear that the mIoU and pixel accuracy affect the façade information accuracy, but the façade information accuracy varies depending on the data situation. It was confirmed that the factors that affect the accuracy of the façade information include the clarity of the shape of the class that appears in each image data, the clarity of the boundaries of each floor of the window class, and the clarity of the boundaries between buildings. Therefore, to increase façade information accuracy, it is necessary to obtain detailed learning criteria for mIoU and pixel accuracy and secure training data to increase mIoU and pixel accuracy depending on the characteristics of the data.
6.2. Limitations
Several limitations are acknowledged in this study. First, there was a limitation that made automatic labeling difficult, in the case of high noise such as street trees and streetlights. To this end, we are studying ways to increase the façade information accuracy calculation using NVDIA Image Inpainting [
24], a technology that automatically removes noise and by securing high-quality readings.
Secondly, the SegNet model exhibited low quality learning due to only using 600 images of the CMP database as training data. To this end, we will build large-scale databases by increasing the accuracy of labeling to a certain level from the road-view images.
These issues in part provide a general perspective to the limitations of the deep learning approach. The approach requires careful data collection and preparation.
6.3. Practical Implications
Researchers and the government can use façade automatic labeling-based façade recognition to extract the window ratio at a specific distance from the road-view images and thereby provide a basis for the window ratio as a demonstration of energy consumption. This will be comparable to the existing window ratio studies or government regulations. The architectural industry will be able to automatically collect façade images and use them to model them to develop the level of architectural services by promoting digital transformation of architecture.
Through digital transformation, this study will contribute to research that can extract exterior building information from city-scale architecture digitized on the 3D map in the opposite case [
25]. Furthermore, the application of window recognition methodology on road-view images using deep learning developed in this study will contribute to the development of a novel automated method for simulating the wind damage to building windows at the city-scale architecture [
26].
6.4. Directions for Future Work
In this study, we proposed the possibility of obtaining quantitative and qualitative façade design information by extracting patterns of façade design from anywhere in the world. In the future, based on improved labeling accuracy, we will build datasets of automatically labeled images from the road-view images for research on automated color collection and demonstration of energy consumption according to window area ratio [
1,
22,
27,
28,
29].
7. Conclusions
This study proposed a method for efficiently constructing façade datasets through the process of collecting façade data from road-view images and automatically labeling them using deep learning. The goal of this study was to automatically label façade images to quickly generate large-scale façade datasets with much less effort than the existing research methods. We tested the possibility of calculating the data required by the façade database to comprehend the design characteristics of the street.
The semantic segmentation method was used for automatic image labeling and a SegNet model with high performance in terms of accuracy was used. The labeling subjects in this study were walls, windows, entrances, and background. The façade information calculated was the dominant color, secondary color, number of floors, and number of buildings. Six hundred images of CMP database-based training data were used to train the SegNet model-based automatic image labeling algorithm and 30 road-view images were used to test the algorithms. The automatic labeling of the test images showed a result of one per 2.31 s. Automatic labeling and façade information calculation showed results of 0.54, 0.75, and 0.87 for mIoU, pixel accuracy, and accuracy of façade information, respectively.
This study confirmed that the computer could recognize the visual information of the façade image and calculate meaningful façade information of the road-view images at a high speed. In addition, the results of the automatic labeling and façade information analysis were analyzed using the method of calculating the façade information proposed in this study. Detailed criteria for the required mIoU and pixel accuracy values based on the characteristics of the data will be prepared and applied in further studies to increase the façade information accuracy calculation.
Author Contributions
H.G. conceived experiments, analyzed data, and wrote papers; S.C. investigated prior research and edited thesis; S.C. supervised the research. All authors have read and agreed to the published version of the manuscript.
Funding
This work is supported by the Korea Agency for Infrastructure Technology Advancement (KAIA) grant funded by the Ministry of Land, Infrastructure and Transport (Grant 22AATD-C163269-02). This research is a basic research project in the field of Ph.D. student research incentive project that was conducted with the support of the Korea Research Foundation with funding from the government (Future Creation Science) in 2021. Assignment number: NRF-2021R1A6A3A13045849.
Institutional Review Board Statement
Not applicable.
Informed Consent Statement
Not applicable.
Data Availability Statement
Not applicable.
Conflicts of Interest
The authors declare that they have no known competing financial interest or personal relationships that could have influenced the work reported in this study.
References
- Kim, T. Inter-Industry Labor Mobility and Changes of Labor Productivity in Korea. J. Ind. Econ. Bus. 2018, 31, 113–131. [Google Scholar]
- Jeong-Wook, S.; Yoon, J.-S.; Paek, J.H. A study on construction productivity measurement method. J. Archit. Inst. Korea 2003, 19, 101–108. [Google Scholar]
- Kang, I.S.; Moon, J.W.; Park, J.C. Recent research trends of artificial intelligent machine learning in architectural field-review of domestic and international journal papers. J. Archit. Inst. Korea Struct. Constr. 2017, 33, 63–68. [Google Scholar] [CrossRef]
- Choi, J. A study on the standardization strategy for building of learning data set for machine learning applications. J. Digit. Converg. 2018, 16, 205–212. [Google Scholar]
- Kim, W.Y. A Model for Construction Data Integration Based on Growth of Construction Object throughout the Overall Project Phases. In Proceedings of the Korean Institute of Construction Engineering and Management; Korea Institute of Construction Engineering and Management: Seoul, Korea, 2003; pp. 143–150. [Google Scholar]
- Kim, H.-J.; Ji, S.Y.; Jun, H. A Study on Application of Artificial Intelligence Technology to BIM Architectural Planning—Focus on Structural BIM Model in Early Design Phase. Korea Soc. Art Des. 2019, 22, 229–242. [Google Scholar]
- Available online: https://cloud.eais.go.kr/ (accessed on 1 May 2022).
- Available online: https://www.urbanbase.com/ (accessed on 1 May 2022).
- Available online: https://www.google.com/streetview/ (accessed on 1 May 2022).
- Available online: https://map.naver.com/v5/search?c=14371764.2994954,4182680.8899432,16,0,0,0,dha (accessed on 1 May 2022).
- Deng, J. A large-scale hierarchical image database. In Proceedings of the IEEE Computer Vision and Pattern Recognition, Miami, FL, USA, 20–25 June 2009. [Google Scholar]
- Teboul, O.; Simon, L.; Koutsourakis, P.; Paragios, N. Segmentation of building facades using procedural shape priors. In Proceedings of the 2010 IEEE Computer Society Conference on Computer Vision and Pattern Recognition, San Francisco, CA, USA, 13–18 June 2020; pp. 3105–3112. [Google Scholar]
- Martinović, A.; Mathias, M.; Weissenberg, J.; Van Gool, L. A three-layered approach to facade parsing. In European Conference on Computer Vision; Springer: Berlin/Heidelberg, Germany, 2012; pp. 416–429. [Google Scholar]
- Riemenschneider, H.; Krispel, U.; Thaller, W.; Donoser, M.; Havemann, S.; Fellner, D.; Bischof, H. Irregular lattices for complex shape grammar facade parsing. In Proceedings of the 2012 IEEE Conference on Computer Vision and Pattern Recognition, Providence, RI, USA, 16–21 June 2012; pp. 1640–1647. [Google Scholar]
- Jampani, V.; Gadde, R.; Gehler, P.V. Efficient facade segmentation using auto-context. In Proceedings of the 2015 IEEE Winter Conference on Applications of Computer Vision, Waikoloa, HI, USA, 5–9 January 2015; pp. 1038–1045. [Google Scholar]
- Gadde, R.; Jampani, V.; Marlet, R.; Gehler, P.V. Efficient 2D and 3D facade segmentation using auto-context. IEEE Trans. Pattern Anal. Mach. Intell. 2017, 40, 1273–1280. [Google Scholar] [CrossRef] [PubMed] [Green Version]
- Kim, B. Trend of Deep Learning-Based Image Classification Technology. J. Korean Inst. Commun. Sci. 2018, 8–14. [Google Scholar]
- Tylecek, R. The CMP Facade Database; Research Report CTU–CMP–2012–24; Czech Technical University: Prague, Czech, 2012. [Google Scholar]
- Badrinarayanan, V.; Kendall, A.; Cipolla, R. SegNet. A deep convolutional encoder-decoder architecture for image segmentation. arXiv 2015, arXiv:1511.00561. [Google Scholar] [CrossRef] [PubMed]
- Adobe. Lightroom. Available online: https://www.adobe.com/kr/products/photoshop-lightroom.html?sdid=4NM89C54&mv=search&mv2=CC|Naver|BrandSearch&s_kwcid=AL!3085!87!cf7b7fd015d18b1dc0ce1795fe9bb75d&ef_id=XnckVQAAAzhc_6x_:20200814043206:s (accessed on 1 May 2022).
- Available online: https://www.adobe.com/kr/products/photoshop-lightroom (accessed on 1 May 2022).
- Park, S.J.; Lim, K.C.; Lee, C.W. A Study on Types of Elevation Composition and Color Characteristics of Buildings by Urban Streetscape-Focused on the Building of Central Aesthetic Districts in Gwang-Ju. J. Archit. Inst. Korea Plan. Des. 2006, 22, 201–208. [Google Scholar]
- Tyleček, R.; Šára, R. Spatial pattern templates for recognition of objects with regular structure. In German Conference on Pattern Recognition; Springer: Berlin/Heidelberg, Germany, 2013; pp. 364–374. [Google Scholar]
- NVDIA’s IMAGE INPAINTING. Available online: https://research.nvidia.com/publication/2018-09_image-inpainting-irregular-holes-using-partial-convolutions/ (accessed on 1 May 2022).
- Shon, D.; Noh, B.; Byun, N. Identification and Extracting Method of Exterior Building Information on 3D Map. Buildings 2022, 12, 452. [Google Scholar] [CrossRef]
- Gu, D.; Chen, W.; Lu, X. Automated assessment of wind damage to windows of buildings at a city scale based on oblique photography, deep learning and CFD. J. Build. Eng. 2022, 52, 104355. [Google Scholar] [CrossRef]
- Lee, J.-H.; Choi, J.-Y.; Kim, J.-H. A Study on the Planning Method for Public Street Space Using Analysis of Façade Characteristics; Improving Project for Public Design in Daegu: Dongseong Street. J. Archit. Inst. Korea Plan. Des. 2010, 26, 29–36. [Google Scholar]
- Lee, K.H.; Ryu, J.R.; Choo, S.Y. A correlation analysis on’cooling and heating loads’ and’window to wall ratios’ in accordance with the form of simulation-based office towers-focused on BIM model at the early design stages. J. Archit. Inst. Korea Plan. Des. 2013, 29, 15–24. [Google Scholar]
- Lee, C.; Lee, G.; Won, J. A Comparative Study on Construction Productivity Trends as Analyzed by Various Measures-South Korea, the US, the UK, and Japan (1995–2015). J. Archit. Inst. Korea Struct. Constr. 2019, 35, 175–184. [Google Scholar]
Figure 1.
Concept of semantic segmentation and instance segmentation.
Figure 1.
Concept of semantic segmentation and instance segmentation.
Figure 2.
Research direction.
Figure 2.
Research direction.
Figure 3.
The SegNet architecture.
Figure 3.
The SegNet architecture.
Figure 4.
Automatic labeling using SegNet model.
Figure 4.
Automatic labeling using SegNet model.
Figure 5.
Framework of the proposed construction method.
Figure 5.
Framework of the proposed construction method.
Figure 6.
Road-View Image [
10].
Figure 6.
Road-View Image [
10].
Figure 7.
Distortion correction [
10,
20].
Figure 7.
Distortion correction [
10,
20].
Figure 8.
Optimize training data.
Figure 8.
Optimize training data.
Table 1.
Research related to façade database.
Table 1.
Research related to façade database.
| No | Author | Title |
|---|
| 1 | Park, Sung-Jin | A Study on Types of Elevation Composition and Color
Characteristics of Buildings by Urban Streetscape-Focused on the Building of Central Aesthetic Districts in Gwang-Ju-(2006) |
| 2 | Park, Sung-Jin | A Study on Establishing Color Ranges of Façade on Urban Central Street-Focusing on Buildings of Central Aesthetic District in Gwangju -(2007) |
Table 2.
Research related to façade segmentation.
Table 2.
Research related to façade segmentation.
| No | Author | Title |
|---|
| 1 | Boulaassal, H | Morphological segmentation of building façade images (2009) |
| 2 | Teboul, O | Segmentation of building façades using procedural shape priors (2010) |
| 3 | Martinović, A | A Three-Layered Approach to Façade Parsing (2012) |
| 4 | Riemenschneider, H | Irregular lattices for complex shape grammar façade parsing (2012) |
| 5 | Jampani, V | Efficient Façade Segmentation Using Auto-context (2015) |
| 6 | Jampani, V | Efficient 2D and 3D Façade Segmentation Using Auto-Context (2018) |
Table 3.
Automatic labeling technology analysis.
Table 4.
The Definition of façade information.
Table 4.
The Definition of façade information.
| Façade Information | Definition |
|---|
| Dominant Color | The largest color in the Façade |
| Secondary Color | The second largest color in the façade |
| Number of Floors | Single-story building (1st floor)/Low-rise building (2~3rd floor)
Medium-rise building (4–5 floors)/High-rise building (more than six floors) |
| Number of Buildings | Number of buildings facing the street in one horizontal block |
Table 5.
Class of training data.
Table 5.
Class of training data.
| Class of Training Data | Class of CMP DB |
|---|
| Walls | Façade (Wall) | (Grey) |
| Window | Windows | (Red) |
| Entrances | Shop + Door | (Green) |
| Background | Background | (Blue) |
Table 6.
Extraction of façade information.
Table 7.
Example of labeling.
Table 8.
mIoU of CMP test data.
Table 8.
mIoU of CMP test data.
| Class | mIoU |
|---|
| Walls | 0.70 |
| Windows | 0.66 |
| Entrances | 0.51 |
| Background | 0.72 |
| Average | 0.63 |
Table 9.
Pixel accuracy of CMP test data.
Table 9.
Pixel accuracy of CMP test data.
| Data | Pixel Accuracy |
|---|
| Average | 0.77 |
Table 10.
Façade information accuracy of CMP test data.
Table 10.
Façade information accuracy of CMP test data.
| Façade Information | CMP Test Data |
|---|
| Dominant Color | 0.92 |
| Secondary Color | 0.73 |
| The Number of Floors | 0.89 |
| The Number of Buildings | 0.81 |
| Average | 0.84 |
Table 11.
mIoU of original and distortion correction data.
Table 11.
mIoU of original and distortion correction data.
| Class | Original Data | Distortion Correction Data |
|---|
| Walls | 0.52 | 0.69 |
| Windows | 0.27 | 0.53 |
| Entrances | 0.338 | 0.50 |
| Background | 0.43 | 0.43 |
| Average | 0.39 | 0.54 |
Table 12.
Pixel accuracy of original and distortion correction data.
Table 12.
Pixel accuracy of original and distortion correction data.
| Test | Pixel Accuracy(Average) |
|---|
| Original Data | 0.66 |
| Distortion Correction Data | 0.75 |
Table 13.
Façade information accuracy of original and distortion correction data.
Table 13.
Façade information accuracy of original and distortion correction data.
| Façade Information | Original Data | Distortion Correction Data |
|---|
| Dominant Color | 0.80 | 0.83 |
| Secondary Color | 0.76 | 0.80 |
| The Number of Floors | 0.83 | 0.93 |
| The Number of Buildings | 0.80 | 0.90 |
| Average | 80 | 0.87 |
Table 14.
mIoU of CMP test and distortion correction data.
Table 14.
mIoU of CMP test and distortion correction data.
| Class | CMP Test Data | Distortion Correction Data |
|---|
| Walls | 0.69 | 0.69 |
| Windows | 0.66 | 0.53 |
| Entrances | 0.51 | 0.50 |
| Background | 0.72 | 0.43 |
| Average | 0.63 | 0.54 |
Table 15.
Pixel accuracy of CMP test and distortion correction data.
Table 15.
Pixel accuracy of CMP test and distortion correction data.
| Data | Pixel Accuracy (Average) |
|---|
| CMP Test Data | 0.77 |
| Distortion Correction Data | 0.75 |
Table 16.
Façade information accuracy of CMP test and distortion correction data.
Table 16.
Façade information accuracy of CMP test and distortion correction data.
| Façade Information | CMP Test Data | Distortion Correction Data |
|---|
| Dominant Color | 0.92 | 0.83 |
| Secondary Color | 0.73 | 0.80 |
| The Number of Floors | 0.89 | 0.93 |
| The Number of Buildings | 0.81 | 0.90 |
| Average | 0.84 | 0.87 |
| Publisher’s Note: MDPI stays neutral with regard to jurisdictional claims in published maps and institutional affiliations. |
© 2022 by the authors. Licensee MDPI, Basel, Switzerland. This article is an open access article distributed under the terms and conditions of the Creative Commons Attribution (CC BY) license (https://creativecommons.org/licenses/by/4.0/).


