Abstract
The purpose of a road vehicle’s friction brakes is to convert a vehicle’s kinetic energy to thermal energy. When doing so, the brakes should not be heated to such temperatures at which their efficiency could be reduced. The objective of the measurements in this article is to assess the ability of passenger brakes’ spare parts, brake discs and brake pads to meet the requirements for brakes. For the experimental measurements, brake discs and brake pads of high, middle and low prices were selected from advertisements intended for a particular vehicle. The measurements were performed via driving test measurements as well as under laboratory conditions. Driving test measurements determined the brake distance and mean fully developed deceleration of the brake components of all three price categories. On the other hand, the dependence between the effort to control the steering and the brake force, as well as the temperature of brake discs during repeated interrupted braking and continuous uninterrupted braking, were determined under laboratory conditions. Attention was also given to prevention against corrosion. The results show a sufficient ability of all the brake pads and brake discs tested to generate braking force under common conditions. However, when using the lowest-priced brake discs and brake pads, a substantial reduction in their efficiency can occur if braking intensively or over a long period.
Keywords:
brake disc; road safety; brake pad; friction brakes; overheating; brake distance; spare parts; vehicle; brake failure 1. Introduction
Friction brakes convert a vehicle’s kinetic energy to predominantly thermal energy [1,2]. The frictional force is caused by the brake pads’ force applied on the brake discs. There are many demands placed on them all, sometimes contradictory.
Brake discs are un-sprung parts of a vehicle, and are rotating masses which act against inertia in the rotary direction when the vehicle is accelerating and decelerating [3]. Thus, the weight of disc brakes affects the driving and operational vehicle performance, and it should be as low as possible. In order to lower their weight, traditional materials used for their production are replaced by lightweight ones. In addition to grey cast iron and steel, lighter materials are used for the production of disc brakes, which do not excessively increase the price of the product and also meet strength, frictional and thermal requirements [4]. Criteria for materials to be used for a brake disc are also mentioned in the publication [5]. To have a lower weight brake disc as well as to keep its strength at the required level, a combination of aluminium and alloy can be used. The publication [6] describes how the weight of a brake disc is lowered by 20% by using aluminium in the assembling section, and how grey iron is applied in the friction surface section to maintain braking performance. Materials are combined either by casting or by a bolted joint [7]. The reliability and contributions of lightweight brake discs have been verified by the brake dynamometer [6].
Brake pads must withstand high temperatures and pressures while maintaining an adequate coefficient of friction as well [8]. Their lifetime must be as long as possible while at the same time retaining their original performance and having minimal wear [9]. The production of friction lining most often uses mineral, metal or ceramic organic materials in powder or fibre forms. These materials are bound by vitreous, metal or carbon fibres [10,11]. There are also biomaterials used, mainly from agricultural production, as mentioned in the publications [12,13,14].
Brake discs and pads must create such a pair which is able to generate intense brake forces in a short moment. The intensity of brake force is affected by the force of the brake cylinder that is applied on the brake pads, and by the coefficient of friction between the brake pads and a brake disc [15,16]. If the brake pads are made of material that is too lightweight, this will first lead to their deformation and, after that, to the activation of required braking force [17]. That would mean that the time for brake activation as well as stopping distance will be prolonged [18].
The heat accumulated in the brake disc and brake pads can to some extent increase the coefficient of friction. Higher temperatures can cause an increase in the coefficient of friction. After exceeding a certain temperature, usually 350 °C continuously and 800 °C at peak time, it can lead to permanent adverse modifications [19,20].
The overheating of brake discs and brake pads can occur due to various reasons [21]. High temperatures can be caused by intense and long-lasting braking when a vehicle is driving downhill [22]. This problem is predominantly connected to heavy vehicles, as also described in the publications [23,24,25]. However, mostly due to bad braking strategy, the risk of brakes overheating may occur in passenger vehicles as well [26,27,28].
Overheating can also happen even when braking normally, if the brake disc or brake pads are made of improper material with the wrong value of thermal conductivity [29,30]. Overheating may occur due to the wrong material combination of a brake disc with brake pads as well, which is also seen in the publications [31,32].
The publications [33,34] pay attention to overheating of brake discs and pads as a result of their insufficient thickness. Publication [34] mentions that the reduction inof a brake disc’s thickness from 23 mm to 17 mm causes an increase in temperature during deceleration by 8.27% and in thermal stress by 12.82%. It is necessary to inspect brake discs and brake pads regularly, and if they are not thick enough, they must be replaced immediately since it can lead to their overheating.
If the brake pads do not turn back to their original position after braking, it leads to continuous contact between the brake pads and brake disc, resulting in constant braking as well as converting kinetic energy into thermal [35]. The reason for not turning back after braking may be a malfunction in the braking system, for instance due to seizure of pins in the brake master cylinder or seizure of the cylinder in the brake. If the combination of materials is inappropriate, or if the surface treatment is insufficient, it can lead to a reaction between the brake pads and any spot they contact where they are located in the brake calliper. Then, corrosion and seizure can occur [36]. Due to excessive temperatures, the components can be seized even more, and thus the friction and temperatures are higher.
Heat can lead to the formation of a smooth boundary film on the brake discs and pads. The layer of film causes a decrease in the coefficient of friction as well as in the braking force. To generate the same braking force, generating a higher effort is needed to control the steering [37]. The boundary film causes another increase in temperature, and higher temperatures increase the creation of boundary film. This can be also evinced by whistling [38]. In an extreme case, it can lead to the situation when even the maximum possible effort to control the steering generated may not be enough to generate sufficient braking force [39]. A brake disc with a boundary film must be replaced by a new one. Some drivers do not replace them, or put off replacement due to cost. This leads to reduction in their thickness and to risk of damaging them [33,34,40].
Due to high temperatures and heat shock, various cracks can occur on the brake disc’s friction surface [41]. The publication [42] has concluded that thermal stress on the brake disc while braking is substantially higher than mechanical stress. Gradually, these cracks expand, and thus, while braking, the brake disc may crack [43]. The risk of cracking may also be higher if the brake disc is equipped with cooling holes, as mentioned in the publication [1].
Heat is transported from the brake disc by flowing into the wheel’s hub, in which the bearing is located. In extreme cases, due to excessive heat load, it may lead to loss of greasing abilities of the grease, damage in the bearing and its seizure or to wheel blocking [44]. Overheating as the main reason for the bearing being seized has been also mentioned by the researchers in the publication [45].
The heat is also transported from the brake disc and brake pad to the brake cylinder, which is in direct contact with the brake fluid. Brake fluid is hygroscopic and intakes water through rubber hoses and seals [46]. An important parameter of brake fluid is its wet boiling point, which is about 180 °C [47]. After breaking this limit, the water in brake fluid starts to boil. Water is converted by boiling into steam, and steam water is, in comparison with fluid, compressible [48]. The boiling point decreases with the age of brake fluid, since the amount of intake water increases [49]. According to data in the publication [50], 11% of the 159 vehicles tested had brake fluid boiling points lower than 155 °C. Compressibility of steam may cause partial or complete dysfunction of the brake control [51].
If the temperature of brakes is too high, it is evinced by unpleasant odour, emission of dangerous volatile substances, overheating of the wheel guards, damaging of rubber seals as well as several other activities as also mentioned in the publications [52,53,54]. Publication [52] specifies that exceeding the temperature of brake discs from about 165 °C to 190 °C leads to a four- to six-fold increase in emission production of ultrafine particles.
An important characteristic of brake discs is their resistance level against corrosion, which is also observed in the publications [55,56,57]. Corrosion on the friction surfaces of brake discs can cause an excessive increase in the temperature of brake discs and brake pads, as well as a reduction in the coefficient of friction, resulting in the reduction in braking force and lengthening of stopping distance [58]. The publication [59] focused on the impact of corrosion on a vehicle’s braking characteristics, although the constituent material of brake discs was the same.
Corrosion on the brake discs’ friction surface increasingly causes the brake pads to be being worn out and it can lead to their total destruction [60]. There is also a risk of strong adhesion due to friction, as also mentioned in the publications in which the attention was predominantly paid to the discs made of grey cast iron [61,62,63]. Fluctuation and inequality in braking may be caused by corrosion on the brake discs’ friction surface as well. The relation between corrosion and vibration intensity was described in the publication [64], in which it was determined by a numerical simulation, and also in the publication [65], in which it was also determined by experimental testing.
Brake disc corrosion can cause permanent friction [66,67]. This leads to an increase in a vehicle’s mechanical resistances followed by increased fuel consumption, amount of non-renewable resources consumed, as well as the amount of gaseous and dust emissions. Part of the engine power and torque is being spent to overcome friction, and it is converted to thermal energy. Thus, a vehicle achieves lower acceleration, and it may increase the possibility of a car accident, for example when moving from a side road to a main road or when overtaking other vehicles [68].
In combination with electric braking systems such as ABS, corrosion can make the brake discs malfunction [69].
Corrosion on the contact areas of a brake disc causes its improper fixation to a wheel nave, resulting in the fluctuation of braking effect, brake pedal and steering wheel vibrations, overheating, as well as irretrievable damage to the brake disc, which must then be replaced [70].
Formation of corrosion in areas where a brake disc is in contact with a wheel nave or wheel disc can damage the wheel and cause disassembly of the brake disc. This requires using higher force and thrust, and thus, it increases the risk of damaging the wheel, wheel nave’s bearing and the brake disc itself. Disassembly results in time-consuming, high-cost fixes [71,72].
Reinforcing the corrosion resistance can also be achieved by alloying elements. The publication [55] described the corrosion resistance increased by a higher amount of aluminium and by correct fine-tuning of alloying elements. The manuscript [55] aimed at demonstrating that the fine-tuning of alloying elements in cast iron is a particularly effective method in order to improve its corrosion resistance, thus allowing the development of future disc brake rotors with a prolonged operating life. The authors in the publication [57] concluded that it is possible to mitigate the corrosion of cast iron brake discs by modulating the carbon morphology, alloy element concentration and microstructure. Increasing the corrosion resistance is also possible via ferritic nitrocarburizing (FNC), as also mentioned in the publication [73], in which the authors studied the effect of the brake friction value by FNC compound layer thickness with scaled dynamometer testing, and determined the anti-corrosion performance results for each respective case via complex environment salt spray testing. Corrosion resistance is provided by using ceramics as well. This subject matter is described in the publications [74,75]. When increasing the corrosion resistance of brake discs, it is always connected with increasing the financial effort, which may be reflected in the final price of brake discs. This can lead to the decision to not apply the additional corrosion resistance.
The technical parameters of a vehicle can also be affected by its age. Sales of new vehicles in the European Union in 2021 have decreased by 25% in comparison with the previous year, and the average age of vehicles is 11.5 years [76,77]. Lower sales of new vehicles and higher age of used ones premise worse technical conditions of vehicles and the need for purchasing spare parts [78,79]. According to the publications [80,81,82], choice of spare parts for passenger vehicles has been affected by their price, population purchasing power, age of a vehicle and awareness of differences between particular spare parts. It is possible to buy brake discs and brake pads of different prices for one vehicle [83]. The differences in their price due to many factors. The brake discs and brake pads in all price ranges must meet the same requirements to be used in a certain vehicle with the same safety and ecology levels [84]. All brake components which can be purchased for a specific vehicle have had to be tested several times and meet the required parameters. Since the brake components at very different prices can be purchased for the same vehicle, there is a question whether the price of brake components affects their quality. It is one thing to meet the legislative parameters, and quite another to meet the requirements in excess of minimum legislative requirements. The purpose of this article is to assess different brake discs and brake pads intended for passenger cars from different points of view. The purchased and assessed brake discs and brake pads are of the lowest, middle and highest price in the market. The brake discs purchased are full as well as drilled. They were assessed in terms of their weight and volume. Sets of brake discs together with brake pads were assessed in terms of their impact on stopping distance, mean fully developed deceleration and ability to generate braking force. They were also assessed within their temperature range during repeated braking, continuous braking and cooling in open space. The brake discs’ corrosion resistance was also observed. The measurements were performed in the laboratory and via test driving. The contribution of this article lies in its complexity and number of measurements performed. The comparison of low-priced and high-priced brake discs and brake pads from the point of view of stopping distance and MFDD value is also mentioned in the publication [85], but the measurements determined substantially lower parameters. Only the impact of brake discs and brake pads on the stopping distance and mean fully developed deceleration was assessed there, not their impact on the heating up or the ability to generate braking force. The advantage of this publication, compared to the publication [85], lies in a considerably higher measurement complexity. In the publication [86], brake discs selling at four different prices were assessed. Determining their impact on stopping distance and MFDD was performed with the same brake discs. The publication [64], as well as the publication [86], include only the measurements of stopping distances, not the brakes’ heating or the ability to generate braking force. When assessing the brake heating, there are usually only mathematical simulations used, as also seen in the publications [87,88,89], and real measurements are rare. As mentioned in the publication [87], mathematical modelling is often performed with various simplifications, such as considering the coefficient of friction as a constant value that is not dependent on the temperature, or considering the constant pressure between a brake pad and a brake disc. However, in fact, these conditions may not take place at all, and, thus, it can affect the results. During mathematical modelling, it is not possible to consider all the possible factors that can affect the braking characteristics or the brakes’ temperature. The advantage of the results achieved by experimental measurements lies in capturing all the factors which to lesser or greater degree affect the consequences. The results in this publication were achieved after considering more or less foreseeable facts such as a certain degree of material homogeneity, deviations in geometry and sizes of brake discs and pads, as well as in their materials and shapes, and many others. The complex experimental measurements enabled this consideration of all the factors.
The purpose of this publication is to assess the brake components from a predominantly operational point of view. Material and geometrical properties of brake components are not detailed. The article mainly focuses on the performance of brake components. The main objective is not to observe the material, but to assess the operational side of brake components.
2. Materials and Methods
The purpose of the measurements is compare the brake pads and brake discs, i.e., brake components of a passenger vehicle, from the perspective of heating up and ability to generate braking force. Table 1 shows the technical parameters of a passenger vehicle of which the components are compared. Prior to measurement, new brake cylinders were mounted and all the brake fluid was replaced to avoid affecting the results.

Table 1.
Technical parameters of Kia Ceed [90].
The measurements were performed with three different brake discs selected according to their price. The brake discs’ purchase price is as follows:
The brake discs in Figure 1 are displayed as they are seen by a vehicle operator, mechanic or purchaser. The manufacturer of the brake discs or brake pads does not provide their material composition.
The low-priced and mid-priced brake discs (Figure 1 on the left and in the middle) have a full profile, while the high-priced brake disc (Figure 1 on the right) has holes drilled for better cooling.
The brake pads intended for measuring are as follows:
- Low-priced, EUR 11 per set.
- Mid-priced, EUR 34 per set.
- High-priced, EUR 49 per set.
The low-priced brake discs were used with low-priced brake pads, the mid-priced brake discs were used with mid-priced brake pads, and the high-priced brake discs were used with high-priced brake pads.
The measurements performed are given in Table 2.

Table 2.
Measurements performed.
2.1. Measuring the Basic Physical Characteristics of Brake Discs
The first part of the measurements comprised determining the weight of the brake discs and the volume of the brake discs’ material. Subsequently, their density, i.e., their volumetric mass density, was calculated. The volume of the brake discs’ material was determined by immersion of the disc in the measuring cylinder with water and then by measuring the volume of water pushed by the brake disc.
The wobble of the brake discs was measured as well. During measurements, the brake discs were attached to the headstock spindle in order to ensure the highest measurement accuracy possible. Subsequently, the wobble was measured while slowly turning the discs via a mechanical dial gauge with a measurement accuracy of 0.005 mm.
2.2. The First Measurement of Vehicle’s Braking Characteristics
Vehicle’s braking characteristics measured included:
- Initial speed.
- Stopping distance.
- Braking time.
- Mean fully developed deceleration (MFDD).
The MFDD decelerometer calculates according to Equation (1):
where MFDD is mean fully developed deceleration (m.s−2);
vb is vehicle speed at 0.8 from v0 (km.h−1);
v0 is initial vehicle speed (km.h−1);
ve is vehicle speed at 0.1 from v0 (km.h−1);
se is distance driven between v0 and vb (m);
sn is distance driven between v0 and ve (m).
Measurements of braking characteristics were performed by a Inventure XL meterTM Pro Gamma decelerometer (Figure 2).
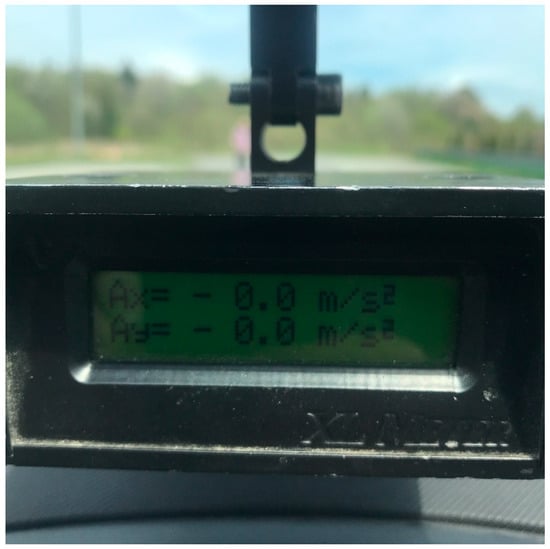
Figure 2.
Decelerometer used for measuring.
The decelerometer was located in the middle of the windscreen. Technical parameters of the decelerometer used are given in Table 3.

Table 3.
Technical parameters of the decelerometer used for the measurements [91].
The measurements were performed on a dry asphalt surface of which the grain size is given in Figure 3.
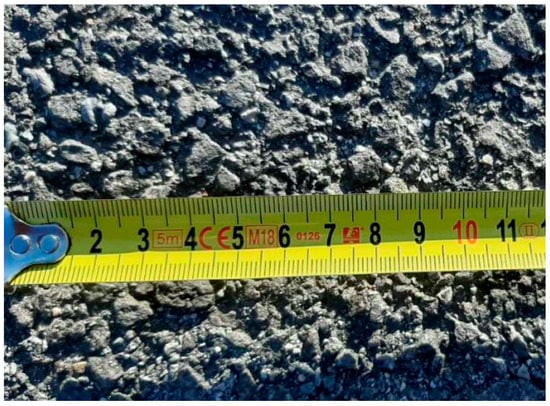
Figure 3.
Surface selected for measuring the braking characteristics.
Prior to measurements, a 5 km long route with particular brake components was driven each time, during which braking was performed continuously. There were 8 measurements performed with the low-priced, mid-priced and high-priced brake components at an initial driving speed of approximately 50 km.h−1. Then, the results were averaged. The driver accelerated the vehicle to the speed of 50 km.h−1, and when the front part of the vehicle reached the beginning of the braking section signposted by a traffic cone, the accelerator pedal was released as fast as possible and the brake pedal was applied. The same effort to control the steering affecting the brake pedal was controlled by a Corsys pedometer during all the measurements (Figure 4).
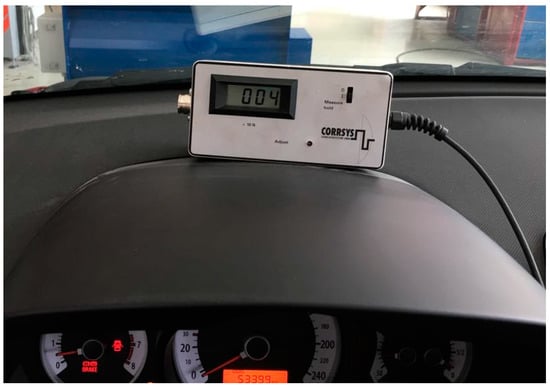
Figure 4.
Pedometer used for measuring the effort to control the steering affecting the brake pedal.
2.3. Measurement of Brake Discs’ Temperature during Repeated Braking 15 Times in a Row
After determining the impact of the brake components used on the braking characteristics of a vehicle, the measurement of the temperature of brake discs during repeated braking was performed. To avoid a distortion of the results by the environment, the measurements were performed under laboratory conditions on the MAHA MSR 1050 dynamometer. The air temperature in the laboratory varied from 18 °C to 22 °C. Prior to each measurement with changed brake components, the vehicle was left for at least 6 h without any motion to reduce the wheel’s hub, brake calliper, brake cylinder and the other components to an ambient temperature to avoid a distortion of the results.
The layout during the measurement is given in Figure 5.
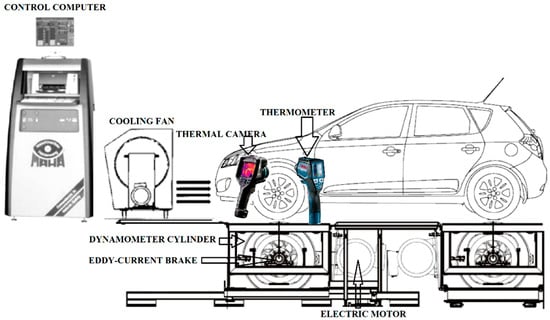
Figure 5.
Measurement during repeated braking with dynamometer.
The MAHA MSR 1050 dynamometer is able to simulate a vehicle driving on a road while keeping the real values of all driving resistances. Real driving is simulated as the control computer instructs the electric motors which further spin the dynamometer’s cylinders, or it instructs the eddy-current brakes by which the cylinders are braked. In order to simulate the same driving conditions with the dynamometer MAHA MSR 1050 as for road driving, especially the inertia resistance while braking, it was necessary to insert the values of driving resistances from the Kia Ceed into the control computer. The driving resistances were determined by the coasting deceleration measurement of vehicle resistance under conditions pursuant to EN 30 0556 [92]. The vehicle accelerates to the speed of 120 km.h−1 and then the wheels are disconnected from the engine by putting the transmission in neutral. The vehicle further freely decelerates, and its speed is recorded according to the time spent from the moment of the wheels’ disconnection. The Kia Ceed’s coasting curve is shown in Figure 6.
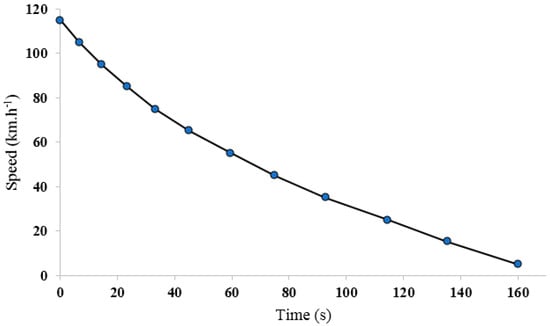
Figure 6.
Kia Ceed’s coasting curve.
The data measured with the vehicle mass were inserted into the MAHA MSR 1050 dynamometer’s computer and the repeated coasting deceleration measurements of vehicle resistances were performed to determine the change in rolling resistance due to the dynamometer’s round cylinders.
The conditions of repeated braking were adapted to the conditions given in general binding ECE Regulation No 13H type I [93], however, with a change: it is necessary for the wheels to be fully stopped at each braking in order to measure the brake disc’s temperature. To meet the requirements of ECE Regulation No 13H as well as to stop the wheels, the following condition must be respected (Equation (2)):
where ΔEKEHK is the difference in kinetic energies at the beginning and at the end of one braking cycle according to ECE No 13 H, and ΔEKDYN is the difference in kinetic energies at the beginning and at the end of one surrogate braking cycle for MAHA MSR.
The value of kinetic energy converted into the thermal energy while vehicle braking according to ECE NO 13 H must be the same as the value of kinetic energy converted into the thermal energy while braking on the dynamometer, as in Equation (3). While measuring with dynamometer, the following must be applied:
where m is vehicle mass (kg);
v1 is initial speed at the beginning of braking according to ECE No 13 H (m.s−1);
v2 is speed at the end of braking according to ECE No 13 H (m.s−1);
vA is initial speed wanted at the beginning of surrogate braking cycle (m.s−1);
vB is speed at the end of the surrogate braking cycle, VB = 0 (m.s−1).
For heat diffusing, the time during which the heat is diffused is also important. To maintain the time when kinetic energy is converted into thermal energy, it is necessary to calculate the time of braking using Equation (4):
where b is deceleration required according to ECE No 13 H, 3 m.s−2;
Δv is speed difference at the beginning and at the end of deceleration (m.s−1);
t is time needed for achieving the change required during deceleration (s).
Derived from Equations (2) and (3), the initial speed of braking was calculated as v1 = 103.9 km.h−1, and, from this speed to the zero speed, the time of braking was derived from Equation (4) t = 5.56 s.
The vehicle in which the brake discs were heated to 40 °C was run to the speed of 103.9 km.h−1 and then stopped for 5.56 s to zero speed, and then temperature of brake discs was measured. The temperature measurement was followed by the acceleration to the speed of 103.9 km.h−1 with braking repeated 15 times in a row.
The Flir E55 thermal imaging camera with a measuring range from 20 °C to 650 °C with a measurement deviation of ±2%, as well as the GIS 1000 C PROFESSIONAL contactless thermo detector with a measuring range from −40 °C to 1000 °C with a measurement deviation of ±1%, were used to measure the temperature of brake discs [94,95].
All the measurements were performed with the low-priced, mid-priced and high-priced discs with a maximum thickness and also with a minimum thickness permitted by the manufacturer. The maximum thickness of brake discs was 26.0 mm and the minimum thickness of brake discs was 24.4 mm.
The temperature of brake discs was measured in the exit of contact.
2.4. Measuring the Temperature of Brake Discs during Continuous Braking
The temperature of brake discs was determined during continuous braking as well. The braking was performed on the Motex 7547 brake test bench, and braking force of the circumference of the wheels was constantly 2500 N.
The Motex 7547 brake test bench is shown in Figure 7.
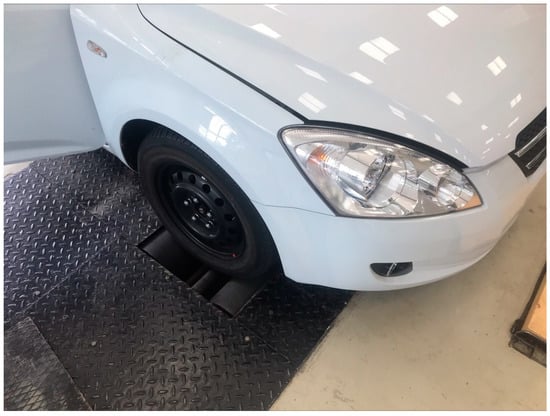
Figure 7.
Motex 7547 brake test bench.
The initial temperature of brake discs was about 80 °C, and the measurement lasted 15 min while measuring the temperature every 5 min. The speed of the wheel rotation was 10 km.h−1.
2.5. Measurement of Brake Discs’ Temperature during Repeated Braking 32 Times in a Row
The measurement was carried out at least 8 h after measuring the temperature of brake discs during continuous braking. The measurement of brake discs’ temperature during repeated braking 32 times in a row was performed under the same conditions and with the same devices as for braking 15 times in a row. The difference was seen in the initial temperature of brake discs, which was 20 °C.
2.6. Repeated Measurement of Braking Characteristics of Vehicle
The measurements relating to the heating of the brake components to high temperatures were followed by repeated measurement of braking characteristics of the vehicle. This was performed in the same section with the same devices as for the first measurement of braking characteristics.
2.7. Measurement of Braking Force Depending on Effort to Control the Steering
The braking force was measured on the Motex7547 cylinder brake test bench when applying the effort to control the steering of 100 N, 200 N, 300 N, 400 N, 500 N and 600 N on the brake pedal with the brake servo deactivated. The value of the brake pedal’s effort to control the steering was measured by a Corsys pedometer (Figure 4).
2.8. Brake Components’ Cooling
Demounted brake discs and brake pads were heated to a certain value for two hours, and afterwards the speed of their cooling was measured at the temperature of 20 °C. The heat was a result of hot air used in a thermal chamber.
The brake discs were heated to 120 °C homogeneously, and while measuring, their temperature was determined in the section of friction surface and in the section in which the brake discs are in contact with a vehicle charge.
The brake pads were heated to 230 °C and their temperature was determined from both sides, from the friction surface and from the metal section in which there is contact with the brake cylinder. The measurements were performed with a Flir E55 thermal imaging camera and GIS 1000 C Professional thermo detector.
2.9. Monitoring the Brake Discs’ Corrosion Resistance
After measurements described above were finished, the disassembled brake discs were exposed to rainwater, and then maintained under weather conditions away from rain and snow for 3 months. After that, the presence and character of corrosion at different parts of the brake discs was assessed by monitoring.
3. Results and Discussion
The measurement results are arranged in the same order as given in Table 2. Results and discussion relating to each measurement are studied in a separate subsection. Where the results are given in a graph form, black colour always represents the values measured with the low-priced brake components, green colour represents the mid-priced brake components and red colour represents the high-priced brake components. Where the brake discs with a minimum thickness were used during measurements, all the curves are dashed.
3.1. Results of Measuring the Basic Physical Characteristics of Brake Discs
Table 4 shows the data on the volume of materials of brake discs, their weight, density and wobble.

Table 4.
Basic physical characteristics of brake discs.
The brake discs have approximately the same volume of material, weight and density. The high-priced brake disc has a lower amount of material due to the holes in its friction surface. The highest density is reached by the mid-priced brake disc. All three brake discs have an admissible degree of wobble which does not cause a fluctuation in braking effect [96].
3.2. Results of the First Measurement of Vehicle’s Braking Characteristics
Vehicle’s braking characteristics measured with new only run-in brakes are given in Table 5, Table 6 and Table 7. It also shows the initial vehicle speed, stopping distance, braking time and MFDD. All values correspond to low-priced, mid-priced as well as high-priced brake components.

Table 5.
Braking characteristics measured with low-priced brake components.

Table 6.
Braking characteristics measured with mid-priced brake components.

Table 7.
Braking characteristics measured with high-priced brake components.
For better transparency, the results from Table 5, Table 6 and Table 7 are given in Table 8. The fifth column shows the standard deviation of average values measured with low-priced, mid-priced and high-priced brake components.

Table 8.
Vehicle’s braking characteristics during the first measurement.
Braking characteristics of the vehicle with used brake components were not affected significantly, as follows from the data in Table 8. The standard deviations of each brake component were lower than the standard deviations during eight repeated measurements, as follows from the values given in Table 5, Table 6, Table 7 and Table 8. The stopping distance with low-priced brake components was the longest; however, the initial speed was also slightly higher than the initial speeds of other brakes. The value of MFDD was the same with low-priced and high-priced brakes, so it cannot be said that low-priced brakes would be less safe, even if the stopping distance was longer [97,98]. The lowest value of MFDD was measured with mid-priced brake components, although the decrease was not substantial. It can be assumed that there was enough braking force applied in relation to all three brake components tested; however, the friction force between the tyres and road affected by the ABS system was limited [99,100]. The publication [86] also included an MFDD measurement with various brake pads. The authors did not directly mention the price of the brake pads; however, it can be concluded from their brand name. The measurements were performed with four brake pads (with two low-priced, one mid-priced and one high-priced). All the measurements were performed with the same brake discs. The values of MFDD were as follows: low-priced brake pads—8.78 m.s−2 and 8.54 m.s−2, mid-priced—8.40 m.s−2 and high-priced—8.35 m.s−2. On the whole, the values of MFDD in the publication [86] are lower, probably due to the road surface or using a different vehicle for the measurement. The lowest MFDD was measured with the highest-priced brake pads. The differences resulting from using the brake pads of different purchase prices are higher, but not significant nor reducing safety.
A substantial difference which reduces safety in road traffic due to using low-priced and high-priced brake components was mentioned in the publication [85]. The low-priced brake discs and pads cost EUR 58 and high-priced brake discs and pads cost EUR 148. The rear brakes were detached in this case. The stopping distance with detached rear brakes and low-priced front brakes was 16.69 m at the initial speed of 50 km.h−1 and MFDD was 4.99 m.s−2. When using high-priced brakes, the stopping distance shortened to 14.39 m and MFDD rose to 7.42 m.s−2. Thus, it led to a 48% increase in MFDD, whereas, in the measurements in this publication, the value of MFDD did not changed. However, the results might have been distorted due to detached rear brakes.
3.3. Results of the Measurement of Brake Discs’ Temperature during Repeated Braking 15 Times in a Row
The impact of repeated braking on brake discs’ temperature is shown in Figure 8. Black colour displays the value measured with low-priced brake discs, green colour represents the mid-priced brake discs and red colour corresponds to the high-priced ones. The solid line depicts the course of the values measured with brake discs with maximum thickness, and the broken line depicts the minimum thickness of brake discs.
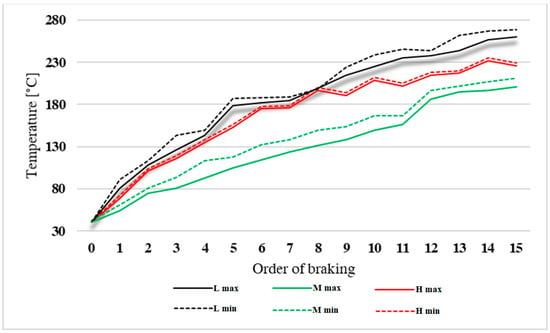
Figure 8.
Brake discs’ temperature during repeated braking 15 times in a row.
The brake discs’ temperature during repeated braking 15 times in a row increased significantly depending on the brake discs. The differences were higher than 80 °C, which is higher than 65% in some measurements (Figure 8). Both the price and the characteristics of a brake disc have affected the temperature more than its thickness.
The highest temperature was seen in the low-priced brake discs with a minimum thickness. The lowest temperature during repeated braking was seen in solid mid-priced brake discs, not high-priced ones with holes. The solid brake discs had lower temperatures during repeated braking than brake discs with holes, which was also the case during the measurements mentioned in the publications [100,101,102,103]. The authors in publication [103] explained a higher temperature of the brake discs with holes by a smaller friction surface reduced by the area of holes. Thus, the holes in brake discs or their higher price do not guarantee a lower temperature. However, the temperature of high-priced brake discs was lower than the temperature of low-priced brake discs. Such a difference might have been caused by using different materials of brake discs and brake pads [104,105].
The thickness affected the temperature of high-priced brake discs less sharply than their price. The biggest differences were measured with mid-priced brake discs due to different thicknesses. The highest difference measured was 20 °C, which is an increase in temperature by 20% as a result of the reduced brake disc’s thickness (Figure 8).
The temperature of brake discs spread further to other vehicle parts, as is also evident from Figure 9.
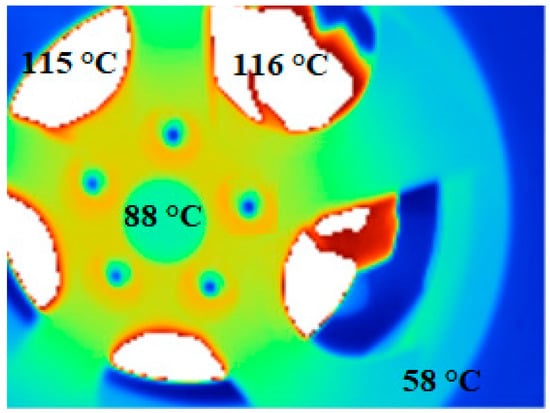
Figure 9.
Other vehicle parts and brake discs heating up.
3.4. Results of Measurements of the Temperature of Brake Discs during Continuous Braking
The temperature of brake discs during continuous braking is shown in Figure 10. The temperature was measured at the beginning of measuring and then every 5 min. Low-priced brake discs are in black colour, mid-priced are in green and high-priced brake discs are in red colour, as in the previous measurement. The brake discs with full thickness are displayed by a solid line and brake discs with minimum thickness are displayed by a broken line.
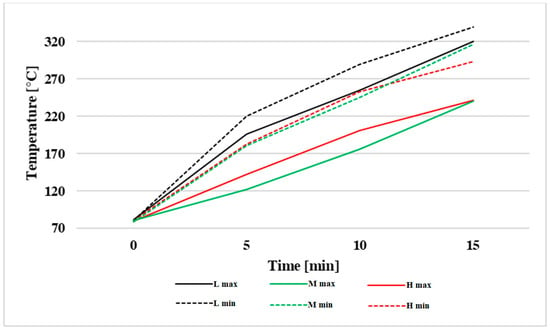
Figure 10.
Temperature of brake discs during continuous braking.
During continuous braking and wheel rotating at a low speed of 10 km.h−1, the temperature of the low-priced brake discs with minimum thickness reached 339 °C, and the temperature of the mid-price brake discs with original thickness reached 240 °C, which is 29% lower. In addition to the price of brake discs, the thickness of brake discs evinced significantly as well (Figure 10). The mid-priced brake disc with maximum thickness heated to 240 °C after 15 min of braking with a force of 2500 N, whereas with minimum thickness it heated up to 320 °C. Thus, the reduction in the brake disc’s thickness caused an increase in temperature by 33%, almost to the level of the low-priced brake disc with maximum thickness. A significant difference in temperatures due to the thickness of the brake discs was measured with the high-priced brake discs as well.
The order of brake discs according to their temperature during continuous braking at low speed (Figure 10) was slightly different from the order of brake discs according to their temperature measured during braking at high speeds (Figure 8). The change in the order is predominantly caused by an increasing effect of brake discs’ thickness on their temperature. The publication [106] mentioned that the temperature of drilled brake discs during continuous braking at the speed of 60 km.h−1 is 24% lower than the temperature of the solid brake disc. The measurement results in this publication show again that in addition to brake disc drilling, thermal properties of a brake disc’s material are also important [29,107,108]. Thus, a drilled brake disc does not ensure a lower temperature during continuous braking at low speed in comparison with a solid brake disc.
3.5. Results of the Measurement of Brake Discs’ Temperature during Repeated Braking 32 Times in a Row
The course of the brake discs’ temperature during repeated braking 32 times in a row is shown in Figure 11. The colours corresponding to individual brake discs are the same as in the previous Figure 8 and Figure 10.
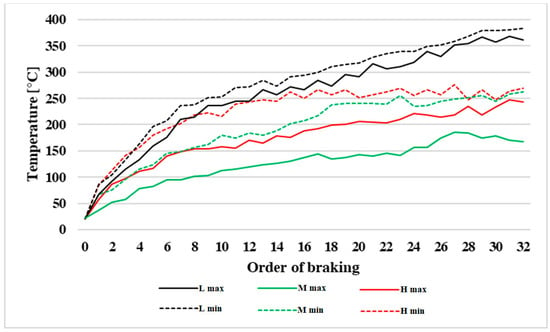
Figure 11.
Brake discs’ temperature during repeated braking 32 times in a row.
During repeated braking 32 times in a row, the differences between the brake discs were considerable, as seen in Figure 11. The order from highest to lowest temperature in relation to brake discs was as follows: low-priced with minimum thickness, low-priced with maximum thickness, high-priced with minimum thickness (during the first six measurements), mid-priced with minimum thickness, high-priced with maximum thickness and mid-priced with maximum thickness (they reached the lowest temperature unequivocally throughout the measurements).
The biggest difference in the brake discs’ temperature was measured after braking 32 times in a row. The mid-priced brake discs with maximum thickness reached 167 °C and the low-priced brake discs with minimum thickness reached 384 °C. The percentage increase in temperature was 130%.
Comparing the results from the publications [109,110,111], in which the increase in the brake discs’ temperature during repeated braking was determined only via calculations, the temperature during the real measurements did not increase in an orderly way, but some values of temperature slightly deviated (Figure 11). The reason can be a synergy of several circumstances, such as interaction of brake pads and brake discs, air humidity, man-made deviations in time of measuring, and so on [19,112,113]. These cannot be avoided completely even under laboratory conditions. However, the differences between each brake disc are so considerable that small deviations caused by external factors do not affect the reliability of results. The same trend in the results can be seen when comparing Figure 8 and Figure 10 as well.
3.6. Results Measured during Repeated Measurement of Braking Characteristics of a Vehicle
The results of braking characteristics, stopping distance, braking time and MFDD are shown in Table 9, Table 10 and Table 11.

Table 9.
Braking characteristics measured with low-priced brake components.

Table 10.
Braking characteristics measured with mid-priced brake components.

Table 11.
Braking characteristics measured with high-priced brake components.
The average values from Table 9, Table 10 and Table 11 are given in Table 12. A percentage difference in values in comparison with the first measurement of braking characteristics is also given.

Table 12.
Vehicle’s braking characteristics during the repeated measurement.
The differences in braking characteristics are low when using various brake components. The differences between the values measured in the first measurement (Table 8) and the values measured in the repeated measurement (Table 12) are also not strong. The brake components’ properties did not change significantly even when heated to high temperatures and then cooled again.
The biggest differences were caused by different vehicle speed before braking (Table 12, line 2). The differences could have also been affected by human factors, change in air humidity between particular measurements and other factors that cannot be eliminated completely. The MFDD of the low-priced and mid-priced brake components was the same, and the MFDD of high-priced brake components was slightly lower. Again, a very low impact of the brake components’ price on braking characteristics of a vehicle under common conditions can be concluded.
Most likely, the fact that the vehicle used for measurements was equipped with the brake assistance system, known as BAS or EBA, contributed to the reduction in differences in braking characteristics between particular brake components [114,115]. Brake assistance system, BAS, or emergency brake assistant, EBA, recognise emergency braking according to how fast the acceleration pedal or brake pedal are applied and activate the maximum braking effect irrespective of the force applied by the driver on the brake [116,117,118]. The anti-block system (ABS) could also have reduced the differences [119,120]. The ABS system avoids the wheel blocking to ensure the highest vehicle steering wheel control possible [121,122]. While braking on a dry asphalt surface under all wheels, it probably led to limitation of the braking force, proven by the ABS’s warning light and vibration of brake pedal, which is typical for the ABS system’s activity [123]. Thus, activation of braking force is affected by the BAS system, and the regulation of the braking force is affected by the ABS system. Interference of the abovementioned system likely reduced the differences in braking characteristics when using different brake components.
3.7. Results of Measuring the Braking Force Depending on Effort to Control the Steering
Figure 12 displays the dependence of braking force, i.e., the wheel circumference’s force, on the effort to control the steering after the brake servo is deactivated.
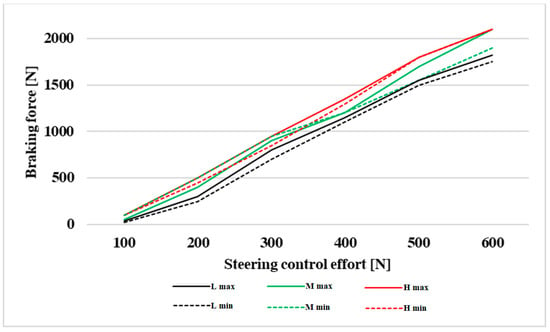
Figure 12.
Braking force depending on effort to control the steering.
The intensity of the braking force with the constant effort to control the steering is dependent on the coefficient of friction between the brake discs and brake pads [124]. At the same effort to control the steering, the highest braking force was generated with high-priced brake components (Figure 12). It was followed by the mid-priced brake components, and the lowest braking force was generated with low-priced brake components. The order is almost the same but reverse for measurements of brake discs’ temperature (Figure 8, Figure 10 and Figure 11). The relation between the friction force and brake discs’ temperature is also described in the publication [125]. The biggest difference in braking force, when using brake discs with original thickness, was seen in the effort to control the steering of 600 N, namely 280 N. Replacement of the high-priced brake components with maximum thickness by the low-priced ones with the same thickness led to a reduction in braking force of 13%. The differences between the same brake discs with maximum and minimum thickness are relatively small, although reducing the thickness of brake discs by lathing changes the roughness of the surface, as follows from the foundations in the publications [124,126].
However, the differences in the ability to generate a braking force at a certain effort to control the steering affect the vehicle’s braking characteristics only a little, as mentioned previously in this publication (Table 8 and Table 12). When assessing the differences in generating the braking force, it must be also taken into consideration that the measurements were performed with a deactivated brake servo unit to ensure higher accuracy. If the servo brake unit was active, the differences would have been smaller, or they would have been distorted [127,128,129,130].
3.8. Results of Measuring the Brake Components’ Temperature during Free Cooling
The brake discs’ temperature in the section of friction surface during cooling at an ambient air temperature of 20 °C is shown in Figure 10. The temperature was measured for a period of 42 min.
The speed of brake discs’ cooling in the section of friction surface may be considered to be approximately the same. The biggest difference was between the brake discs with maximum thickness and with minimum thickness (Figure 13).
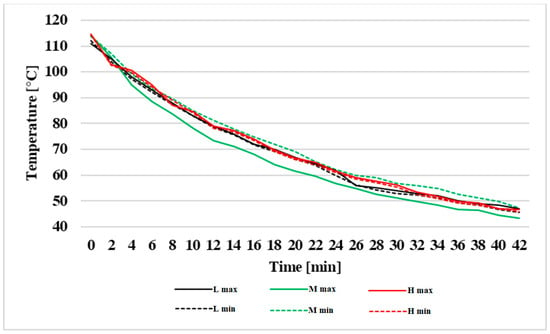
Figure 13.
Brake discs’ temperature in the section of friction surface.
Figure 14 shows the course of temperature of particular brake discs in the section where they are in contact with a wheel charge.
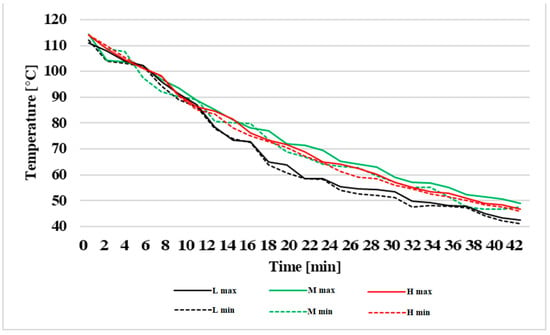
Figure 14.
Brake discs’ temperature in the section of contact with charge.
The brake discs’ temperature in the section of contact with charge of the wheel had higher differences while cooling (Figure 13) than the temperatures in the section of friction surface (Figure 14). The fastest reduction in temperature was seen in the low-priced brake discs. The mid-priced brake discs with maximum thickness cooled the slowest, mainly in the second half of the time of measuring.
Figure 15 shows the temperature of brake pads on the side at which there is contact with the brake disc. All the measurements were performed with maximum thickness of friction lining only.
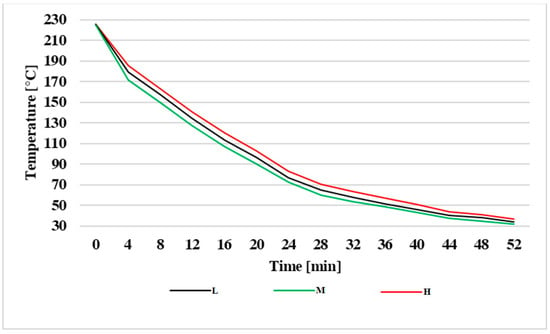
Figure 15.
Brake pads’ temperature in the section of contact with brake disc.
The temperature of the mid-priced brake pads decreased fastest. The slowest reduction in temperature was seen in high-priced pads (Figure 15). The maximum difference in temperature was 14 °C, which is a relatively low value.
Figure 16 shows the course of the brake pads’ temperature in the section of contact with the brake cylinder.
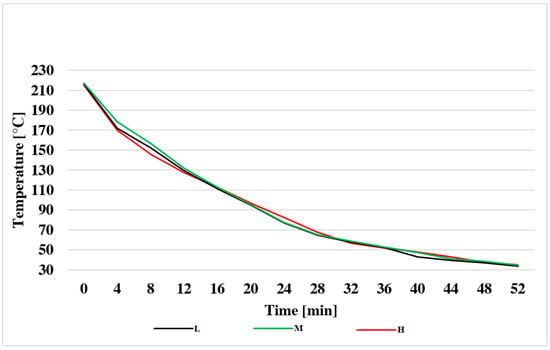
Figure 16.
Brake pads’ temperature in the section of contact with the brake cylinder.
The brake pads in the section of contact with the brake cylinder had almost the same values while cooling (Figure 16).
The differences in temperatures of brake discs and brake pads while cooling were minimal (Figure 13, Figure 14, Figure 15 and Figure 16). While driving a vehicle, the speed of the brake components’ cooling depends not only on materials used but also on the driving speed and overall aerodynamic conditions, as seen in the publication [131] as well. Thus, under different conditions, the brake components would be cooled at different speeds. However, as can be seen from Figure 13, Figure 14, Figure 15 and Figure 16, they cool almost identically under the same conditions.
On the other hand, the differences in temperatures while braking were considerable (Figure 8, Figure 10 and Figure 11). In addition to the materials used, the heating intensity of the brake components is also affected by driving characteristics, values reached during longitudinal and transverse accelerations, as well as pressure applied on a wheel, as also seen in the publications [132,133]. The advantage of this publication is that all the measurements that focused on the brake components’ temperature were performed under laboratory conditions, i.e., under the same conditions.
If a vehicle stays after intense or long-lasting braking, the brake components of all prices are cooled almost identically. However, low-priced brake components reach substantially higher temperatures than the other brake components after braking in the same way.
3.9. Results of Monitoring the Brake Discs’ Corrosion Resistance
Corrosion on the outer side of brake discs after their exposure to rain, as well as a 3-month exposure to atmospheric conditions away from rain and snow, is displayed in Figure 17. The first one, on the left, is a low-priced brake disc, a mid-priced brake disc is in the middle and high-priced brake disc is on the right.
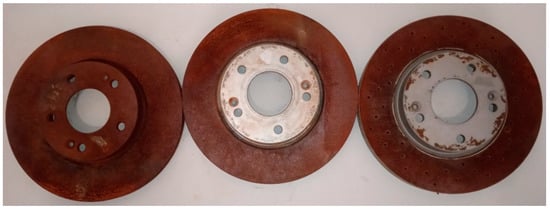
Figure 17.
Corrosion on the outer side of brake discs.
The friction surfaces of all brake discs from the outer side of the wheel were covered by a continuous layer of corrosion (Figure 17). Contrary to mid-priced and high-priced brake discs, in relation to the low-priced brake disc, the whole surface touching the wheel disc corroded as well. Thus, disassembly of the wheel would be difficult, and prior to its reassembly, it would be necessary to remove corrosion totally. The high-priced disc (Figure 17 on the right) contains corrosion even at places where a protective layer was damaged due to assembly and disassembly. In that event, the corrosion protective layer is not so effective against mechanical damages from the wheel disc.
The extent of corrosion on the inner side of brake discs, which is in contact with a wheel nave, is displayed in Figure 18. The first one, on the left, is a low-priced brake disc, a mid-priced brake disc is in the middle and high-priced brake disc is on the right.
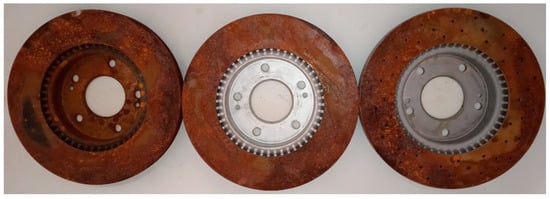
Figure 18.
Corrosion on the inner side of brake discs.
Like on the outer side (Figure 17), in relation to the inner side (Figure 18), the most corrosion-covered section is on the low-priced brake disc. Both inner and outer contact areas are not resistant against corrosion at all, or in the same way as the friction areas. The brake discs with such corroded contact areas cannot be assembled without removing corrosion from the surface. There is also a presumption that if water or moisture got onto contact areas during the operation, they would adhere to the wheel disc and nave owing to corrosion.
The low-priced brake disc was totally covered by corrosion, as also evident from Figure 19 on the left.
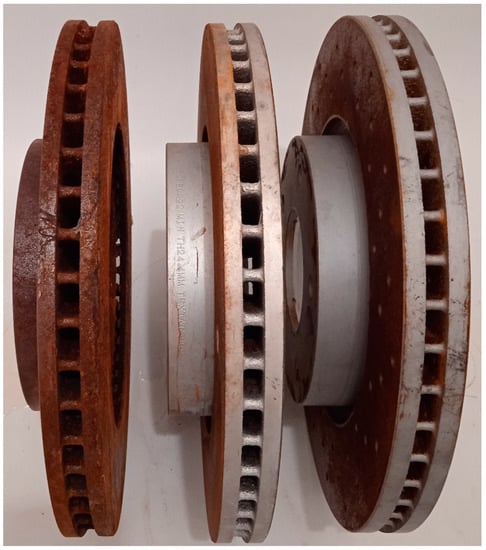
Figure 19.
Corrosion on the sides of brake discs.
Corrosion on the sides of the low-priced brake disc (Figure 19, on the left) occurs very often, as the brake discs are not corrosion resistant enough and their sides are highly exposed to water as well as salt water in winter, and they are not covered in any way.
Detail of corrosion of the low-priced and mid-priced discs’ friction area is shown in Figure 20. The low-priced brake disc is on the left and the mid-priced brake disc is on the right.
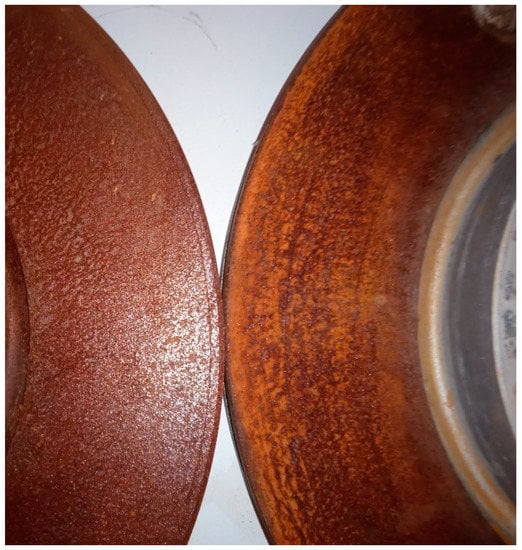
Figure 20.
Corrosion on the friction area of low-priced and mid-priced brake discs.
Corrosion on the low-priced brake discs creates deeper damage of the material than on the mid-priced one (Figure 20). This is probably caused by an absence of alloying elements to make the production as cheap as possible.
Detail of corrosion of the mid-priced brake disc (on the left) and the high-priced brake disc (on the right) is shown in Figure 21.
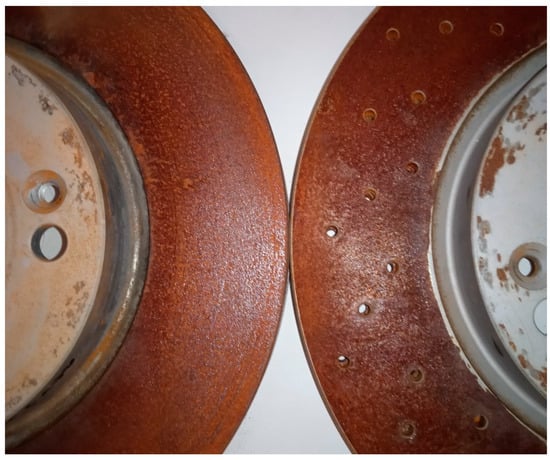
Figure 21.
Corrosion on the friction area of mid-priced and high-priced brake discs.
Corrosion on the high-priced brake disc (Figure 21) is stronger than on the mid-priced brake disc. It is also seen more on the contact area with the wheel disc.
Mid-priced and high-priced brake discs were corrosion resistant predominantly by using a protective coating on the surface that is in contact with the wheel disc, nave and on the sides. Related to the high-priced brake discs, due to the wheel’s assembly and disassembly, it led to a damaging of the protective coating followed by corrosion in those areas.
4. Conclusions
The purpose of the measurements in this publication was to determine and assess the impact of passenger vehicle brake component prices on selected properties of a vehicle and its driving performance. There were groups of brake discs with brake pads assessed according to their price from low-priced and mid-priced to high-priced ones on the market. The brake components were assessed in terms of their size, thermal properties, ability to generate braking force and the ability to resist the corrosion.
Weight, volume of material and specific mass were at approximately the same level. Thus, the price of brake discs reflected these values only a little.
The stopping distance of a vehicle, time of braking and MFDD were almost the same when using all the brake components. The inconsiderable impact of brake components’ price on vehicle braking characteristics was proven by repeated measurement as well. The repeated measuring was performed after the measurements with brake components heated to high temperatures so that they were worn out. The reason for small differences was also likely the interventions of vehicle security systems into the braking process.
The price of brake components significantly affected the temperature of brake discs during repeated braking from the highest speed to being stopped completely as well as during continuous braking at a slow speed. The temperature of brake discs with maximum and minimum thickness were measured. The low-priced brake discs with minimum thickness had a 217 °C higher temperature than the mid-priced brake discs with maximum thickness under the same conditions. Thus, the difference in temperature was 130%. The high-priced brake components with drilled holes did not have the lowest temperature in any of the measurements. In addition to the price, the temperature of brake discs was affected by their thickness as well. The brake discs with minimum thickness had significantly higher temperatures than the brake discs with maximum thickness during the measurements. However, the most relevant factor in relation to temperature of brake discs while braking is their price.
Cooling the brake components in an open space showed slight differences depending on their price or thickness. Differences while cooling were almost negligible compared to differences while braking. These findings therefore introduce a potential risk, since low-priced brake components are heated substantially faster while braking but are cooled approximately in the same way as high-priced brake components.
Low-priced brake components generated lower braking force than mid-priced brake components. The biggest braking force was generated by high-priced components at the same effort to control the steering. However, the differences in the intensity of braking force were not significant, and as was mentioned, while vehicle braking on the road, they were to a large extent compensated by vehicle security systems.
Both brake discs and brake pads were not affected by any deformations or cracks after the measurements.
The low-priced brake discs had substantially lower corrosion resistance than the mid-priced and high-priced brake discs. The mid-priced brake discs had the best corrosion resistance.
The measurement results are highly coincident with the results mentioned in the publication of other authors that have been assessed and compared in this study. Based on the comparison of the measurement results with the results from the publications focused on the determination of differences in the brake components under different prices, it can be concluded that the differences in the level of brake components’ safety according to their price are very common.
The low-priced brake components used in the research of other authors also show a lower safety level under certain conditions than the high-priced ones. On the basis of the conclusions from a more extended literature mentioned in this study, it cannot be assumed that it would lead to a considerable change in the measurement results in relation to low-priced brake components of other producers, or when choosing the most high-priced brake components from the market.
This conclusion is grounded by the results of other authors mentioned in this publication on the one hand, and, on the other hand, by the assumption that if producers invest in the material, alloying and technology of the brake components more, they will not sell them at the lowest price on the market. The measurement results show a high concordance with the results of other authors. It also bears out an advantage of the comprehensiveness of the measurements from this study.
Based on the analysis of measurement results, it can be concluded that low-priced brake components do not pose a risk during common vehicle operation in comparison with mid-priced or high-priced brake discs. On the other hand, low-priced brake components can be a danger for road transport safety if there is an intense long-lasting braking, for instance in relation to a fully loaded vehicle driving downhill. When choosing brake components, their price should not be the only criteria for buying. Overall, the best results were not seen when using the high-priced brake discs, but when using the mid-priced ones. Thus, the higher price of brake discs does not always mean better properties.
Author Contributions
Conceptualization, F.S. and L.J.; methodology, F.S.; software, M.K.; validation, F.S. and L.J.; formal analysis, M.K.; investigation, F.S.; resources, F.S.; data curation, F.S.; writing—original draft preparation, F.S.; writing—review and editing, F.S.; visualization, F.S. and M.K.; supervision, F.S. and L.J.; project administration, F.S. and L.J.; funding acquisition, L.J. All authors have read and agreed to the published version of the manuscript.
Funding
This research was funded by the KEGA project Implementing of additive technologies into the education process of engineers study programs, grant number 001ŽU-4/2020.
Institutional Review Board Statement
Not applicable.
Informed Consent Statement
Not applicable.
Data Availability Statement
Not applicable.
Conflicts of Interest
The authors declare no conflict of interest.
References
- Hong, Y.; Jung, T.; Cho, C. Effect of heat treatment on crack propagation and performance of disk brake with cross drilled holes. Int. J. Automot. Technol. 2019, 20, 177–185. [Google Scholar] [CrossRef]
- Jeong, P.; Lee, J.; Oswald, M.; Kellner, S. Model-Based Brake Disc Temperature Prediction on High Speed Testing Mode and Circuit; SAE Technical Paper; SAE: Warrendale, PA, USA, 2020. [Google Scholar] [CrossRef]
- Bogdanov, V.; Bondareko, G.A.; Kovtanyuk, A.E.; Chabunin, I.S. High-performance calculation of the relation between the load of the motor vehicle undercarriage, its smoothness of the ride and the value of unsprung weights. In Proceedings of the CEUR Workshop, Khabarovsk, Russia, 14–16 September 2021; Volume 2930, pp. 212–218, ISSN 16130073. [Google Scholar]
- Saravanan, V.; Thyla, P.R.; Balakrishnan, S.R. A low cost, light weight cenosphere–aluminium composite for brake disc application. Bull. Mater. Sci. 2016, 39, 299–305. [Google Scholar] [CrossRef][Green Version]
- Cherrez, M.; Martìnez-Gomez, J.; Nicolalde, J.F.; Riofrio, A. Material selection based on multicrieria decision methods for brake disc manufacture. Adv. Intell. Syst. Comput. 2021, 1277, 428–439. [Google Scholar] [CrossRef]
- Kim, Y.C.; Kim, S.J.; Lee, J.; Kim, J.; Lee, S.; Yi, K.; Kim, K. Improvement of Manufacturing and Evaluation Technology for the Light Weight Brake Disc Composed of Hybrid Type Material; SAE Technical Paper; SAE: Warrendale, PA, USA, 2014. [Google Scholar] [CrossRef]
- Fuellgrabe, F.; Winner, H.; Hoffmann, I. New Joining Methods for Composite Brake Disks; SAE Technical Paper; SAE: Warrendale, PA, USA, 2010. [Google Scholar] [CrossRef]
- Budinsky, T.; Brooks, P.; Barton, D. A new analytical model of the brake pad for improved calculation of the centre of pressure and friction coefficient in a multi-piston disc brake. Int. J. Eng. Technol. 2018, 7, 54–63. [Google Scholar] [CrossRef]
- Gurumoorthy, S.; Grandhi, S.; Sridhar, S. Brake Pad Wear Prediction Using Finite Element Techniques; SAE Technical Paper; SAE: Warrendale, PA, USA, 2021. [Google Scholar] [CrossRef]
- Kumar, N.; Bharti, A.; Goyal, H.S.; Patel, K.K. The evolution of brake friction materials: A review. Mater. Phys. Mech. 2021, 47, 796–815. [Google Scholar] [CrossRef]
- Aras, S.; Tarakçıoğlu, N. Optimization and assessment of brake pad production parameters and organic Juniperus drupacea cone powder additive ratio using the Taguchi method. J. Compos. Mater. 2021, 55, 2705–2719. [Google Scholar] [CrossRef]
- Arman, M.; Singhal, S.; Chopra, P.; Sarkar, M. A review on material and wear analysis of automotive Break Pad. Mater. Today Proc. 2018, 5, 28305–28312. [Google Scholar] [CrossRef]
- Bernard, S.S.; Vivek, S.; Suresh, G.; Kannan, G.K. Influence of 3-(8,11,14-Pentadecatrienyl) phenol cardanol as a bio-based binder in a brake pad. In Lecture Notes in Mechanical Engineering; Springer: Berlin/Heidelberg, Germany, 2020; pp. 519–527. [Google Scholar] [CrossRef]
- Vivek, S.; Jayakumari, L.S.; Stephen Bernard, S.; Suresh, G.; Javeed, A.; Arulmurugan, S. Tribological and mechanical properties of biobased reinforcement in a friction composite material. Matéria 2020, 25, 1085. [Google Scholar] [CrossRef]
- Jung, S.P.; Yu, D.H. Mathematical method to estimate the friction coefficient of brake discs and pads during vehicle test. Trans. Korean Soc. Mech. Eng. A 2019, 43, 699–704. [Google Scholar] [CrossRef]
- Kim, Y.-G.; Kim, S.-W.; Park, C.-K.; Park, T.-W. Measurement of the disc-pad friction coefficient for mechanical brakes using direct and indirect methods. Int. J. Automot. Technol. 2011, 12, 51–58. [Google Scholar] [CrossRef]
- Lee, S.; Jeon, J.; Jeong, J.; Park, B.; Kim, S.; Kim, S.; Rhee, S.K.; Lee, W.G.; Cho, Y.S. Disc Brake Squeal vs. Disc Pad Compressibility-Caliper Stiffness Interactions: Low-Frequency Squeal and High-Frequency Squeal vs. Differential Pad Wear; SAE Technical Paper; SAE: Warrendale, PA, USA, 2017. [Google Scholar] [CrossRef]
- Tang, T.; Anupam, K.; Kasbergen, C.; Scarpas, A. Study of influence of operating parameters on braking distance. Transp. Res. Rec. 2017, 2641, 139–148. [Google Scholar] [CrossRef]
- Augsburg, K.; Hesse, D.; Feißel, T.; Wenzel, F.; Germanow, P. CFD based analysis of particle-air interaction within a sampling device for brake dust emissions. In Proceedings of the FISITA World Automotive Congress 2018, Chennai, India, 2–5 October 2018; ISBN 978-0-9572076-5-3. [Google Scholar]
- Adamowicz, A. Effect of convective cooling on temperature and thermal stresses in disk during repeated intermittent braking. J. Frict. Wear 2016, 37, 107–112. [Google Scholar] [CrossRef]
- Owusu-Ansah, P.; Alhassan, T.; Frimpong, A.; Agyemang, A.A. Survey of the causes of brake failure in commercial mini-buses in Kumasi. Res. J. Appl. Sci. Eng. Technol. 2014, 7, 4877–4882. [Google Scholar] [CrossRef]
- Yang, Y.; Wu, B.; Shen, Q.; Xiao, G. Numerical simulation of the frictional heat problem of subway brake discs considering variable friction coefficient and slope track. Eng. Fail. Anal. 2021, 130, 105794. [Google Scholar] [CrossRef]
- Quan, J.; Zhao, Y.; Tan, G.; Xu, Y.; Huang, B.; He, T. A Study on Safety Intelligent Driving System for Heavy Truck Downhill in Mountainous Area; SAE Technical Paper; SAE: Warrendale, PA, USA, 2018. [Google Scholar] [CrossRef]
- Peng, D.; Fang, K.; Tian, Z.; Zhang, Y.; Tan, G. Speed Planning System for Commercial Vehicles in Mountainous Areas; SAE Technical Paper; SAE: Warrendale, PA, USA, 2021. [Google Scholar] [CrossRef]
- Chen, L.; Guo, Z. Prediction model of brake drum temperature on continuous downgrade segments in high-altitude environment. Beijing GongyeDaxueXuebao/J. Beijing Univ. Technol. 2020, 46, 772–781. [Google Scholar] [CrossRef]
- Feng, J.; Tian, Z.; Cui, J.; Zhou, F.; Tan, G. Downhill Safety Assistant Driving System for Battery Electric Vehicles on Mountain Roads; SAE Technical Paper; SAE: Warrendale, PA, USA, 2019. [Google Scholar] [CrossRef]
- Talati, F.; Jalalifar, S. Analysis of heat conduction in a disk brake system. Heat Mass Transf. 2009, 45, 1047–1059. [Google Scholar] [CrossRef]
- Szabo, M.; Majdan, R.; Lindak, S.; Hajdak, V. Special monitoring device for evaluation of driving style of car drivers. In Proceedings of the 15th International Scientific Conference on Engineering for Rural Development, Jelgava, Latvia, 24–26 May 2017; pp. 696–701. [Google Scholar]
- Kaviyarasan, K.; Soundararajan, R.; Abhisheak Richter, R.; Siva, K.; Purusothaman, S.; Shiva Gurunathan, S. Comparing and Analysing the Static and Thermal Characteristics of Brake Disc for Three Different Materials; SAE Technical Paper; SAE: Warrendale, PA, USA, 2021. [Google Scholar] [CrossRef]
- Thiyagarajan, V.; Kalaichelvan, K.; Vijay, R.; Singaravelu, D.L. Influence of thermal conductivity and thermal stability on the fade and recovery characteristics of non-asbestos semi-metallic disc brake pad. J. Braz. Soc. Mech. Sci. Eng. 2016, 38, 1207–1219. [Google Scholar] [CrossRef]
- Gao, F.; Wu, B.W.; Yang, J.Y. Relationship of pad material parameters and brake disc temperature field. ZhongguoYouseJinshuXuebao/Chin. J. Nonferr. Met. 2020, 30, 837–846. [Google Scholar] [CrossRef]
- Hariram, V.; Suresh, R.; Reddy, J.S.; Reddy, A.B.; Nithinkumar, A.; Kiran, N.S.; Seralathan, S.; Premkumar, T. Thermo-structural analysis of brake disc-pad assembly of an automotive braking system. Int. J. Veh. Struct. Syst. 2021, 13, 497–504. [Google Scholar] [CrossRef]
- Abu Bakar, A.R.; Ouyang, H.; Khai, L.C.; Abdullah, M.S. Thermal analysis of a disc brake model considering a real brake pad surface and wear. Int. J. Veh. Struct. Syst. 2010, 2, 20–27. [Google Scholar] [CrossRef][Green Version]
- Zhou, S.; Zhao, X.; Zhou, D.; Guo, Z.; Xu, P.; Lu, S. Influence of thickness of friction ring on thermal capacity and thermal stress of brake disc. TiedaoXuebao/J. China Railw. Soc. 2018, 40, 55–60. [Google Scholar] [CrossRef]
- Zhang, Y.B.; Zhang, Y.Y. Coupling analysis of frictional heat under control of disc brake anti-skid brake system. Adv. Mater. Res. 2011, 199-200, 721–728. [Google Scholar] [CrossRef]
- Hoch, M.; Kaczmarek, M.; Ahr, M. Faster, Better, Economic–Newest Acid Zinc-Nickel Technology for Brake Caliper Plating; SAE Technical Paper; SAE: Warrendale, PA, USA, 2017. [Google Scholar] [CrossRef]
- Putra, M.R.A.; Pratama, P.S.; Prabowo, A.R. Failure of friction brake components against rapid braking process: A review on potential challenges and developments. Transp. Res. Procedia 2021, 55, 653–660. [Google Scholar] [CrossRef]
- Chilbule, C.; Weiss, D. Analysis of Changes in Disc-Brake Squeal Characteristic due to Regenerative Braking Simulation on Brake-Inertia-Dynamometer; SAE Technical Paper; SAE: Warrendale, PA, USA, 2019. [Google Scholar] [CrossRef]
- Day, T.D. Truck Brake Failure: Differences between Failure Modes for Drum and Disc Brakes; SAE Technical Paper; SAE: Warrendale, PA, USA, 2018. [Google Scholar] [CrossRef]
- Lawes, J. Car Brakes, a Guide to Upgrading, Repair and Maintance; The Crowood Press Ltd.: Marlborough, UK, 2014; ISBN 978 1 84797 675 8. [Google Scholar]
- Mackin, T.J.; Noe, S.C.; Ball, K.; Bedell, B.; Bim-Merle, D.; Bingaman, M.; Bomleny, D.; Chemlir, G.; Clayton, D.; Evans, H.; et al. Thermal cracking in disc brakes. Eng. Fail. Anal. 2002, 9, 63–76. [Google Scholar] [CrossRef]
- Liu, Y. Effect of high temperature on thermal fatigue crack initiation life of automotive gray cast iron brake disc. Chin. J. Mech. Eng. 2019, 55, 97–105. [Google Scholar] [CrossRef]
- Zhou, S. Prediction of crack propagation life of cast steel brake disc of EMU. Chin. J. Mech. Eng. 2018, 54, 154–159. [Google Scholar] [CrossRef]
- Mi, H.; Chen, D.; Guo, X.; Liu, Q. Discussion of the standard test method for determining leakage tendencies of automotive wheel bearing grease. Acta Pet. Sin. 2011, 27, 101–104. [Google Scholar] [CrossRef]
- Wu, B.; Mi, H.; Buo, X.; Chen, D. Analysis on failure of hub bearing greases based on rheology. NLGI Spokesm. 2013, 77, 23–31, ISSN 00276782. [Google Scholar]
- Caban, J.; Vrábel, J.; Šarkan, B.; Kuranc, A.; Słowik, T. Operational tests of brake fluid in passenger cars. Period. Polytech. Transp. Eng. 2021, 49, 126–131. [Google Scholar] [CrossRef]
- Bartak, J.; Cornak, S.; Balik, R. Some aspects of brake fluid boiling point evaluation. In Transport Means 2007: Proceedings of the 11 th International Conference; Transport means conference: Brno, Czech Repubic, 2007; pp. 92–94. ISSN 1822296X. [Google Scholar]
- Cornak, S. Prediction of the brake fluids quality and the vehicle safety, Transport means conference. In Proceedings of the International Conference, Brno, Czech republic, 21–22 October 2010; pp. 131–134, ISSN 1822296X. [Google Scholar]
- Caban, J.; Droździel, P.; Vrábel, J.; Šarkan, B.; Marczuk, A.; Krzywonos, L. The research on ageing of glycol-based brake fluids of vehicles in operation. Adv. Sci. Technol. Res. J. 2016, 10, 9–16. [Google Scholar] [CrossRef]
- Kuranc, A.; Zajac, G.; Szylak-Barglowics, J. Boiling point of the brake fluid based on alkyl ethers of alkylene glycols in vehicles being in use. Przemyslchemiczny 2018, 97, 2102–2105. [Google Scholar] [CrossRef]
- Ansah, P.O.; Agyamang, A.; Oduro, S.D. An experimental analysis of brake efficiency using four fluids in a disc brake system. Res. J. Appl. Sci. Eng. Technol. 2013, 5, 1302–1308. [Google Scholar] [CrossRef]
- Perricone, G.; Matĕjka, V.; Alemani, M.; Wahlström, J.; Olofsson, U. A test stand study on the volatile emissions of a passenger car brake assembly. Atmosphere 2019, 10, 263. [Google Scholar] [CrossRef]
- Woo, S.-H.; Kim, Y.; Lee, S.; Choi, Y.; Lee, S. Characteristics of brake wear particle (BWP) emissions under various test driving cycles. Wear 2021, 480–481, 203936. [Google Scholar] [CrossRef]
- Ratamero, L.; Ferreira, R.L. Wheel Cover Affected by the Heat Generated in the Brake System; SAE Technical Paper; SAE: Warrendale, PA, USA, 2010. [Google Scholar] [CrossRef]
- Bertasi, F.; Dudzik, B.; Mancini, A.; Bandiera, M.; Biondo, S.; Bonfanti, A. Rust Is Not a Must. Improvement of Discs Corrosion Resistance by Tuning of Grey Cast Iron Alloying Elements and Microstructure; SAE Technical Paper; SAE: Warrendale, PA, USA, 2020. [Google Scholar] [CrossRef]
- Bertasi, F.; Bandiera, M.; Bonfanti, A. Toward a Corrosion Proof Braking System; SAE Technical Paper; SAE: Warrendale, PA, USA, 2020. [Google Scholar] [CrossRef]
- Bandiera, M.; Mauri, A.; Besetti, M. Corrosion Phenomena in Braking Systems; NACE International: Houston, TX, USA, 2020; ISSN 03614409. [Google Scholar]
- Merlo, F.; Passarelli, U.; Pellerej, D.; Buonfico, P. Effect of Gray Cast-Iron Microstructure and Brake Pad Formula on Wear Behavior and Corrosion Sticking Influenced by Thermal Preconditioning: The Copper Role; SAE Technical Paper; SAE: Warrendale, PA, USA, 2012. [Google Scholar] [CrossRef]
- Hamid, M.A.; Kaulan, A.; Syahrullail, S.; Abu Bakar, A. Frictional characteristics under corroded brake discs. Procedia Eng. 2013, 68, 668–673. [Google Scholar] [CrossRef][Green Version]
- Lambert, S. Effects of ‘Black Steel’ and Its Contribution to Premature Brake Pad Replacement and Brake Pad Failure; SAE Technical Paper; SAE: Warrendale, PA, USA, 2015. [Google Scholar] [CrossRef]
- Gweon, J.; Park, J.; Lee, W.K.; Kim, D.Y.; Jang, H. Root cause study of corrosion stiction by brake pads on the grey iron disc. Eng. Fail. Anal. 2021, 128, 105583. [Google Scholar] [CrossRef]
- Gweon, J.; Shin, S.; Jang, H.; Lee, W.; Kim, D.; Lee, K. The Factors Governing Corrosion Stiction of Brake Friction Materials to a Gray Cast Iron Disc; SAE Technical Paper; SAE: Warrendale, PA, USA, 2018. [Google Scholar] [CrossRef]
- Robere, M. Disc Brake Pad Corrosion Adhesion: Test-to-Field Issue Correlation, and Exploration of Friction Physical Properties Influence to Adhesion Break-Away Force; SAE Technical Paper; SAE: Warrendale, PA, USA, 2016. [Google Scholar] [CrossRef]
- Chang, Y.-K.; Hwang, J.-R. Numerical model for prediction of brake judder due to wear and rust. Int. J. Automot. Technol. 2013, 14, 375–384. [Google Scholar] [CrossRef]
- Cho, K.H.; Han, J.M.; Jang, H.; Kim, S.J.; Lee, J.Y.; Park, H.D.; Oh, J.S.; Lim, J.D. Corrosion Induced Brake Torque Variation: The Effect from Gray Iron Microstructure and Friction Materials; SAE Technical Paper; SAE: Warrendale, PA, USA, 2005. [Google Scholar] [CrossRef]
- Park, C.W.; Shin, M.W.; Jang, H. Friction-induced stick-slip intensified by corrosion of gray iron brake disc. Wear 2014, 309, 89–95. [Google Scholar] [CrossRef]
- Shin, M.W.; Cho, K.H.; Kim, S.J.; Jang, H. Friction instability induced by corrosion of gray iron brake discs. Tribol. Lett. 2010, 37, 149–157. [Google Scholar] [CrossRef]
- Skrúcaný, T.; Semanová, Š.; Kendra, M.; Figlus, T.; Vrábel, J. Measuring of mechanical resistances of a heavy good vehicle by coastdown test. Adv. Sci. Technol. Res. J. 2018, 12, 214–221. [Google Scholar] [CrossRef]
- Althaus, D.; Braasch, A.; Schlummer, M.; Meyna, A. Reliability and safety in full brake systems with ABS. In Reliability, Risk and Safety: Back to the Future; CRC Press: Boca Raton, FL, USA, 2010; pp. 869–873. ISBN 978-041560427-7. [Google Scholar]
- Jacobsson, H. Aspects of disc brake judder. Proc. Inst. Mech. Eng. Part D: J. Automob. Eng. 2003, 217, 419–430. [Google Scholar] [CrossRef]
- Tan, L.K.; Goh, S.H. A price review framework for maintenance, repair and operations procurement contracts in the public sector. In Global Public Procurement Theories and Practices; Springer: Cham, Switzerland, 2017; ISBN 978-098554974-9. [Google Scholar]
- Furch, J. Design of operational vehicle maintenance programme. In Proceedings of the 13th International Conference Transport Means, Braunschweig, Germany, 18–20 February 2009; pp. 30–34. [Google Scholar]
- Kim, Y.; Hong, I. Study for brake friction value and anti corrosion performance by FNC disc compound layer thickness. Trans. Korean Soc. Automot. Eng. 2019, 27, 399–404. [Google Scholar] [CrossRef]
- Stubbs, P. Carbon-ceramic brake rotor reduces weight and corrosion. Adv. Mater. Processes 2004, 162, 8, ISSN 08827958. [Google Scholar]
- Li, W.; Yang, X.; Wang, S.; Xiao, J.; Hou, Q. Research and prospect of ceramics for automotive disc-brakes. Ceram. Int. 2021, 47, 10442–10463. [Google Scholar] [CrossRef]
- Sonsoles, D.; Marie, R.D.; Yoann, B.; Geord, B.; Kaylin, L.; Mock, P.; Mulholland, E.; Ragon, P.; Rodriguez, F.; Tietge, U.; et al. European Vehicle Market Statistics 2021/2022. Available online: https://theicct.org/publication/european-vehicle-market-statistics-2021-2022/ (accessed on 27 January 2021).
- Held, M.; Rosat, N.; Georges, G.; Pengg, H.; Boulouchos, K. Lifespans of passenger cars in Europe: Empirical modelling of fleet turnover dynamics. Eur. Transp. Res. Rev. 2021, 13, 1–13. [Google Scholar] [CrossRef]
- Hudec, J.; Šarkan, B.; Cződörová, R. Examination of the results of the vehicles technical inspections in relation to the average age of vehicles in selected EU states. Transp. Res. Procedia 2021, 55, 2–9. [Google Scholar] [CrossRef]
- Binar, T.; Svarc, J.; Rozlivka, J. Assesment of properties affecting the lyfe cycle of the spare part of the means of tranport. In Proceedings of the International Conference on Traffic and Transport Engineering (ICTTE), Belegrade, Serbia, 27–28 September 2018; pp. 422–427. [Google Scholar]
- Alalawin, A.; Arabiyat, L.M.; Alalaween, W.; Qamar, A.; Mukattash, A. Forecasting vehicle’s spare parts price and demand. J. Qual. Maint. Eng. 2020, 27, 483–499. [Google Scholar] [CrossRef]
- Hasni, M.; Aguir, M.; Babai, M.; Jemai, Z. Spare parts demand forecasting: A review on bootstrapping methods. Int. J. Prod. Res. 2019, 57, 4791–4804. [Google Scholar] [CrossRef]
- Karikalan, M.; Eswaran, A.; Krishnaswamy Raman, S. Systematic approach to estimate vehicle cost at end-of-life and different time intervals. In Proceedings of the FISITA World Automotive Congress, Chennai, India, 2–5 October 2018; ISBN 978-095720765-3. [Google Scholar]
- Kia Ceed Brake Discs & Pads Replacement. Available online: https://www.fixter.co.uk/brake-discs-pads-replacement/kia/ceed (accessed on 27 January 2022).
- Regulation No 90 of the Economic Commission for Europe of the United Nations (UN/ECE)—Uniform Provisions concerning the Approval of Replacement Brake Lining Assemblies and Drum Brake Linings for Power-Driven Vehicles and Their Trailers. Available online: https://eur-lex.europa.eu/LexUriServ/LexUriServ.do?uri=OJ:L:2010:130:0019:0049:EN:PDF (accessed on 27 January 2022).
- Vrabel, J.; Jagelcak, J.; Rievaj, V.; Caban, J. The quality of the brake components and its impact on the basic parameters of braking. Mach. Technol. Mater. 2014, 8, 6–8, ISSN 1313-0226. [Google Scholar]
- Lajgi, N.; Lajgi, S.; Rama, A. Influence of the different brands of braking pads in performance of vehicle braking system. Trans MotoautoWorld 2021, 6, 80–85, ISSN 2367-8399. [Google Scholar]
- Yevtushenko, A.; Grzes, P. 3D FE model of frictional heating and wear with a mutual influence of the sliding velocity and temperature in a disc brake. Int. Commun. Heat Mass Transf. 2015, 62, 37–44. [Google Scholar] [CrossRef]
- Kepekci, H.; Kosa, E.; Ezgi, C.; Cihan, A. Three-dimensional CFD modeling of thermal behavior of a disc brake and pad for an automobile. Int. J. Low-Carbon Technol. 2020, 15, 543–549. [Google Scholar] [CrossRef]
- Bauzin, J.-G.; Laraqi, N. Three-dimensional analytical calculation of the temperature in a brake disc of a high-speed train. Appl. Therm. Eng. 2019, 154, 668–675. [Google Scholar] [CrossRef]
- Kia Ceed 1.6 CVVT. Available online: https://www.cars-data.com/en/kia-ceed-1-6-cvvt-x-clusive-specs/18905 (accessed on 14 February 2022).
- XL-Meter Pro Gamma Expert. Available online: https://www.steffens-gmbh.de/XL-Meter-Pro-Gamma-Expert-Equipment-ohne-Kalibrierung (accessed on 27 January 2022).
- Road Vehicles. Speed Characteristics. Test methodsEN 30 0556. Available online: https://normy.unms.sk/eshop/public/standard_detail.aspx?id=57121 (accessed on 15 February 2022).
- Regulation No 13-H of the Economic Commission for Europe of the United Nations (UN/ECE)—Uniform Provisions Concerning the Approval of Passenger Cars with Regard to Braking. Available online: https://eur-lex.europa.eu/legal-content/EN/TXT/?uri=CELEX%3A42015X1222%2801%29 (accessed on 15 February 2022).
- Flir E55. Available online: https://www.flir.com/support/products/e55/#Documents (accessed on 14 February 2022).
- Bosch GIS 1000 C Professional ThermoDetector. Available online: https://www.tonghin.com.my/bosch-gis-1000-c-professional-thermo-detector.html (accessed on 14 February 2022).
- Febriani, R.A.; Park, H.S.; Lee, C.-M. A rule-based system for quality control in brake disc production lines. Appl. Sci. 2020, 10, 6565. [Google Scholar] [CrossRef]
- Hockicko, P.; Trpišová, B.; Ondruš, J. Correcting students’ misconceptions about automobile braking distances and video analysis using interactive program tracker. J. Sci. Educ. Technol. 2014, 23, 763–776. [Google Scholar] [CrossRef]
- Li, W.L.; Zhou, W.; Gao, L. Vehicle braking efficiency on-line monitoring and evaluation with MFDD. Adv. Mater. Res. 2013, 605–607, 968–971. [Google Scholar] [CrossRef]
- Rajendran, S.; Spurgeon, S.K.; Tsampardoukas, G.; Hampson, R. Estimation of road frictional force and wheel slip for effective antilock braking system (ABS) control. Int. J. Robust Nonlinear Control 2019, 29, 736–765. [Google Scholar] [CrossRef]
- Tanelli, M.; Ferrara, A.; Giani, P. Combined vehicle velocity and tire-road friction estimation via sliding mode observers. In Proceedings of the IEEE International Conference on Control Applications, Dubrovnik, Croatia, 3–5 October 2012; pp. 130–135. [Google Scholar] [CrossRef]
- Yan, H.; Feng, S.; Yang, X.; Lu, T. Role of cross-drilled holes in enhanced cooling of ventilated brake discs. Appl. Therm. Eng. 2015, 91, 318–333. [Google Scholar] [CrossRef]
- Sawczuk, W.; Jungst, M. Numerical analyzes and a comparative study of an automotive standard brake disc with a disc drilled along the Archimedes spiral. Arch. Automot. Eng. 2018, 79, 79–94. [Google Scholar] [CrossRef]
- Vyas, J.; Zinzuvadia, M.; Kathadi, M.I. Design and analysis of solid and cross-drilled disc brake rotors. Kalpa Publ. Eng. 2017, 1, 294–301. [Google Scholar] [CrossRef]
- Gupta, V.; Saini, K.; Garg, A.; Parkash, O. Comparative analysis of disc brake model for different materials investigated under tragic situations. Asian Rev. Mech. Eng. 2016, 5, 18–23. [Google Scholar]
- Yevtushenko, A.A.; Grzes, P. Initial selection of disc brake pads material based on the temperature mode. Materials 2020, 13, 822. [Google Scholar] [CrossRef] [PubMed]
- Duzgun, M. Investigation of thermo-structural behaviors of different ventilation applications on brake discs. J. Mech. Sci. Technol. 2012, 26, 235–240. [Google Scholar] [CrossRef]
- Purushotoman, M.; Kumar, M.; Kumar, V.; Suraj, K.; Senthamizh Selvan, S. Design and thermal validation of four wheeler disc brake using different material. Int. J. Innov. Technol. Explor. Eng. 2019, 9, 1739–1744, ISSN 22783075. [Google Scholar]
- Sokolska, J.; Sokolski, P. Thermal evaluation of operation of disc brakes made of selected materials. In Lecture Notes in Mechanical Engineering; Springer: Berlin, Germany, 2019; pp. 688–695. [Google Scholar] [CrossRef]
- Grzes, P. Maximum temperature of the disc during repeated braking applications. Adv. Mech. Eng. 2019, 11. [Google Scholar] [CrossRef]
- Hwang, P.; Wu, X.; Jeon, Y.B. Thermal–mechanical coupled simulation of a solid brake disc in repeated braking cycles. Proc. Inst. Mech. Eng. Part J. J. Eng. Tribol. 2008, 223, 1041–1048. [Google Scholar] [CrossRef]
- Rashid, A.; Strömberg, N. Sequential simulation of thermal stresses in disc brakes for repeated braking. Proc. Inst. Mech. Eng. Part J. J. Eng. Tribol. 2012, 227, 919–929. [Google Scholar] [CrossRef]
- Kim, S.W.; Lee, S.J.; Park, B.K.; Rhee, S.K. A Comprehensive Study of Humidity Effects on Friction, Pad Wear, Disc Wear, DTV, Brake Noise and Physical Properties of Pads; SAE Technical Paper Series; SAE International: Warrendale, PA, USA, 2011. [Google Scholar]
- Sapan, M.; Gopalkrishnan, V.; Vishal, G. Optimization of brake disc temperature through real world simulations, 2018. In Proceedings of the FISITA World Automotive Congress, Chennai, India, 2–5 October 2018; ISBN 978-095720765-3. [Google Scholar]
- Hirose, T.; Taniguchi, T.; Hatano, T.; Takahashi, K.; Tanaka, N. A study on the effect of brake assist systems (BAS). SAE Int. J. Passeng. Cars Mech. Syst. 2009, 1, 729–735. [Google Scholar] [CrossRef]
- Muthanandam, M.; Penumaka, A.; Kalakala, V. Assessing the potential benefits of Brake Assist System (BAS) based on India road accidents. In Proceedings of the FISITA World Automotive Congress, Chennai, India, 2–5 October 2018; Volume 2018, ISBN 978-095720765-3. [Google Scholar]
- Zhu, B.; Zhang, Y.; Zhao, J.; Chen, Z.; Jin, W. Accurate Pressure Control Based on Driver Braking Intention Identification for a Novel Integrated Braking System; SAE Technical Paper; SAE: Warrendale, PA, USA, 2021. [Google Scholar] [CrossRef]
- Zhu, B.; Zhang, Y.; Zhao, J. Precise control method for active brake pressure based on an integrated braking control system. ZhongguoGongluXuebao/China J. Highw. Transp. 2021, 34, 111–120. [Google Scholar] [CrossRef]
- Breuer, J.; Gleissner, S. New systems to avoid/mitigate rear-end collisions. VDI Berichte 2009, 1960, 393–402, ISBN 3180919604/978-318091960-7. [Google Scholar]
- Koylu, H.; Cinar, A. Dynamical investigation of effects of variable damper settings induced brake pressure oscillations on axle and wheel oscillations during ABS-braking based on experimental study. Meccanica 2013, 48, 1093–1115. [Google Scholar] [CrossRef]
- Jaesin, C.; Jihoon, R.; Jongkoo, S. Evaluation of brake fading compensation algorithm for abs performance by comparison of hil simulation and actual vehicle test, 2016. In Proceedings of the FISITA 2016 World Automotive Congress, Busan, Korea, 26–30 September 2016. [Google Scholar]
- Yuan, L.; He, R. Research on ABS slip ratio control of vehicle based on linear active disturbance rejection control. QicheGongcheng/Automot. Eng. 2021, 43, 1367–1374. [Google Scholar] [CrossRef]
- Janosko, I.; Polonec, T.; Simor, R. Electronic encyclopedia of construction engines and vehicles. In Proceedings of the 41st International Scientific Conference of Czech and Slovak University Departments and Institutions Dealing with the Research of Internal Combustion Engines, Liberec, Czech Republic, 20 January 2010; pp. 232–238. [Google Scholar]
- Zoller, T.; Attia, F. Perception threshold of brake pedal vibration and effect of masking noise and background vibration on it. In Proceedings of the 6th European Conference on Noise Control: Advanced Solutions for Noise Control, Tampere, Finland, 1 June 2006; pp. 1–6. [Google Scholar]
- Yang, Z.; Liu, C.; Wang, J.; Yang, X. Dynamic analysis of disc brake and impact law of related parameters on braking torque. In Proceedings of the 2010 IEEE International Conference on Information and Automation, ICIA 2010, Harbin, China, 20–23 June 2010; pp. 1478–1483. [Google Scholar] [CrossRef]
- Zhou, J. Experimental and simulation research on the influence of dynamic friction coefficient to the temperature field of disc brake. Chin. J. Mech. Eng. 2016, 52, 150–157. [Google Scholar] [CrossRef]
- Okamura, T. Experimental Study of Effect of Brake-Disc Surface Texture on Friction and Wear through Small-Scale Tests on Tribotester; SAE Technical Paper Series; SAE International: Warrendale, PA, USA, 2013. [Google Scholar]
- Meng, D.; Zhang, L.; Fang, M.; Yu, Z. Vacuum booster—Brake master cylinder system dynamic model for brake pedal feel. TongjiDaxueXuebao/J. Tongji Univ. 2014, 42, 1897–1903, ISSN 0253374X. [Google Scholar]
- Zhang, L.; Ruan, C.; Meng, D. The influence of vacuum booster design parameters on brake pedal feel. SAE Int. J. Passeng. Cars Mech. Syst. 2014, 7, 1311–1320. [Google Scholar] [CrossRef]
- Meng, D.; Zhang, L.; Yu, Z. A dynamic model for brake pedal feel analysis in passenger cars. Proc. Inst. Mech. Eng. Part D J. Automob. Eng. 2015, 230, 955–968. [Google Scholar] [CrossRef]
- Synák, F.; Rievaj, V.; Kučera, M.; Šebök, M.; Skrúcaný, T. Effect of repeated vehicle braking on the warming of selected parts of the vehicle. Sci. J. Sil. Univ. Technol. Ser. Transp. 2020, 107, 183–196. [Google Scholar] [CrossRef]
- Cravero, C.; Marsano, D. Flow and thermal analysis of a racing car braking system. Energies 2022, 15, 2934. [Google Scholar] [CrossRef]
- Jagelčák, J.; Gnap, J.; Kostrzewski, M.; Kuba, O.; Frnda, J. Calculation of an average vehicle’s sideways acceleration on small roundabouts. Sensors 2022, 22, 4978. [Google Scholar] [CrossRef]
- Broniszewski, J.; Piechna, J.R. Fluid-structure interaction analysis of a competitive car during brake-in-turn manoeuvre. Energies 2022, 15, 2917. [Google Scholar] [CrossRef]
Publisher’s Note: MDPI stays neutral with regard to jurisdictional claims in published maps and institutional affiliations. |
© 2022 by the authors. Licensee MDPI, Basel, Switzerland. This article is an open access article distributed under the terms and conditions of the Creative Commons Attribution (CC BY) license (https://creativecommons.org/licenses/by/4.0/).

