1. Introduction
The most frequent etiological cause of scoliosis is idiopathic, neuromuscular is the second most frequent cause and congenital anomalies are the least frequent causes of scoliosis [
1,
2,
3]. It is estimated that the prevalence of idiopathic scoliosis among patients aged 10 to 16 years is 2–3% [
1]. Scoliosis causes multiple trunk deformations that can affect a person’s perception of their body, and body image reflects a dynamic representation that changes according to actions, emotions and feelings, ultimately being an important factor when assessing health-related quality of life [
4]. The proportion of individuals that require surgery is higher in neuromuscular and congenital scoliosis than in idiopathic scoliosis [
5,
6]. The socioeconomic impact of scoliosis is significant, affecting the individual, their families and health professionals. The average cost of surgery for idiopathic scoliosis correction varies, costing approximately US
$50,000 [
7]. For different types of scoliosis, early diagnosis might prevent more aggressive treatment and reduce the rate of complications [
1,
5,
6,
7,
8]. School-based screening protocol using clinical examinations could be a reasonable option in the early diagnosis of adolescent idiopathic scoliosis due to its high specificity [
9].
The most commonly used, available and cost-effective complementary diagnostic test for detecting scoliosis is spinal X-ray examination [
8,
10]. In the preoperative planning stage, it is common to use radiographs obtained with and without traction or bending films to observe curve flexibility [
5,
6]. Surgical planning must consider the perioperative clinical risks, need for osteotomies, quantity and quality (screws, hooks, tapes, cages, rods) of implants, possibility of reoperation and alignment of the possibilities of deformity correction with the expectations of the family. All complementary examinations must be ordered with rationality regarding changes in the surgical plan or therapy with respect to their additional cost and patient safety, especially in the case of examinations involving ionizing radiation [
7,
10,
11].
There are studies in the literature associating the preoperative flexibility of the scoliotic curve with the degree of correction obtained in the postoperative period [
12,
13]. However, there are few reports on whether lower preoperative curve flexibility, i.e., greater spinal stiffness, is associated with a higher rate of late mechanical complications. This information is important for planning and therapeutic decision-making by both the multidisciplinary team and the family.
The present study aims to analyze whether greater preoperative curve flexibility is related to greater deformity correction and fewer late mechanical complications.
2. Materials and Methods
This was a retrospective cohort study of all patients undergoing the correction of scoliosis (idiopathic adolescent, infantile, congenital or neuromuscular) between 2015 and 2019 at a single institution.
The inclusion criteria were as follows: patients with scoliosis with surgical indications who had preoperative spinal X-rays in the frontal and lateral views with and without traction or bending films, as well as postoperative spinal X-rays; and minimum follow-up of 24 months. The exclusion criteria were as follows: incomplete records; adult and elderly patients with degenerative scoliosis.
All X-ray examinations were performed at the same institution, with standardized image acquisition for frontal, lateral, traction or bending films.
The primary variables were defined: Cobb angle, flexibility, mechanical failure, etiology, levels fused. All variables analyzed are available in
Appendix A,
Table A1.
Mechanical complications, including material failure, were defined as follows, according to an assessment based on spinal X-ray images: radiolucent halo, suggestive of loosening around the implant material greater than or equal to 2 mm; breakage of the implant material; presence of proximal or distal junctional kyphosis (defined as an increase greater than or equal to 10 degrees between the instrumented proximal or distal segment and the segment immediately distal to it).
Flexible curves were defined as the difference in percentages equal to or greater than 40% when comparing curves preoperatively without traction, with traction or bending films.
Data are described as the frequency and confidence interval for qualitative variables and measures of central tendency (mean and median) and dispersion (standard deviation, interquartile range, minimum and maximum) for quantitative variables. All analyses were performed using R software (Developer R Core Team, version 4.1.0—May 2021, Vienna, Austria), and results with a p-value < 0.05 were considered statistically significant. The existence of associations between qualitative variables was tested with the chi-square test. The association of qualitative variables with quantitative variables was tested with the Mann–Whitney test, and the correlation between quantitative variables was tested with Spearman’s correlation. Nonparametric tests were selected because the quantitative variables of interest did not present a normal distribution (Kolmogorov–Smirnov test, p < 0.05). The strength of the correlation was classified as very weak (0 to 0.19), weak (0.20 to 0.39), moderate (0.40 to 0.69), strong (0.70 to 0.89) or very strong (0.90 to 1). The time to material failure and its association with qualitative variables were analyzed with Cox regression (survival analysis, using the survival package).
Statistical analyses were performed by an independent statistician blinded to the data. The study was approved by the institutional review board.
3. Results
A total of 330 patients, 88 males and 242 females, with a mean age of 16.98 years at surgery, were included. The mean outpatient follow-up time was 2.9 years (median, 934 days). Eighty-four patients were excluded due to a lack of adequate X-rays, complete medical records or a sufficient follow-up time. Descriptive statistics of primary variables are described in
Table 1 and
Table 2.
Testing the association between the flexibility of the curve (flexible or nonflexible) and the occurrence of material failure revealed no statistical association, despite the apparent excess of failures among patients with nonflexible curves (
Table 3a). Additionally, there was no clear association between the degree of flexibility and material failure when evaluated as the absolute difference in degrees or in percentages (
Table 3b).
Curve flexibility (flexible or nonflexible) was compared with the percent correction in the postoperative period, as described in
Table 3c.
The results of Spearman’s correlation between the difference in curves with and without traction and the percent correction in the postoperative period are shown in
Table 3d,e.
Evaluating the occurrence of material failure by etiology did not yield a significant result, as shown in
Table 3f. There were very few cases with a congenital etiology for inclusion in the proposed analysis, and among other causes, there was an apparent tendency toward greater failure among patients with a neuromuscular etiology.
On further group analysis, it was observed that revision surgery was more common among patients with a neuromuscular etiology (
Table 4).
Age, weight, and height at surgery and number of instrumented levels were tested for an association with the percent correction of the main and secondary curves (
Table 5). Among them, the only factor that showed a correlation with the percent curve correction and material failure was the number of instrumented levels; paradoxically, the smaller the number of instrumented levels, the greater the correction percentage.
Occurrence of material failure demonstrated a significant association with ambulation and etiology (
Table 5).
As shown in
Table 6, the overall cumulative risk of material failure in the first year after surgery was 2.73% and 10.1% in the four years after surgery. The variables that were compared with the occurrence of material failure (ambulation, sex, main curve flexibility and etiology) were submitted to Cox regression according to the follow-up time and time of material failure.
4. Discussion
Scoliosis correction surgeries are complex and challenging [
6,
7,
10] and lack of satisfactory bone fusion can lead to numerous mechanical and clinical complications [
8,
11,
14]. In the present study, it was hypothesized that greater preoperative scoliotic curve flexibility is a protective factor for the occurrence of long-term mechanical complications. However, the findings do not statistically support this hypothesis, despite the apparent excess of failures among patients with nonflexible curves.
A higher percentage of correction in the postoperative period was observed among curves classified as flexible (
Table 1,
Table 2 and
Table 3). On average, 21.73 degrees of main scoliotic curve correction was obtained, with an average correction of 70% of its value in degrees.
The results of Spearman’s correlation between the difference in curves without and with traction or bending films and the percent correction in the postoperative period revealed a significant relationship only for the main curve, not the secondary curves. Additionally, the effect was weak, with an r of only 0.23 (
Table 3d).
When evaluating flexibility as a percentage, both the main and secondary curves showed a significant correlation with the correction achieved and with a more intense effect than when observing absolute values in degrees. Even so, for the comparative flexibility of the main curve, which showed the greatest effect, the value is considered only moderate (
Table 3e). This fact is consistent with findings from previous studies [
15,
16]. Among the hypotheses to explain this finding, the following stand out: technical variability between spinal X-ray images obtained with and without traction could perhaps underestimate the power of correction; the study sample had a large number of patients with severe and rigid curves, in whom the influence of traction during spinal X-ray examination could be smaller; and the reduction maneuvers, osteotomies and other reduction tactics used in different cases were not compared.
On comparison of age, weight, height and number of instrumented levels with the percent scoliotic curve correction, only the last variable showed a statistically relevant result, though with a weak effect; a smaller number of instrumented levels was associated with greater correction (
Table 5). This fact may indicate bias in the study given that the sample is from a heterogeneous population with varying degrees of scoliotic curve severity and rigidity, as several studies comparing implant density and proximal and distal fixation with outcomes have shown results conflicting with those presented here [
17,
18,
19,
20].
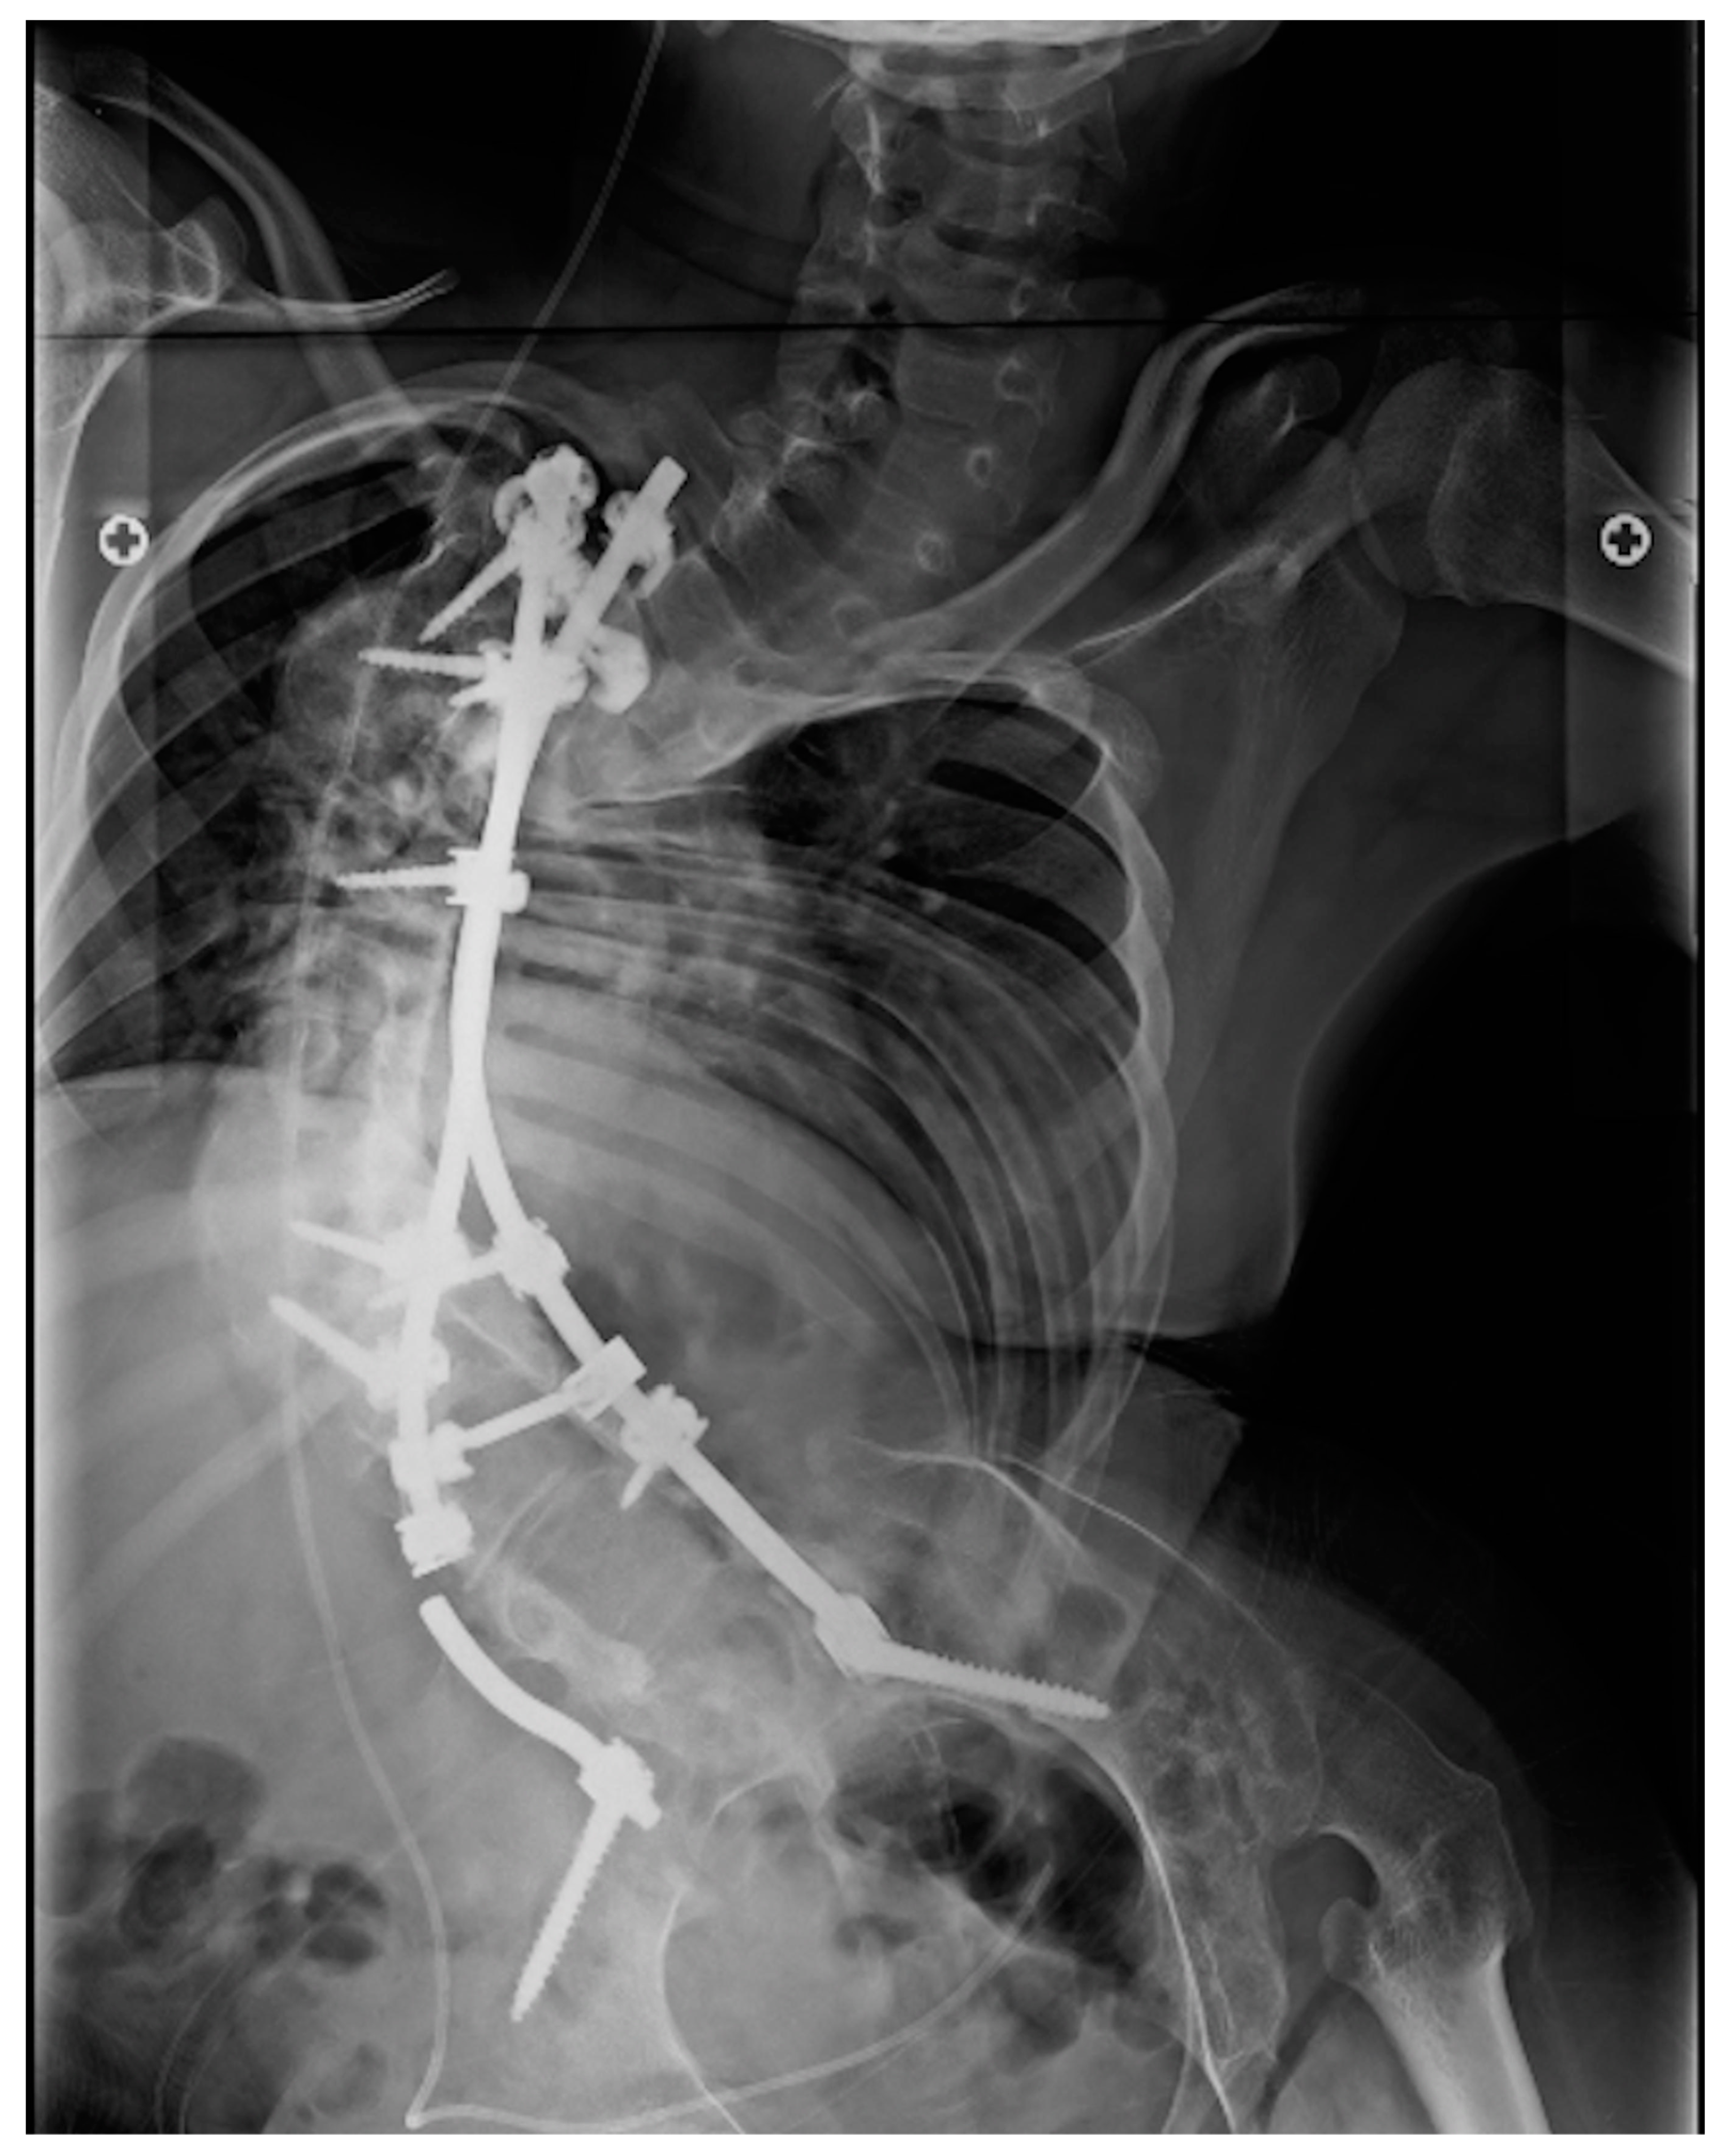
The probability of material failure was 2.73% in the first year after surgery and 10.1% over four years (example,
Figure 1). The average time from surgery to diagnosis of the complication was 309 days. Of the 330 patients included in the study, only 21 (6.36%) had implant failure, and of those, only 9 required revision surgery. This fact demonstrates that most patients, even those with mechanical failure, did not need revision surgery due to the absence of clinical complaints or neurological dysfunction.
The ability to ambulate is a protective factor against material failure (RR, 0.27), and patients with neuromuscular scoliosis, excluding cerebral palsy as an etiology, are 3.33 times more likely to have mechanical failure than patients with idiopathic scoliosis (example,
Figure 2). This fact agrees with previous findings in the literature, in which patients with neuromuscular scoliosis or who do not ambulate have higher rates of complications than those with idiopathic or congenital scoliosis [
21,
22,
23]. Possible explanations for this fact are greater curve severity, poorer bone quality and nutrition, lower muscle mass, less subcutaneous and skin coverage, and more unfavorable clinical aspects, such as poor ventilatory function and recurrent infections, among other factors [
24].
Among the limitations of the study, there was a high percentage of patients lost to follow-up according to the exclusion criteria, especially regarding correct and complete data in medical records and sufficient postoperative follow-up. The peculiarity of dealing with a heterogeneous sample population may make it impossible to fully generalize the findings. Another limitation is the fact that patients were operated on by different surgeons within the same institution. We cannot fail to mention the fact that the manufacturers of the implants used in the studied patients are unknown as a possible limiting factor in the study. It is possible that different materials have different technical and mechanical properties, although the overall number of implant-related failures is relatively low.
5. Conclusions
Preoperative spinal X-ray examination with traction or bending films is a reasonable option for assessing scoliotic curve flexibility and can serve as another tool to facilitate decision making by surgical teams, patients and their families because flexible curves have a better chance of achieving better correction postoperatively. On the other hand, patients with neuromuscular scoliosis or who are not capable of ambulating can be informed of the increased risks of late mechanical complications. Although the rate of late mechanical complications was apparently smaller among patients with flexible curves, the findings do not statistically support the hypothesis.
Author Contributions
Conceptualization, all authors; methodology, M.C.M.T.J.; software, M.C.M.T.J.; validation, all authors; formal analysis, all authors; investigation, M.C.M.T.J. and O.B.L.; resources, O.B.L.; data curation, all authors; writing—original draft preparation, all authors; writing—review and editing, all authors; visualization, all authors; supervision, O.B.L.; project administration, M.C.M.T.J.; funding acquisition, O.B.L. All authors have read and agreed to the published version of the manuscript.
Funding
This research was funded by AACD, Sao Paulo, Brazil—grant number 3.668.289.
Institutional Review Board Statement
The study was conducted in accordance with the Declaration of Helsinki, and approved by the Institutional Review Board (or Ethics Committee) of AACD (CAAE 17954119.0.000.0085, date of approval: 29 October 2019).
Informed Consent Statement
All data were collected and anonymized centrally and retrospectively and due to ethical concerns if consent was required (the only link to participants would be the consent, contacting participants could inflict harm on individuals or their families), informed consent was waived by institutional review board.
Data Availability Statement
Datasets generated during and/or analyzed during the current study are available from the corresponding author on reasonable request.
Conflicts of Interest
The authors declare no conflict of interest.
Appendix A
List of all variables:
Quantitative:
Age at surgery (years);
Weight at surgery (kilograms);
Height at surgery (centimeters);
Outpatient follow-up time (days);
Number of fixed levels (vertebral intervals);
Preoperative and postoperative pelvic obliquity (degrees);
Preoperative and postoperative thoracic kyphosis (degrees);
Preoperative and postoperative lumbar lordosis (degrees);
Curve 1, proximal thoracic preoperative scoliosis without traction (degrees);
Curve 2, thoracic preoperative scoliosis without traction (degrees);
Curve 3, thoracolumbar or lumbar preoperative scoliosis without traction (degrees);
Curves 1, 2 and 3, preoperative scoliosis with traction (degrees);
Curves 1, 2 and 3, postoperative scoliosis (degrees);
Time from surgery to complications (days);
Number of revision procedures.
Qualitative:
Sex (male or female);
Instrumentation—description of fixed intervals with notation T# (T: thoracic vertebra, #: level), L# (L: lumbar vertebra, #: level), and iliac;
Outpatient ambulatory (yes or no);
Baseline pathology (neuromuscular–cerebral palsy {CP}, neuromuscular {other causes}, idiopathic or congenital);
Material failure (yes or no);
Revision surgery (yes or no).
To perform the statistical analysis, another 20 variables were created. Quantitative variables are marked with an asterisk.
Table A1.
Definition of all variables, calculation method and unit.
Table A1.
Definition of all variables, calculation method and unit.
| | Variable | Calculation Method | Unit |
|---|
| 1 | Definition of scoliosis—main curve | Curve with the highest value in degrees on preoperative radiography without traction | Curve 1; |
| Curve 2; |
| Curve 3 |
| 2 | * Degree of main curve flexibility | Difference in degrees of preoperative curves with and without traction or lateral tilting | Degrees |
| 3 | * Degree of secondary curve flexibility | Difference in degrees of preoperative curves with and without traction or lateral tilting | Degrees |
| 4 | * Main curve flexibility percentage | Difference in degrees of the curve without traction and with traction or lateral tilting, divided by the value of the curve without traction | % |
| 5 | * Secondary curve flexibility percentage | Difference in degrees of the sum of the curves without traction and with traction or lateral tilting, divided by the value of the sum of the curves without traction | % |
| 6 | Main curve flexibility | Flexibility percentage equal to or greater than 40%, flexible; flexibility percentage less than 40%, nonflexible | Flexible; |
| Nonflexible |
| 7 | Secondary curve flexibility | Flexibility percentage equal to or greater than 40%, flexible; flexibility percentage less than 40%, nonflexible | Flexible; |
| Nonflexible |
| 8 | * Degree of main curve correction | Difference in degrees of the curve without traction between pre- and postoperatively | Degrees |
| 9 | * Percentage of main curve correction | Percentage of correction achieved through dividing the difference between the pre- and postoperative curves (degrees) by the preoperative value (degrees) | % |
| 10 | * Degree of secondary curve correction | Difference in degrees of the curve without traction between pre- and postoperatively | Degrees |
| 11 | * Percentage of secondary curve correction | Percentage of correction achieved through dividing the difference between the pre- and postoperative curves (degrees) by the preoperative value (degrees) | % |
| 12 | Normal-range preoperative pelvic obliquity | Preoperative pelvic obliquity equal to zero | Yes; |
| No |
| 13 | Normal-range postoperative pelvic obliquity | Postoperative pelvic obliquity equal to zero | Yes; |
| No |
| 14 | Comparison of pre- and postoperative normal-range pelvic obliquity | Comparison between qualitative variables 12 and 13 | |
| 15 | * Difference between pre- and postoperative pelvic obliquity | Difference in degree of pelvic obliquity between pre- and postoperative values | Degrees |
| 16 | * Percentage of pelvic obliquity correction | Percentage of correction achieved through dividing the difference between pre- and postoperative pelvic obliquity by the preoperative value | % |
| 17 | * Difference between pre- and postoperative kyphosis | Difference in degrees of postoperative and preoperative kyphosis | Degrees |
| 18 | *Percent correction of kyphosis | Percentage of correction achieved through dividing the difference between pre- and postoperative kyphosis by the preoperative value | % |
| 19 | * Difference between pre- and postoperative lumbar lordosis | Difference in degrees of postoperative and preoperative lumbar lordosis | Degrees |
| 20 | * Percent correction of lumbar lordosis | Percentage of correction achieved through dividing the difference between pre- and postoperative lumbar lordosis by the preoperative value | % |
References
- Weinstein, S.L.; Dolan, L.A.; Cheng, J.C.; Danielsson, A.; Morcuende, J.A. Adolescent idiopathic scoliosis. Lancet 2008, 371, 1527–1537. [Google Scholar] [CrossRef]
- Mackel, C.E.; Jada, A.; Samdani, A.F.; Stephen, J.H.; Bennett, J.T.; Baaj, A.A.; Hwang, S.W. A comprehensive review of the diagnosis and management of congenital scoliosis. Childs Nerv. Syst. 2018, 34, 2155–2171. [Google Scholar] [CrossRef] [PubMed]
- Allam, A.M.; Schwabe, A.L. Neuromuscular scoliosis. PM R 2013, 5, 957–963. [Google Scholar] [CrossRef]
- Notarnicola, A.; Fari, G.; Maccagnano, G.; Riondino, A.; Covelli, I.; Bianchi, F.P.; Tafuri, S.; Piazzolla, A.; Moretti, B. Teenagers’ perceptions of their scoliotic curves. an observational study of comparison between sports people and non- sports people. Muscles Ligaments Tendons J. 2019, 9, 225–235. [Google Scholar] [CrossRef]
- Murphy, R.F.; Mooney, J.F., 3rd. Current concepts in neuromuscular scoliosis. Curr. Rev. Musculoskelet Med. 2019, 12, 220–227. [Google Scholar] [CrossRef]
- Cognetti, D.; Keeny, H.M.; Samdani, A.F.; Pahys, J.M.; Hanson, D.S.; Blanke, K.; Hwang, S.W. Neuromuscular scoliosis complication rates from 2004 to 2015: A report from the Scoliosis Research Society Morbidity and Mortality database. Neurosurg. Focus 2017, 43, E10. [Google Scholar] [CrossRef]
- Baky, F.J.; Echternacht, S.R.; Milbrandt, T.A.; Maradit Kremers, H.; Ransom, J.; Stans, A.A.; Shaughnessy, W.J.; Larson, A.N. Predictors of cost for posterior spinal fusion in adolescent idiopathic scoliosis. Spine Deform. 2020, 8, 421–426. [Google Scholar] [CrossRef]
- Roberts, S.B.; Tsirikos, A.I. Factors influencing the evaluation and management of neuromuscular scoliosis: A review of the literature. J. Back Musculoskelet Rehabil. 2016, 29, 613–623. [Google Scholar] [CrossRef]
- Scaturro, D.; de Sire, A.; Terrana, P.; Costantino, C.; Lauricella, L.; Sannasardo, C.E.; Vitale, F.; Mauro, G.L. Adolescent idiopathic scoliosis screening: Could a school-based assessment protocol be useful for an early diagnosis? J. Back Musculoskelet Rehabil. 2021, 34, 301–306. [Google Scholar] [CrossRef]
- Meirick, T.; Shah, A.S.; Dolan, L.A.; Weinstein, S.L. Determining the Prevalence and Costs of Unnecessary Referrals in Adolescent Idiopathic Scoliosis. Iowa Orthop. J. 2019, 39, 57–61. [Google Scholar]
- Berrington de Gonzalez, A.; Darby, S. Risk of cancer from diagnostic X-rays: Estimates for the UK and 14 other countries. Lancet 2004, 363, 345–351. [Google Scholar] [CrossRef]
- Kuroki, H.; Nagai, T.; Chosa, E.; Tajima, N. Hanging radiograph in idiopathic scoliosis patients: Significance as a preoperative stress X-ray. J. Spine Surg. 2021, 7, 495–501. [Google Scholar] [CrossRef] [PubMed]
- Liu, R.W.; Teng, A.L.; Armstrong, D.G.; Poe-Kochert, C.; Son-Hing, J.P.; Thompson, G.H. Comparison of supine bending, push-prone, and traction under general anesthesia radiographs in predicting curve flexibility and postoperative correction in adolescent idiopathic scoliosis. Spine 2010, 35, 416–422. [Google Scholar] [CrossRef]
- Chaudry, Z.; Anderson, J.T. Curve flexibility in cerebral palsy-related neuromuscular scoliosis: Does the intraoperative prone radiograph reveal more flexibility than preoperative radiographs? Scoliosis Spinal Disord. 2017, 12, 15. [Google Scholar] [CrossRef] [PubMed]
- Tambe, A.D.; Panikkar, S.J.; Millner, P.A.; Tsirikos, A.I. Current concepts in the surgical management of adolescent idiopathic scoliosis. Bone Jt. J. 2018, 100, 415–424. [Google Scholar] [CrossRef] [PubMed]
- Liu, K.; Zhang, Q.; Li, X.; Zhao, C.; Quan, X.; Zhao, R.; Chen, Z.; Li, Y. Preliminary application of a multi-level 3D printing drill guide template for pedicle screw placement in severe and rigid scoliosis. Eur. Spine J. 2017, 26, 1684–1689. [Google Scholar] [CrossRef] [PubMed]
- Hedequist, D.J. Surgical treatment of congenital scoliosis. Orthop. Clin. N. Am. 2007, 38, 497–509. [Google Scholar] [CrossRef] [PubMed]
- Coe, J.D.; Arlet, V.; Donaldson, W.; Berven, S.; Hanson, D.S.; Mudiyam, R.; Perra, J.H.; Shaffrey, C.I. Complications in spinal fusion for adolescent idiopathic scoliosis in the new millennium. A report of the Scoliosis Research Society Morbidity and Mortality Committee. Spine 2006, 31, 345–349. [Google Scholar] [CrossRef]
- Auerbach, J.D.; Lonner, B.S.; Antonacci, M.D.; Kean, K.E. Perioperative outcomes and complications related to teaching residents and fellows in scoliosis surgery. Spine 2008, 33, 1113–1118. [Google Scholar] [CrossRef]
- Reames, D.L.; Smith, J.S.; Fu, K.M.; Polly, D.W., Jr.; Ames, C.P.; Berven, S.H.; Perra, J.H.; Glassman, S.D.; McCarthy, R.E.; Knapp, R.D., Jr.; et al. Complications in the surgical treatment of 19,360 cases of pediatric scoliosis: A review of the Scoliosis Research Society Morbidity and Mortality database. Spine 2011, 36, 1484–1491. [Google Scholar] [CrossRef]
- Ibrahim, T.; Gabbar, O.A.; El-Abed, K.; Hutchinson, M.J.; Nelson, I.W. The value of radiographs obtained during forced traction under general anaesthesia in predicting flexibility in idiopathic scoliosis with Cobb angles exceeding 60 degree. J. Bone Jt. Surg. Br. 2008, 90, 1473–1476. [Google Scholar] [CrossRef] [PubMed][Green Version]
- Tokala, D.P.; Nelson, I.W.; Mehta, J.S.; Powell, R.; Grannum, S.; Hutchinson, M.J. Prediction of Scoliosis Curve Correction Using Pedicle Screw Constructs in AIS: A Comparison of Fulcrum Bend Radiographs and Traction Radiographs Under General Anesthesia. Glob. Spine J. 2018, 8, 676–682. [Google Scholar] [CrossRef] [PubMed]
- Musapoor, A.; Nikkhoo, M.; Haghpanahi, M. A finite element study on intra-operative corrective forces and evaluation of screw density in scoliosis surgeries. Proc. Inst. Mech. Eng. H 2018, 232, 1245–1254. [Google Scholar] [CrossRef] [PubMed]
- Zhong, J.; Cao, K.; Wang, B.; Li, H.; Zhou, X.; Xu, X.; Lin, N.; Liu, Q.; Lu, H. Incidence and Risk Factors for Proximal Junctional Kyphosis in Adolescent Idiopathic Scoliosis After Correction Surgery: A Meta-Analysis. World Neurosurg. 2019, 125, e326–e335. [Google Scholar] [CrossRef] [PubMed]
| Publisher’s Note: MDPI stays neutral with regard to jurisdictional claims in published maps and institutional affiliations. |
© 2022 by the authors. Licensee MDPI, Basel, Switzerland. This article is an open access article distributed under the terms and conditions of the Creative Commons Attribution (CC BY) license (https://creativecommons.org/licenses/by/4.0/).


 ,
, 

