Abstract
It is agreed that portfolio optimization is of great importance for the financial market. However, input sensitivity and highly-concentrated portfolios have posed a challenge. In this paper, a random forest-based Black–Litterman model is developed, aiming to further enhance the portfolio performance, which adopts a novel method for generating investor views on the basis of random forests. More specifically, the view vector is generated based on the predicted asset returns obtained by random forests, and the confidence matrix which contains the uncertainty of each view is measured by the difference in the predicted values of multiple trees. Furthermore, motivated by decomposition strategy, a novel multi-objective DIRECT algorithm is introduced to effectively resolve the proposed model. Through the construction of a unique indicator, the algorithm possesses the capacity to select potentially-optimal hyperrectangles in all reference directions simultaneously, which will further improve the exploratory nature. Experimental results have demonstrated that the proposed algorithm achieves a better performance over NSGA-II and MOEA/D on the MOP and DTLZ benchmark problems. It is also experimentally verified that the random forest-based Black–Litterman model can obtain higher cumulative returns and Sharpe ratios in the application of Chinese stock markets when compared to the classic MV model.
1. Introduction
Portfolio optimization is the art of asset allocation to achieve the purpose of maximizing investment returns while matching investors’ risk tolerance. As an essential part of practical portfolio management, it has become an attracting issue in both academia and industry during the past few decades. In 1952, Markowitz proposed the Mean-Variance (MV) portfolio optimization model [1], which is regarded as the cornerstone of modern portfolio theory (MPT). Although the MV model has drawn much attention since its introduction, several obvious shortcomings are exposed gradually with the application of the model. The MV model describes the return and the risk of the portfolio by the mean and the variance of the asset returns, respectively [2,3], which means that the forecasting of asset returns will strongly influence portfolio performance. In practice, such forecasts are mainly based on their historical behavior, which may lead to considerable estimation errors. To address this problem, an enormous amount of attempts have been made.
The Black–Litterman (BL) model [4,5] is one of these attempts, which takes views on certain assets into consideration based on a Bayesian approach. Specifically, experts or investors give their subjective opinions on certain assets, and the BL model integrates them with the historical return data to create the future asset returns. Compared with the MV model, it is more stable in the process of forecasting asset returns and covariances, which helps to extend profit advantages and avoid risks, especially in volatile markets [6]. In the past decades, many researchers devoted themselves to the extension of BL model [7,8,9,10,11], in which novel methods to generate views is one of the most promising directions. With the development of artificial intelligence techniques, machine learning algorithms began to be employed for views generating [12,13,14,15] to replace the views given directly through expert experience. However, there is almost no study that places emphasis on the uncertainty introduced by the relevant predictive model itself.
BL portfolio construction is on the basis of the classic return-risk optimization, which is a typical multi-objective optimization problem (MOP). For these kinds of problems, evolutionary multi-objective optimization (EMO) algorithms such as MOEA/D [16] and NSGA-II [17] have fully demonstrated their niche [18]. However, EMO algorithms usually contain random operations in the process of the population initialization and evolution to maintain diversity, which leads to non-reproducibility, and lack a theoretical guarantee of global convergence. From the perspective of practice, multi-objective optimization is expected to be deterministic and theoretically convergent. Inspired by Lipschitzian global optimization [19,20], Jones et al. [21] introduced the DIviding RECTangles (DIRECT) algorithm, which does not require the Lipshitz constant and is more tractable in higher dimensions [22]. Due to the advantages of being easy to implement and having fewer hyperparameters (only one), some researchers explored extensions of DIRECT to make it possible to handle MOPs. However, most of them usually have a high computational complexity. Therefore, some algorithmic changes to the existing algorithms are somehow more practical.
This paper attempts to address a BL portfolio optimization problem in which particular attention is paid to the interesting issue of how to generate investor preferences systematically and precisely. With this goal, a novel random forest-based BL model is developed, and an approach to handle the model mentioned above in a short time, while maintaining high accuracy, is also proposed. The main contribution of this paper could be summarized as follows:
- We develop a new random forest-based BL portfolio optimization model in which a novel method for generating investor views on the basis of random forests is adopted. In this method, a view vector is generated based on the predicted asset returns obtained by random forests, and the confidence matrix which contains the uncertainty of each view is measured by the differences in the predicted values of multiple trees.
- We propose a decomposition-based multi-objective DIRECT algorithm, named multiDecompose, to handle the random forest-based BL model mentioned above in a short time while maintaining high accuracy, in which an indicator is explored to encourage potentially optimal hyperrectangles to be chosen in all directions. With this indicator, the algorithm can provide a better exploration of the search space of an MOP, especially when stuck in a local optimal Pareto set or a part of the global Pareto set.
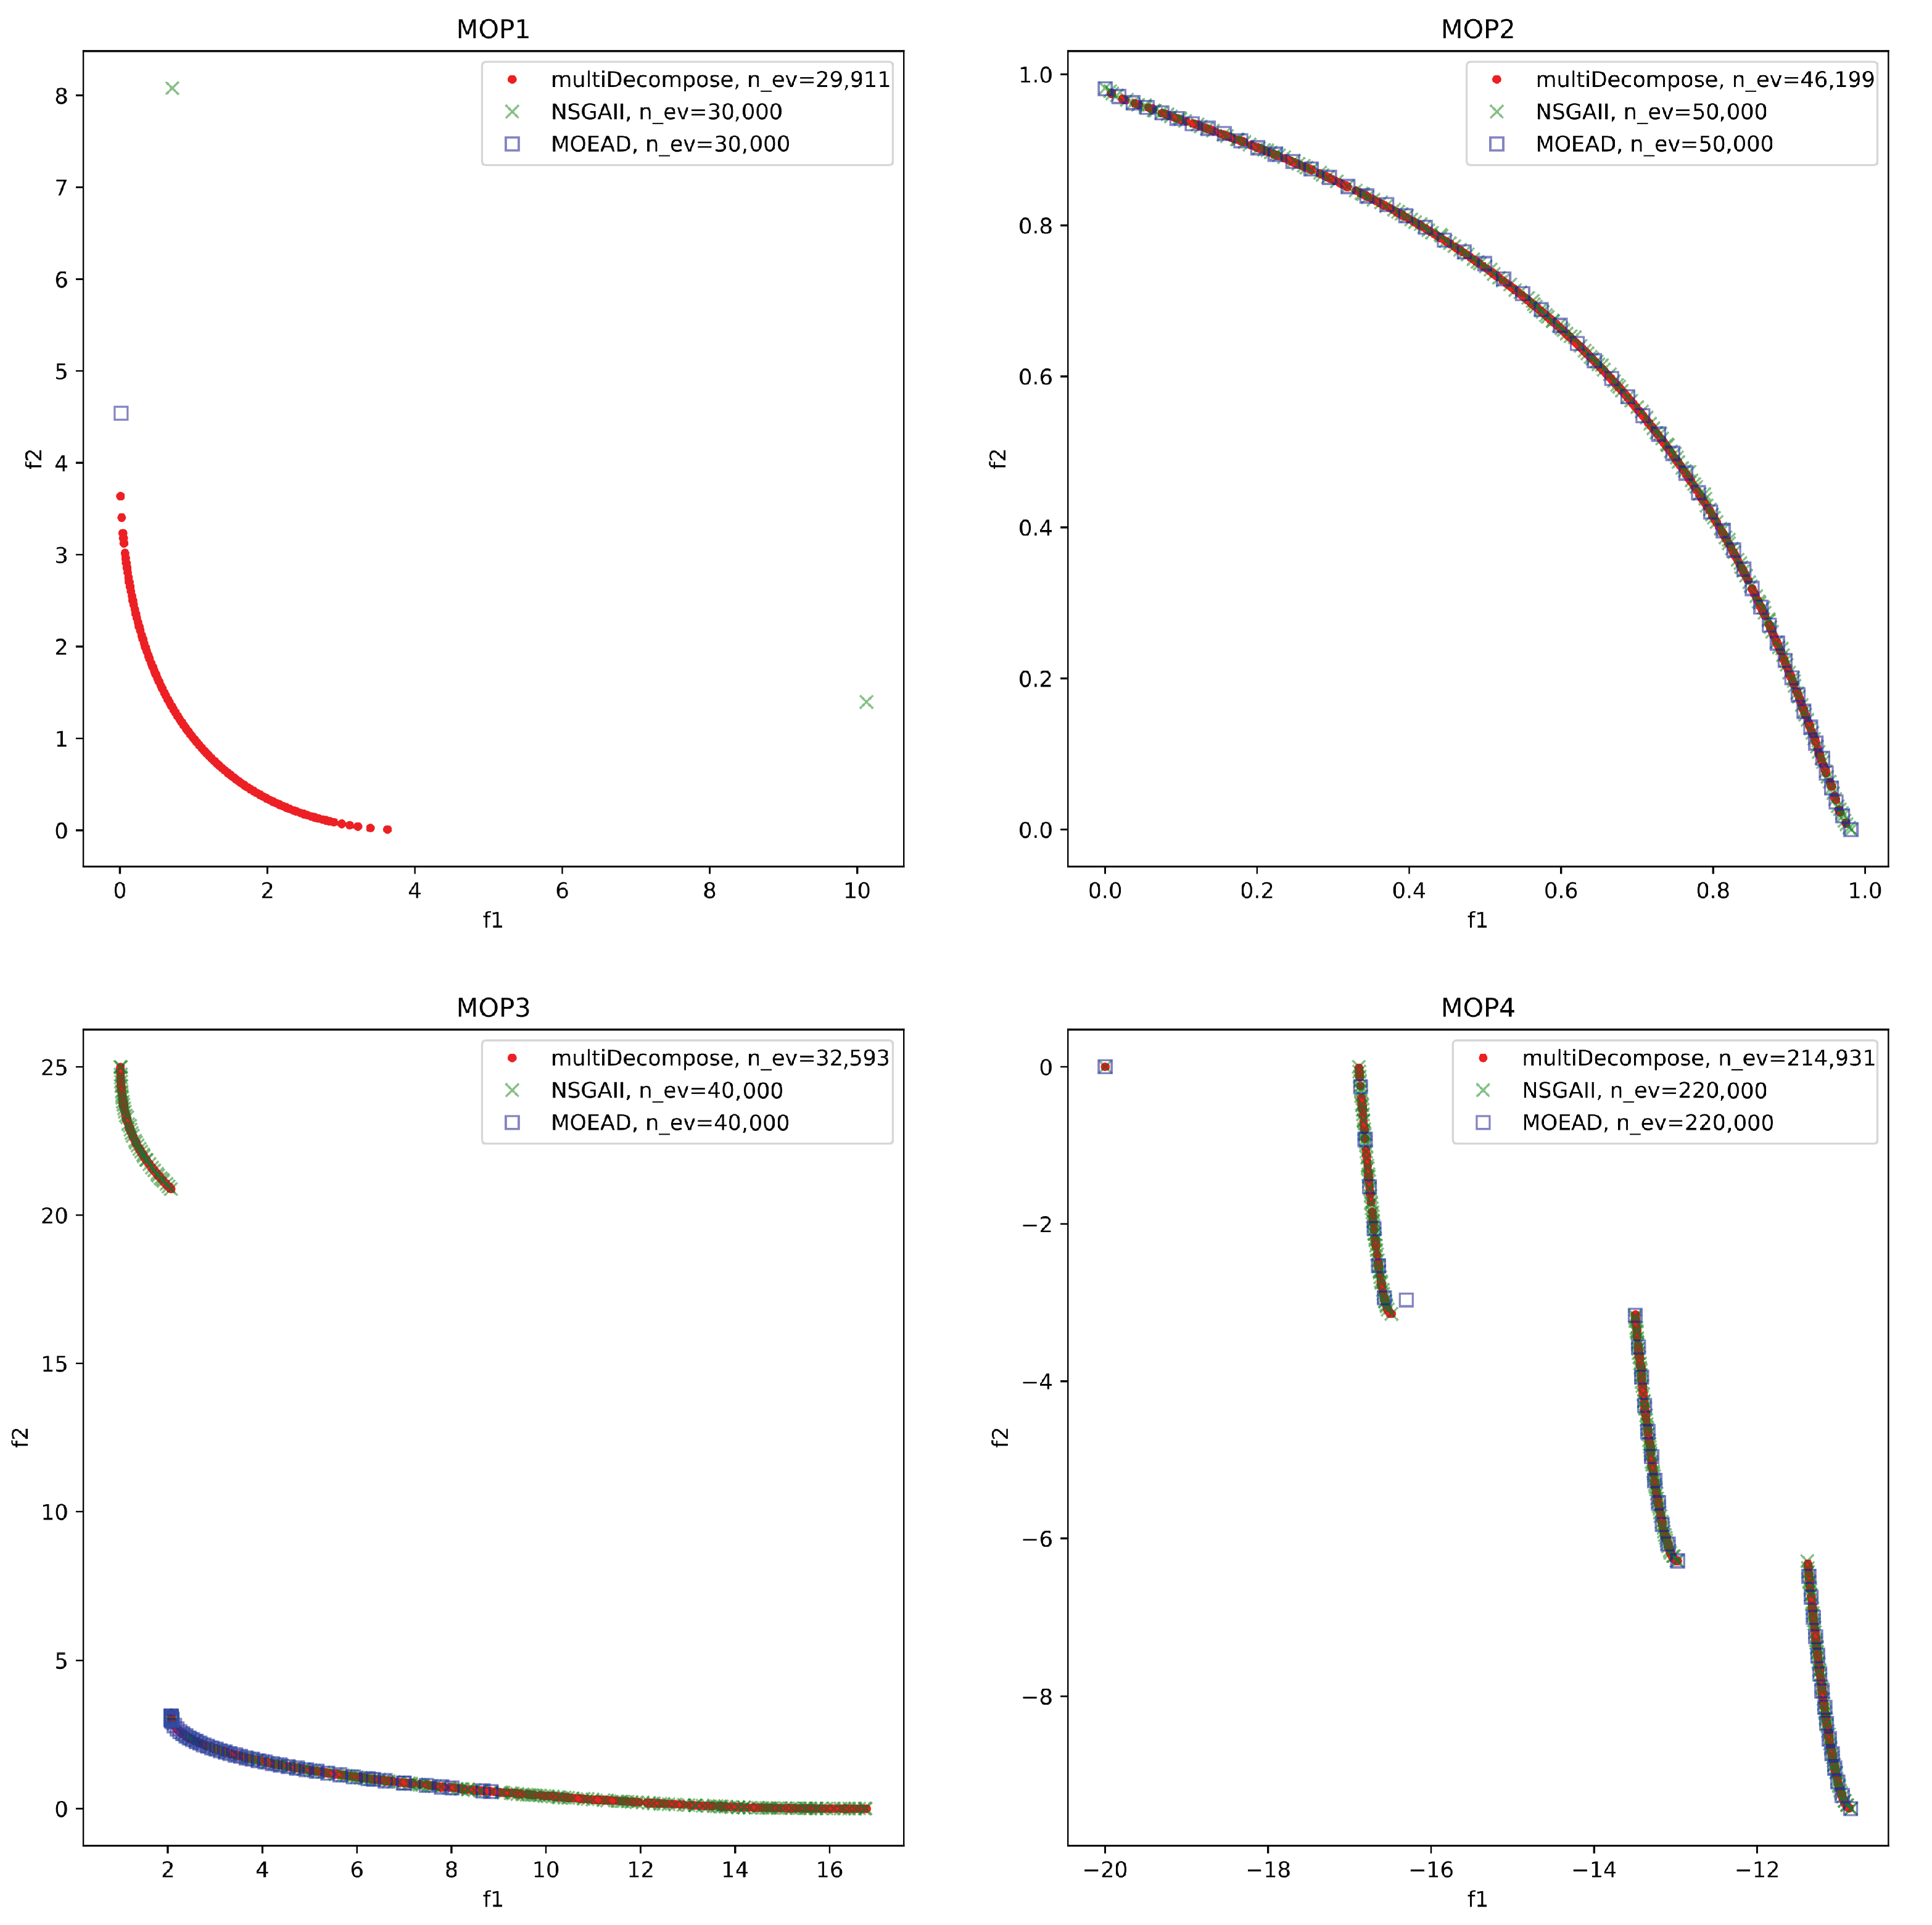
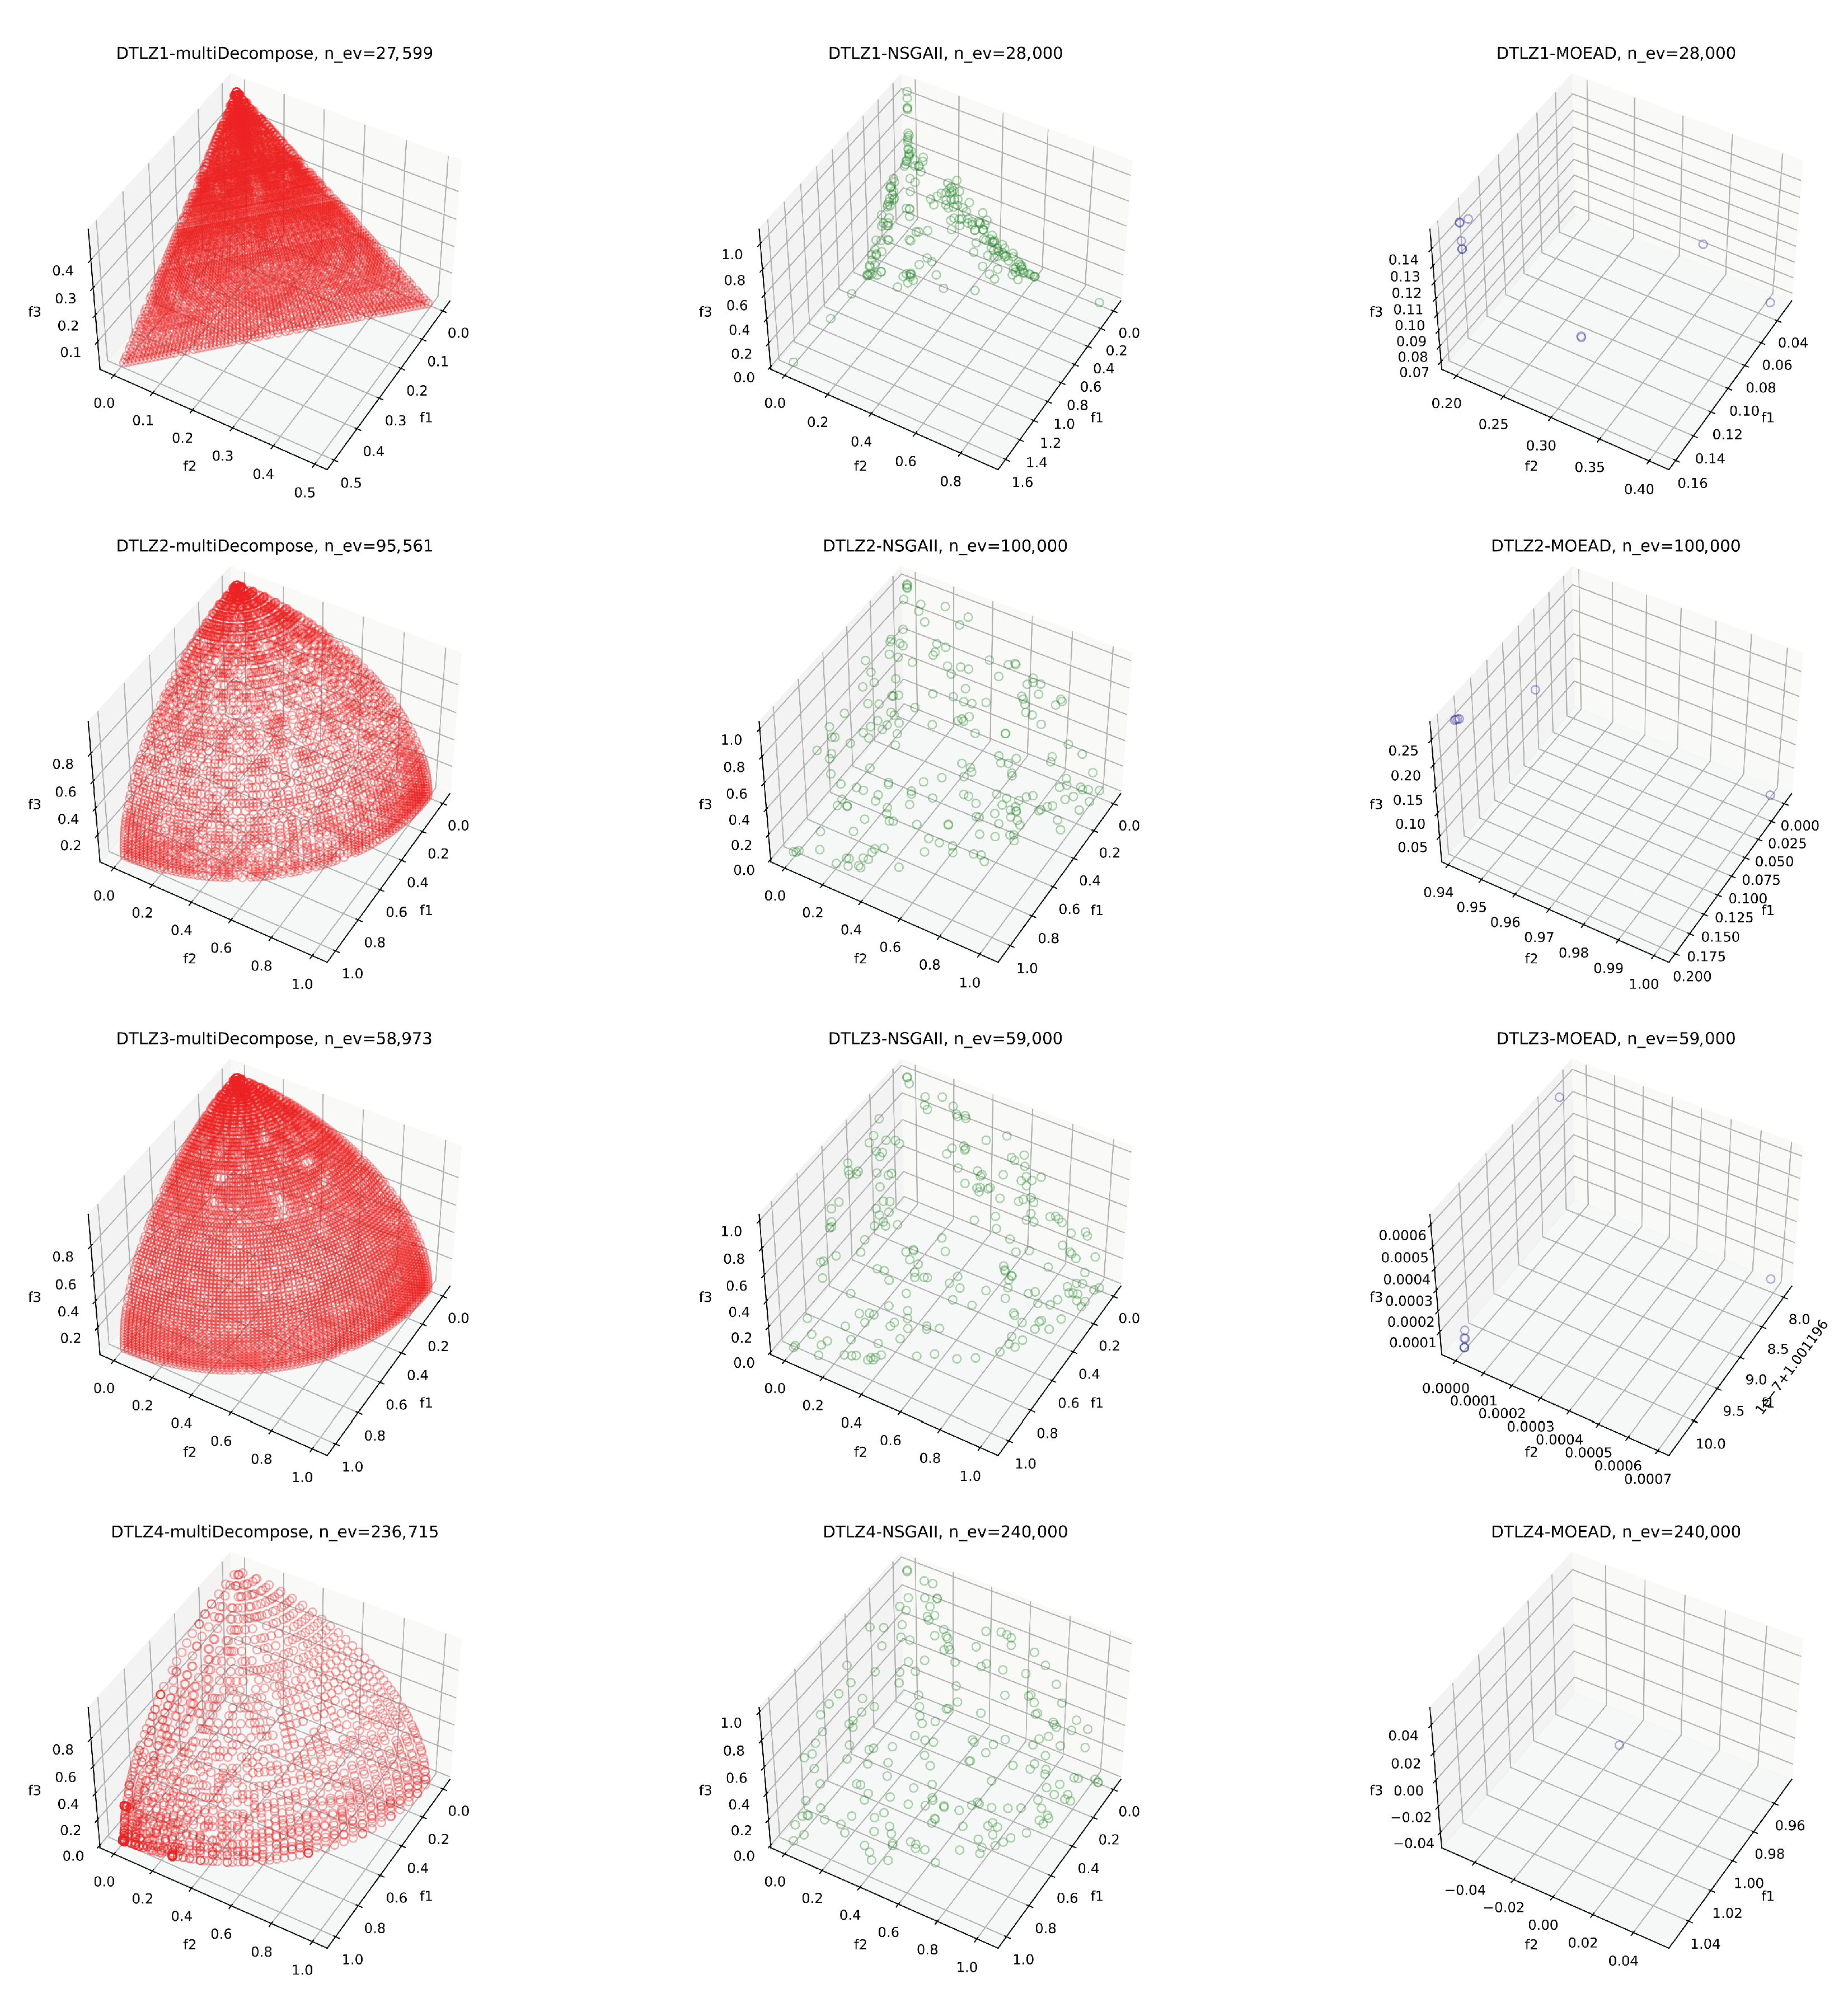
- We demonstrate the superiority of the proposed algorithm over NSGA-II and MOEA/D on the MOP and DTLZ benchmark problems as well as the effectiveness of solving random forest-based BL model. Moreover, we also test the performance of random forest-based BL model by a comparison with the MV model using the real-world data.
The rest of this paper is organized as follows. We first review some of the past studies on BL models and multi-objective DIRECT algorithms in Section 2. Section 3 is dedicated to relevant preliminaries. Thereafter, in Section 4, a random forest-based BL model is presented, followed by a decomposition-based multi-objective DIRECT algorithm. Then, in Section 5, we demonstrate the superiority of the proposed algorithm over NSGA-II and MOEA/D as well as its effectiveness on the model introduced before. Furthermore, we compare our model with the MV model using the real-world data. Finally, the findings and future perspectives are discussed in Section 6.
2. Related Work
In 1952, Markowitz first applied statistical measures to portfolio selection and proposed the MV model. In 1959, he further introduced the MPT based on the concept of diversification [23] which then became a hot topic in the past few decades. This theory offers an effective tool to obtain the minimized risk under a return target or vice versa. However, several obvious shortcomings have been exposed gradually with the application of the MPT and the MV model, such as depending solely on historical data and being prone to extreme asset allocation. These problems inspired a multitude of researchers to focus on the creative task of model improving.
In 1991, Fischer Black and Robert Litterman proposed the BL model by taking into account investor preferences from the perspective of Bayesian analysis [4]. From then, many researches have proved its advantages in volatile markets [24], which further contributes to its prosperity. For example, Satchell et al. [25] gave a readable mathematical description of the BL model and presented some extensions. Martellini and Ziemann [26] proposed a modified BL model that incorporates positive views of the performance of hedge fund strategies to extend its application to the hedge fund market. Cheung [7] clarified the assumptions and formulation of the BL model and extended it to large portfolio applications using a dimension-reduction technique. Figelman [27] combined a factor structure to BL model and applied it to multi-asset portfolio. Chen and Lim [28] introduced a generalized BL model that accounts for both misspecification and bias in the equilibrium and expert models.
As mentioned earlier, the BL model attaches importance to investor preferences. As a result, particular attention is paid to the interesting issue of how to generate investor preferences systematically and precisely. Alexander and Svetlana [12] made use of random forests to generate investor views and compared the results with other portfolio optimization frameworks. Donthireddy [29] used machine learning (ML) classifiers to acquire investor views and revealed that the enhancement can improve the performance of the BL model significantly. Kara et al. [30] combined GARCH modeling and support vector regression (SVR) to create a novel approach to describe views. In this approach, they forecasted asset returns by SVR with input indicators generated by GARCH and took the returns as the investor views. Min et al. [15] generated quantitative opinions by ML algorithms and demonstrated that random forest maintains the best performance.
BL portfolio construction is on the basis of the classic return-risk optimization, which is a typical MOP. EMO algorithms may be a good choice. However, some difficulties (such as non-reproducibility, the computationally expensive diversity-preservation operator, and the lack of a theoretical guarantee of global convergence) hinder their application. Some researchers change direction to deterministic algorithms. The DIRECT algorithm is an efficient deterministic algorithm that guarantees global convergence. Motivated by its merits, the DIRECT algorithm began to be applied to multi-objective optimization. For example, Wang et al. [31] combined the DIRECT algorithm and multi-objective genetic algorithm (MOGA) to create a novel method called NSDIRECT-GA. In this method, DIRECT is adopted to generate the population used in MOGA. In particular, rank and crowding distance are used to generate potentially optimal hyperrectangles in DIRECT. Al-Dujaili and Suresh [32] extended the DIRECT algorithm and presented the so-called MO-DIRECT. Moreover, they compared MO-DIRECT with other decomposition-based multi-objective techniques and demonstrated its superiority. Wong et al. [33] introduced a multi-objective DIRECT based on the hypervolume indicator, in which the diversification is enhanced by selecting hyperrectangles with higher hypervolume.
3. Preliminaries
3.1. Classical Black–Litterman Model
The MV model can be mathematically defined by (1) [1]
where N is the number of assets available, is the expected return vector of assets in the portfolio, defines the proportion of capital invested in each asset in the portfolio, and denotes the covariance matrix of the asset returns.
It is obvious that the MV model uses the variance as a risk measure, targeting at obtaining the weight vector that maximizes the expected return of the portfolio but minimizes the risk. However, from a practical perspective, there exist some drawbacks in the model (1), such as highly-concentrated portfolio [5] and sensitive input [34]. To overcome the above problems, the BL model is proposed by using the investor views of the asset returns to revise R and in the model (1).
The cornerstone of the BL model is to introduce investor preferences from the perspective of Bayesian analysis. With the help of the views, a realistic estimate of expected return is no longer demanded. Instead, what is needed is the prior expected return obtained by historical data, so that a posterior estimate of expected returns can be produced. It is assumed that investors will assign their wealth to N assets and denotes the posterior estimate of expected returns, which is composed of two parts. The first part is the market equilibrium return obtained by the capital asset pricing model, and the second one comes from views on certain assets. Therefore, can be formulated as follows:
where
- Q is a K-dimensional view vector which maintains K subjective returns of certain assets.
- refers to a matrix that reflects the confidence in views.
- P is a mapping matrix, representing the correspondence between K views and corresponding assets.
- is the covariance matrix of asset returns.
- is the market equilibrium return calculated by the Formula (3), where is the market-cap weights, and denotes the risk aversion coefficient which is obtained by dividing the market excess return by its variance .
Similarly, the posterior estimate of the covariance matrix is shown in (4).
Combining the view vector Q with the mapping matrix P can either express relative or absolute opinions on the expected returns. A relative view usually describes statements about the connection between asset returns, for example, ‘A will outperform B by X%’. On the other hand, an absolute view directly provides specific return forecasts for certain assets, such as ‘C will climb to 8%’. is another parameter that is critical to BL model. Based on it, each view can be allocated an uncertainty level. In practice, it is believed to be proportional to the variance of asset returns, and can be obtained by the following expression:
where represents the relative proportion of the variance of asset returns.
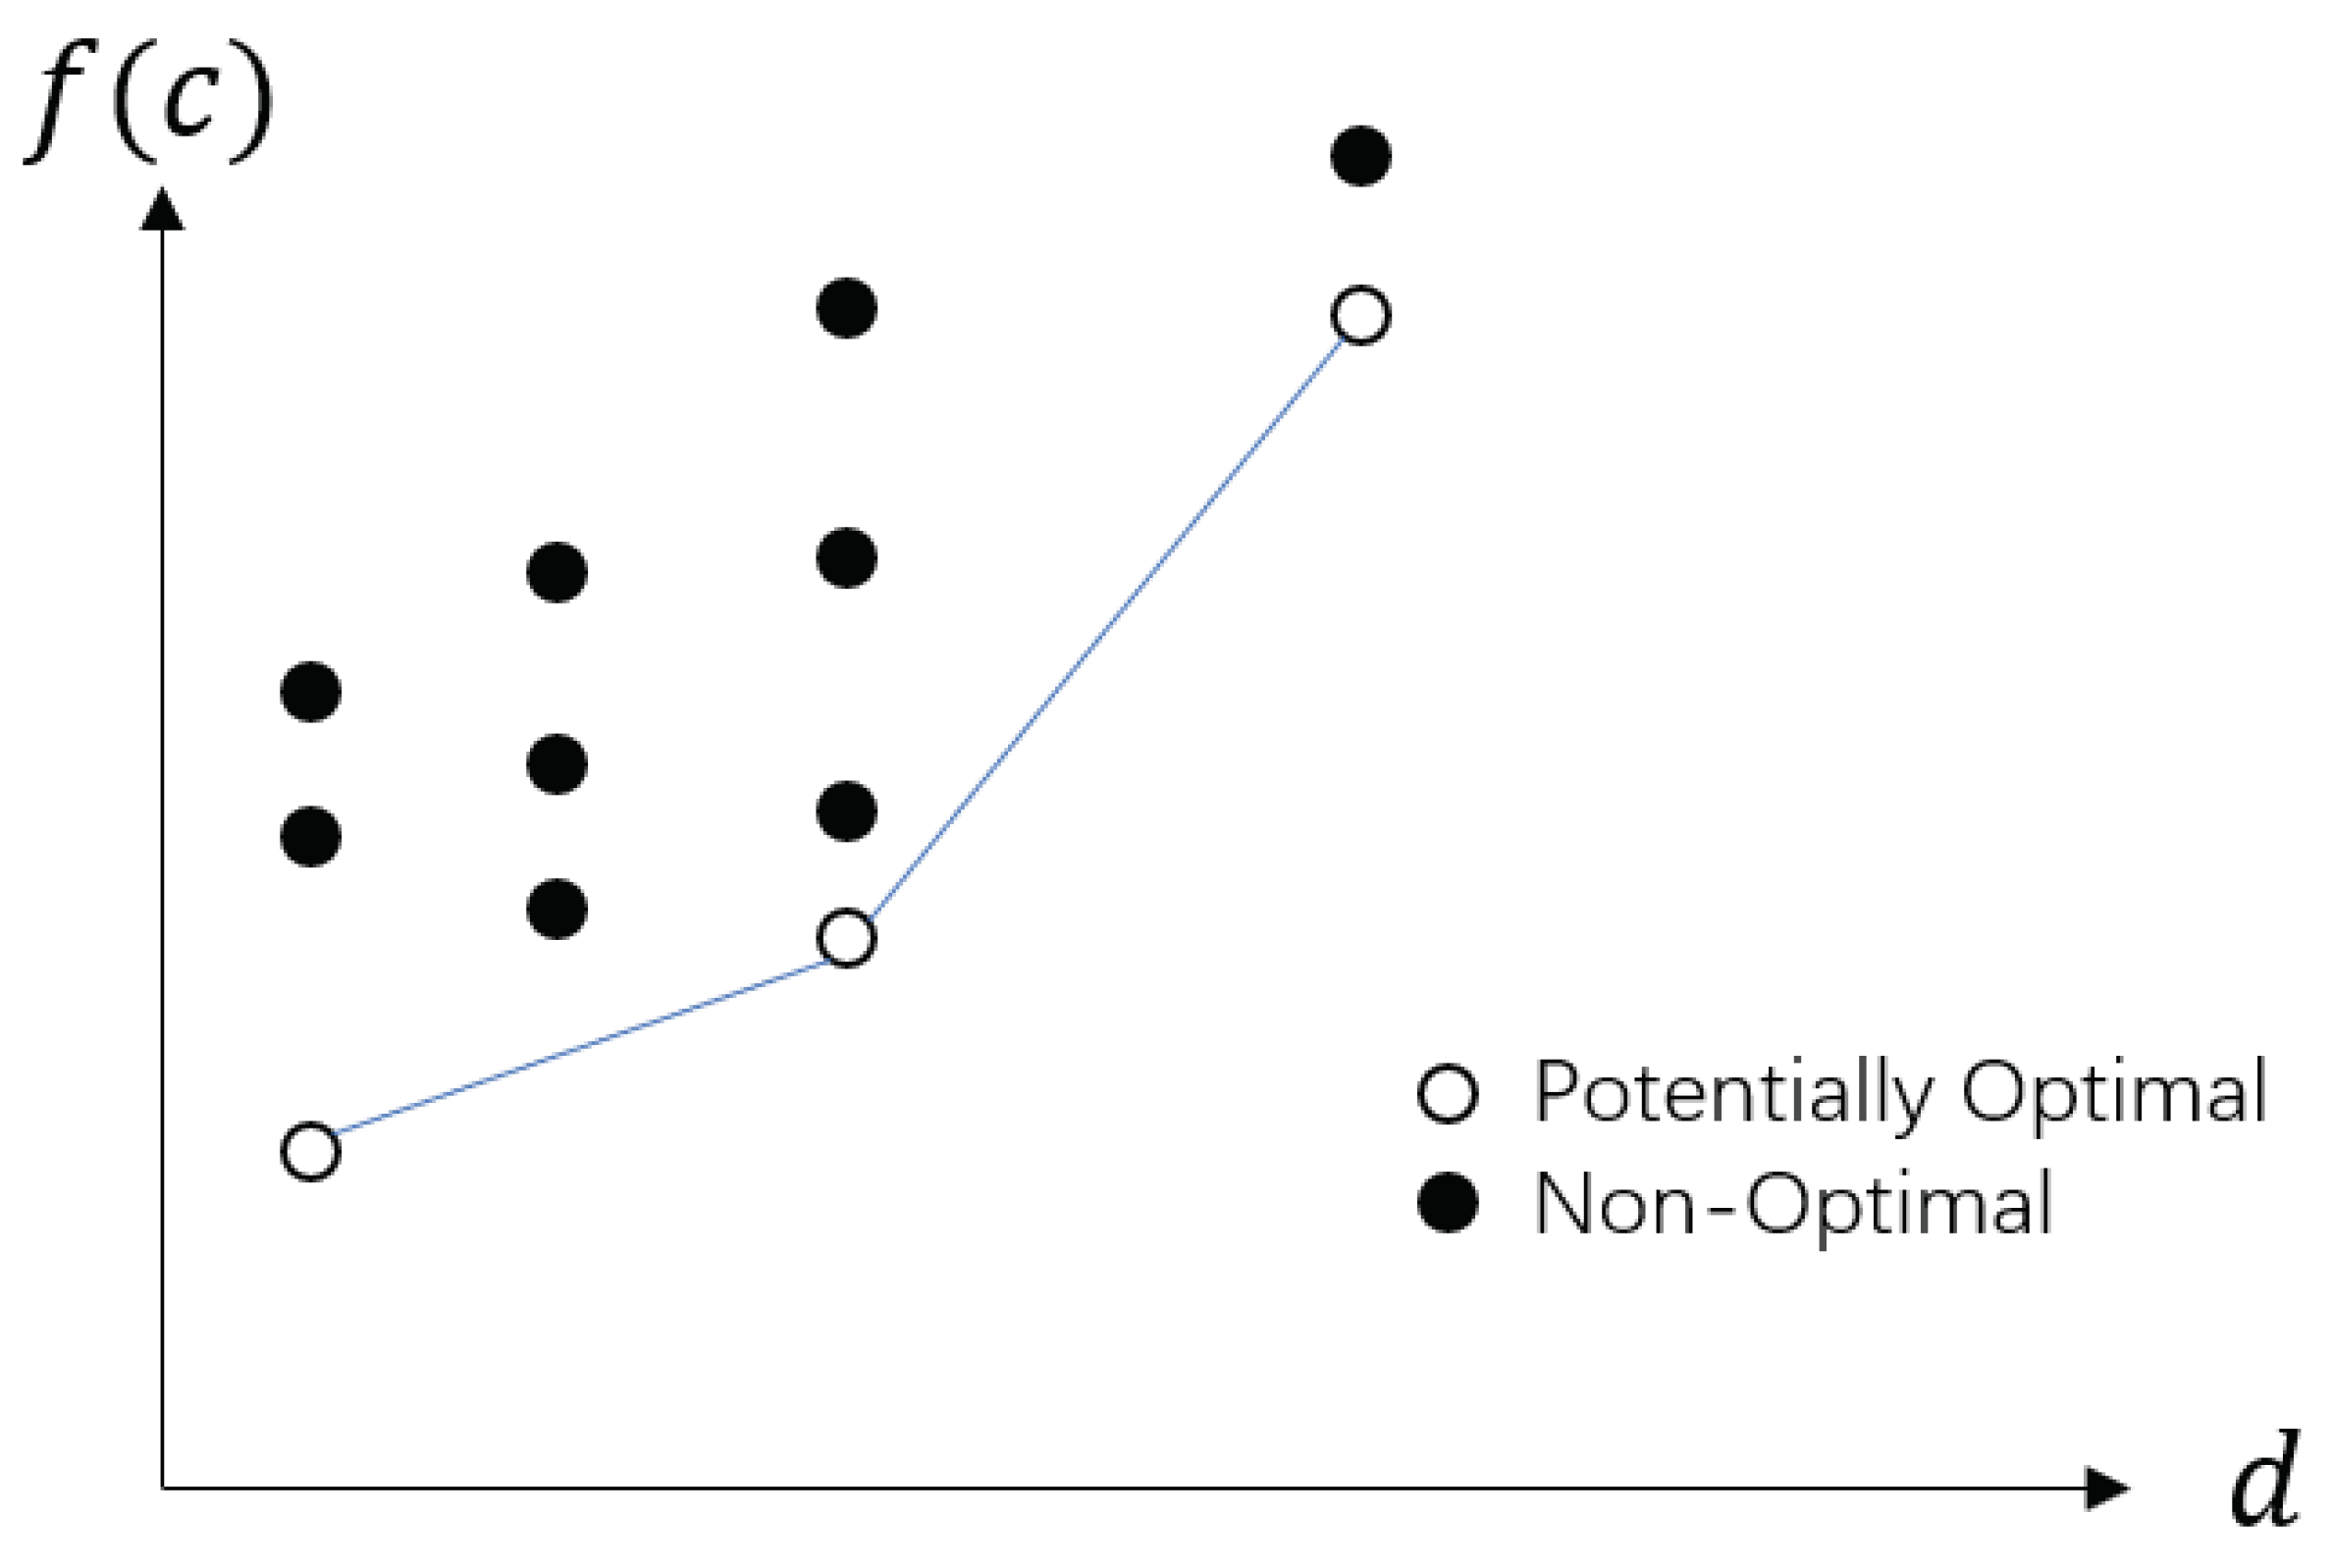
3.2. DIRECT Framework
In 1993, Jones et al. [21] took inspiration from Lipschitzian optimization and introduced the DIRECT algorithm, which does not require prior knowledge of the Lipschitz constant. The DIRECT algorithm regards the entire solution space as a hyperrectangle, and continuously divides it to obtain new sub-hyperrectangles. In each iteration, it selects the potentially optimal hyperrectangles according to certain rules which are then subdivided into equal parts along the longest side, and calculates the corresponding function at the center points. It is obvious that one of the keys to determining the algorithm’s efficiency is the strategy for selecting potentially optimal hyperrectangles. Assuming that there are currently m hyperrectangles in the solution space, the jth hyperrectangle is considered as the potentially optimal hyperrectangle if there is a constant satisfies the Formula (6)
where is a positive constant, is the function value at the center point of hyperrectangle j, and refers to the center-vertex distance of hyperrectangle i, and denotes the current optimal function value. Figure 1 shows the properties of potentially optimal hyperrectangles more intuitively.
Figure 1.
Properties of potentially optimal hyperrectangles.
After the potentially optimal hyperrectangles are determined, they will be sub-divided along the longest side to form new sub-hyperrectangles. For an n-dimensional solution space, there may be multiple longest sides of the same length. In such a situation, it is necessary to specify the partition strategy because different strategies form different sub-hyperrectangles. For example, the DIRECT algorithm could successively select the coordinate direction with the smallest value of . The detailed partition procedure is provided in Algorithm 1.
| Algorithm 1 Procedure for hyperrectangle partition |
| Input: Function to be minimized f, the current potentially optimal hyperrectangle i Output: Newly acquired hyperrectangles from i
|
Then, the DIRECT algorithm can be expressed in Algorithm 2.
| Algorithm 2 DIRECT algorithm |
| Input: Function to be minimized f, evaluation budget t Output: Approximate minimum of function f
|
4. Materials and Methods
In this section, we propose a novel model for BL portfolio optimization problems in which investor views are generated on the basis of random forests. Then, a decomposition-based multi-objective DIRECT algorithm is developed to handle the proposed model.
4.1. Random Forest-Based Black–Litterman Portfolio Optimization Model
4.1.1. Generating Views Using Random Forests
As mentioned before, Q and revise the priori returns, which is extremely important to the BL model. Nowadays, many attempts are made to generate views by ML algorithms which try to train a predictor based on historical data to form specific return forecasts for certain assets, i.e., Q. However, this kind of methods may not provide the view uncertainty. Therefore, we employ the random forests to form view vector and generate the view uncertainty at the same time.
Random forest [35] is an ensemble method which constructs a set of base classification models, and synthesizes the final output by averaging the predicted value of each base classification model. The main training steps of random forests are shown in Algorithm 3.
| Algorithm 3 Main training steps of random forests |
| Input:S data samples Output: M decision trees
|
As a decision tree based ensemble method, random forest is appealing due to the advantages it provides, including the ability to maintain high prediction accuracy and not being prone to overfitting. Moreover, it can be directly applied in high-dimensional problems. In 2011, Hutter et al. [36] used random forests to replace the Gaussian process (GP) to ease the updating difficulty of GP models under a large-scale known point set in Bayesian optimization. Furthermore, the variance of the predicted values of multiple trees is used as an uncertainty measure. The core idea of this work is that consistent predictions based on different models and different training data indicate more reliable results. In this paper, we follow this idea to form the absolute view vector based on the random forests and measure the view uncertainty by the difference in the predicted values of multiple trees. Then, the procedure of obtaining view vector and the view uncertainty are summarized as follows.
- Construct a random forest model based on the historical return data to predict asset returns, and use the model output as an absolute view.
- Calculate the maximum absolute deviation between the output of M decision trees and the model output .
- Calculate the proportion of subtrees whose absolute deviation from is less than and take it as the uncertainty of the corresponding view.
- Repeat the above process until the K views and corresponding uncertainty are constructed.
Based on the view vector and the view uncertainty generated from random forests concurrently, we can calculate the posterior estimate of expected returns and covariance matrix further. We believe that the adopting of random forests will significantly weaken the conservatism and greatly enhance the generalization of the BL model.
4.1.2. Random Forest-Based Black–Litterman Model
Based on the view vector and the view uncertainty generating from random forests, the posterior estimate of expected returns and covariance matrix can be reformed as follows:
Then, we denote the random forest-based BL model with the following formulation:
which is a typical MOP.
4.2. DIRECT Algorithm for Multi-Objective Optimization
The random forest-based BL model is a typical MOP which is much more complicated than the single-objective ones. The current mainstream algorithms for MOPs are basically based on evolutionary computing, which contains random initialization and various random evolution operators to explore the solution space. However, there are some inherent problems (such as non-reproducibility, computationally expensive diversity-preservation operators, and a lack of a theoretical guarantee of global convergence) limit their application. The DIRECT algorithm is an efficient deterministic algorithm that guarantees global convergence. Motivated by its merits, we extend it to MOPs and propose a new multi-objective DIRECT algorithm to construct Pareto-optimal portfolios of the aforementioned model.
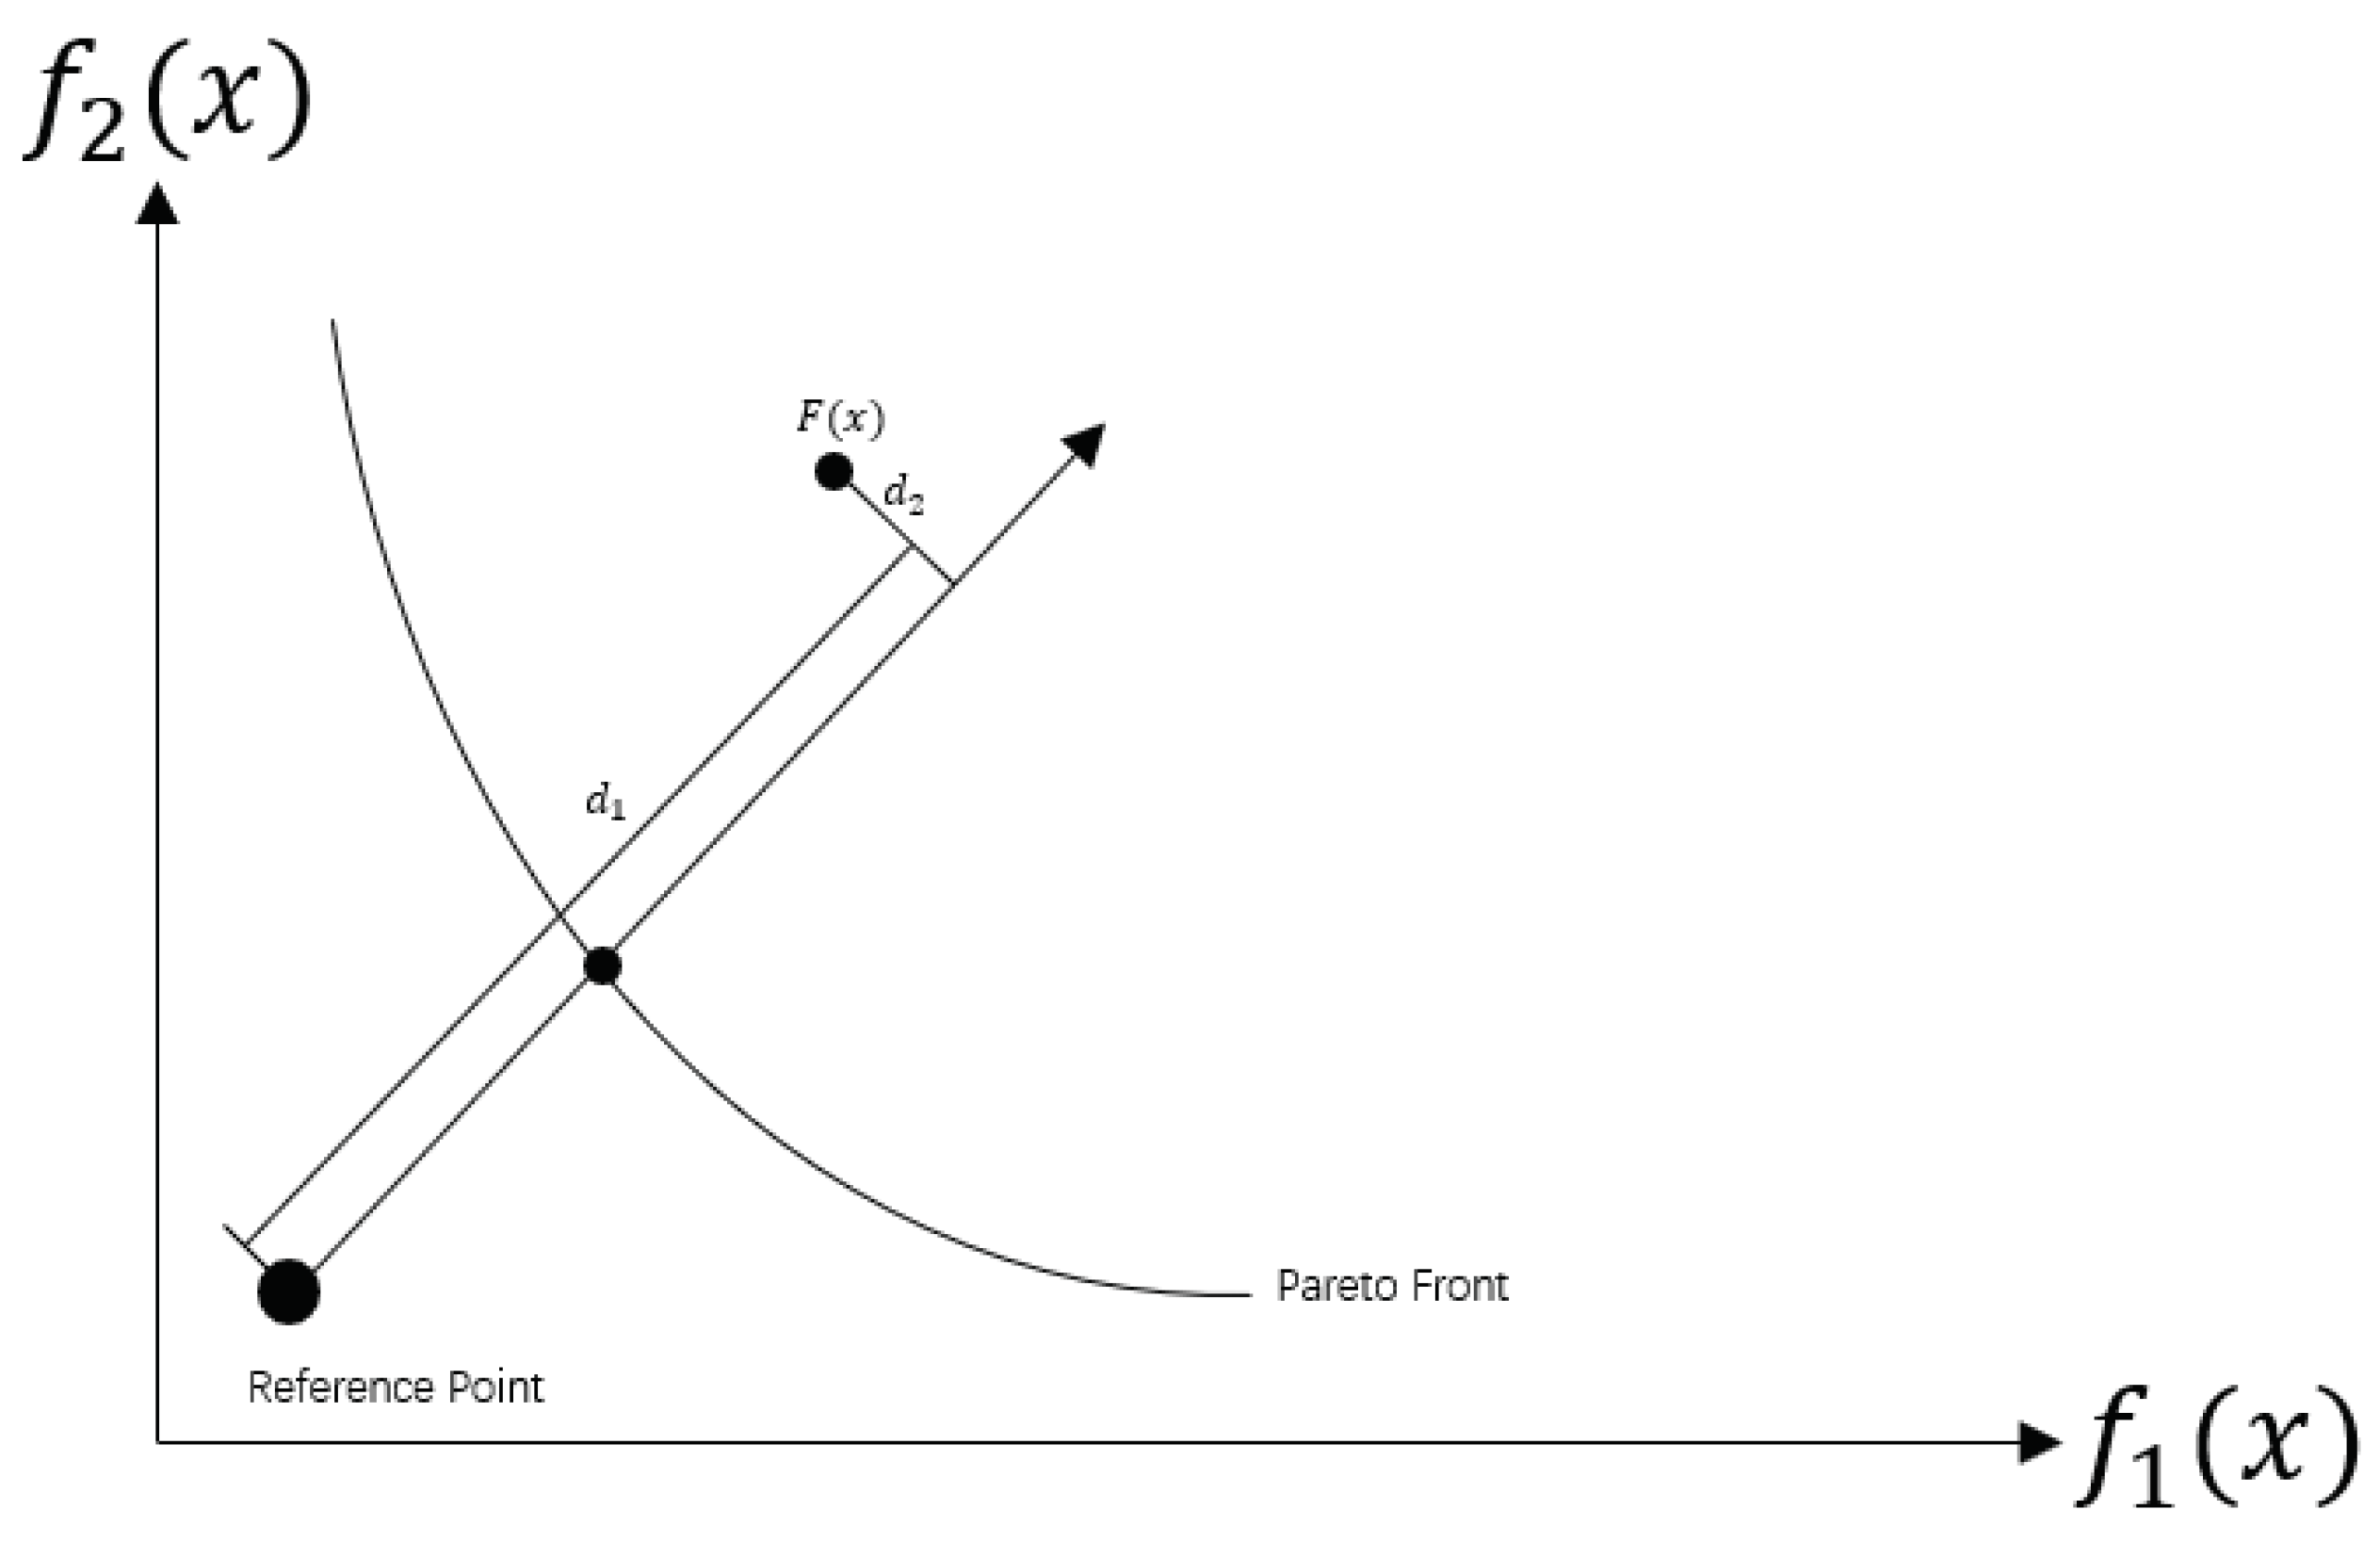
4.2.1. Decomposition Based Strategy for Potentially Optimal Hyperrectangles Selecting
As mentioned earlier, the selecting strategy for potentially optimal hyperrectangles is essential to the DIRECT algorithm, which means a possible modification or alternative that makes it suitable for multiple objectives is a straightforward manner for the DIRECT algorithm’s extension. Decomposition is a basic idea which has been applied in many popular multi-objective algorithms, such as MOEA/D. Based on decomposition, the original problem is transformed into multiple scalar sub-problems in the direction of weight vectors, and then achieve optimization simultaneously. The penalty-based boundary intersection (PBI) approach is a commonly used decomposition method [16]. Through PBI, a MOP is converted into the following scalar optimization subproblem using the weight vector and the reference point (see Figure 2).
Figure 2.
Illustration of PBI.
is the pre-configured penalty parameter. Motivated by this idea, we propose a novel strategy to encourage to choose potentially optimal hyperrectangles in all directions.
To make the strategy extend to multiple objectives, we first introduce a new indicator based on decomposition to quantify the quality of hyperrectangles (more specifically, the solutions at their centers). Suppose there are H weight vectors and N hyperrectangles, the objective function value at the center of hyperrectangle j is , and the reference point is denoted by . Then, the procedure of generating the indicator is outlined in Algorithm 4. Following the idea of decomposition, the indicator maintains the ability to consider sub-problems in multiple reference directions at the same time.
| Algorithm 4 Generation procedure of the decomposition based indicator |
| Input:H weight vectors , N objective function vectors at the center of N hyperrectangles and reference point Output: for N hyperrectangles
|
As listed in Algorithm 4, the direction with largest (maximum projection value) among all H sub-problems is used as the direction of the proposed indicator of every hyperrectangle, and then the largest of each hyperrectangle will be normalized on the corresponding direction to obtain the value of the indicator (i.e., their contribution on the non-dominated front).
On the basis of the proposed indicator, we can define a strategy for selecting potentially optimal hyperrectangles. That is, the hyperrectangle j is considered potentially optimal if there exists such that
where is a positive constant, m is the number of hyperrectangles to be compared, is the indicator value at the center point of hyperrectangle j, and refers to the center-vertex distance of hyperrectangle j, where denotes the current optimal indicator value.
With this unique selecting strategy, the DIRECT algorithm possesses the capacity to select potentially optimal hyperrectangles in all reference directions simultaneously, which will further improve the exploratory nature when the algorithm is stuck in a locally optimal Pareto set or a part of the global Pareto front.
4.2.2. Decomposition Based Partition Procedure
The original definition of the partition procedure also does not fit the MOPs. Therefore, based on the indicator mentioned earlier, we devised a novel idea to split the solution space into smaller hyperrectangles. Specifically, after the set of potentially optimal hyperrectangles is defined, we evaluate all those hyperrectangles at the points of in every longest side dimension where c and are their centers and the maximum side length, respectively, and e denotes the unit vector of corresponding direction. Followed by generating the indicator value and for all these hyperrectangles, we divide each hyperrectangle into thirds starting from the dimension of minimum continuing to the dimension of maximum v.
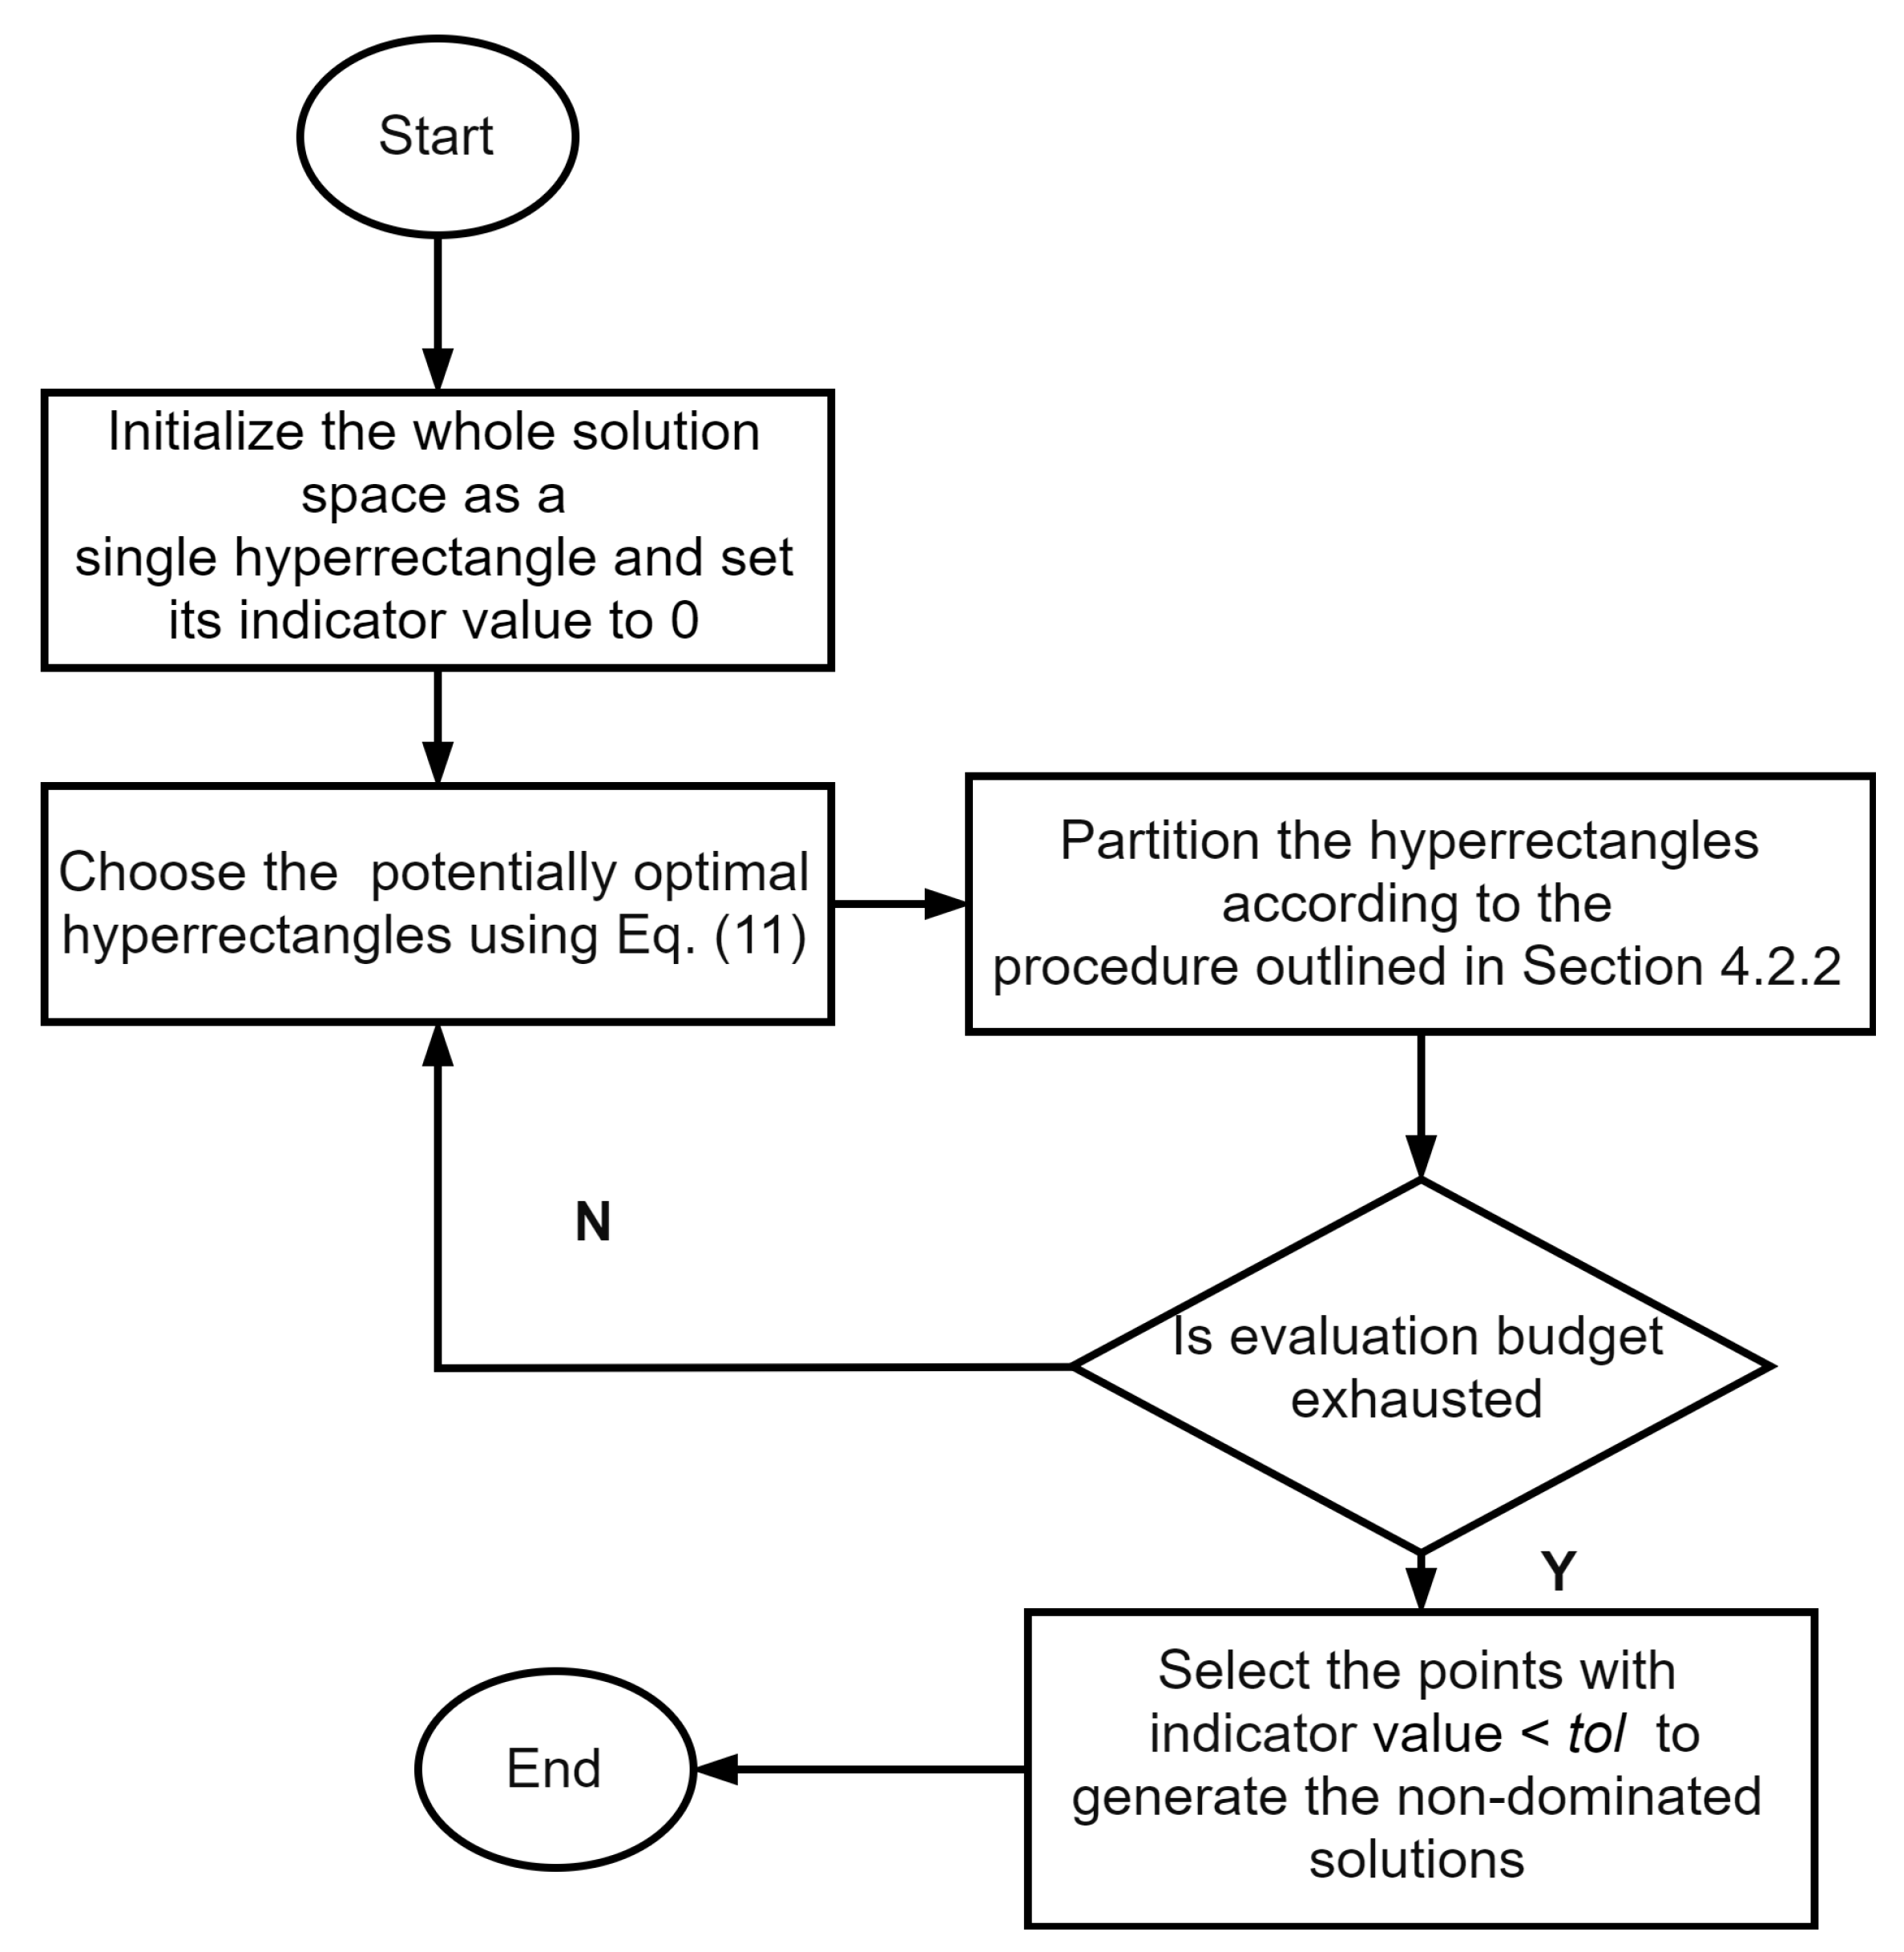
4.2.3. Decomposition Based Multi-Objective DIRECT Algorithm
Lying on the solid foundation discussed in Section 4.2.1 and Section 4.2.2, we extend the DIRECT algorithm to MOPs, and introduce a decomposition based multi-objective DIRECT (multiDecompose) algorithm. Figure 3 provides a description of multiDecompose summarizing the adaptations to MOPs presented earlier. Despite the modification, multiDecompose will not come with a increased computational complexity due to the the complexity of Algorithm 4 is which is of the same nature of the original one, where M denotes the number of weight vectors and N refers to the quantity of the hyperrectangles remaining to be compared.
Figure 3.
Procedure of multiDecompose algorithm.
5. Results
In this section, we provide the results comparing multiDecompose with two widely adopted multi-objective algorithms, and discuss them from different dimensions. Then, after the forecasting performance of the proposed technique random forest model is verify, we address the random forest-based BL model with multiDecompose and compare the results with the classic MV model.
5.1. Performance of multiDecompose on Benchmark Problems
We use 8 widely used MOP and DTLZ test instances (listed in Table 1) to compare multiDecompose with NSGA-II and MOEA/D, two representative multi-objective algorithms. NSGA-II and MOEA/D are implemented by the pymoo library [37] with default parameters, except that the population size is set to be 200 for all test instances. Additionally, in multiDecompose, we set . Then, a set of experiments is carried out to provide the comparison between these three algorithms in terms of Pareto front () and the most popular quality indicator, hypervolume () [38]. Both these algorithms have been run 30 times independently for each test instance.
Table 1.
Details of all test instances.
The of the three algorithms on the MOP and DTLZ test instances are summarized in Figure 4 and Figure 5, respectively. It is clear from the two figures that, as to the quantity and uniformness of final solutions, multiDecompose is superior to the other two algorithms for all test instances, and even illustrates an overwhelming advantage on the DTLZ instances. NSGA-II shows a mediocre performance while MOEA/D finds few non-dominated solutions under a specific number of function evaluations in most test instances. Furthermore, from the perspective of the number of function evaluations, multiDecompose converges much faster than NSGA-II and MOEA/D on all test instances.
Figure 4.
PFs of multiDecompose, NSGA-II and MOEA/D on all MOP instances where denotes the number of the function evaluations.
Figure 5.
of multiDecompose, NSGA-II and MOEA/D on all DTLZ instances where denotes the number of the function evaluations.
Table 2 presents the mean of -metric value of final solutions obtained by each algorithm on each test instance. It is obvious that our algorithm also performs splendidly on each test instance in terms of -metric, i.e., our algorithm maintains the maximum -metric value for all test instances. NSGA-II is close behind, while MEAD/D performs the worst. It can be inferred from the aforementioned facts that multiDecompose can achieve a better performance over NSGA-II and MOEA/D in terms of the solution quality and convergence speed on the 2-objective and 3-objective optimization problems.
Table 2.
Average value of the solutions obtained by multiDecompose, NSGA-II and MOEA/D.
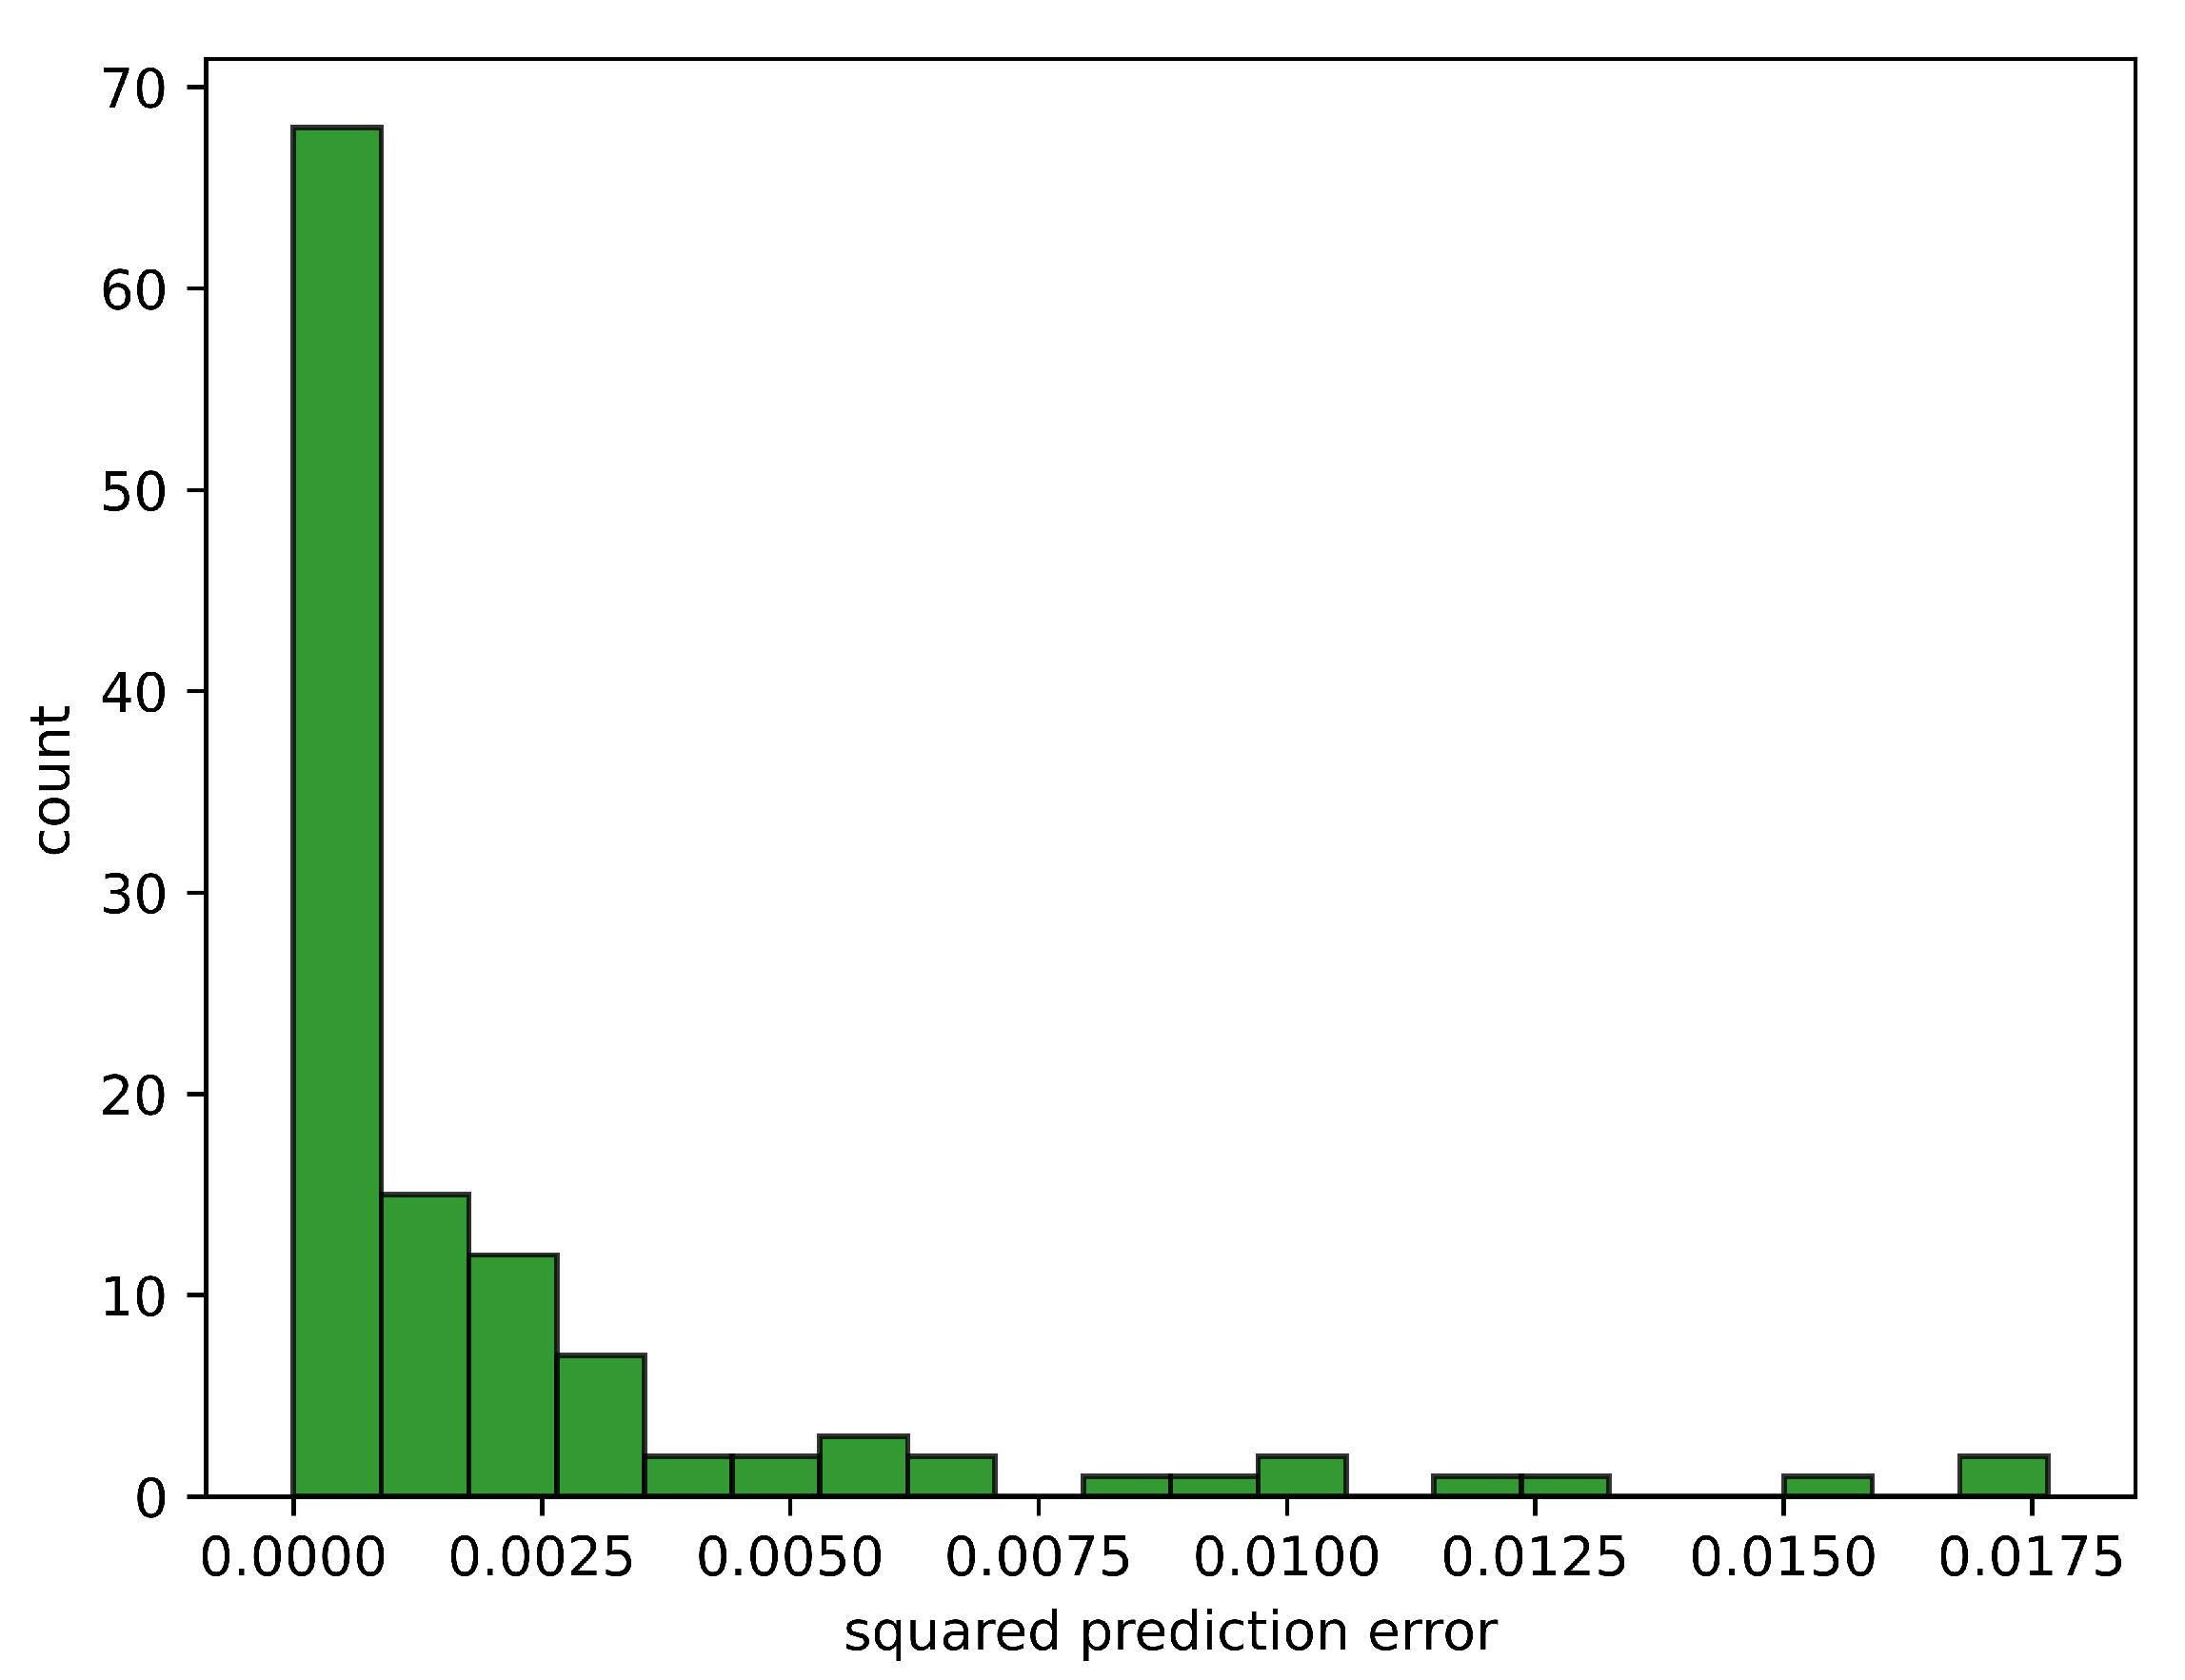
5.2. Portfolio Performance of the Random Forest-Based BL Model
Based on the data set from the 10 representative stocks (shown in the Table 3) of Shanghai Stock Exchange 50 Index, which covers the monthly volume and price data over a period of 5 years from January 2014 to December 2018, we apply multiDecompose to solve the random forest-based BL model and compare the obtained portfolio with the classic MV portfolio.
Table 3.
Stock list used in the experiments.
More specifically, we first train a random forest model on the basis of the dataset mentioned earlier to predict monthly stock returns. Then, we summarize the squared prediction errors for all 10 stocks in 2019 and display the distribution in Figure 6. It can be seen from the histogram that most of the squared prediction errors are maintained below 0.005, which verifies that the forecast values obtained from the random forest model are qualified to generate a view vector and the confidence matrix for the subsequent BL model.
Figure 6.
Histogram of squared prediction error for all 10 stocks in 2019.
Furthermore, we set up the monthly warehouse transfer rule following the convention in the financial industry, which means that we redistribute wealth monthly based on the solutions obtained by the portfolio optimization models. In this case, the stock returns predicted by the trained random forest model are used to form a view vector and the view uncertainty monthly, followed by the generation of a posterior estimate of expected returns, and a covariance matrix for the proposed model. After that, the proposed models are solved based on the multiDecompose algorithm and the solution with the largest Sharpe ratio is selected as the portfolio in the following month.
Figure 7 reveals the cumulative returns of the proposed model and classic MV model in 2019. Obviously, the proposed model significantly outperforms the classic MV model during the whole period of backtesting, and its annual return reaches compared to for the MV model, which is consistent with our analysis before. From the perspective of the Sharpe ratio, the proposed model has a better Sharpe ratio of while the ratio is for the MV model. We can conclude from the above results that the proposed model is superior to the MV model in terms of portfolio performance.
Figure 7.
Comparison between the proposed model and MV model on cumulative return.
6. Discussion
In this paper, a random forest-based BL portfolio optimization model was developed to handle the portfolio selection problem. In this model, a novel method for generating investor views on the basis of random forests was adopted. More specifically, the view vector was generated based on the predicted asset returns obtained by random forests and the confidence matrix which contains the uncertainty of each view was measured by the difference in the predicted values of multiple trees. Aiming to effectively resolve the proposed model while maintaining high accuracy, a novel decomposition based multi-objective DIRECT algorithm was introduced, which possesses the capacity to select potentially optimal hyperrectangles in all reference directions simultaneously. It was demonstrated that the proposed algorithm achieves a better performance over NSGA-II and MOEA/D on the MOP and DTLZ benchmark problems in terms of the quality of the Pareto front. Moreover, the experiments certified that the random forest-based BL portfolio optimization model can obtain higher cumulative returns and Sharpe ratio in the application of Chinese stock market when compared to the classic MV model.
For future work, the proposed model can be extended with more trading constraints. Furthermore, the proposed algorithm can be tested on larger historical financial datasets and generalized to fuzzy portfolio selection problems.
Author Contributions
Conceptualization, C.L., Z.W. and Z.L.; methodology, C.L. and X.C.; software, C.L.; validation, C.L., Z.L. and X.C.; formal analysis, C.L. and Z.L.; investigation, Y.C. and X.Y.; resources, Z.L.; data curation, Y.C.; writing—original draft preparation, C.L.; writing—review and editing, C.L., Y.C., Z.W., X.Y. and Z.L.; visualization, Y.C. and X.Y.; supervision, Z.L. and X.C.; project administration, C.L.; funding acquisition, Z.L. and C.L. All authors have read and agreed to the published version of the manuscript.
Funding
This research was funded by the China Postdoctoral Science Foundation (Grant No. 2021M693226) and the National Natural Science Foundation of China (Grant No. 61873254).
Institutional Review Board Statement
Not applicable.
Informed Consent Statement
Not applicable.
Data Availability Statement
Not applicable.
Conflicts of Interest
The authors declare no conflict of interest.
References
- Markowitz, H. Portfolio Selection. J. Financ. 1952, 7, 77–91. [Google Scholar]
- Li, C.; Wu, Y.; Lu, Z.; Wang, J.; Hu, Y. A Multiperiod Multiobjective Portfolio Selection Model With Fuzzy Random Returns for Large Scale Securities Data. IEEE Trans. Fuzzy Syst. 2021, 29, 59–74. [Google Scholar] [CrossRef]
- Greiner, S.P. Investment Risk and Uncertainty: Advanced Risk Awareness Techniques for the Intelligent Investor; John Wiley & Sons: Hoboken, NJ, USA, 2013. [Google Scholar]
- Black, F.; Litterman, R. Global asset allocation with equities, bonds, and currencies. Fixed Income Res. 1991, 2, 1–44. [Google Scholar]
- Black, F.; Litterman, R. Global portfolio optimization. Financ. Anal. J. 1992, 48, 28–43. [Google Scholar] [CrossRef]
- Caliskan, T. Comparing Black Litterman Model and Markowitz Mean Variance Model with Beta Factor, Unsystematic Risk and Total Risk. Bus. Econ. Res. J. 2012, 3, 1–43. [Google Scholar]
- Cheung, W. The black–litterman model explained. J. Asset Manag. 2010, 11, 229–243. [Google Scholar] [CrossRef]
- Jia, X.; Gao, J. Extensions of black-litterman portfolio optimization model with downside risk measure. In Proceedings of the 2016 Chinese Control and Decision Conference (CCDC), Yinchuan, China, 28–30 May 2016; pp. 1114–1119. [Google Scholar]
- Palczewski, A.; Palczewski, J. Black–Litterman model for continuous distributions. Eur. J. Oper. Res. 2019, 273, 708–720. [Google Scholar] [CrossRef]
- Simos, T.E.; Mourtas, S.D.; Katsikis, V.N. Time-varying Black–Litterman portfolio optimization using a bio-inspired approach and neuronets. Appl. Soft Comput. 2021, 112, 107767. [Google Scholar] [CrossRef]
- Stoilov, T.; Stoilova, K.; Vladimirov, M. Application of modified Black-Litterman model for active portfolio management. Expert Syst. Appl. 2021, 186, 115719. [Google Scholar] [CrossRef]
- Alexander, D.; Svetlana, D. Application of Ensemble learning for views generation in Meucci Portfolio Optimization Framework. Rev. Bus. Econ. Stud. 2013, 1, 100–110. [Google Scholar]
- Asad, M. Optimized stock market prediction using ensemble learning. In Proceedings of the 2015 9Th International Conference on Application of Information and Communication Technologies (AICT), Rostov-on-Don, Russia, 14–16 October 2015; pp. 263–268. [Google Scholar]
- Kim, H.Y.; Won, C.H. Forecasting the volatility of stock price index: A hybrid model integrating LSTM with multiple GARCH-type models. Expert Syst. Appl. 2018, 103, 25–37. [Google Scholar] [CrossRef]
- Min, L.; Dong, J.; Liu, D.; Kong, X. A Black-Litterman Portfolio Selection Model with Investor Opinions Generating from Machine Learning Algorithms. Eng. Lett. 2021, 29, 710–721. [Google Scholar]
- Zhang, Q.; Li, H. MOEA/D: A multiobjective evolutionary algorithm based on decomposition. IEEE Trans. Evol. Comput. 2007, 11, 712–731. [Google Scholar] [CrossRef]
- Deb, K.; Pratap, A.; Agarwal, S.; Meyarivan, T. A fast and elitist multiobjective genetic algorithm: NSGA-II. IEEE Trans. Evol. Comput. 2002, 6, 182–197. [Google Scholar] [CrossRef] [Green Version]
- Deb, K.; Jain, H. An evolutionary many-objective optimization algorithm using reference-point-based nondominated sorting approach, Part I: Solving problems with box constraints. IEEE Trans. Evol. Comput. 2013, 18, 577–601. [Google Scholar] [CrossRef]
- Piyavskii, S. An algorithm for finding the absolute extremum of a function. USSR Comput. Math. Math. Phys. 1972, 12, 57–67. [Google Scholar] [CrossRef]
- Shubert, B.O. A sequential method seeking the global maximum of a function. SIAM J. Numer. Anal. 1972, 9, 379–388. [Google Scholar] [CrossRef]
- Jones, D.R.; Perttunen, C.D.; Stuckman, B.E. Lipschitzian optimization without the Lipschitz constant. J. Optim. Theory Appl. 1993, 79, 157–181. [Google Scholar] [CrossRef]
- Jones, D.R.; Martins, J.R. The DIRECT algorithm: 25 years Later. J. Glob. Optim. 2021, 79, 521–566. [Google Scholar] [CrossRef]
- Markowitz, H. Portfolio Selection, Efficent Diversification of Investments; John Wiley and Son: New York, NY, USA, 1959. [Google Scholar]
- Müjdecı, S.Y.; Alnahas, D.; Öcal, M.; Duru, N.; Tüccar, B. Hyperparameter Optimization for Black-Litterman Model via Genetic Algorithms. In Proceedings of the 2021 International Conference on INnovations in Intelligent Systems and Applications (INISTA), Kocaeli, Turkey, 25–27 August 2021; pp. 1–5. [Google Scholar]
- Satchell, S.; Scowcroft, A. A demystification of the Black–Litterman model: Managing quantitative and traditional portfolio construction. J. Asset Manag. 2000, 1, 138–150. [Google Scholar] [CrossRef]
- Martellini, L.; Ziemann, V. Extending Black-Litterman analysis beyond the mean-variance framework. J. Portf. Manag. 2007, 33, 33–44. [Google Scholar] [CrossRef]
- Figelman, I. Black–Litterman with a Factor Structure Applied to Multi-Asset Portfolios. J. Portf. Manag. 2017, 44, 136–155. [Google Scholar] [CrossRef]
- Chen, S.D.; Lim, A.E. A Generalized black–litterman model. Oper. Res. 2020, 68, 381–410. [Google Scholar] [CrossRef] [Green Version]
- Donthireddy, P. Black-Litterman Portfolios with Machine Learning Derived Views. 2018. Available online: https://www.researchgate.net/publication/326489143_Black-Litterman_Portfolios_with_Machine_Learning_derived_Views (accessed on 25 July 2018).
- Kara, M.; Ulucan, A.; Atici, K.B. A hybrid approach for generating investor views in Black–Litterman model. Expert Syst. Appl. 2019, 128, 256–270. [Google Scholar] [CrossRef]
- Wang, L.; Ishida, H.; Hiroyasu, T.; Miki, M. Examination of multi-objective optimization method for global search using DIRECT and GA. In Proceedings of the 2008 IEEE Congress on Evolutionary Computation (IEEE World Congress on Computational Intelligence), Hong Kong, China, 1–6 June 2008; pp. 2446–2451. [Google Scholar]
- Al-Dujaili, A.; Suresh, S. Dividing rectangles attack multi-objective optimization. In Proceedings of the 2016 IEEE Congress on Evolutionary Computation (CEC), Vancouver, BC, Canada, 24–29 July 2016; pp. 3606–3613. [Google Scholar] [CrossRef]
- Wong, C.S.Y.; Al-Dujaili, A.; Sundaram, S. Hypervolume-based DIRECT for multi-objective optimisation. In Proceedings of the 2016 on Genetic and Evolutionary Computation Conference Companion, Denver, CO, USA, 20–24 July 2016; pp. 1201–1208. [Google Scholar]
- Best, M.J.; Grauer, R.R. On the sensitivity of mean-variance-efficient portfolios to changes in asset means: Some analytical and computational results. Rev. Financ. Stud. 1991, 4, 315–342. [Google Scholar] [CrossRef] [Green Version]
- Breiman, L. Random forests. Mach. Learn. 2001, 45, 5–32. [Google Scholar] [CrossRef] [Green Version]
- Hutter, F.; Hoos, H.H.; Leyton-Brown, K. Sequential model-based optimization for general algorithm configuration. In International Conference on Learning and Intelligent Optimization; Springer: Berlin/Heidelberg, Germany, 2011; pp. 507–523. [Google Scholar]
- Blank, J.; Deb, K. pymoo: Multi-objective optimization in python. IEEE Access 2020, 8, 89497–89509. [Google Scholar] [CrossRef]
- Brockhoff, D.; Tran, T.D.; Hansen, N. Benchmarking numerical multiobjective optimizers revisited. In Proceedings of the 2015 Annual Conference on Genetic and Evolutionary Computation, Madrid, Spain, 11–15 July 2015; pp. 639–646. [Google Scholar]
Publisher’s Note: MDPI stays neutral with regard to jurisdictional claims in published maps and institutional affiliations. |
© 2022 by the authors. Licensee MDPI, Basel, Switzerland. This article is an open access article distributed under the terms and conditions of the Creative Commons Attribution (CC BY) license (https://creativecommons.org/licenses/by/4.0/).