Featured Application
Manganese bronzes are applied in marine environments, for example, gate valve stems due to their characteristics of high mechanical strength and corrosion resistance. Each element present in the chemical composition of the alloy contributes to the properties required in this application, such as: lead contributes to machinability, iron improves tensile strength, tin increases corrosion resistance and manganese contributes to elastic properties. The study of the increase in mechanical properties is crucial for a better understanding of alloy hardening, as well as for the optimization of properties and manufacturing processes.
Abstract
The present study evaluated the influences of different temperatures during heat treatment on the microstructure and mechanical properties of the manganese bronze alloy. During heating, there was a decrease of stored energy in the form of crystal defects due to the mechanisms of rearrangement and the annihilation of dislocations, followed by nucleation and grain growth. Initially, the samples were drawn using 34% cold work. Then, the specimens were heat-treated for one hour with different temperatures ranging from 200 to 750 °C, increasing by 50 °C for each sample. The chemical composition characterization was determined by X-ray fluorescence spectrometry (XRF). The mechanical property characterization involved the Vickers hardness, tensile strength, yield strength, and elongation. For the microstructural analysis of the samples, optical microscopy and scanning electron microscopy were used. The results showed an increase of elongation and decrease of the Vickers hardness and tensile and yield strengths with the increasing annealing temperature. The Hollomon model was used to investigate the strain-hardening behavior in all specimens. The (n) strain-hardening coefficient and the (K) strength coefficient were calculated, and the correlation with the increase of temperature occurred with the increase of n and variation of K after the recrystallization temperature.
1. Introduction
Among the currently available materials, copper and copper alloys possess interesting physical and chemical properties, such as high conductivity, good strength, ductility, machinability, and durability, with good resistance to oxidation and corrosion. Adding other elements is possible in order to acquire other properties for special applications, such as aerospace, marine, automotive, and others [1,2].
Manganese bronze alloy has some designations normative as UNS C67600, CZ115, CW722R, and CuZn40Mn1Pb1FeSn provided in technical standards from copper alloys, for example, ASTM B138, DIN EN 12164-12165-12167, and BS 2872–2874. This alloy has average 60 wt.% of copper, 1 wt.% of lead, 1.5 wt.% of tin, 1.3 wt.% of iron, 0.5 wt.% of manganese, and zinc is the remainder [1,3,4,5,6,7,8]. These types of copper alloys are applied when the characteristics of high mechanical strength and corrosion resistance are required particularly in under seawater conditions, such as the mechanical components in marine environments, for instance, gate valve stems [9]. Stems are machined before they become gate valve stems; therefore, the addition of lead to improve the machinability level during the manufacturing process and other additional elements give the alloy special technical features; for instance, iron improves the tensile strength, tin increases the corrosion resistance, and manganese is used to obtain excellent elastic properties [9,10].
The increase in the mechanical properties observed after the forming process is because, when metals have their geometric shapes permanently deformed, there is an increase in the density of discordance in the microstructure, which is known as hardening or cold working [11]. According to ASKELAND and PHULÉ [12], in metal alloys, plastic deformation occurs by the movement of discordances, and the hardening mechanism is to increase the mechanical resistance of metals through the obstruction of the movement of discordances. During plastic deformation, the discordances change in quantity and make interactions with each other, obtaining high reliefs and groupings that hinder the movement of discordances. To overcome them, it is necessary to use the application of stresses [11,13].
Evaluations made by JIANG, BRITTON, and WILKINSON [14] in a tensile test at room temperature, through high angular resolution–electron back scatter diffraction (HR-EBSD), showed clear increases in the density of the discordances in copper pure oxygen-free (10 ppm max) microstructure. This stress attribution can be observed in the engineering stress–strain or true stress–strain curves, which are generally acquired through the results generated in mechanical tests in laboratory environments to obtain predictions of the behaviors of metals in the manufacturing processes where plastic deformations occur through cold working, such as drawing, rolling, stamping, and others [15].
Cold working process is typically combined with annealing sequentially. During the deformation process, a part of the applied mechanical energy is transformed into heat, however, the remainder is stored in the metal. Therefore, during annealing, these stored energies promote the processes of recovery and recrystallization. Through these procedures, it is possible to achieve the mechanical properties desired. This study aims to establish the hardening coefficient (n) and the plastic constant (k) using the Hollomon Model and to evaluate the behavior at different temperatures correlating with the results generated in the microstructure and in the mechanical properties of manganese bronze alloy.
Although the recrystallization behavior and texture evolution during annealing have been studied by many researchers in Brass and several Bronze alloy series [16,17], there is still a gap of research to determination of temperatures ranges to achieve the mechanical and microstructure properties foreseen in technical standard ASTM B138 due to heat treatment process, according to Table 1 [3]. Temperatures commonly used for annealing cold-worked to this alloy are not provided for in technical books, as is the case for other manganese bronze alloys [1,18,19,20,21].

Table 1.
Mechanical properties of manganese bronze (UNS C67600) according to ASTM B138.
The results of this work provide new knowledge on the annealing influence on the tensile strength, yield strength, elongation, and microstructure of manganese bronze UNS C67600, which can be used as reference in literature and consequently in the heat treatment process in industries.
2. Materials and Methods
The material used in this work was manganese bronze produced in the foundry of the department of Research and Development of Termomecanica of São Paulo S.A. The alloy was melted in an induction furnace at 1100 °C, and the chemical composition of the alloys was determined using X-ray fluorescence spectrometry (XRF) (MAGIX FAST model Panalitycal) and is shown in Table 2.
Table 2.
The chemical composition of manganese bronze used in this work.
After casting, the sample roll-shaped samples with a diameter of 340 mm were reduced by hot and cold rolling processes to a diameter of 18.5 mm and cut into 200 mm lengths, with 34% cold work. The choice of this percentage was based on the average value used in industrial processes. Subsequently, thirteen specimens were heat-treated for one hour with different temperatures ranging from 200 °C to 750 °C, increasing by 50 °C for each sample in an electric furnace with an atmosphere environment and then cooled in air as shown in Figure 1. This process was determined to enable reproduction on an industrial scale, since cooling is not normally carried out with a protective atmosphere. In research on the microstructure and mechanical properties, the reduction area for the cold work and order of magnitude of the heat treatment were the important features of the investigation.
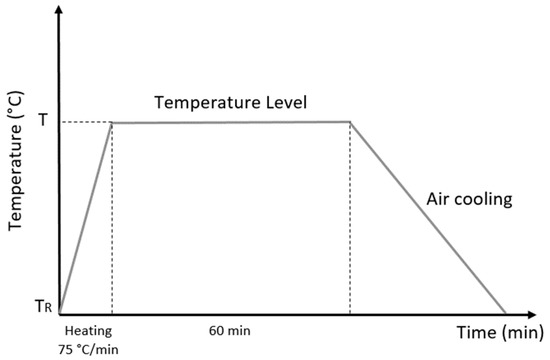
Figure 1.
Schematic representation of heat treatment, where T is the temperature in the range of 200–850 °C and TR is room temperature.
Mechanical testing involved hardness and tensile tests. The hardness measurement using a Vickers method under an applied load of 10 kgf and the dwell time were set to 10 s on the Universal Hardness Tester Closed Loop durometer (Wolpert Group, Aachen, Germany), and an average value of five measurements was conducted on different areas of each specimen for mechanically polished surfaces. Tensile tests were carried out using an Instron 4482 (Instron, Norwood, MA, USA) with a crosshead speed of 20 mm/min to obtain stress–strain curves with the same strain rate as well as the tensile strengths, yield, and elongation of each specimen.
Thirteen specimens were prepared according to ASTM E-8 Plate-Type specifications, with gage lengths exceeding 60.00 mm and a gage diameter of 7.00 mm. As shown in Figure 2, this format is used for fracture tendency in the proper region. The microstructure characterizations were performed using a Leica DM 2700 M (Leica Microsystems CMS GmbH, Wetzlar, Germany) light microscope. The specimens were prepared with mechanical polishing according to the ASTM E-3-11 specifications and the chemical etching to reveal the microstructure were performed using a solution of 5 g FeCl3, 16 mL HCl, and 60 mL ethanol (95%) according to the ASTM E407-07. The scanning electron microscopy was performed using Phenom Pro-X equipment (Termofisher, Waltham, MA, USA) with objective study of the domain microstructure this alloy and the phase transformation relationship with different temperatures for annealing and area reduction.
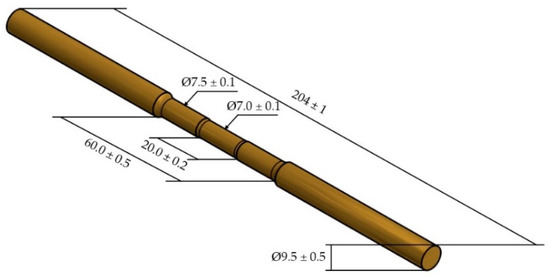
Figure 2.
Specimen for the measurement of the mechanical property tests with the values in millimeters.
The experiments were aimed at determining the relationship between the mechanical properties and microstructure with the annealing temperature and using the Hollomon model to relate these mechanical properties and microstructure with the strain-hardening coefficient (n) and the strength coefficient (K).
3. Results and Discussion
The optical micrographs of the materials shown in Figure 3a,b indicate that the alloy consisted of α-phase and β- phase and that the α-phase had a long island shape that is typical for manganese bronze [1]. In the microstructure, the light areas correspond to the α-phase, which possesses a face-centered cubic (fcc) lattice, while the dark areas correspond to the b-phase possessing a body-centered cubic (bcc) lattice. Figure 3c,d show the SEM micrograph of the structure. Figure 3d shows several types of non-dissolved small intermetallic precipitation that contain darker particles in the α-phase and lighter particles in the β-phase. Therefore, technical scanning electron microscopy and energy dispersive spectroscopy (SEM-EDS) mapping was used to investigate the qualitative distribution of the elements in the sample. It is important to highlight that the different magnifications used in tests (optical and SEM micrographs) and the crystallographic orientation of the grains produce variations in the microstructure analysis. Each micrograph in Figure 3 was described in terms of these conditions.
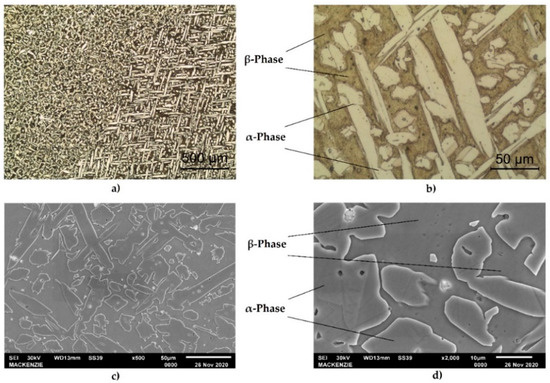
Figure 3.
Optical micrograph showing the microstructure of the UNS C67600 alloy after cold worked and heat treatment at 650 °C (a) α-phase needles (light areas) are present in the dark β-phase. (b) Detail of (a), dark particles of Pb and lighter particles of Fe are present. (c) SEM micrograph showing the α-phase in the dark β-phase. (d) Detail of (c).
Figure 4 shows the results obtained using energy dispersive spectroscopy (EDS). The copper and zinc showed a partially uniform distribution with small variations in the α- and β-phase. In addition, the regions corresponding to the particles showed a significant decrease in the concentration of these elements. The manganese was uniformly distributed throughout the matrix, and the tin showed variations according to the region analyzed, which will be discussed in more detail later. The iron had a significant accumulation in determinate areas, indicating that specific particles of this element exist in the matrix. Lastly, the lead was homogeneously distributed; however, there were some areas that were less intense for this element.
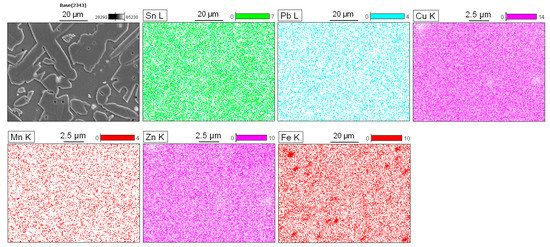
Figure 4.
Qualitative scanning of the energy dispersive X-ray spectroscopy (EDS) map, with distributions of the elements Sn, Pb, Cu, Mn, Zn, and Fe in the alloy.
The SEM-EDS maps identified several types of non-dissolved particles: Fe spherical shapes with a dark color and Pb agglomerates with a light color. In Figure 5a, iron is predominantly concentrated at the α-phase, and this occurs because it has a low solubility in the molten copper alloys. According to Sun et al., these particles have a bcc structure and, based on their crystal structure and chemistry, can be identified as α-Fe [22]. In 60/40 brass, the solubility of iron reduces from about 1.5 wt.% at 1020 °C to 0.04 wt.% at 950 °C [23]. This promotes the fine precipitation of iron particles that act as nuclei for new α-phase grains [24].
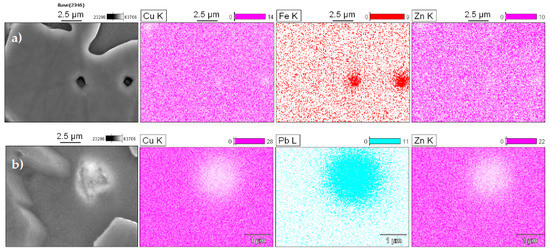
Figure 5.
Qualitative scanning of the energy dispersive x-ray spectroscopy (EDS) map in particles emphasizing high concentrations of (a) iron and (b) lead.
Lead has low solubility in solid copper, and so the lead particles appear as light and discrete globules at the α/β grain boundaries as high surface energy sites [25]. To prove this, the samples were inspected with elemental microanalysis using energy dispersive spectroscopy (EDS), and Figure 5b shows the results.
Figure 6a shows the microstructure observed in SEM micrograph indicating the phases and particles. The EDX point chemical analysis of the α- and β-phase are shown in Figure 6b,c, respectively. The results are similar to those noted in the literature, in which the β-phase has approximately 55% copper, and the α-phase has 64% [25].
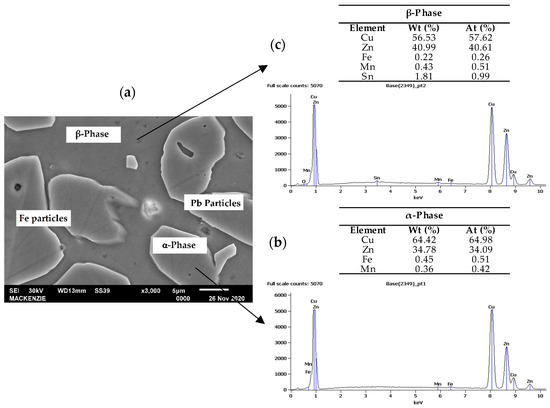
Figure 6.
(a) SEM micrograph showing the phase structure at higher magnification, EDS spectrum of the (b) α-phase area and (c) β-phase area.
According to the literature, first, the liquid metal transforms into an α-phase solid, and then the β-phase precipitates at the α grain boundaries. With continuous cooling, the disorder β-phase is transformed to the ordered β′. In addition, the tin content of the alloy was more stable in the β′-phase, and this information can be proven with the results presented in Figure 5, which shows that, in the EDS spectrum, Sn was contained only in the β′-phase [26].
The stress–strain results of 13 samples, including the reference sample with 34% cold work, are shown in Figure 7. All specimens fractured in the center of the gauge length. We observed, in Figure 7, the effect of temperature on the shape of the stress–strain curves of manganese bronze.
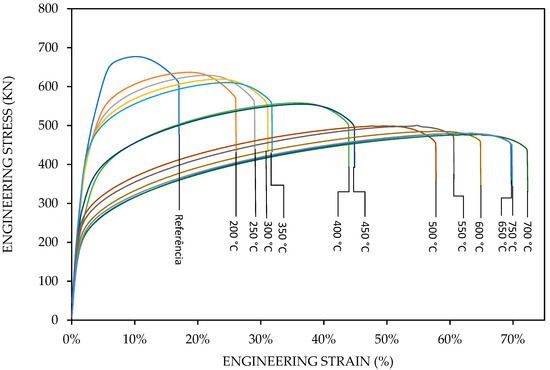
Figure 7.
Evaluation of the strength and ductility parameters of samples that were heat-treated for 200, 250, 300, 350, 400, 450, 500, 550, 600, 650, 700, and 750 °C.
Technologically, the stress–strain curves from 200 to 350 °C, shown in Figure 7, represent the temperature range of warm working, where the recovery process takes place; therefore, the degree of hardening by deformation is considerably less than in cold working. Probably, the stress–strain curves from 350 to 750 °C represent the hot working, also called hot forming, that involves deformation at temperatures above the recrystallization temperature.
The microstructure changes and variation of the yield strength, tensile strength, and ductility with the temperature during the heat treatment are shown in Figure 8a,b, respectively. Figure 8 presents the increasing annealing temperature with the subsequent increased ductility and decrease in the ultimate tensile strength and yield strength. Studies found the annealing of metallic material with addition of plasticity [27].
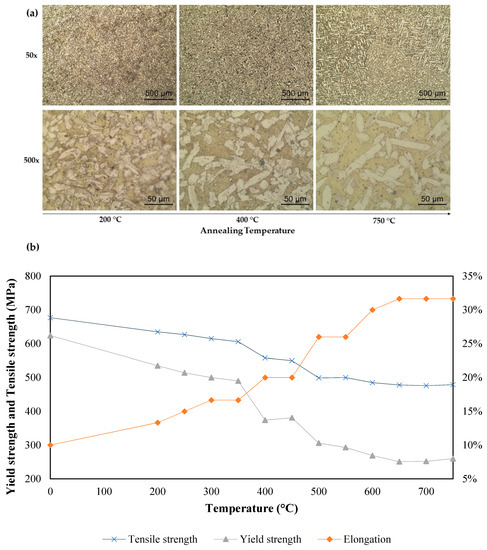
Figure 8.
Effect of temperature during heat treatment (a) in the sample microstructures at 200, 400, and 750 °C, respectively, in the columns from left to right, (b) the mechanical properties accordingly from each applied temperature.
This effect occurred because, during the annealing, there was a decrease of the stored energy during plastic deformation due to the mechanisms of rearrangement and the annihilation of crystal defects. This process can be divided in three states: recovery, recrystallization, and grain growth. The first mechanism is characterized by the annihilation and rearrangement of dislocations occurring normally in low temperatures and involves thermal activation, with the formation of subgrains with low-angles within the as-deformed grains, and thus high-angle grain boundaries are usually unaffected.
The second stage occurs with the nucleation and formation of strain-free new grains, where the driving force is the stored energy in the form of crystalline defects. In this step, the material restores the ductility, hardness, and strength that it had prior to cold deformation. The lowest temperature that forms new grains in a plastically deformed metal is known as the recrystallization temperature and normally corresponds to 1/3 to 1/2 of the melting point on the Kelvin scale. The last stage is characterized by the migration of boundaries; however, in this case, the driving force is the energy of the high angle boundaries [28,29].
The heat treatment of the samples showed that the recovery may have occurred between 200 and 350 °C, with the gradual reduction of engineering stress when compared with the reference sample. The reference sample presented a solid β solution matrix structure with the presence of a tensioned circular α-phase and intermetallic constituents dispersed in the material structure. This tensioning was gradually reduced with the increasing temperature, as shown in Figure 9. When reaching 350 °C, the material probably started its recrystallization with the formation of stress-free α-phase grains and ended at 500 °C. In this interval, there was an abrupt gap in the engineering stress and increase of elongation. In literature, for some manganese bronze alloys (UNS C67000, C67400, and C67500), the temperatures commonly used for annealing cold-worked are 425–600 °C, therefore the behavior found in Figure 8 is in accordance with previous research [1,18,19,20,21].
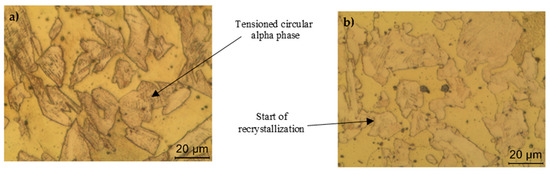
Figure 9.
(a) Tensioned structure corresponding to the reference sample. (b) Beginning of the decrease in the tension in the α-phase at 400 °C.
At 700 °C, the sample showed a structural discontinuity between the surface and the core of the material. On the surface, the material showed β granular formation with the presence of a widmanstatten α-phase and intermetallic microconstituents dispersed in the material structure. In the core, the material presented a solid β solution matrix structure and the presence of an α-phase in a circular and widmanstatten pattern.
The true stress–true strain curves were calculated from the engineering stress and engineering strain to represent the plastic deformation phenomenon. The true stress–strain curve is known as the flow curve and can be expressed by the power law, which was proposed by Hollomon [30].
where n is the exponent, which represents the strain-hardening coefficient; σ is the true stress, MPa; ε is the true strain; and K is the strength coefficient, MPa [31]. There is an approximate linear relationship between the true stress and true strain when plotted on a log–log scale. Therefore, through linear fitting of the lnσ-lnε curves, the strain-hardening exponent n was obtained by the fitted slopes, while the material constant lnK was obtained by the fitted intercept.
lnσ = lnK + nlnε
Therefore, Equation (2) represents a linear system, the slope of the line gives the n value n = ∂lnσ/∂lnε, and the intercept at ε = 1 gives the K value. Figure 10 presents graphs of the strain-hardening exponent n and strength coefficient K with respect to the annealing temperatures with the experimental data fitted with the Hollomon equation. Comparing the values that were determined in Figure 10b, when the annealing temperature was increased from 200 to 750 °C, the (n) values were found enhanced together with the variation from 0.2 to 0.5. The n value is related to the mechanical properties through the Hollomon equation, which describes that the value n was small, and the hardening rate was high initially with the plastic deformation; however, the hardening rate decreased rapidly with the increased strain. On the other hand, with a high n, the hardening rate was smaller at the initial plastic deformation; however, the hardening rate remained low until the high strains. In other words, the higher the hardening coefficient n, the more the materials will be able to deform/elongate.
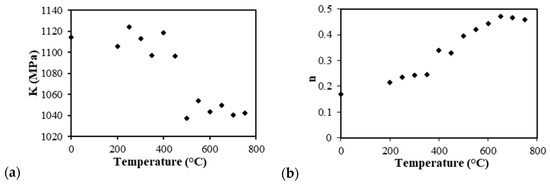
Figure 10.
The strength coefficient (a) and strain-hardening exponent (b) of the samples by annealing temperature.
According to William, the strain hardening behavior described by n depends on the composition, microstructure, and dislocation population. In this case, the composition was not altered, and neither was the β-phase (on average 50%); therefore, the values of the strength and elongation changed according to the microstructure and dislocation, and the n values corresponded to the annealing temperature each stage, as shown in Figure 8 [32].
The effect of temperature on the Vickers hardness is shown in Figure 11. Each point in the figure represents an average of five readings in the perpendicular plane of the samples.
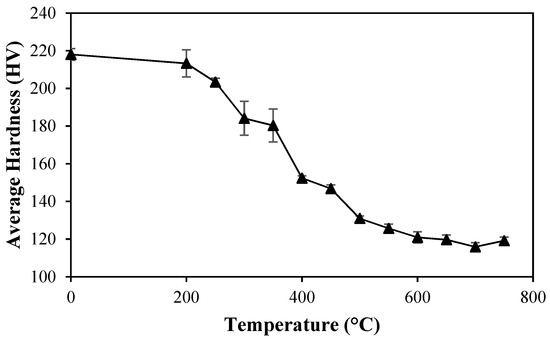
Figure 11.
Effect of temperature during heat treatment on the Vickers hardness of manganese bronze.
At low temperatures, small and continuous changes in the hardness occurred, which was due the reduction in the dislocation density causing a gradual decrease in the elastic distortion due to the formation of low energy structures [33]. When subjected to 400 °C, the sample showed a sharp drop in hardness, because, as previously discussed, the recrystallization begins at this temperature. Lastly, after 500 °C, few changes were noted, and they were only associated with grain growth at this stage.
4. Conclusions
As stems valve gates are submitted to compression and tensile stress during working movements to open and close a gate, studies evaluating the influence of variations in the cold reduction and temperature on the microstructural modifications and mechanical property changes are crucial for the development of technical predictions in alloy C67600 manufacturing as well as hydraulic engineering projects. The mechanical properties can be optimized with the knowledge provided to aim at a better performance in the final product for seawater applications with large temperature variations in the fluid. Regarding the manufacturing process, this study contributes to the understanding of the best heat treatments and cold working parameters to obtain desired shapes and dimensions, as continuous processes of cold working and heat treatment are required, which avoids adding production steps and cost increases. The following conclusions can be derived from the present study.
- (1)
- The increased annealing temperature generated an increase in ductility and a decrease in the ultimate tensile strength, yield strength, and Vickers hardness.
- (2)
- The microstructure was affected by the increase of the annealing temperature. Between 200 and 350 °C, recovery occurred, with a gradual decrease in the dislocation density in the circular α-phase. At 350 °C, the material began its recrystallization with the formation of stress-free α-phase grains, and this ended at 500 °C. Upon reaching 700 °C, the sample showed a structural discontinuity between the surface and the core of the material, with the appearance of a widmanstatten structure.
- (3)
- Conclude also that, to obtain significant changes in the properties, it is necessary to subject the UNS C67600 alloy to a heat treatment with a minimum temperature of 400 °C considering previous cold working of 34% minimum. This information is in agreement with information contained in the literature for other alloys of the manganese bronze family, since the recrystallization temperature for alloys UNS C67000, UNS C67400, and UNS C67500 is between 425 and 600 °C.
- (4)
- Analysis of the strain-hardening parameters demonstrated that the value n indicated the deformation capability of a material (meaning the elongation property); therefore, the strain hardening had a strong dependence on the microstructure and dislocation density, and the K value had a relationship with the ultimate tensile strength.
- (5)
Author Contributions
Conceptualization, F.G.L. and H.P.H.; Data curation, F.G.L. and H.P.H.; Formal analysis, F.G.L. and H.P.H.; Investigation, F.G.L. and H.P.H.; Methodology, F.G.L. and H.P.H.; Project administration, F.G.L. and H.P.H.; Software, F.G.L. and H.P.H.; Supervision, G.A.d.S. and A.A.C.; Validation, F.G.L., H.P.H., V.T.d.S., M.R.d.S., G.A.d.S. and A.A.C.; Writing—original draft, F.G.L. and H.P.H.; Writing—review & editing, V.T.d.S., M.R.d.S., G.A.d.S. and A.A.C. All authors have read and agreed to the published version of the manuscript.
Funding
Materials for this research were donation by Termomecanica São Paulo S.A.
Data Availability Statement
Not applicable.
Acknowledgments
The authors are grateful for the financial support provided by Termomecanica São Paulo S.A. for the donation of materials for analysis and the assignment of laboratories for analysis and research activities; Mackenzie Presbyterian University for support in obtaining the MEV images; and the Federal Institute of São Paulo (IFSP) for supporting the copper and copper alloy research.
Conflicts of Interest
The authors declare no conflict of interest.
References
- Joseph, R.D. Copper and Copper Alloys; Park Ohio: Cleveland, OH, USA, 2001; pp. 3–52. [Google Scholar]
- Nascimento, M.S.; Santos, G.A.; Teram, R.; Santos, V.T.; Silva, M.R.; Couto, A.A. Effects of Thermal Variables of Solidification on the Microstructure, Hardness, and Microhardness of Cu-Al-Ni-Fe Alloys. Materials 2019, 12, 1267. [Google Scholar] [CrossRef] [Green Version]
- ASTM-B138; Standard Specification for Manganese Bronze Rod, Bar, and Shapes. American Society for Testing and Materials: West Conshohocken, PA, USA, 2017.
- EN 12164; Copper and Copper Alloys. Rod for Free Machining Purposes. Deutsches Institut für Normung: Berlin, Germany, 2016.
- EN 12165; Copper and Copper Alloys—Wrought and Unwrought Forging Stock. Deutsches Institut für Normung: Berlin, Germany, 2016.
- EN 12167; Copper and Copper Alloys—Profiles and Bars for General Purposes. Deutsches Institut für Normung: Berlin, Germany, 2016.
- BS 2872; Copper and Copper Alloy Forging Stock and Forgings. British Standards Institution: London, UK, 1989.
- BS 2874; Copper and Copper Alloy Rods and Sections (Other Than Forging Stock). British Standards Institution: London, UK, 1967.
- Lyon, S.B. Corrosion of Tin and Its Alloys. In Shreir’s Corrosion, 1st ed.; Elsevier: Amsterdam, The Netherlands, 2010; pp. 2068–2077. [Google Scholar]
- Aluminium Bronze Alloys Corrosion Resistance Guide. Available online: Copperalliance.org.uk (accessed on 16 December 2020).
- Padilha, A.F. Materiais de Engenharia: Microestrutura e Propriedades; Hemus: São Paulo, Brazil, 1997. [Google Scholar]
- Askeland, D.R.; Phulé, P.P. Essentials of Materials Science and Engineering, 2nd ed.; Cengage Learning: Toronto, ON, Canada, 2008. [Google Scholar]
- Van Vlavk, L.H. Princípios de Ciência dos Materiais, 13th ed.; Addison-Wesley: São Paulo, Brazil, 2000. [Google Scholar]
- Jiang, J.; Britton, T.B.; Wilkinson, A.J. Evolution of dislocation density distributions in copper during tensile deformation. Acta Mater. 2013, 61, 7227–7239. [Google Scholar] [CrossRef]
- Meyers, M.; Chawla, K. Mechanical Behavior of Materials, 2nd ed.; Cambridge University Press: New York, NY, USA, 2008. [Google Scholar]
- Kumar, J.; Singh, D.; Kalsi, N.S.; Sharma, S.; Pruncu, C.I.; Pimenov, D.Y.; Rao, K.V.; Kapłonek, W. Comparative study on the mechanical, tribological, morphological and structural properties of vortex casting processed, Al–SiC–Cr hybrid metal matrix composites for high strength wear-resistant applications: Fabrication and characterizations. J. Mater. Res. Technol. 2020, 9, 13607–13615. [Google Scholar] [CrossRef]
- Huang, W.; Chai, L.; Li, Z.; Yang, X.; Guo, N.; Song, B. Evolution of microstructure and grain boundary character distribution of a tin bronze annealed at different temperatures. Mater. Charact. 2016, 114, 204–210. [Google Scholar] [CrossRef]
- Heat Treatment; ASM International: Novelty, OH, USA, 1991; Volume 4, pp. 1962–1968.
- ASM Metals Reference Book, 3rd ed.; ASM International: Novelty, OH, USA, 1993.
- Clauser, H.R. Industrial and Engineering Materials; McGraw-Hill: New York, NY, USA, 1975. [Google Scholar]
- Properties and Selection: Nonferrous Alloys and Special-Purpose Materials; ASM International: Novelty, OH, USA, 1990; Volume 2.
- Sun, Y.S.; Lorimer, G.W.; Ridley, N. Microstructures of some high tensile brasses. Mater. Sci. Technol. 1989, 5, 162–171. [Google Scholar] [CrossRef]
- Hudson, D.A. Iron-rich hard spots formed by silicon and boron in brasses. J. Inst. Met. 1963, 92, 280–288. [Google Scholar]
- Garcia, P.; Rivera, S.; Palacios, M.; Belzunce, J. Comparative study of the parameters influencing the machinability of leaded brasses. Eng. Fail. Anal. 2010, 17, 771–776. [Google Scholar] [CrossRef]
- Pantazopoulos, G.A.; Toulfatzis, A.I. Fracture Modes and Mechanical Characteristics of Machinable Brass Rods. Characteristics of Machinable Brass Rods. Metallogr. Microstruct. Anal. 2012, 1, 106–114. [Google Scholar]
- Mitchell, T.E.; Thornton, P.R. The work-hardening characteristics of Cu and α-brass single crystals between 4•2 and 500° K. Philo. Mag. J. TEAP 1963, 8, 1127–1159. [Google Scholar]
- Beck, P.A. Annealing of cold worked metals. Adv. Phys. 1954, 3, 245–324. [Google Scholar] [CrossRef]
- Raabe, D. Recovery and Recrystallization: Phenomena, Physics, Models, Simulation. Phys. Metall. 2014, 2291–2397. [Google Scholar] [CrossRef]
- Rios, P.R.; Siciliano, F.; Sandim, H.R.Z.; Plaut, R.L.; Padilha, A.F. Nucleation and Growth During Recrystallization. Mater. Res. 2005, 8, 225–238. [Google Scholar]
- Hollomon, J.H. Tensile Deformation. Trans. Metall. Soc. AIME 1945, 162, 268–290. [Google Scholar]
- Jian, P.; Kaishang, L.; Qiao, D. Mechanical properties of pre-strained austenitic stainless steel from the view of energy density. Results Phys. 2018, 10, 187–193. [Google Scholar] [CrossRef]
- William, F.H. Mechanical Behavior of Materials, 2nd ed.; Cambridge University Press: Cambridge, UK, 2009; pp. 65–67. [Google Scholar]
- Alaneme, K.K.; Okotete, E.A. Recrystallization Mechanisms and Microstructure Development in Emerging Metallic Materials: A Review. J. Sci. Adv. Mater. Devices 2019, 4, 19–33. [Google Scholar] [CrossRef]
Publisher’s Note: MDPI stays neutral with regard to jurisdictional claims in published maps and institutional affiliations. |
© 2022 by the authors. Licensee MDPI, Basel, Switzerland. This article is an open access article distributed under the terms and conditions of the Creative Commons Attribution (CC BY) license (https://creativecommons.org/licenses/by/4.0/).