Abstract
Nowadays, China is faced with increasing downward pressure on its economy, along with an expanding business risk on listed companies in China. Listed companies, as the solid foundation of the national economy, once they face a financial crisis, will experience hazards from multiple perspectives. Therefore, the construction of an effective financial crisis early warning model can help listed companies predict, control and resolve their risks. Based on textual data, this paper proposes a web crawler and textual analysis, to assess the sentiment and tone of financial news texts and that of the management discussion and analysis (MD&A) section in annual financial reports of listed companies. The emotional tones of the two texts are used as external and internal information sources for listed companies, respectively, to measure whether they can improve the prediction accuracy of a financial crisis early warning model based on traditional financial indicators. By comparing the early warning effects of thirteen machine learning models, this paper finds that financial news, as external texts, can provide more incremental information for prediction models. In contrast, the emotional tone of MD&A, which can be easily modified by the management, will distort predictions. Comparing the early warning effect of machine learning models with different input feature variables, this paper also finds that DBGT, AdaBoost, random forest and Bagging models maintain stable and accurate sample recognition ability. This paper quantifies financial news texts, unraveling implied information hiding behind the surface, to further improve the accuracy of the financial crisis early warning model. Thus, it provides a new research perspective for related research in the field of financial crisis warnings for listed companies.
1. Introduction
The financial situation of listed companies has attracted the attention of government departments, shareholders, business operators, creditors and other stakeholders in pace with the development of the capital market. Academics have also been committed to exploring effective financial crisis recognition indicators and constructing a more accurate financial crisis warning model to improve the predictive capability of listed companies’ financial crises. In terms of the selection of crisis recognition indicators, most scholars focus more on standardized financial data and less on non-standardized textual information. Textual information, as a newer data element, contains richer emotions. Thus, the sentiment analysis of textual information turns out to be an effective supplement to financial indicators. This paper quantifies the sentiment and tone of MD&A sections in the annual financial reports of listed companies and financial news texts, combining them with traditional financial indicators, respectively, to form new input feature variables. Furthermore, it constructs different financial crisis early-warning models based on thirteen representative machine learning methods. The study puts textual information and traditional financial indicators together for financial crisis identification, which has a significant positive effect on the sustainable growth of Chinese listed companies and the capital market.
Based on the emotional tone of texts and machine learning models, this paper mainly focuses on four questions as follows:
- RQ1: Whether the combination of the emotional tone of MD&A texts and traditional financial indicators can improve the identification of financial crises of listed companies.
- RQ2: Whether the combination of the emotional tone of financial news texts and traditional financial indicators can improve the identification of financial crises of listed companies.
- RQ3: A comparative study of the effect of the emotional tone of internal texts (MD&A) and external texts (financial news) on early warning of financial crises in listed companies.
- RQ4: A comparative study of the early warning effects of thirteen machine learning models.
Based on the above research questions, this paper selects 1082 Chinese A-share (RMB-denominated common shares) listed companies from 2012 to 2021 as the sample. This paper takes the year of the sample as T and selects the traditional financial indicators in T-3 years as the benchmark. This study compares the financial crisis early warning effect incorporated with the emotional tone of MD&A texts and financial news texts, respectively, and then compares the recognition performance of thirteen machine learning models. Finally, in this paper, we find the emotional tone of the text that can improve the financial crisis recognition performance of listed companies, along with the financial crisis early warning model with greater accuracy.
In summary, the contributions of this paper are mainly: (1) This paper quantifies textual information and uses the information as a new prediction indicator to measure the financial crisis of listed companies, which expands the choice of financial crisis prediction indicators. (2) This paper covers universal machine learning models. By comparing the effects of different models based on different combinations of prediction indicators, this paper finds models with better and more stable early warning effects, which provide references for model users. (3) This paper investigates the effectiveness of the emotional tone indicator of financial news texts on the early warning models for financial crises and finds that this indicator helps enhance the accuracy of these early-warning financial crisis models for listed companies. (4) This study expands on the differences between the emotional tone indicator of MD&A and that of financial news in enhancing financial crisis warning capability, from the perspective of the internal and external texts of companies. Moreover, it expands the relevant research in the field of research concerning financial crisis early warning models for listed companies.
This paper is structured as follows. The second part introduces related studies. The third part gives an introduction to the basic models and methods involved in this study. The fourth part describes the selection of traditional financial indicators and the process of emotional tone indicators and conducts an empirical study and analysis based on the data of Chinese listed companies. The fifth part further discusses the empirical results. Finally, the paper concludes with an outlook on future research directions.
2. Related Studies
2.1. Theoretical and Empirical Definition of the Concept of Financial Crisis
There is no uniform theoretical definition of the concept of the financial crisis. Two mainstream views exist on the current definition. Beaver [1] took the company’s inability to pay its debts as the main measure of a financial crisis and summarized four elements of financial crises: bank overdrafts, unpaid preferred stock dividends, bond defaults and declaration of bankruptcy. A company would be considered to be in financial crisis if it meets one of these conditions, only the severity of the crisis varies. Another view equated a financial crisis with the situation where the company collapses into bankruptcy, claiming that a company in financial crisis referred to the act of filing a legal bankruptcy petition under the bankruptcy law [2]. From the perspective of defining financial crises empirically, the researchers usually define the listed companies undergoing financial crises as those under special treatment (ST) [3,4,5,6,7]. A stock identified as ST represents that the listed company has an abnormal financial condition, and this abnormality mainly includes one of two cases: one is that the listed company has lost money for two consecutive years, and the other is that the net assets of the listed company are lower than the par value of the stock. In this paper, the research object is Chinese listed companies. It is difficult to apply the standards of other countries to meet the actual situation and to define whether a listed company has a financial crisis or not. Therefore, the financial crisis in this study is defined as the listed companies marked with ST, which is more in line with objective reality.
2.2. Financial Crisis Early Warning Indicators and Methodological Techniques
In terms of the selection of early warning indicators for financial crises, existing studies have mainly used traditional financial indicators as the basis for early warning of financial crises, with the indicators mainly reflecting solvency, operating performance and cash flow [8,9,10,11,12,13,14]. However, little literature considered other sources of information that interact with financial data, where textual information is an important form. There was a small proportion of literature that used the tone of texts such as company annual reports to predict corporate financial crises and confirmed that non-standardized financial information can be used for financial crisis early warning [15,16,17,18]. Referring to existing literature [19,20], this paper considers the following five perspectives which measure the performance of listed companies as profitability, solvency, asset operating efficiency, cash flow quality and development quality, choosing ten traditional financial indicators as benchmarks. For the textual information, this paper selects both internal (MD&A) and external (financial news) texts and calculates the emotional tone to complement traditional financial indicators.
In terms of the use of early warning models, related research presents a transition from univariate analysis to multivariate analysis, and then to the machine learning method which is broadly used nowadays. At the very beginning, researchers mainly focused on univariate analysis methods, using two ratios, net income/shareholders’ equity and shareholders’ equity/debt, for early warning of the financial crisis of the company [21]. Some researchers selected fourteen financial ratios from company financial statements for comparative studies and found that the ratio of cash flow to total liabilities is a better predictor of financial crisis in a company [1]. For bridging the limitation of the univariate analysis method, researchers used the Z-score model as the introduction of multivariate discriminant analysis into financial crisis warning. Some researchers chose their five most significant indicators among the beginning twenty-two financial indicators to construct the Z-score model. They used the magnitude of the Z-value to reflect the bankruptcy risk a company faces and found it more accurate than the univariate warning model [2]. However, in practice, it was found that the Z-score model is especially suitable for short-term prediction, so the ZETA model was subsequently proposed as a complement to this model. The modified model had a significantly better long-term warning effect [22]. Other scholars used logistic models for financial crisis prediction. With the help of this model, they overcame the strict requirements for the distribution of independent variables in the analysis and confirmed its high accuracy in predicting studies of listed companies [23]. As a result, this method has gradually replaced discriminant analysis as the mainstream method in this field.
Machine learning began to be introduced into the field of financial crisis early warning with the development of information technology. Some scholars applied neural network techniques to crisis early warning models and found that this method could better predict samples [24]. Random forest was also applied in the risk prediction of listed companies. Compared to the AdaBoost algorithm, the result of the random forest exercise showed a decreasing error rate [25]. Researchers also applied the model of support vector machine (SVM), which works well for nonlinear and high-dimensional samples. In the prediction results of 944 manufacturing companies, they found that the SVM has a better early warning effect than the Back Propagation (BP) neural network, logistic regression and multiple linear regression models [26]. Furthermore, some researchers conducted a comparative study, by using several methods to construct financial early warning models. Wang et al. [27] used three decision tree models to build a financial crisis early warning model and found that the random forest model has the best classification and prediction capabilities.
The existing research mainly used a single model or several models but paid little attention to the comparative study of different machine learning models. This paper proposes to use thirteen mainstream machine learning methods, including logistic regression, ridge regression, lasso regression, GBDT, CatBoost, XGBoost, LightGBM, AdaBoost, SVM, BPNN, decision tree, random forest and Bagging, to build early warning models for corporate financial crises. Each type of machine learning is based on different theoretical backgrounds, and its applicability can be fully exploited for different data. The empirical study demonstrates the financial crisis recognition effect of each model to provide a basis for enterprises’ decision-making.
2.3. The Emotional Tone of Text and Financial Crisis Early Warning
Textual information, as a new type of data factor, contains more emotions than standardized financial data and is characterized by containing both negative and positive emotions. Some researchers have studied the tone of textual information disclosed by companies. They found that the tone of management in the disclosure of annual reports, management discussion, analysis and prospectuses has a predictive effect on the future performance of the company [28,29,30,31,32]. Chinese listed companies have begun to add management discussion and analysis to their annual reports since 2005, which is an effective supplement to the annual reports. This section includes further explanations of important events in the earning calendar and descriptions of business plans, possible challenges and difficulties in the next year. Existing literature has suggested that when listed companies are trapped in financial trouble in the current year, the appearance of negative words in the MD&A section will increase, along with the level of uncertainty [33,34]. By analyzing the tone of earning calendars some researchers predicted the financial crisis of listed companies and verified the availability of non-standardized financial information in financial crisis recognition [35,36,37,38]. However, the textual tone seems to fail to perform as a definite and true reflection of the situation of the company all the time. Compared to numerical information, textual information can be more easily manipulated, which even costs less [39]. Some researchers have pointed out that management can manipulate their tone for the purpose of whitewashing corporate earnings, which further leads to irrational trading and poses greater risks to business operations [40,41]. The positive tone formed by this manipulative behavior affected the assessment of the firm’s operating conditions, so it did not necessarily improve the early warning effect of the model [42,43]. Yang et al. [44] also pointed out that company management may release positive information by modifying the text, and it would in turn reduce the accuracy of the early warning model of a company’s financial crisis by adding emotional tone.
It can be seen that in some relevant papers, research mainly focused on the internal texts of companies, including MD&A and annual reports, but seldom noticed the external texts. This paper will study the emotional tone of financial news texts relating to listed companies and compare the effect of internal and external texts on the improvement of prediction accuracy of the financial crisis early warning model. In addition, the literature showed that research on internal textual tone and the effect of early warning of a financial crisis in listed companies presented two views. This paper will also use sample data for a 10-year period from 2012 to 2021 to explore these two views empirically.
3. Machine Learning Models
Machine learning methods are widely used to solve complex problems in engineering applications and scientific fields [45,46,47,48,49,50,51]. Based on the classification problem, this paper chooses thirteen mainstream machine learning models to study the effect of crisis warning. These models include traditional machine learning models, tree-based machine learning models and integrated machine learning models. This section introduces the main contents of the models.
3.1. Logistic Regression, Ridge Regression, Lasso Regression
Logistic regression (LR) is well-known as a machine learning method for solving binary classification problems by mapping the results of sigmoid functions. It maps any real value to a value between zero and one but does not take zero or one. A threshold classifier is then used to convert the value in the interval of (0, 1) to the value of zero or one. The Sigmoid function plays the role of a threshold classifier, and the functional formula is shown in Equation (1).
Overfitting problem always exists when fitting a model, and so is the case with the logistic regression model. One solution to this problem is regularization, which can be divided into L1 regularization and L2 regularization. The objective function of the ridge regression is the sum of the average loss function and L2 regularization. The objective function of the Lasso regression is the sum of the average loss function and L1 regularization. The key difference between these two is the penalty term. L1 regularization adds the L1 norm as a penalty term to the average loss function, making it easier to obtain a sparse solution. L2 regularization adds a squared magnitude of the L2 norm as a penalty term to the loss function. Compared with L1 regularization, L2 regularization provides a smoother solution that can reduce the complexity of the model.
3.2. Support Vector Machine
Support vector machine (SVM) is a binary classification model and a linear classifier that finds the partitioned hyperplane with the maximum interval. Its learning strategy is interval maximization, which can eventually be translated into the solution of a convex quadratic programming problem. Vapnik first proposed the SVM model in 1995 [52], and this model has shown many unique advantages in solving problems such as small samples, non-linear and high-dimensional pattern recognition. Its excellent performance in classification becomes a major technique in machine learning and has been extended to other machine learning applications such as function fitting. In real situations, the sample data are mostly nonlinearly separable. When dealing with nonlinear problems, they need to be transformed into linear problems. By introducing a suitable kernel function, an optimal classification hyperplane can be constructed to achieve fast processing of high-dimensional inputs. This paper adopts the current mainstream radial basis kernel function, as shown in Equation (2). and represent the feature vectors of the ith sample and jth sample, respectively. represents the parameter of the radial basis kernel function.
3.3. Back Propagation Neural Network
Back propagation neural network (BPNN) was proposed by Rumelhart et al. [53]. The BPNN is a widely used neural network model, consisting of an input layer, an implicit layer and an output layer. Through the training of sample data, researchers continuously modify and iterate the network weights and thresholds until they reach the minimum sum of squared errors of the network, where the desired output is approximated. The neural network model needs the participation of the activation function, which could make the sparse model better able to mine relevant features to fit the training data, as a source of nonlinearity in neural networks. The commonly used activation functions are the Sigmoid function, Tanh function and ReLU function. This paper uses the ReLU function, which is a sparse activation function that enables the sparse model to better mine the relevant features and fit the training data. Concurrently, compared with the Sigmoid function and Tanh function, the ReLU function is faster and overcomes the problem of gradient saturation and gradient disappearance. The formula of the ReLU function is shown in Equation (3).
3.4. Decision Tree and Random Forest
Decision tree (DT) model is a tree structure for classifying samples based on features, with each of its leaf nodes corresponding to a classification, and non-leaf nodes corresponding to a division of a certain attribute. The models constructed by decision trees are readable, and common DT algorithms are ID3, C4.5 and CART (Classification and Regression Tree) [54,55,56]. This paper adopts the Gini index to classify the attributes of the CART decision tree, and the Gini(D) reflects the probability that two randomly selected samples with inconsistent category labels in the data set D. The smaller the Gini(D), the higher the purity of the dataset. The higher the purity of a decision tree node means that the samples contained in the branch nodes of the decision tree are most likely to belong to the same category. The Gini index of attribute α is defined by Equation (4), where V is the number of possible values of attribute α.
Random forest (RF) is an integrated machine learning model. It consists of several decision trees and selects the majority of classification results as the final result, resulting in an overall model with high accuracy and generalization performance.
3.5. Gradient Boosted Decision Tree
Proposed by Friedman [57], Gradient boosted decision tree (GBDT) is an iterative decision tree algorithm, which is composed of multiple decision trees. The main idea of the algorithm is as follows. (1) The initialization of the first base learner. (2) The construction of M base learners. (3) The calculation of the value of the negative gradient of the loss function in the current model, then using it as an estimate of the residual. (4) Building a CART regression tree to fit this residual and finding a value that reduces the loss as much as possible at the leaf nodes of the fitted tree. (5) Updating the learner. The method can do both regression and classification. The loss function chosen in the regression algorithm is generally the mean squared error or absolute value error, while the loss function chosen in the classification algorithm is generally a logarithmic function. The core of GBDT is that in each iteration, the latter decision tree is trained using the residuals of the previous decision trees following the negative gradient. The negative gradient residuals can be calculated by Equation (5).
where denotes the negative gradient of sample i at the iteration of tth times. represents the loss function, which can be expressed as Equation (6).
3.6. CatBoost, XGBoost and LightGBM
CatBoost, XGBoost and LightGBM share basically the same principle, and can be categorized into the family of gradient boosting decision tree algorithms. The characteristics of these three models are described below.
CatBoost takes a symmetric decision tree as a base model, having only a few parameters. CatBoost combines category features to construct new features, which enriches the feature dimension and facilitates the model to find important features. CatBoost is very flexible in handling category-based features, and the processing process is as follows: (1) Randomly sort the input sample set and generate multiple sets of random permutations. (2) Convert floating point or attribute value token to integers. (3) All the category-based feature results are converted into numerical results according to Equation (7). Where, φ represents the indicator function. The function value takes 1 if it satisfy the condition , otherwise takes 0. p is the a priori value, and α is the weight of the a priori value.
XGBoost adds the complexity of the tree model into the regularization to avoid overfitting. The model performs well in generalization and supports training and prediction for data containing the missing value. The essence of XGBoost is integrated from decision trees, so the model can be written as Equation (8), where k is the number of decision trees in the model, is the ith input sample, denotes the predicted value of the model after the kth iteration, denotes the predicted value of the kth tree and F is the set of all decision trees.
GBDT requires multiple training of the entire training data at each iteration. With a higher training efficiency, LihghtGBM takes GBDT as its core and makes essential improvements in many aspects, including second-order Taylor expansion for objective function optimization, a histogram algorithm and an optimized leaf growth strategy. It also makes the algorithm more adaptable to high-dimensional data. LightGBM uses the Gradient-based One-Side Sampling algorithm, which maintains the accuracy of the information gain estimation. The information gain is measured using the variance gain after splitting, keeping only those samples with larger contributions. The formula of variance gain is given in Equation (9), where j is the split feature used, d is the split point of the sample feature and n is the number of samples. A and B are samples with large and small gradients, respectively. l and r are the left and right subtrees, respectively, and g is the sample gradient.
3.7. AdaBoost and Bagging
Freund and Schapire first proposed the AdaBoost algorithm in 1995 [58]. The algorithm learns a series of weak classifiers from the training data and then accumulates them by certain weights to obtain strong classifiers. It first assigns an initial weight value to each sample and then updates the sample weight with each iteration. The sample with a small error rate will have a reduced weight value in the next iteration, while the sample with a significant error rate will increase the weight value in the next iteration. This algorithm belongs to a typical integrated learning method. Finally, M weak classifiers are combined into a strong classifier according to their respective weights, as detailed in Equation (10). Where, is the mth base classifier, and is the weight of this base classifier in the strong classifier.
Bagging is another sort of integrated learning method. The main idea is to train multiple classifiers by sampling the training set several times and then vote on the test set, in which each classifier is equally weighted. The given winning result is the final classification result. The final classifier is shown in Equation (11), where M is the number of classifiers, and is the individual classifiers trained. The main difference with AdaBoost is that its training set is selected with put-back in the original set, and the training set selected from the original set are independent of each other for each round. In addition, AdaBoost determines its weight values based on the error rate situation, while Bagging uses uniform sampling with equal weights for each sample. Finally, Bagging can generate the individual prediction functions in parallel, while AdaBoost can only generate them sequentially because the latter model parameters require the results of the previous model round.
4. Empirical Analysis
4.1. Design of the Empirical Analysis Process
As shown in Figure 1, the steps of the empirical process of financial crisis warning in listed companies based on thirteen machine learning models are as follows.
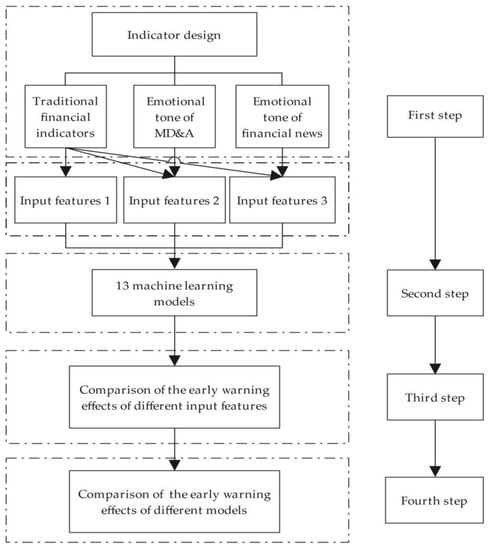
Figure 1.
Flow chart of empirical analysis.
In the first step, this paper carries out the indicator design, including the selection of traditional financial indicators, the construction of the emotional tone indicators of both the MD&A section and financial news. Traditional financial indicators constitute input feature 1. Traditional financial indicators and the emotional tone indicators of MD&A constitute input feature 2, and traditional financial indicators and emotional tone indicators of financial news constitute input feature 3.
In the second step, this paper uses thirteen mainstream machine learning models, including logistic regression, ridge regression, lasso regression, GBDT, CatBoost, XGBoost, LightGBM, AdaBoost, SVM, BPNN, decision tree, random forest and Bagging, to establish a financial crisis early warning model for companies. The three sets of input feature variables formed in the first step are sequentially substituted into the model, and the output feature variables are binary values, which implies whether the company is a listed company marked ST or not. All machine learning models in this paper are supervised learning models. The code of machine learning models is written and run using PyCharm.
In the third step, this paper compares the effect of different input feature variables for the identification of financial crises of listed companies.
In the fourth step, the early warning effects of thirteen machine learning models are compared based on a combination of different input feature variables.
4.2. Evaluation Index System Construction
Based on traditional financial indicators, this paper compares the warning effect of the financial crisis early warning model merged with different textual emotional tone indicators. In this section, this paper explains the selection of traditional financial indicators and the process of textual emotional tone indicators.
4.2.1. Traditional Financial Indicators
The selection of traditional financial indicators has a direct influence on the accuracy of the early warning model. This paper follows the principles below in terms of selecting indicators.
- Principle of importance: It is necessary to select important indicators, instead of picking all traditional financial indicators indiscriminately.
- Principle of accessibility: The selection of traditional financial indicators should consider the accessibility of data and try to select data that are easy to collect.
- Principle of objective relevance: The selection of traditional financial indicators needs to be highly relevant to the purpose of use, and a financial crisis warning requires that the selected indicators are highly relevant to the financial situation of the listed company.
Since there is no accepted standard for the financial indicators used in the financial crisis early warning model, based on the relevant category literature, this paper selects five aspects of traditional financial indicators according to the principles of selection [8,9,10,11,12,13,14,19,20]. The financial status of listed companies depends mainly on the profitability, solvency, asset operating efficiency, cash flow quality and development quality of listed companies in these five aspects, which contain a total of ten specific indicators. The traditional financial indicators selection and calculation formula are shown in Table 1.

Table 1.
The selection of traditional financial indicators and formulas.
4.2.2. Textual Emotional Tone Indicators
For the emotional tone indicators of MD&A, this paper first uses Python to write a web crawler program to crawl from CNINFO (see www.cninfo.com.cn, accessed on 17 April 2022), which is the information disclosure website of listed companies designated by the China Securities Regulatory Commission. After data cleaning and making Chinese word separation with the raw text data crawled, based on the financial emotional English words list provided by Loughran and McDonald [28], this study obtains an emotional dictionary translated from English to Chinese, and then counts positive and negative emotion words.
There are two main methods in terms of measuring the textual emotional tone. The first is to measure emotional tone by the ratio of the difference between positive words and negative words to the total words [59,60]. The second is to use the ratio of the difference between positive words and negative words to the sum of positive words and negative words [61,62,63,64,65,66]. The second method is adopted in this paper, and the formula is shown in Equation (12).
Tone presents the value of emotional tone, and the range of values is [−1, 1]. Pos is the number of words with a positive tone in the text, and Neg is the number of words with a negative tone in the text.
For the emotional tone indicators of financial news, the study uses the data from the Chinese research data Services Platform, which has a database of financial news of Chinese listed companies. The database collects financial news of listed companies from more than 400 online media and 500 newspaper publications. It also counts the amount of positive and negative news for each listed company. The same Formula (1) is used to calculate the value of the emotional tone of financial news based on the number of positive and negative news.
4.3. Sample Selection and the Source of Data
Whether a company is marked as ST (an indicator of delisting risk) is taken as the identifier of financial crisis for Chinese listed companies, and the year in which a financial crisis occurs is defined as year T. This paper chooses listed companies that are newly labeled as ST in year T as the sample of ST listed companies, with a time interval from 2012 to 2021. The number of listed companies labeled as ST in 2012–2021 and the ratio of listed companies marked as ST to all A-share listed companies in that year are shown in Table 2. The number of listed companies labeled as ST in each of the 10 years is 550, and we finally obtained 541 listed companies labeled as ST by excluding 9 companies that had no traditional financial indicators data in year T-3. It can be found in this table that the total number of listed companies labeled as ST is very limited, which will lead to the imbalance of data between ST and non-ST listed companies. Therefore, this paper will explain how to solve the imbalance data problem in Section 4.4. Finally, this paper chooses 541 non-ST listed companies, the same number as the selected ST listed companies. It forms a total of 1082 samples, of which ST listed companies are in the positive category and non-ST listed companies are in the negative category.
Table 2.
Number and share of ST companies and all listed companies.
ST listed companies are companies that have been given special treatment for two consecutive years of losses, so the financial indicator data of T-2 years have already shown the financial crisis. In order to reflect the effect of early warning, this paper uses the financial indicator data of T-3 years. For instance, financial indicator data in 2017 are used, which were actually published in 2018, for the early warning analysis of listed companies labeled as ST in 2021. The traditional financial indicator data used in this paper are obtained from the China Stock Market and Accounting Research Database. MD&A text is crawled from CNINFO, which is processed as an emotional tone indicator through natural language. The financial news text data are obtained from the Chinese Research Data Services Platform, with the tone values calculated according to the emotional tone formula.
4.4. Data Processing
To solve the problem of imbalanced data, this paper follows the practice of many previous researchers, adopting the random under-sampling method [67,68,69]. By selecting the number of listed companies labeled as ST as the number of non-ST listed companies and form a balanced data set.
Considering the effect of extreme values of the data, this paper winsorizes all continuous variables by 1% up and down.
This paper uses gradient descent for loss function optimization, and the use of feature normalization helps the model converge faster and the gradient descent process is straighter and more stable. The use of Lasso regression and ridge regression will make coefficients smaller for features with large dimensions, leading to an omission of this feature. The coefficient changes have a very small degree of influence on the change of regularization term values, so the effect of dimension needs to be eliminated by normalization. Although some tree-based models are more concerned with which cut point is optimal in a particular feature, normalizing these features does not affect the result of that model. It is necessary to normalize the feature variables of other models. In summary, this paper normalizes all input feature variables to map the feature variable data to a range of [0, 1], and the normalization formula is given in Equation (13).
and present the values before and after data normalization, and present the minimum and maximum values of the sample data, respectively.
4.5. Results of Empirical Analysis
In the division of the machine learning model dataset, this paper adopts the 10-fold cross-validation, dividing the dataset into 10 parts, and taking turns to use 9 of them as the training set and 1 as the test set. The process is repeated 10 times, and we use the average of the results as the estimation of the algorithm accuracy. For one thing, it enhances the generalization ability of the model. For another thing, it avoids the overfitting situation. This paper performs ten times the 10-fold cross-validations and averages the results to reduce the chance and increase the confidence of the results.
As for the evaluation indexes of the early warning effect of machine learning models, this paper selects the average accuracy, the prediction accuracy of non-ST listed companies, the prediction accuracy of ST listed companies and Area Under Curve (AUC) as the evaluation indexes. In the dichotomous classification, the prediction results will appear in the following four cases.
- True Positive (TP): Positive samples predicted by the model as positive;
- False Positive (FP): Negative samples predicted by the model as positive;
- False Negative (FN): Positive samples predicted by the model as negative;
- True Negative (TN): Negative samples predicted by the model as negative;
According to the four prediction results, this paper calculates the evaluation indicators of the machine learning model. The average accuracy (ACC) is calculated by Equation (14), which represents the share of the number of correctly predicted samples to the total number of the samples.
The prediction accuracy rate of non-ST listed companies, also known as sensitivity (SEN), is calculated by Equation (15), which represents the percentage of samples with correct predictions among all samples that are truly non-ST listed companies.
The prediction accuracy rate of ST listed companies, also known as specificity (SPE), is shown in Equation (16), which represents the percentage of samples with correct predictions among all samples that are truly ST listed companies.
AUC is the area under the line of the Receiver Operating Characteristic (ROC) Curve, the area which is chosen to measure the accuracy of the dichotomous classification model. The larger the value of the AUC area is, the higher the classification accuracy of the model. When the value of the AUC area is less than 0.5, the model will almost lose its predictive effect. the AUC calculation formula is shown in Equation (17).
represents the serial number of the ith sample. m and n represent the number of positive samples and negative samples, respectively. means the numbers of positive samples are added up.
In this paper, AUC, as well as the value of SPE, will be prioritized when determining the effect of early warning. This is because AUC is used to measure the overall performance of a model in identifying the financial crisis of the sample companies. As the prediction accuracy of the sample of ST listed companies, SPE is more important than the prediction accuracy of the sample of non-ST listed companies, because the goal is the identification of the listed companies in financial crisis.
4.5.1. Analysis of Empirical Results of Financial Crisis Early Warning Based on Traditional Financial Indicators
Using traditional financial indicators as the benchmark, this paper tests the performance effects of thirteen machine learning models based on traditional financial indicators, and the results are shown in Table 3. The ranking is based on the value of AUC, where the five models with the highest value are AdaBoost, random forest, Bagging, DBGT, and CatBoost. Bagging has the highest prediction accuracy of 0.6839 for the sample of ST listed companies, followed by the random forest model and the DBGT model, with a value of 0.6821 and 0.6710, respectively. Among the thirteen machine learning models, the decision tree has the lowest value of AUC and SPE. All thirteen models have an AUC of 0.7 or higher, and the average AUC of the thirteen models is 0.7292. The average score of ACC, SEN and SPE is 0.6647, 0.6707 and 0.6586, respectively.
Table 3.
Early warning effects of thirteen machine learning models based on traditional financial indicators.
4.5.2. Analysis of the Empirical Results of Financial Crisis Early Warning Based on Traditional Financial Indicators and Emotional Tone of MD&A
According to the RQ1 proposed by this paper, this section examines the early warning effects of thirteen machine learning models using traditional financial indicators and the emotional tone of MD&A as input feature variables. The results are shown in Table 4, and the ROC curves are detailed in Figure A2 of Appendix A. From the comparison of the values of AUC, it can be found that AdaBoost, random forest, DBGT, and Bagging and CatBoost models are the five models with the best performance.
Table 4.
Early warning effects of thirteen machine learning models based on traditional financial indicators and emotional tone of MD&A.
Compared to the warning effect of thirteen machine learning models based on traditional financial indicators, there is a slight decrease in the average value of AUC, ACC, SEN and SPE in thirteen machine learning models merging emotional tone of MD&A, but the magnitude of decrease was less than 0.01. In addition, there are seven machine learning models with slightly decreasing AUC and six machine learning models with slightly increasing AUC, but the magnitude was less than 0.01. As for these six machine learning models with slightly higher AUC, a further comparison of the value of ACC, SEN and SPE shows that the values of the five models are lower than those only based on traditional financial indicators. Then this paper studies the distribution of emotional tone of MD&A for ST and non-ST listed companies and finds that the distribution is more consistent and does not have significant differentiation. The results are shown in Table 5. Because of the existence of management manipulation and modification of emotional tone in ST listed companies, the emotional tone of MD&A in ST and non-ST listed companies is not as distinguishable as it is expected to be. Through the empirical results, it can be clearly seen that the emotional tone of MD&A does not have a significant effect on the early warning of financial crises of listed companies and even brings some noise.
Table 5.
Descriptive statistics of the emotional tone of MD&A for ST and non-ST listed companies.
4.5.3. Analysis of Empirical Results of Financial Crisis Early Warning Based on Traditional Financial Indicators and Emotional Tone of Financial News
Financial news text, as an external text, having a characteristic of objectivity, is not susceptible to manipulation by the companies. Based on this, this paper studies whether the emotional tone of financial news texts can enhance the effect of traditional financial indicators for the identification of financial crises in listed companies. Based on traditional financial indicators and the emotional tone of financial news, the empirical results of financial crisis early warning are shown in Table 6. The ROC curve is detailed in Figure A3 of Appendix A. By comparing the values of AUC, it can be found that CatBoost, AdaBoost, random forest, DBGT and Bagging remain to be the five models with the best performance.
Table 6.
Early warning effects of thirteen machine learning models based on traditional financial indicators and the emotional tone of financial news.
Figure 2 is plotted based on the values of the AUC of thirteen machine learning models under three groups of input feature variables. According to Figure 2, the values of the AUC of the group with the emotional tone indicators of financial news are higher than the effects of the other two groups of input feature variables on each machine learning model. Moreover, according to the average value of the four evaluation indexes of the thirteen machine learning models, the prediction effect of the group of input feature variables with the emotional tone indicators of financial news is significantly better than those of the other two groups of input features.
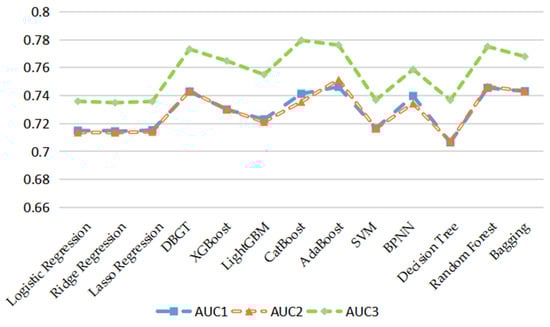
Figure 2.
AUC values of 13 machine learning models under three sets of input feature variables.
4.5.4. Comparative Analysis of the Effect of Financial Crisis Early Warning with the Emotional Tone of MD&A and Financial News
According to the rank of AUC, this paper selects five models with the best performance to compare the early warning effect. Based on the values of four evaluation indexes, Figure 3 is plotted, which shows in detail the early warning effect of the five models incorporated with the emotional tone of MD&A and financial news. AdaBoost-MD&A represents the early warning effect of the AdaBoost model based on traditional financial indicators and the emotional tone indicators of MD&A. AdaBoost-News represents the early warning effect of the AdaBoost model based on traditional financial indicators and the emotional tone indicators of financial news. The other four models also use the same rule of labeling. It can be seen from Figure 3 that the five models incorporating the emotional tone of financial news are more effective than the models incorporating the tone of MD&A in all four evaluation indexes. The average value of the AUC of the thirteen models considering the tone of financial news is 0.0277 higher than that of MD&A in terms of warning effect. It is also 0.0310 higher in terms of prediction accuracy, 0.0289 higher in non-ST listed company sample, and 0.0332 higher in ST listed company sample.
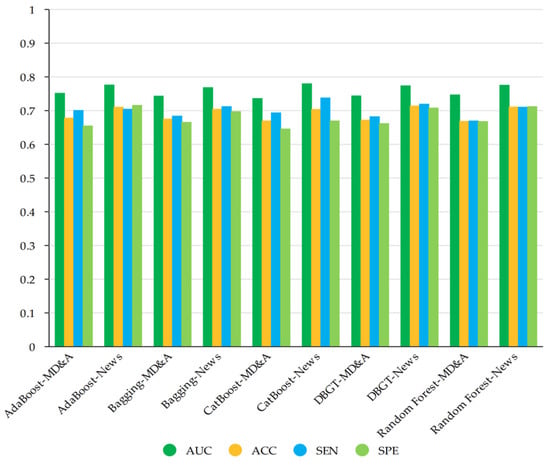
Figure 3.
Models warning effects based on different textual emotional tones.
4.5.5. Comparative Analysis of the Performance of Each Machine Learning Model for Sample Recognition
This paper uses the average value of the effect evaluation indexes of the thirteen machine learning models based on three different groups of input feature variables and ranks each effect evaluation index to compare and analyze the performance of each machine learning model for sample recognition. The specific results are shown in Table 7. There are seven models with AUC above the mean, six models with ACC above the mean, seven models with SEN above the mean and nine models with SPE above the mean. There are four models with all four groups of effect evaluation indexes exceeding the mean, namely DBGT, AdaBoost, random forest and Bagging. These four models also rank in the top five in terms of AUC and ACC, and both the rankings of SEN and SPE remain in the top positions with good and smooth forecasting results. In addition, the BPNN model, whose AUC ranks sixth, ranks first in terms of SPE. It means this model has the highest prediction accuracy for ST listed companies. The traditional logistic regression, ridge regression and Lasso regression models have poor performance in identifying samples. Decision tree models rank last in the value of AUC, ACC and SPE, but rank second for identifying non-ST listed companies. The purpose of early warning mainly lies in the identification of ST listed companies, so the decision tree model does not belong to the focus of this paper.
Table 7.
Mean values and ranking of early warning effect evaluation indicators of 13 machine learning models based on three different sets of input feature variables.
5. Further Discussion
According to the results of the empirical analysis, it can be found that the introduction of the emotional tone of the MD&A does not provide more incremental information for the identification of financial crises of listed companies. However, it brings a certain amount of noise, which leads to a slight decrease in the overall mean value of AUC, ACC, SEN, and SPE. This is in line with some literature findings that management can manipulate and modify texts to increase the positive level of the emotional tone, which can be very disruptive to the early warning effect [42,43,44]. It is clear that texts disclosed internally by firms are vulnerable to manipulation by management. This paper further investigates external texts that are difficult for companies to influence, such as financial news texts. The introduction of the emotional tone indicator of financial news to the machine learning model results in a better early warning effect than that of MD&A, which provides a new research idea for financial crisis early warning models from the perspective of feature engineering. On the early warning effects of thirteen machine learning models, DBGT, AdaBoost, random forest and Bagging all have good prediction performance on all three sets of input feature variables, providing an empirical basis for following research and applications.
6. Conclusions
Taking Chinese A-share listed companies as the sample and selecting data from 2012 to 2021, this paper uses a web crawler to obtain the MD&A section in annual reports of listed companies and uses textual analysis technology to quantify this section. Based on the emotional dictionary, this paper calculates the tone of the MD&A and calculates the emotional tone of the financial news by using structured data from the database of the Chinese Research Data Services Platform. The emotional tone of MD&A and the emotional tone of financial news are internal and external texts for listed companies, respectively. This paper further combines them with traditional financial indicators for comparing the early warning effect of financial crises in listed companies, and finally draws the following four conclusions: (1) The introduction of the emotional tone indicators of MD&A text has no significant effect on the improvement of the early warning effect financial crisis in listed companies and even brings some noise, which has a negative influence on the prediction effect of some models. (2) The introduction of the emotional tone indicators of financial news text can improve the early warning effect of financial crises of listed companies. It can be seen that the external text contains incremental information and can objectively reflect the operation and the future development trend of listed companies. (3) The emotional tone indicator of financial news text is not easily influenced by listed companies. However, the emotional tone indicators of MD&A are easily modified and manipulated by the management of listed companies. Adopting the tone of financial news text can exclude the interference of some modification information to the research results, and then improve the accuracy of financial crisis early warning. (4) Under three different sets of input feature variables, DBGT, AdaBoost, random forest and Bagging models still maintain stable and accurate sample recognition ability. The above four models can be used as relatively optimal classifiers for financial crisis early warning for listed companies.
There are still some limitations in this study, which are as follows: (1) There is no research on the early warning effect of linguistic features of texts other than emotional tone. (2) The establishment of a special comprehensive emotional dictionary of financial texts can be a research direction in the future. (3) There is a lack of research on other external texts, such as commentary texts, which represent the emotions of investors, and they may have an enhancing effect on the early warning effect of financial crises.
Owing to low credibility and financial falsification, traditional financial indicators may fail to truly reflect the development of listed companies. This paper focuses on non-financial indicators such as textual data, to quantify the internal and external texts of companies, finding that the emotional tone of financial news texts has an enhancing effect on the early warning effect of models based on traditional financial indicators. This finding will provide a useful supplement to the methods of crisis prediction relying solely on traditional financial indicators. It will also bring important theoretical and practical implications for the financial risk identification of listed companies.
Author Contributions
Conceptualization, H.N., Z.Z.; Methodology, H.N., Z.Z.; Writing—original draft preparation, Z.Z., M.L., Z.H.; Writing—review and editing, Z.Z., M.L., Z.H., H.N. All authors have read and agreed to the published version of the manuscript.
Funding
This research was supported by Beijing Foreign Studies University Double First Class Major Landmark Project (No. 2022SYLZD001) in China, the Fundamental Research Funds for the Central Universities (No. 2022JX031) in China, and Beijing Foreign Studies University G20 Research Center Project (No. G20ZX20223003) in China.
Institutional Review Board Statement
Not applicable.
Informed Consent Statement
Not applicable.
Data Availability Statement
Figure A1, Figure A2 and Figure A3 in Appendix A were generated by PyCharm, all other charts and diagrams in the text were exported by WPS Office. The data and code of this study can be downloaded by visiting https://github.com/zzs0216/applsci (accessed on 24 June 2022), or contact the author, email address: bfsuniuhy@163.com.
Conflicts of Interest
The authors declare no conflict of interest.
Appendix A
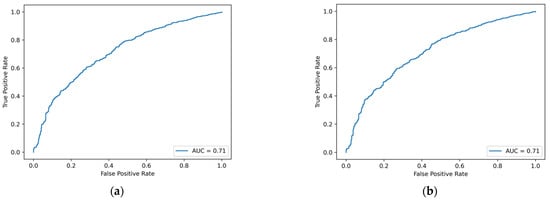
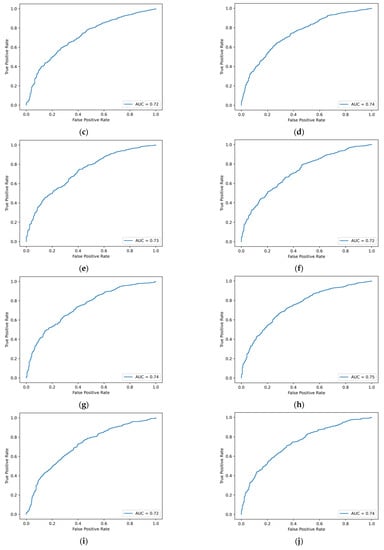

Figure A1.
ROC curve of machine learning model based on traditional financial indicators. (a) Logistic regression. (b) Ridge regression. (c) Lasso regression. (d) GBDT. (e) XGBoost. (f) LightGBM. (g) CatBoost. (h) AdaBoost. (i) SVM. (j) BPNN. (k) Decision tree. (l) Random forest. (m) Bagging.
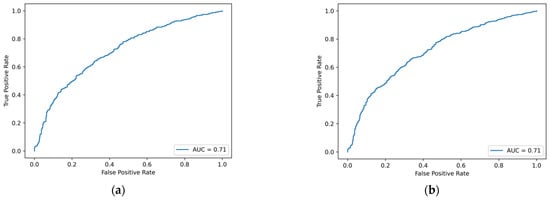
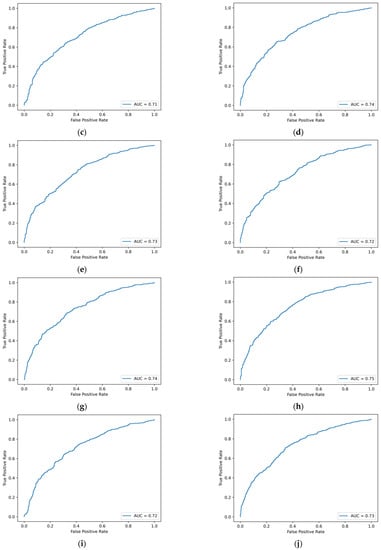
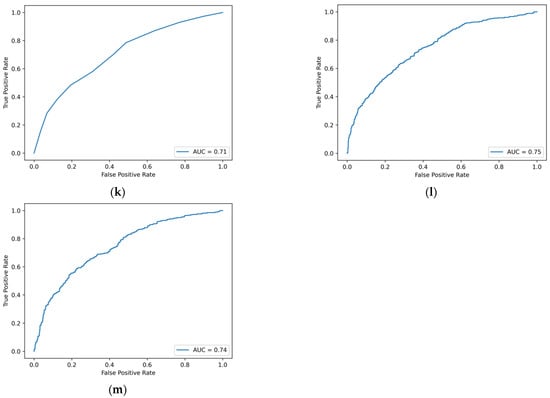
Figure A2.
ROC curve of machine learning model based on traditional financial indicators and MD&A emotional tone indicators. (a) Logistic regression. (b) Ridge regression. (c) Lasso regression. (d) GBDT. (e) XGBoost. (f) LightGBM. (g) CatBoost. (h) AdaBoost. (i) SVM. (j) BPNN. (k) Decision tree. (l) Random forest. (m) Bagging.
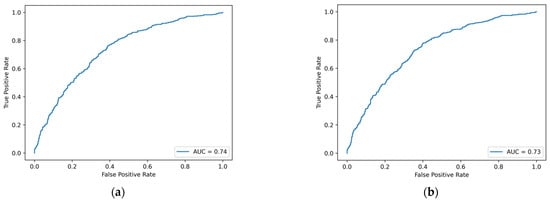
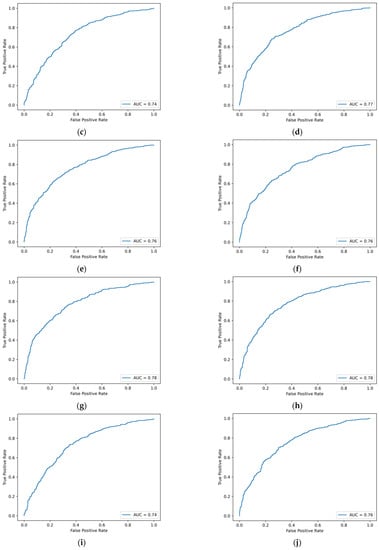
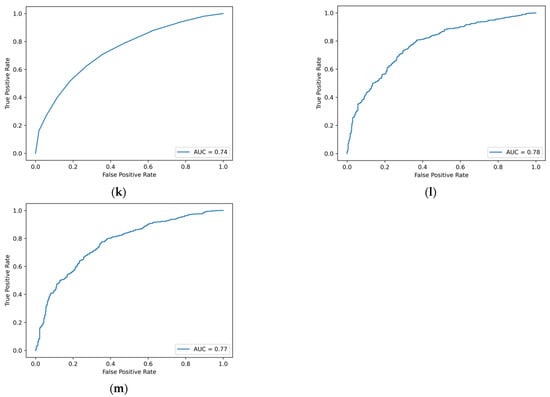
Figure A3.
ROC curve of machine learning model based on traditional financial indicators and financial news emotional tone indicators. (a) Logistic regression. (b) Ridge regression. (c) Lasso regression. (d) GBDT. (e) XGBoost. (f) LightGBM. (g) CatBoost. (h) AdaBoost. (i) SVM. (j) BPNN. (k) Decision tree. (l) Random forest. (m) Bagging.
References
- Beaver, W.H. Financial rations as predictors of failures. J. Account. Res. 1966, 4, 71–111. [Google Scholar] [CrossRef]
- Altman, E.I. Financial ratios, discriminant analysis and the prediction of corporate bankruptcy. J. Financ. 1968, 23, 589–609. [Google Scholar] [CrossRef]
- Chang, H.Y.; Ma, C.A. Financial flexibility, managerial efficiency and firm life cycle on firm performance: An empirical analysis of Chinese listed firms. J. Adv. Manag. Res. 2018, 16, 168–180. [Google Scholar] [CrossRef]
- Li, H.; Chen, Q.X.; Hong, L.Y.; Zhou, Q. Asset restructuring performance prediction for failure firms. J. Corp. Account. Financ. 2019, 30, 25–42. [Google Scholar] [CrossRef]
- Jing, J.; Leung, K.; Ng, J.; Zhang, J.J. Fixing the core, earnings management, and sustainable emergence from financial distress: Evidence from china’s special treatment system. J. Account. Audit. Financ. 2021, 36, 1–26. [Google Scholar] [CrossRef]
- Wang, R.; Ma, S.; Xu, X.; Song, P. Heterogeneous shareholders’ participation, COVID-19 impact, and innovation decisions of state-owned firms: Evidence from China. Sustainability 2021, 13, 4406. [Google Scholar] [CrossRef]
- Jiang, H.; Xia, J.; Devers, C.E.; Shen, W. Who will board a sinking ship? A firm–director interdependence perspective of mutual selection between declining firms and director candidates. Acad. Manag. J. 2021, 64, 901–925. [Google Scholar] [CrossRef]
- Shumway, T. Forecasting bankruptcy more accurately: A simple hazard model. J. Bus. 2001, 74, 101–124. [Google Scholar] [CrossRef] [Green Version]
- Beaver, W.H.; McNichols, M.F.; Rhie, J.W. Have financial statements become less informative? Evidence from the ability of financial ratios to predict bankruptcy. Rev. Account. Stud. 2005, 10, 93–122. [Google Scholar] [CrossRef]
- Woo, S.H.; Kwon, M.S.; Yuen, K.F. Financial determinants of credit risk in the logistics and shipping industries. Marit. Econ. Logist. 2021, 23, 268–290. [Google Scholar] [CrossRef]
- Cao, Y.; Shao, Y.; Zhang, H. Study on early warning of E-commerce enterprise financial risk based on deep learning algorithm. Electron. Commer. Res. 2022, 22, 21–36. [Google Scholar] [CrossRef]
- Balcaen, S.; Ooghe, H. 35 years of studies on business failure: An overview of the classic statistical methodologies and their related problems. Br. Account. Rev. 2006, 38, 63–93. [Google Scholar] [CrossRef]
- Charalambakis, E.C.; Garrett, I. On the prediction of financial distress in developed and emerging markets: Does the choice of accounting and market information matter? A comparison of UK and Indian firms. Rev. Quant. Financ. Account. 2016, 47, 1–28. [Google Scholar] [CrossRef]
- Canbas, S.; Cabuk, A.; Kilic, S.B. Prediction of commercial bank failure via multivariate statistical analysis of financial structures: The Turkish case. Eur. J. Oper. Res. 2005, 166, 528–546. [Google Scholar] [CrossRef]
- Cecchini, M.; Aytug, H.; Koehler, G.J.; Pathak, P. Making words work: Using financial text as a predictor of financial events. Decis. Support Syst. 2010, 50, 164–175. [Google Scholar] [CrossRef]
- Mayew, W.J.; Sethuraman, M.; Venkatachalam, M. MD&A disclosure and the firm’s ability to continue as a going concern. Account. Rev. 2015, 90, 1621–1651. [Google Scholar]
- Ertugrul, M.; Lei, J.; Qiu, J.; Wan, C. Annual report readability, tone ambiguity, and the cost of borrowing. J. Financ. Quant. Anal. 2017, 52, 811–836. [Google Scholar] [CrossRef] [Green Version]
- Iqbal, J.; Riaz, K. Predicting future financial performance of banks from management’s tone in the textual disclosures. Qual. Quant. 2021, 53, 1–31. [Google Scholar] [CrossRef]
- Kliestik, T.; Valaskova, K.; Lazaroiu, G.; Kovacova, M.; Vrbka, J. Remaining financially healthy and competitive: The role of financial predictors. J. Compet. 2020, 12, 74–92. [Google Scholar] [CrossRef]
- Bao, Y.; Ke, B.; Li, B.; Yu, Y.J.; Zhang, J. Detecting accounting fraud in publicly traded US firms using a machine learning approach. J. Account. Res. 2020, 58, 199–235. [Google Scholar] [CrossRef]
- Fitzpatrick, F.A. Comparison of ratios of successful industrial enterprises with those of failed Firm. Certif. Publ. Account. 1932, 6, 727–731. [Google Scholar]
- Altman, E.I.; Haldeman, R.G.; Narayanan, P. Zetatm analysis a new model to identify bankruptcy risk of corporations. J. Bank. Financ. 1977, 1, 29–54. [Google Scholar] [CrossRef]
- Ohlson, J.A. Financial ratios and the probabilistic prediction of bankruptcy. J. Account. Res. 1980, 18, 109–131. [Google Scholar] [CrossRef] [Green Version]
- Odom, M.D.; Sharda, R. A neural network model for bankruptcy prediction. In Proceedings of the 1990 IJCNN International Joint Conference on Neural Networks, San Diego, CA, USA, 17–21 July 1990. [Google Scholar]
- Breiman, L. Random forests. Mach. Learn. 2001, 45, 5–32. [Google Scholar] [CrossRef] [Green Version]
- Min, J.H.; Lee, Y.C. Bankruptcy prediction using support vector machine with optimal choice of kernel function parameters. Expert Syst. Appl. 2005, 28, 603–614. [Google Scholar] [CrossRef]
- Wang, G.; Wang, K.; Zhou, Y.; Mo, X. Establishment of a financial crisis early warning system for domestic listed companies based on three decision tree models. Math. Probl. Eng. 2020, 2020, 8036154. [Google Scholar] [CrossRef]
- Loughran, T.; McDonald, B. When is a liability not a liability? Textual analysis, dictionaries, and 10-Ks. J. Financ. 2011, 66, 35–65. [Google Scholar] [CrossRef]
- Price, S.M.K.; Doran, J.S.; Peterson, D.R.; Bliss, B.A. Earnings conference calls and stock returns: The incremental informativeness of textual tone. J. Bank. Financ. 2012, 36, 992–1011. [Google Scholar] [CrossRef]
- Davis, A.K.; Piger, J.M.; Sedor, L.M. Beyond the numbers: Measuring the information content of earnings press release language. Contemp. Account. Res. 2012, 29, 845–868. [Google Scholar] [CrossRef]
- Guay, W.; Samuels, D.; Taylor, D. Guiding through the fog: Financial statement complexity and voluntary disclosure. J. Account. Econ. 2016, 62, 234–269. [Google Scholar] [CrossRef]
- Li, S.; Wang, G.; Luo, Y. Tone of language, financial disclosure, and earnings management: A textual analysis of form 20-F. Financ. Innov. 2022, 8, 43. [Google Scholar] [CrossRef]
- Tetlock, P.C.; Saar-Tsechansky, M.; Macskassy, S. More than words: Quantifying language to measure firms’ fundamentals. J. Financ. 2008, 63, 1437–1467. [Google Scholar] [CrossRef]
- Berns, J.; Bick, P.; Flugum, R.; Houston, R. Do changes in MD&A section tone predict investment behavior? Financ. Rev. 2022, 57, 129–153. [Google Scholar]
- Tennyson, B.M.; Ingram, R.W.; Dugan, M.T. Assessing the information content of narrative disclosures in explaining bankruptcy. J. Bus. Finan. Account. 1990, 17, 391–410. [Google Scholar] [CrossRef]
- Li, F. The information content of forward-looking statements in corporate filings-a naive bayesian machine learning approach. J. Account. Res. 2010, 48, 1049–1102. [Google Scholar] [CrossRef]
- Kim, C.; Wang, K.; Zhang, L. Readability of 10-K reports and stock price crash risk. Contemp. Account. Res. 2019, 36, 1184–1216. [Google Scholar] [CrossRef]
- Huang, B.; Yao, X.; Luo, Y.; Li, J. Improving financial distress prediction using textual sentiment of annual reports. Ann. Oper. Res. 2022, 310, 1–28. [Google Scholar] [CrossRef]
- Brockman, P.; Cicon, J.E.; Li, X.; Price, S.M. Words versus deeds: Evidence from post-call manager trades. Financ. Manag. 2017, 46, 965–994. [Google Scholar] [CrossRef]
- Huang, X.; Teoh, S.H.; Zhang, Y. Tone management. Account. Rev. 2014, 89, 1083–1113. [Google Scholar] [CrossRef]
- Kang, T.; Park, D.H.; Han, I. Beyond the numbers: The effect of 10-K tone on firms’ performance predictions using text analytics. Telemat. Inform. 2018, 35, 370–381. [Google Scholar] [CrossRef]
- Mohseni, A.; Roodposhti, F.R. Financial performance and writing tone management in financial reporting. Empir. Res. Account. 2020, 9, 29–48. [Google Scholar]
- Rose, A.M.; Rose, J.M.; Suh, I.; Thibodeau, J.; Linke, K.; Norman, C.S. Why financial executives do bad things: The effects of the slippery slope and tone at the top on misreporting behavior. J. Bus. Ethics 2021, 174, 291–309. [Google Scholar] [CrossRef]
- Yang, F.; Huang, J.; Cai, Y. Tone of textual information in annual reports and regulatory inquiry letters: Data from China. Emerg. Mark. Financ. Trade 2022, 58, 417–427. [Google Scholar] [CrossRef]
- Vaferi, B.; Rahnama, Y.; Darvishi, P.; Toorani, A.; Lashkarbolooki, M. Phase equilibria modeling of binary systems containing ethanol using optimal feedforward neural network. J. Supercrit. Fluid. 2013, 84, 80–88. [Google Scholar] [CrossRef]
- Khalifeh, A.; Vaferi, B. Intelligent assessment of effect of aggregation on thermal conductivity of nanofluids—comparison by experimental data and empirical correlations. Thermochim. Acta 2019, 681, 178377. [Google Scholar] [CrossRef]
- Roshani, M.; Phan, G.; Roshani, G.H.; Hanus, R.; Nazemi, B.; Corniani, E.; Nazemi, E. Combination of X-ray tube and GMDH neural network as a nondestructive and potential technique for measuring characteristics of gas-oil–water three phase flows. Measurement 2021, 168, 108427. [Google Scholar] [CrossRef]
- Nasr, A.K.; Tavana, M.; Alavi, B.; Mina, H. A novel fuzzy multi-objective circular supplier selection and order allocation model for sustainable closed-loop supply chains. J. Clean. Prod. 2021, 287, 124994. [Google Scholar] [CrossRef]
- Karan, E.; Mansoob, V.K.; Khodabandelu, A.; Asgari, S.; Mohammadpour, A.; Asadi, S. Using Artificial Intelligence to Automate the Quantity Takeoff Process. In Proceedings of the International Conference on Software Business Engineering, Amsterdam, The Netherlands, 13–14 May 2021. [Google Scholar]
- Niu, H.; Zhang, Z.; Xiao, Y.; Luo, M.; Chen, Y. A Study of Carbon Emission Efficiency in Chinese Provinces Based on a Three-Stage SBM-Undesirable Model and an LSTM Model. Int. J. Environ. Res. Public Health 2022, 19, 5395. [Google Scholar] [CrossRef]
- Zhang, Z.; Xiao, Y.; Niu, H. DEA and Machine Learning for Performance Prediction. Mathematics 2022, 10, 1776. [Google Scholar] [CrossRef]
- Vapnik, V.N. The Nature of Statistical Learning Theory; Springer: New York, NY, USA, 1995; pp. 273–297. [Google Scholar]
- Rumelhart, D.E.; Hinton, G.E.; Williams, R.J. Learning representations by back-propagating errors. Nature 1986, 323, 533–536. [Google Scholar] [CrossRef]
- Quinlan, J.R. Introduction of decision trees. Mach. Learn. 1986, 1, 84–100. [Google Scholar] [CrossRef] [Green Version]
- Quinlan, J.R. C4.5: Programs for Machine Learning; Morgan Kaufmann Publishers Inc.: San Francisco, CA, USA, 1993; pp. 17–42. [Google Scholar]
- Breiman, L.I.; Friedman, J.H.; Olshen, R.A.; Stone, C. Classification and regression trees (CART). Biometrics 1984, 40, 358–361. [Google Scholar]
- Friedman, J.H. Greedy function approximation: A gradient boosting machine. Ann. Stat. 2001, 29, 1189–1232. [Google Scholar] [CrossRef]
- Freund, Y.; Schapire, R.E. A decision-theoretic generalization of on-line learning and an application to boosting. J. Comput. Syst. Sci. 1997, 55, 119–139. [Google Scholar] [CrossRef] [Green Version]
- Loughran, T.; McDonald, B. Measuring readability in financial disclosures. J. Financ. 2014, 69, 1643–1671. [Google Scholar] [CrossRef]
- Davis, A.K.; Ge, W.; Matsumoto, D.; Zhang, J.L. The effect of manager-specific optimism on the tone of earnings conference calls. Rev. Account. Stud. 2015, 20, 639–673. [Google Scholar] [CrossRef]
- Henry, E. Are investors influenced by how earnings press releases are written? J. Bus. Commun. 2008, 45, 363–407. [Google Scholar] [CrossRef]
- Henry, E.; Leone, A.J. Measuring qualitative information in capital markets research: Comparison of alternative methodologies to measure disclosure tone. Account. Rev. 2016, 91, 153–178. [Google Scholar] [CrossRef]
- Brockman, P.; Rui, O.M.; Zou, H. Institutions and the performance of politically connected M&As. J. Int. Bus. Stud. 2013, 44, 833–852. [Google Scholar]
- Bicudo de Castro, V.; Gul, F.A.; Muttakin, M.B.; Mihret, D.G. Optimistic tone and audit fees: Some Australian evidence. Int. J. Audit. 2019, 23, 352–364. [Google Scholar] [CrossRef]
- Barakat, A.; Ashby, S.; Fenn, P.; Bryce, C. Operational risk and reputation in financial institutions: Does media tone make a difference? J. Bank Financ. 2019, 98, 1–24. [Google Scholar] [CrossRef]
- Mousa, G.A.; Elamir, E.A.H.; Hussainey, K. Using machine learning methods to predict financial performance: Does disclosure tone matter? Int. J. Disclosure Gov. 2022, 19, 93–112. [Google Scholar] [CrossRef]
- Akkasi, A.; Varoglu, E. Improvement of chemical named entity recognition through sentence-based random under-sampling and classifier combination. J. AI Data Min. 2019, 7, 311–319. [Google Scholar]
- Sun, L.; Wu, Y.; Shu, B.; Ding, X.; Cai, C.; Huang, Y.; Paisley, J. A dual-domain deep lattice network for rapid MRI reconstruction. Neurocomputing 2020, 397, 94–107. [Google Scholar] [CrossRef]
- Liu, S.; You, S.; Lin, Z.; Zeng, C.; Li, H.; Wang, W.; Liu, Y. Data-driven event identification in the US power systems based on 2D-OLPP and RUS Boosted trees. IEEE Trans. Power Syst. 2021, 37, 94–105. [Google Scholar] [CrossRef]
Publisher’s Note: MDPI stays neutral with regard to jurisdictional claims in published maps and institutional affiliations. |
© 2022 by the authors. Licensee MDPI, Basel, Switzerland. This article is an open access article distributed under the terms and conditions of the Creative Commons Attribution (CC BY) license (https://creativecommons.org/licenses/by/4.0/).